Sustainable Human Resource Management and Generational Diversity: The Importance of the Age Management Pillars - MDPI
←
→
Page content transcription
If your browser does not render page correctly, please read the page content below
sustainability

Article
Sustainable Human Resource Management and Generational
Diversity: The Importance of the Age Management Pillars
Natália Vraňaková *, Zdenka Gyurák Babel’ová                        and Andrea Chlpeková

                                          Institute of Industrial Engineering and Management, Faculty of Materials Science and Technology in Trnava,
                                          Slovak University of Technology in Bratislava, Jána Bottu č. 2781/25, 917 24 Trnava, Slovakia;
                                          zdenka.babelova@stuba.sk (Z.G.B.); andrea.chlpekova@stuba.sk (A.C.)
                                          * Correspondence: natalia.vranakova@stuba.sk

                                          Abstract: The issue of population aging is currently highly topical. In the context of population
                                          aging, age management comes to the fore. It addresses the management of human resources with
                                          regard to the age and potential of employees. The main aim of the article is to present the results of
                                          research focused on the importance of age management pillars from the perspective of employees
                                          from different generational groups in industrial enterprises in Slovakia. Based on established research
                                          questions and the research hypothesis, we can state that the perceived importance of age management
                                          pillars differs depending on the affiliation to the generational group. The research hypothesis was
                                          confirmed, and we conclude that there is a dependence between generational groups of employees
                                          from industrial enterprises in Slovakia and the importance of the age management pillars (the number
                                          of designations in a pairwise comparison). As a data collection tool, a research questionnaire was
                                          created. Collected data were evaluated based on a pairwise comparison of the perceived importance

                                   of age management pillars for employees. The research sample consisted of N = 384 respondents
Citation: Vraňaková, N.; Gyurák
                                          (employees of large industrial enterprises in Slovakia). When considering the research results, the
Babel’ová, Z.; Chlpeková, A.              use allows approaching the management of different generations of employees directly within the
Sustainable Human Resource                framework of sustainable human resource management. The research problem is also supported by
Management and Generational               resources and theoretical background.
Diversity: The Importance of the Age
Management Pillars. Sustainability        Keywords: age management; generational diversity; industrial enterprises employees; sustainable
2021, 13, 8496. https://doi.org/          human resource management
10.3390/su13158496

Academic Editor: Francisco J. Gracia

                                          1. Introduction
Received: 30 May 2021
Accepted: 27 July 2021
                                                Diversity of employees is not a new issue among industrial enterprises [1]. Diversity
Published: 29 July 2021
                                          means differences that are more visible such as gender, age and ethnicity, or differences
                                          that are less visible, for example, job experiences or educational attainment [2–6]. Many
Publisher’s Note: MDPI stays neutral
                                          authors have addressed the issue of diversity, and their research has shown that diversity
with regard to jurisdictional claims in
                                          can have a positive effect (e.g., better communication, respect, creative thinking, better
published maps and institutional affil-   cooperation), but other research has shown a negative effect of employee diversity in the
iations.                                  company (conflicts, disrespect, deepening stereotypes) [7–16].
                                                One of the ways to manage the differences arising from the employees themselves
                                          is to implement and use the principles of sustainable human resource management. Sus-
                                          tainability in the context of human resource management is understood in two ways.
Copyright: © 2021 by the authors.
                                          One is employee management to support the implementation of a sustainable strategy
Licensee MDPI, Basel, Switzerland.
                                          and sustainable development. This understanding is emphasizing the role of human re-
This article is an open access article
                                          source management in developing (economically, socially and ecologically) sustainable
distributed under the terms and           organizations [17]. The second way is sustainable work and performing human resource
conditions of the Creative Commons        management sustainably, which we understand as sustainable human resource manage-
Attribution (CC BY) license (https://     ment. Sustainable human resource management leads to performing human resource
creativecommons.org/licenses/by/          management and utilization of human resource management tools in a way that ensures
4.0/).                                    a sustainable performance of an organization [18]. The main focus of sustainable human

Sustainability 2021, 13, 8496. https://doi.org/10.3390/su13158496                                      https://www.mdpi.com/journal/sustainability
Sustainability 2021, 13, 8496 2 of 18
resource management concerns the relationship between people management policies and
practices [19,20]. Among the policies and practices that can be included are: same opportu-
nities for employees, lifelong learning, career management, democracy in the workplace,
employees’ participation, the right to equality and non-discrimination treatment [19,21,22].
Additionally, sustainable human resource management focuses on the importance of peo-
ple, and human resources are considered as the strategic value for every enterprise [23,24].
Characteristics of sustainable human resources management were defined as follows: long-
term orientation, employee care, environmental care, profitability, employee participation
and social dialog, development of employees, partnership, flexibility, compliance with
labor regulations, employee collaboration, fairness and equality [25]. Equality can be
known from various points of view, but it is most often associated with age equality and
gender equality [26]. Sustainable human resource management enables the management
of organizations to use the potential of employees of all ages through the application of age
management. By respecting their age, which brings different levels of skills, knowledge,
experience or different life periods, age management makes it easier to use the strengths
and potential of each generation. As stated by Čambál et al., for the development of
organizations and their employees, it will be important to help the managers to understand
that each generation has specific skills that contribute to increasing the performance of
the organization (or to increasing the performance of employees of other generations) [27].
Age management takes into account not only the age but also the needs of employees with
respect to their age and allows managers to manage employee performance, compared to
traditional human resource management, in the long term, which means sustainably with
no or minimal negative impact on the health or well-being of the employees. Besides all,
as stated by Chromjaková, the approach to human resource management can make the
difference between success and failure [28]. What is more, the need to implement changes
in the field of human resource management is not only a challenge but also a condition for
the future competitiveness of the organization [29].
The functioning of human resource management is essential for the success of a
company. It is important that the human resource management systems are developed and
perform in such a way that the organization is able to face strategic challenges and manage
social and human resources in organizations sustainably. One of the major challenges for
management in organizations in Central Europe is population trends and the growing age
diversity of the workforce. The change in the age structure of employees in Slovakia may
also be affected in the future by the fact that 2018 was the first year when the proportion
of seniors (65 years+) was higher than the proportion of children (up to 14 years). The
Slovak Republic recorded 102 seniors per 100 children [30]. Due to the current demographic
situation (in the 20 years of the twenty-first century), on the one hand, we are facing an
aging workforce, and the shortage of young labor on the other hand [31]; the concept
of age management plays an important role. Age management is currently becoming
a tool that provides a solution to the current negative trend of the demographic curve.
It is a management that emphasizes the age, abilities and potential of employees. It
also takes into account age factors that affect employees in the process of daily activities
(planning and organizing work, work environment). Age management uses a variety
of methods that focus on the effective use of human capital [32–37]. Age management
is often defined as management that emphasizes the age of employees and aims at an
overall approach to addressing the demographic situation and demographic change in the
workplace. However, this concept must not be understood only in the context of the aging
trend of society: basically, it is a concept that applies to all age groups and generational
groups of employees [38–44].
Among the first, the eight dimensions of age management were defined, which in-
cluded: job recruitment; learning, training and lifelong learning; career development;
flexible working time practices; health protection and promotion and workplace de-
sign; redeployment; employment exit and the transition to retirement; comprehensive
approaches [45]. Eight pillars were also defined, which make up the concept of age man-Sustainability 2021, 13, 8496 3 of 18
agement and also form the framework of the whole concept [46]. The pillars complement
each other, and each contains a tool to achieve its fulfillment [47–51].
• Pillar 1—Knowledge of age issue: managers in the enterprise are aware of issues
associated with the future as well as the future workforce, such as the aging of
employees, early retirement and lack of young labor (the age of employees does not
decide the process of selecting employees).
• Pillar 2—Accommodating attitude towards aging—managers have a positive attitude
towards aging employees as well as towards their knowledge and experience, which
they can use for mutual benefit (intergenerational cooperation is also an important
part).
• Pillar 3—Management that understands individuality and differences—managers are
aware of their responsibility in the process of individual approach to employees from
all age categories and different generations.
• Pillar 4—Quality and functional measures of age management—equality of all em-
ployees in all areas is becoming increasingly important in the enterprise (the need for
lifelong learning, regardless of the age of employees, is also an important area). The
age strategy thus becomes part of the personal plans of employees and the enterprise’s
policy.
• Pillar 5—Ensuring good work ability and motivation—the result of the growth of work
ability (ensuring a quality working environment) and motivation is the cooperation of
employees and their will to work in the enterprise until retirement.
• Pillar 6—High level of competencies—managers are aware of the importance of the
concept and encourage employees to the concept of shared knowledge, and they also
ensure the transfer of experiences from older employees to younger ones.
• Pillar 7—Quality work organization—the organization of work, as well as working
hours, corresponds to the needs of employees of different ages (work management at
the initiative of employees).
• Pillar 8—Satisfied life—recognition, well-being and quality of life have significantly
improved, and employees are retiring with dignity (care for employees´ occupational
health is an important part).
As is clear from the above findings, it is currently very necessary to address the
issue of sustainable human resource management and the resulting age management,
which is focused on different age categories of employees and different generations of
employees. Currently, there are four different generational groups in the work environment,
which represents significant generational diversity. Each generational group of employees
prioritizes different values, manifests different attitudes, work behaviors or motivational
preferences at work [52]. Each generational group is different, and therefore, it is necessary
to recognize their most important characteristics. The oldest generation group in the work
environment is the Baby Boomer generation, born between 1940 and 1960 [53]. Success
and personal career development is very important for this generation [54]. A typical
feature is a high work commitment; they are self-confident [55] and focused mainly on
success and career [56]. Lifelong learning is very important for them [57]. Members of this
generational group expect that others will naturally respect their experience, which they
bring to the teamwork and also to the performance of work duties [58]. These employees
have a very good work ethic; they live for a job in which they respect the hierarchy and
authority [59]. The employment rate compared to other generations of this generational
group has a significantly growing trend in Slovakia [60]. The increasing share of older
workers in the labor market is due to the aging population and the extension of the
retirement age. Additionally, Baby Boomers are a very strong generation with a large
number of representatives. The next generation is Generation X, born between 1961 and
1980 [61]. This generation places great emphasis on work–life balance [62]. They were the
first generation to encounter modern technology and computer work [63]. Generation X is
creative, enthusiastic and likes to work in a team [64]. The second youngest generation is
Generation Y, born between 1981 and 1995 [65]. This generation is ambitious and has a goodSustainability 2021, 13, 8496 4 of 18
command of foreign languages, and is performance-oriented [66]. They love technology;
they often use it at work and beyond [67]. Generation Y members expect quick feedback
from their superiors and reward for what they have achieved. They expect their superiors
to listen to their ideas. These employees are very computer-savvy, able to communicate
quickly and obtain important information [68]. The most preferred style of communication
is through electronic communication, text messaging and social media [69]. The results
of research of knowledge continuity showed that using information technologies will
become increasingly important, including in the field of human resources management [70].
What is interesting for generation Z members is that they have no problem arguing if
something is bothering them [68]. Similar to Generation X, personal life is also important
for Generation Y [71]. The youngest generation group that we can currently meet on the
labor market is Generation Z, born between 1996 and 2009 [72]. The youngest generation
cannot imagine life without new and modern technologies [73]. They are characterized
by frequent changes in workplaces and are independent [74]. They like multi-tasking
and have good communication skills [75]. Self-realization, achievement and identity are
important for Generation Z, but work is also highly represented in their values [76]. Due to
their age, this generation is still gaining ground in the labor market. Some representatives
of this generation have already started their working careers, but the younger years are
still being prepared at school.
Given the age diversity of the workforce, it is important that managers deal with
employees of all ages. As research supports, the atmosphere in which they work and the
team they are part of is important to everyone, whether they are older or younger. Therefore,
it is an important task for superiors to provide employees with working conditions that
will be motivating for all generations [77].
Based on the above theoretical knowledge, we created a model of age management
focused on individual generational groups and the interconnection of its individual pillars;
it is shown in Figure 1.
From Figure 1, the application of the age management concept in sustainable human
resource management can be seen. The goal of age management is the sustainable man-
agement of human resources, which is focused on age diversity and thus on employees
of different generations. The skeleton of age management is composed of eight pillars
(aspects). As four generational groups are currently in the workplace, it is very impor-
tant to approach this issue sensitively and with regard to different needs that arise from
generational diversity.
The main aim of the research was to identify the importance of age management
pillars from the perspective of employees from different generational groups in industrial
enterprises in Slovakia.
Research questions (RQ): the authors identified two research questions based on
theoretical knowledge and the need to identify which pillars of age management were
identified by employees of different generations as the most important and which pillars
of age management were identified as the least important.
RQ1: What pillars of age management did the employees of each generation group in
large industrial enterprises in Slovakia identify as the most important?
RQ2: What pillars of age management did the employees of each generation group in
large industrial enterprises in Slovakia identify as the least important?
Research hypothesis (RH): based on the set main aim of the research and the research
questions, the authors have specified a research hypothesis
RH: There is a dependency between generational groups of employees in indus-
trial enterprises in Slovakia and the importance of age management pillars (number of
designations in pairwise comparison).Sustainability 2021, 13, x FOR PEER REVIEW 5 of 19
Sustainability 2021, 13,
Sustainability 2021, 13, 8496
x FOR PEER REVIEW 55 of
of 18
19
Figure 1. Model of interconnection of individual aspects (source: own elaboration, 2021).
Figure 1. Model of interconnection of individual aspects (source: own elaboration, 2021).
2.2.Materials
MaterialsandandMethods
Methods
2. Materials and Methods
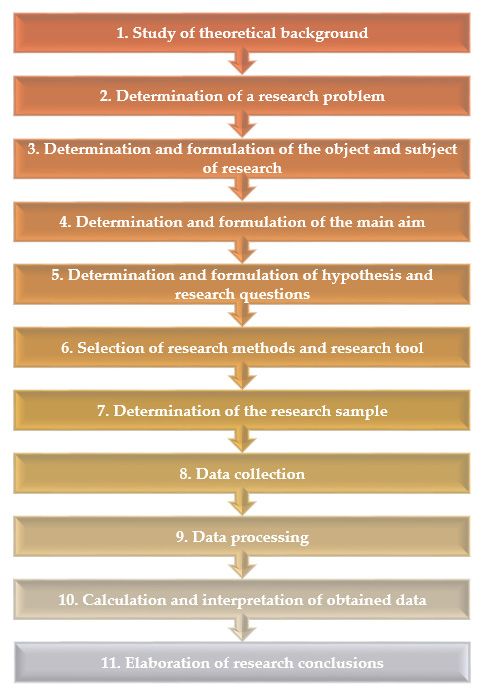
Figure
Figure 22 contains
containsthe
thesequence
sequenceof
ofsteps
stepsas
aswe
weproceeded
proceededin
inthe
theresearch
research and
and creation
creation
of theFigure 2
article. contains the sequence of steps as we proceeded in the research and creation
of the
of the article.
article.
Researchsteps
Figure2.2.Research
Figure steps(source:
(source:own
ownelaboration,
elaboration,2020).
2020).
Figure 2. Research steps (source: own elaboration, 2020).Sustainability 2021, 13, 8496 6 of 18
In order to carry out the research, the theoretical background from the relevant
domestic and foreign literature was studied. The first step was to collect and sort the
appropriate information, then their study and processing. An important part of this step
was the selection of appropriate sources of information. These are mainly domestic and
foreign literature, studies and research, articles from scientific conferences and journals
published in scientific databases. Subsequently, we set and formulated the main aim. The
next step was to determine and formulate the object and subject of research, the research
problem and an important part was the determination and formulation of hypotheses
and research questions. The research tool was a questionnaire designed for employees
of large industrial enterprises in Slovakia. The aim was to identify the importance of the
age management pillars from the perspective of employees from different generations.
The next step was to determine the sample and collect the data. The collected data were
processed using available software tools. The hypothesis was tested using chi-square. The
obtained data were later necessary to interpret and process the conclusions that result from
the research.
The population size consists of employees from large industrial enterprises. Based
on the data [78], we divided large companies into categories according to the number of
employees (250–499; 500–999; 1000–1999; 2000–2999; 3000–3999; 4000–4999; 5000–9999;
10,000–19,999). The number of enterprises that formed the population size is shown in
Table 1.
Table 1. Number of industrial enterprises by number of employees (source: own elaboration, 2020).
Sectors/Number of Estimated
250– 500– 1000– 2000– 3000– 4000– 5000– 10,000–
Enterprises by Number Number of
499 999 1999 2999 3999 4999 9999 19,999
of Employees Employees
Automotive industry 29 21 13 4 3 0 0 1 81,625
Transport and logistics 49 12 4 2 0 0 2 2 83,375
Electrical engineering 24 18 6 3 0 0 0 0 39,000
Energy and mining 7 6 6 2 2 0 0 0 28,125
Chemistry and plastics 25 11 2 2 1 0 0 0 29,125
Information technologies 14 8 0 0 1 0 0 0 14,750
Metal production and
20 8 2 0 1 0 1 0 27,500
metallurgy
Agriculture and forestry 2 1 0 0 1 0 0 0 5000
Food industry 17 7 2 0 0 0 0 0 14,625
Design and engineering 2 4 0 0 0 0 0 0 3750
Construction 18 8 1 0 0 0 0 0 14,250
Machine industry 30 9 5 1 0 1 1 0 40,000
Production—other 5 4 1 0 0 0 0 0 6375
Development and testing 5 1 0 0 0 0 0 0 2625
Sum 247 118 42 14 9 1 4 3 390,125
Based on Table 1, which contains the number of enterprises by the number of employ-
ees, we calculated the estimated number of employees. We proceeded by choosing a mean
value from each interval of the number of employees and multiplying the mean value by
the number of enterprises. Based on the calculated estimated number of employees, the
population size is 390125. Subsequently, it is necessary to proceed with the sample size [79].
p ∗ (1 − p ) 0.5 × (1 − 0.5)
n= p∗(1− p)
= 0.5×(1−0.5)
= 379.76 = 380 (1)
E2 0.052
Z2
+ N 1.962
+ 390,125
where n = sample size; p = the proportion of occurrence of the examined trait in the popu-
lation size (p = 0.5); maximum estimation error (E = 5%); Z = quantile of the distribution
function of the normalized normal distribution (E = 5%; then (1 − p) = 95%); N = population
size (N = 390,125).Sustainability 2021, 13, 8496 7 of 18
Subsequently, we proceeded to verify the calculation of the sample using the table,
according to which at population size 1,000,000 belongs a sample size of 384 [80].
In order to achieve relevant results from the questionnaire survey, it was necessary
to obtain 380 completed questionnaires based on the calculation, and on the basis of
tabular verification, it was necessary to obtain 384 questionnaires from employees of large
industrial enterprises. A questionnaire was used as a collection tool, which was distributed
to large industrial companies in Slovakia. A total of 500 questionnaires were distributed.
In total, 391 questionnaires were returned and correctly filled in, which represents a 78%
return.
2.1. Description of the Research Sample
The research sample consisted of employees in various job positions in large industrial
enterprises in Slovakia. The questionnaire was distributed randomly. Table 2 lists the
distribution of respondents by generational group and industry.
Table 2. Respondents by generational group and industry (source: own elaboration, 2020).
Sectors/Number of
Relative
Enterprises by Baby Generation Generation Generation Absolute Cumulated
Frequency
Number of Boomers X Y Z Frequency Frequency
(%)
Employees
Automotive industry 11 54 48 10 123 31.46 123
Transport and logistics 0 8 5 1 14 3.58 137
Electrical engineering 4 8 7 3 22 5.63 159
Energy and mining 0 0 2 1 3 0.77 162
Chemistry and plastics 2 6 5 1 14 3.58 176
Information
0 3 6 0 9 2.30 185
technologies
Metal production and
2 11 7 1 21 5.37 206
metallurgy
Agriculture and
0 2 1 1 4 1.02 210
forestry
Food industry 0 4 9 0 13 3.32 223
Construction 0 17 6 1 24 6.14 247
Machine industry 10 50 55 5 120 30.69 367
Production—other 4 8 5 1 18 4.60 385
Development and
0 4 0 2 6 1.53 391
testing
Sum 33 175 156 27 391 100 -
As can be seen from the data in Table 2, the largest proportion of respondents is from
the automotive industry, electrical engineering, construction and machine industry. Addi-
tionally, we can state that the employees from Generation X had the largest representation
in the questionnaire survey (44.76%). This is followed by Generation Y, whose respondents
make up 39.90% of the research sample; 8.44% of respondents are employees from the
oldest generation group, Baby Boomers. The youngest generation group makes up 6.91%
of all respondents, so we can say that Generation Z is the least-represented group of the
questionnaire survey.
In Slovakia, 6.44% of current employees are from the Baby Boomers generation,
50.56% from Generation X, 37.40% from Generation Y and 5.60% from Generation Y [81].
Additionally, on the basis of these data, we can confirm that the sample of respondents is
very similar to the current composition of the workforce in terms of individual generational
groups.
In terms of the gender of respondents, 48.85% of men and 51.15% of women par-
ticipated in the questionnaire survey. According to the educational structure, 31.46% of
respondents have completed high school with graduation, 3.32% high school withoutSustainability 2021, 13, 8496 8 of 18
graduation, 17.39% have completed a university bachelor’s degree, 42.97% a university
master’s degree and 4.86% a university doctorate degree.
The questionnaire was distributed to large industrial enterprises in Slovakia at random,
regardless of specific generational groups or job positions; this fact is also reflected in
Table 3.
Table 3. Job classification of questionnaire survey respondents (source: own elaboration, 2020).
Relative Frequency Cumulated
Job Position Absolute Frequency
(%) Frequency
Production employees 77 19.69 77
Administrative employees 202 51.66 279
Management position 112 28.64 391
Sum 391 100 -
The questionnaire survey involved 51.66% of administrative employees (positions
such as specialists, technical and economic staff, buyers, etc.). This is followed by employees
in management positions (managers), who make up 28.64%. The smallest group was
production employees (operators, maintenance employees, warehouse operators) who
make up 19.69% of the entire sample of respondents. The fact that the questionnaire survey
was attended by employees of all types of positions can be considered as positive, because
we have obtained data and insights into the issue from employees at various levels of
management and job positions.
2.2. Pairwise Comparison of the Importance of Age Management Pillars
Method of paired comparisons, or Fuller’s method, allows to assemble the weight of
individual criteria. The principle of the Fuller method is based on the mutual comparison
of two criteria, where the more important criterion is always selected from the pair. Two
criteria are compared with each other by the total number of the criteria. The criteria are
then ranked in order of importance, based on the weight of the criterion (the higher the
weight of the criterion, the more significant the criterion) [82].
The designation ni is a symbol for the number of marked i, and thus expresses how
many times the criterion given in the line was more significant than the other criteria. Sum
ni denotes N. As pairwise comparison was not performed by only one person, and in
order to ensure the correct methodological procedure, we multiplied the total number of
comparisons N by the appropriate number of respondents. Subsequently, the weights (vi )
are calculated based on the relationship [82]:
ni
vi = (2)
N
The criteria are then ranked according to importance, based on the weight of the
criterion (the higher the weight of the criterion, the more significant the criterion).
In our case, pairwise comparison was performed for areas of age management and
is evaluated according to individual generation groups in order to identify differences in
the perception of individual areas depending on the affiliation to the generation group.
Respondents (employees from large industrial enterprises in Slovakia) therefore compared
all areas of age management in pairs and marked the number of the area in the table, which
in their opinion is more important. The number in the row indicates how many times the
area in the row was marked as more important compared to the area in the column. Each
area captured its content and was the most typical for one of the age management pillars.
Based on the weight of individual criteria, we were able to rank the importance of the age
management pillar for individual generation groups. In the following table, we can see the
evaluation of the pairwise comparison for the generational group Baby Boomers.
Various methods were used to evaluate the collected data. Analysis, synthesis, induc-
tion, deduction, comparison and concretization were used in all parts of the article. TheSustainability 2021, 13, 8496 9 of 18
collected data were processed using available software tools. To evaluate the hypothesis,
we used chi-square.
3. Results
Based on the data in Table 4, we can see the weights of the importance of the age
management areas. The first column contains the consecutive number and name of the
age management pillars. The first line contains only the consecutive number of the pillar.
Subsequently, the numbers in the rows represent the value of how many times the pillar in
the row was marked as more important compared to the pillar in the column.
Table 4. Pairwise comparison—Baby Boomers (source: own elaboration, 2020).
1. 2. 3. 4. 5. 6. 7. 8. ni vi
1. The age of employees does not decide
16 10 10 9 8 11 16 80 0.087
the process of selecting employees
2. Intergenerational cooperation 17 15 10 11 11 15 15 94 0.102
3. Manager has an individual approach to
23 18 11 15 8 18 16 109 0.118
employees
4. Lifelong learning 23 23 22 14 16 17 20 135 0.146
5. Quality working environment 24 22 18 19 12 13 14 122 0.132
6. Transfer of experience from older
25 22 25 17 21 14 15 139 0.150
employees to younger ones
7. Work management at the initiative of
22 18 15 16 20 19 13 123 0.133
employees
8. Care for employees’ occupational health 17 18 17 13 19 18 20 122 0.132
Sum 924 1
The number of respondents who performed pairwise comparisons from the Baby
Boomers generation was 33. Based on the data in Table 4, we can see the weights of
the importance of the age management areas. The most important area for the Baby
Boomers generation is the area of “Transfer of experience from older employees to younger
ones”, which corresponds to the sixth age management pillar (High level of competencies).
Subsequently, the second most important can be considered the area of “Lifelong learning”,
which is a typical area for the fourth pillar, called “Quality and functional measures of
age management”. The three areas with the lowest values of significance are the same
for all four generational groups. The third lowest value of significance was achieved by
the area “Manager has an individual approach to employees”, which characterizes the
pillar “Management that understands individuality and difference”. This is followed by
the area of “Intergenerational cooperation”, the “Accommodating attitude towards aging”
pillar. The lowest value of significance was reached by the area “The age of employees
does not decide the process of selecting employees”, which is a typical area for the first age
management pillar, called “Knowledge of age issues”. In Table 5, we can see the pairwise
comparison for generational group X.Sustainability 2021, 13, 8496 10 of 18
Table 5. Pairwise comparison—Generation X (source: own elaboration, 2020).
1. 2. 3. 4. 5. 6. 7. 8. ni vi
1. The age of employees does not decide
72 60 55 45 62 72 43 409 0.083
the process of selecting employees
2. Intergenerational cooperation 103 67 56 50 67 81 54 478 0.098
3. Manager has an individual approach to
115 108 61 61 61 42 62 46 495 0.101
employees
4. Lifelong learning 120 119 114 47 70 58 40 568 0.116
5. Quality working environment 130 125 114 128 78 86 66 727 0.148
6. Transfer of experience from older
113 108 133 105 97 57 51 664 0.136
employees to younger ones
7. Work management at the initiative of
103 94 113 117 89 118 36 670 0.137
employees
8. Care for employees’ occupational health 132 121 129 135 109 124 139 889 0.181
Sum 4900 1
The total number of respondents from Generation X was 175. Based on the calculation
of the weights of the compared criteria (areas) listed in Table 5, we can conclude that
for Generation X is the most important area “Care for employees’ occupational health”
characterizing the last age management pillar “Satisfied life”. Consequently, the second
most important area can be considered “Quality working environment”, typical of the fifth
pillar called “Ensuring good work ability and motivation”. The third most important area
can be described as “Work management at the initiative of employees”, which describes
the seventh age management pillar, “Quality work organization”. The areas with the
three lowest weights of importance are the same as for the Baby Boomers generational
group. Table 6 contains a pairwise comparison according to the preferences of generational
group Y.
Table 6. Pairwise comparison—Generation Y (source: own elaboration, 2020).
1. 2. 3. 4. 5. 6. 7. 8. ni vi
1. The age of employees does not decide
53 46 37 31 38 54 40 299 0.068
the process of selecting employees
2. Intergenerational cooperation 103 66 67 35 53 67 43 434 0.099
3. Manager has an individual approach to
110 90 60 47 48 67 57 479 0.110
employees
4. Lifelong learning 119 89 96 48 57 74 53 536 0.123
5. Quality working environment 125 121 109 109 96 107 79 745 0.171
6. Transfer of experience from older
118 103 108 99 60 88 64 640 0.147
employees to younger ones
7. Work management at the initiative of
102 89 89 82 49 68 53 532 0.122
employees
8. Care for employees’ occupational health 116 113 99 103 77 92 103 703 0.161
Sum 4368 1
The number of respondents who participated in the questionnaire survey from Gener-
ation Y was 156. According to the answers, which are processed in Table 6, it is clear that
the most important area for Generation Y is “Quality working environment”, which content
captures the fifth age management pillar, “Ensuring good work ability and motivation”.
The second most important area is “Care for employees’ occupational health” under the
“Satisfied life” pillar. The third most important area is the “Transfer of experience from
older employees to younger ones”, which includes the sixth age management pillar, “High
level of competencies”. The last pairwise comparison was performed by the youngest
generational group Z, shown in Table 7.Sustainability 2021, 13, 8496 11 of 18
Table 7. Pairwise comparison—Generation Z (source: own elaboration, 2020).
1. 2. 3. 4. 5. 6. 7. 8. ni vi
1. The age of employees does not decide
9 4 5 1 4 5 3 31 0.041
the process of selecting employees
2. Intergenerational cooperation 18 8 5 3 6 9 5 54 0.071
3. Manager has an individual approach to
23 19 10 5 10 12 6 85 0.112
employees
4. Lifelong learning 22 22 17 7 12 7 4 91 0.120
5. Quality working environment 26 24 22 20 16 17 12 137 0.181
6. Transfer of experience from older
23 21 17 15 11 10 4 101 0.134
employees to younger ones
7. Work management at the initiative of
22 18 15 20 10 17 5 107 0.142
employees
8. Care for employees’ occupational health 24 22 21 23 15 23 22 150 0.198
Sum 756 1
The number of respondents from Generation Z was 27. The youngest respondent
stated the year of birth in 2000. Based on the data and the calculation of the weight of
individual criteria in Table 7, we found that the order of importance of individual areas
for Generation Z is identical with Generation X. However, if we compare the results of
the individual areas between the two mentioned generational groups, we find that for
the youngest generation, age-related equality in job selection is less important than for
Generation X. They also consider intergenerational cooperation to be less important. A
good working environment is, on the contrary, more important for the youngest generation,
as well as occupational health care.
Based on the collected data, we approached the evaluation of established research
questions and research hypotheses.
RQ1: What pillars of age management did the employees of each generation group in
large industrial enterprises in Slovakia identify as the most important? For better clarity,
the order of the age management pillars’ importance for individual generational groups
is shown in Table 8. The numbers in the rows for each generation group represent the
consecutive number of the age management pillar.
Table 8. Perceived importance of the age management pillars (source: own elaboration, 2020).
Generation Group/Pillars
1. Most Important 2. 3. 4. 5. 6. 7. 8. Least Important
by Importance
Baby Boomers 6 4 7 5 8 3 2 1
Generation X 8 5 7 6 4 3 2 1
Generation Y 5 8 6 4 7 3 2 1
Generation Z 8 5 7 6 4 3 2 1
Based on Table 8 and the importance of the age management pillars for individual
generational groups, we can state that Generation X and Z have similar preferences. On
the other hand, when comparing the results for the older generation, we can see that the
preferences change and as the most important pillars can be considered “Satisfied life”,
“Ensuring good work ability and motivation” and “High level of competencies”.
Most important, four age management pillars reached the highest number of designa-
tions in pairwise comparison. For the Baby Boomers generation, the order is as follows: 1.
6—High level of competencies; 2. 4—Quality and functional measures of age management;
3. 7—Quality work organization; 4. 5—Ensuring good work ability and motivation. Gener-
ation X identified the following as the most important: 1. 8—Satisfied life; 2. 5—Ensuring
good work ability and motivation; 3. 7—Quality work organization; 4. 6—High level of
competencies. Based on the pairwise comparison of Generation Y, the importance is as
follows: 1. 5—Ensuring good work ability and motivation; 2. 8—Satisfied life; 3. 6—HighSustainability 2021, 13, 8496 12 of 18
level of competencies; 4. 4—Quality and functional measures of age management. Based
on the answers from the youngest generational group on the labor market, generational
group Z, the order is identical to generational group X: 1. 8—Satisfied life; 2. 5—Ensuring
good work ability and motivation; 3. 7—Quality work organization; 4. 6—High level of
competencies.
RQ2: What pillars of age management did the employees of each generational group in
large industrial enterprises in Slovakia identify as the least important? The least important
age management pillars can be identified as the four pillars that reached the lowest number
of designations in pairwise comparison. All generational groups identified the three
least important pillars of age management as: 8. 1—Knowledge of age issues; 7. 2—
Accommodating attitude towards aging; 6. 3—Management that understands individuality
and difference. For Generation X and Generation Z, Pillar 4—Quality and functional
measures of age management is the fifth in importance. For the Baby Boomers Generation:
5. 8—Satisfied life; Generation Y identified: 5. 7—Quality work organization.
RH: There is a dependency between generational groups of employees in indus-
trial enterprises in Slovakia and the importance of age management pillars (number of
designations in pairwise comparison).
The hypothesis was tested using chi-square and an independence test. We chose the
chi-square test because it compares the actual distribution of data with the theoretically
chosen distribution. Subsequently, we chose the test of independence, the task of which
was to determine whether the phenomena are dependent on each other or, conversely, the
phenomena are not dependent on each other. With these tests, we verified the dependence
between two features—a generation group of employees from industrial enterprises in
Slovakia and the importance of the age management pillars (the number of designations in
a pairwise comparison). The first variable (generational group) is an independent variable
and could acquire four variants (Baby Boomers, Generation X, Generation Y, Generation
Z). The second character is a dependent variable, which represents the age management
pillars and could acquire eight variants.
Based on the data of the observed abundances and the expected abundances, we
calculated the chi-square (Table 9).
Table 9. Chi-square calculation (source: own elaboration, 2020).
Pillar 1 Pillar 2 Pillar 3 Pillar 4 Pillar 5 Pillar 6 Pillar 7 Pillar 8 Sum
Baby Boomers 1.712 0.230 1.102 4.611 3.974 0.579 0.038 7.930 20.175
Generation X 4.914 0.027 1.474 1.249 2.942 1.059 1.319 3.590 16.575
Generation Y 2.359 0.291 0.362 0.054 4.280 0.933 2.708 2.227 13.214
Generation Z 11.547 5.035 0.234 0.008 2.553 0.296 0.666 3.519 23.858
Sum 20.531 5.582 3.173 5.922 13.749 2.868 4.731 17.266 73.822
Based on the calculated values in Table 9, the chi-square value (χ2 ) is 73.822. We
chose a significance level of 5%. According to the statistical tables, we found a critical
value, which is χ α2 = 32.7. If the relation χ2 > χ α2 , the observed characters can be
considered as dependent. Otherwise, the monitored characters are independent. In our
case, the above relationship is true, and therefore we conclude that there is a dependence
between generational groups of employees from industrial enterprises in Slovakia and
the importance of the age management pillars (the number of designations in a pairwise
comparison).
4. Discussion
Diversity in terms of age can be a double-edged sword in the workplace with both
positive and negative effects. Business managers should take into account the opportunities
and risks that arise from age diversity. They also need to learn how to use the potential of
age diversity and take action to manage age diversity optimally [83]. Based on previousSustainability 2021, 13, 8496 13 of 18
researches, there have been identified measures that employers use to prolong the work-
ing life of older employees. The most common were incentive payments (higher salary,
benefits), longer holidays or extended holidays, reduced physical activity at work, shorter
working hours (with equal salary), health and safety (medical examinations, counseling,
ensuring healthy work, environment) [84–86]. If we compare the research results [87] with
our research, we can come to similar statements. Accordingly, older employees feel the
need for professional development more often than younger employees and also support
the concept of shared knowledge. According to our research, it is a priority for the old-
est generational group, Baby Boomers, to transfer experiences from older employees to
younger ones, and they have also included lifelong learning as important. For younger
generations, our research has confirmed the importance of a quality work environment.
We can support this statement with research [88] that has also shown that a quality work
environment is important for younger generations, who perceive it as a factor that supports
their stabilization in the enterprise. Occupational health care and the related well-being
and satisfied life were the subjects of research [89], where the analyzes performed showed a
positive relationship between a quality health climate and general health, mental health and
work ability. Additional analyses showed that the team’s positive health climate dampened
the negative relationship between the employee’s age and work ability. We can support
these findings with our results, namely, that employees of different generations consider
health care to be very important, and therefore, we can say that this is an area that needs to
be constantly developed, improved and emphasized. Managers and employees are often
unaware of the problem of the negative trend of the demographic curve, which has resulted
in an aging population (and associated early retirement) and a lack of young labor [36,48].
Other authors also responded to this problem, prioritizing and considering age manage-
ment in the context of an aging population. Researches and analyses are carried out from
the organizational level and focus on internal and external factors to be taken into account
in the implementation of age management, age management strategies and also describe
measures to support employees, increasing their work ability, maintaining employability
and benefits resulting from the implementation of the concept [90–92]. Identifying with
such organizational goals and values also makes it easier for employees to put their efforts
into performance for the benefit of the organization [93]. Further areas of scientific research
should focus on the successful management of an aging workforce through a deeper exam-
ination of changing needs and values at the individual level [94]. Age management is often
associated only with aging employees, but it is very important to keep in mind that the
concept of age management includes all employees, and therefore the youngest ones, the
employees who care for children of older employees and employees of retirement age [95].
The issue of age management is a basic strategic tool in the sustainable management of
human resources, which helps to develop employees, ensure their cooperation and syn-
ergy, and at the same time, leads to resilience and sustainability at all management levels
in the enterprise [96], while it is also very important to perceive the importance of age
management, as it is a prerequisite for achieving long-term sustainability [35]. Although
theoretical knowledge researches in the field of age management often emphasize older
employees, age management deals with all age categories of employees, and therefore it is
necessary to achieve cooperation through all generations in the enterprise/labor market.
For this reason, we focused our research on all generational groups of employees and thus
analyzed their needs and preferences on an individual level.
5. Conclusions
Although age management and human resource management, in general, are among
the “soft” components of management, they can greatly affect the prosperity of an enter-
prise. Employees are a key resource for an enterprise, so it is important that the enterprise
constantly monitors their needs and ensures their satisfaction and work ability. However,
if the enterprise’s management ensures prosperity and manages human resources with
regard to the age and potential of employees, it should include age management in theSustainability 2021, 13, 8496 14 of 18
strategic goals in the personnel area and take it seriously. By adhering to applying the
age management pillars and areas, enterprises will achieve the cooperation of individual
generational groups that currently meet in the workplace.
Often, existing enterprises limits are an obstacle to applying both working concepts
and approaches. The management of the enterprise must face limited resources: financial,
material, information, human and time. The specific conditions of the enterprise may
differ based on various internal and external factors. Therefore, although age management
pillars are the support of the overall concept, it is appropriate to consider the specifics of a
particular enterprise in applying. This will allow attention to be paid to those areas where
the benefits and effects of their use will be most beneficial.
It is important that the enterprise’s management knows the concept, develops it
comprehensively and sets out the principles and measures that should result from the
analysis of the current situation. The enterprise should be able to analyze its current
situation and the needs of employees and also know the limiting factors that can limit in
implementation. Therefore, it is appropriate to consider all the circumstances and select
measures that meet the needs and preferences of employees from different generations in
order to achieve their cooperation. Our research has clearly shown that Generation X and
Generation Y have almost the same preferences. On the other hand, we can see that when
comparing other generational groups, preferences change, and the most important pillars
can be considered “Satisfied life”, “Ensuring good work ability and motivation” and “High
level of competencies”. Among the most interesting results is that the oldest generation
group in the labor market, the Baby Boomers Generation, considers the opportunity to
transfer experience from older employees to younger employees as the most important.
Lifelong learning was identified as the second most important area. We consider this
finding to be positive, as we can interpret that even older employees have the desire and
will to learn and constantly advance. It was surprising to find that occupational health care
ended up in fifth place. Based on the pairwise comparison and the sum of designations
from Generation X and the youngest generation group on the labor market, Generation
Z, the arrangement of the pillars (areas) of age management is the same. They perceive
occupational health as the most important area. On the other hand, compared to the
Baby Boomers Generation, lifelong learning is not considered as important; it has been
identified as the fifth most important. Generation Y also does not consider education to be
the most important area; it was identified as the fourth most important. Compared to other
generational groups, which identified the area of work management at the initiative of
employees as the third most important, generation Y considers this area to be the fifth most
important. The research confirmed the hypothesis, and we state that there is a dependence
between generational groups of employees of industrial enterprises in Slovakia and the
importance of the age management pillars.
Diversity management is becoming a current issue for industrial enterprise manage-
ment. Although the management of gender diversity is gradually gaining the focus of
managers, there is still a lack of sufficient information on the possibilities of dealing with
the current problems of population aging, the lack of young employees or age diversity in
the workplace.
One of the limitations of research stems from belonging to a generational group and
the definition of the year of birth of a generational group. The definition of years of birth
may differ depending on the country in which people were born and raised, as well as on
the historical context of a particular country and on living standards and living conditions.
As history shows, each generation has moments that shape the generation members
who have experienced these situations [59]. The research confirms that the pandemic
situation will also be a moment that will now affect several generations of employees, their
motivational preferences [97] and, as can be expected, their values and attitudes.
The potential benefit of this paper is that it provides the basis for understanding the
perception of employees in Slovakia of priorities of individual pillars of age management.
This can be useful for managers, whether in policy or business, to take management actionSustainability 2021, 13, 8496 15 of 18
for different generations of employees. The limitation of the research may be that when
determining the priorities of employees, another factor could have influenced more than
their age, e.g., their economic, social status or a society-wide situation. Despite these limits,
we see the benefit of research meaningful for managers to perceive the broader context
and take into account population development in strategic planning of the development of
organizations or society.
Age management is a part of and results from the sustainable management of human
resources and is also a tool to manage the current situation in the labor market associated
with the negative development of the demographic curve. We consider the above findings
to be very important and beneficial in the field of sustainable human resource manage-
ment in manufacturing and non-manufacturing organizations for the implementation of
age management in practice and ensuring the cooperation and satisfaction of different
generations of employees.
Author Contributions: N.V. conceived and designed the article, performed the analysis and wrote
the article. Review, editing and supervision—Z.G.B. and A.C. All authors have read and agreed to
the published version of the manuscript.
Funding: This research was funded by the Ministry of Education, Science, Research and Sport of the
Slovak Republic; the article is a part of VEGA project No. 1/0721/20 “Identification of priorities for
sustainable human resources management with respect to disadvantaged employees in the context
of Industry 4.0”.
Institutional Review Board Statement: Not applicable.
Informed Consent Statement: Not applicable.
Data Availability Statement: Not applicable.
Conflicts of Interest: The authors declare no conflict of interest.
References
1. Magoshi, E.; Chang, E. Diversity management and the effects on employees’ organizational commitment: Evidence from Japan
and Korea. J. World Bus. 2009, 44, 31–40. [CrossRef]
2. Østergaard, C.R.; Timmermans, B.; Kristinsson, K. Does a different view create something new? The effect of employee diversity
on innovation. Res. Policy 2011, 40, 500–509. [CrossRef]
3. Garib, G. Leisure managers’ perceptions of employee diversity and impact of employee diversity. Int. J. Hosp. Manag. 2013, 32,
254–260. [CrossRef]
4. Manoharan, A.; Madera, J.M.; Singal, M. Walking the talk in diversity management: Exploring links between strategic statements,
management practices, and external recognition. Int. J. Hosp. Manag. 2021, 94, 102864. [CrossRef]
5. Anglim, J.; Sojo, V.; Ashford, L.J.; Newman, A.; Marty, A. Predicting employee attitudes to workplace diversity from personality,
values, and cognitive ability. J. Res. Pers. 2019, 83, 103865. [CrossRef]
6. Sezerel, H.; Tonus, H.Z. The Soft Element of Strategic Human Resource Management: The Employee’s Perception of Diversity
Climate. Procedia Soc. Behav. Sci. 2014, 150, 354–359. [CrossRef]
7. Hsiao, A.; Auld, C.; Ma, E. Perceived organizational diversity and employee behavior. Int. J. Hosp. Manag. 2015, 48, 102–112.
[CrossRef]
8. Talavera, O.; Yin, S.; Zhang, M. Tournament incentives, age diversity and firm performance. J. Empir. Financ. 2021, 61, 139–162.
[CrossRef]
9. Talavera, O.; Yin, S.; Zhang, M. Age diversity, directors’ personal values, and bank performance. Int. Rev. Financ. Anal. 2018, 55,
60–79. [CrossRef]
10. Pinar, M.; McCuddy, M.K.; Birkan, I.; Kozak, M. Gender diversity in the hospitality industry: An empirical study in Turkey. Int. J.
Hosp. Manag. 2011, 30, 73–81. [CrossRef]
11. Rushton, M. A Note on the Use and Misuse of the Racial Diversity Index. Policy Stud. J. 2008, 36, 445–459. [CrossRef]
12. Lozano, A.M.; Etxebarria, I. Tolerance of diversity in adolescents and its relationship with self-esteem, empathy and the concept
of human being. J. Study Educ. Dev. 2007, 30, 109–129. [CrossRef]
13. Luu, T.T.; Rowley, C.; Vo, T.T. Addressing employee diversity to foster their work engagement. J. Bus. Res. 2019, 95, 303–315.
[CrossRef]
14. Van Eckert, S.; Gaidys, U.; Martin, C.R. Self-esteem among German nurses: Does academic education make a difference? J.
Psychiatr. Ment. Health Nurs. 2012, 19, 903–910. [CrossRef]Sustainability 2021, 13, 8496 16 of 18
15. Sourouklis, C.; Tsagdis, D. Workforce diversity and hotel performance: A systematic review and synthesis of the international
empirical evidence. Int. J. Hosp. Manag. 2013, 34, 394–403. [CrossRef]
16. Du, J.; Ma, E.; Lin, X. When diversity leads to divided teams: A multi-level moderated mediation model of team faultlines and
employee engagement. Int. J. Hosp. Manag. 2021, 94, 102818. [CrossRef]
17. Ehnert, I.; Harry, W.; Zink, K.J. Sustainability and Human Resource Management. In Sustainability and Human Resource Management:
Developing Sustainable Business Organizations; CSR, Sustainability, Ethics & Governance; Springer: Berlin/Heidelberg, Germany,
2014. [CrossRef]
18. Cohen, E.; Taylor, S.; Muller-Camen, M. HRM’s Role in Corporate Social and Environmental Sustainability; SHRM Foundation:
Alexandria, VA, USA, 2012.
19. Martin, G.; Farndale, E.; Paauwe, J.; Stiles, P.G. Corporate governance and strategic human resource management: Four archetypes
and proposals for a new approach to corporate sustainability. Eur. Manag. J. 2016, 34, 22–35. [CrossRef]
20. Fan, D.; Zhu, C.J.; Huang, X.; Kumar, V. Mapping the terrain of international human resource management research over the past
fifty years: A bibliographic analysis. J. World Bus. 2021, 56, 101185. [CrossRef]
21. Macke, J.; Genari, D. Systematic literature review on sustainable human resource management. J. Clean. Prod. 2019, 208, 806–815.
[CrossRef]
22. Amrutha, V.; Geetha, S. A systematic review on green human resource management: Implications for social sustainability. J.
Clean. Prod. 2020, 247, 119131. [CrossRef]
23. Strenitzerová, M.; Achimský, K. Employee Satisfaction and Loyalty as a Part of Sustainable Human Resource Management in
Postal Sector. Sustainanability 2019, 11, 4591. [CrossRef]
24. Babel’ová, Z.G.; Stareček, A.; Koltnerová, K.; Cagáňová, D. Perceived Organizational Performance in Recruiting and Retaining
Employees with Respect to Different Generational Groups of Employees and Sustainable Human Resource Management.
Sustainability 2020, 12, 574. [CrossRef]
25. Delmas, M.A.; Pekovic, S. Organizational Configurations for Sustainability and Employee Productivity: A Qualitative Compara-
tive Analysis Approach. Bus. Soc. 2017, 57, 216–251. [CrossRef]
26. Kostenko, V.V.; Kuzmuchev, P.A.; Ponarin, E.D. Attitudes towards gender equality and perception of democracy in the Arab
world. Democratization 2015, 23, 862–891. [CrossRef]
27. Čambál, M.; Urbanovičová, P.; Mikulášková, J.; Szabó, P. Koexistencia rôznych generácií zamestnancov - výzva pre súčasné
priemyselné podniky. Fórum manažéra. 2017, 2, 8–14. Available online: https://forummanazera.sk/cms/art_db/2017-2-2.pdf
(accessed on 10 June 2021).
28. Chromjakova, F. The Key Principles of Process Manager Motivation in Production and Administration Processes in an Industrial
Enterprise. J. Compet. 2016, 8, 95–110. [CrossRef]
29. Stachova, K.; Stacho, Z.; Raišienė, A.G.; Barokova, A. Human resource management trends in Slovakia. J. Int. Stud. 2020, 13,
320–331. [CrossRef]
30. Statistical Office of the Slovak Republic. Year 2018: Slovakia is Aging, the Number of Seniors Exceeded the Number of Children
for the First Time. 2020. Available online: https://www7.statistics.sk/ExportPdf2/PdfExportSrvlt?Document=a06f192f-646f-4c9
9-8932-0c12ef7d84af (accessed on 20 June 2021).
31. Dimovski, V.; Grah, B.; Colnar, S.; Bogataj, D. Age Management of Industrial Workers Based on the Multiple Decrement Modelling.
Procedia Manuf. 2019, 39, 1455–1463. [CrossRef]
32. Grah, B.; Colnar, S.; Dimovski, V.; Penger, S. Age management in the context of Industry 4.0 and beyond. IFAC-PapersOnLine 2020,
53, 10591–10596. [CrossRef]
33. Skoglund, B.; Skoglund, C. Can age management promote work ability among older workers? Int. Congr. Ser. 2005, 1280, 392–396.
[CrossRef]
34. Vetráková, M.; Šimočková, I.; Pompurová, K. Age and Educational Diversification of Hotel Employees and Its Impact on Turnover.
Sustainsbility 2019, 11, 5434. [CrossRef]
35. Urbancová, H.; Vnoučková, L.; Linhart, Z.; Petrů, G.J.; Zuzák, R.; Holečková, L.; Prostějovská, Z. Impact of Age Management on
Sustainability in Czech Organisations. Sustainability 2020, 12, 1064. [CrossRef]
36. Egdell, V.; Maclean, G.; Raeside, R.; Chen, T. Age management in the workplace: Manager and older worker accounts of policy
and practice. Ageing Soc. 2018, 40, 784–804. [CrossRef]
37. Rašticová, M.; Birčiaková, N.; Bédiová, M.; Mikušová, J. Older Workers Economic Activity and the Health Status—The Implication
of Age Management. Pol. J. Manag. Stud. 2019, 19, 322–337. [CrossRef]
38. Blomé, M.W.; Borell, J.; Håkansson, C.; Nilsson, K. Attitudes toward elderly workers and perceptions of integrated age
management practices. Int. J. Occup. Saf. Ergon. 2018, 26, 112–120. [CrossRef]
39. Urbancová, H.; Vrabcová, P. Age management as a human resources management strategy with a focus on the primary sector of
the Czech Republic. Agric. Econ. 2020, 66, 251–259. [CrossRef]
40. Warwas, I. Age management and its architecture in polish traditional versus knowledge-based companies. Argum. Oeconomica
2019, 2, 407–426. [CrossRef]
41. Garavaglia, E.; Marcaletti, F.; Iniguez-Berrozpe, T. Hacia un entorno laboral saludable e inclusivo. Gestión del envejecimiento en
el trabajo a través del Quality of Ageing at Work (QAW-q). Rev. Int. Organ. 2018, 20, 197–226. [CrossRef]You can also read