Large Scale Grid Integration of Renewable Energy Sources - Way Forward - Central Electricity Authority November 2013
←
→
Page content transcription
If your browser does not render page correctly, please read the page content below
Large Scale Grid Integration of
 Renewable Energy Sources
        - Way Forward

     Central Electricity Authority
           November 2013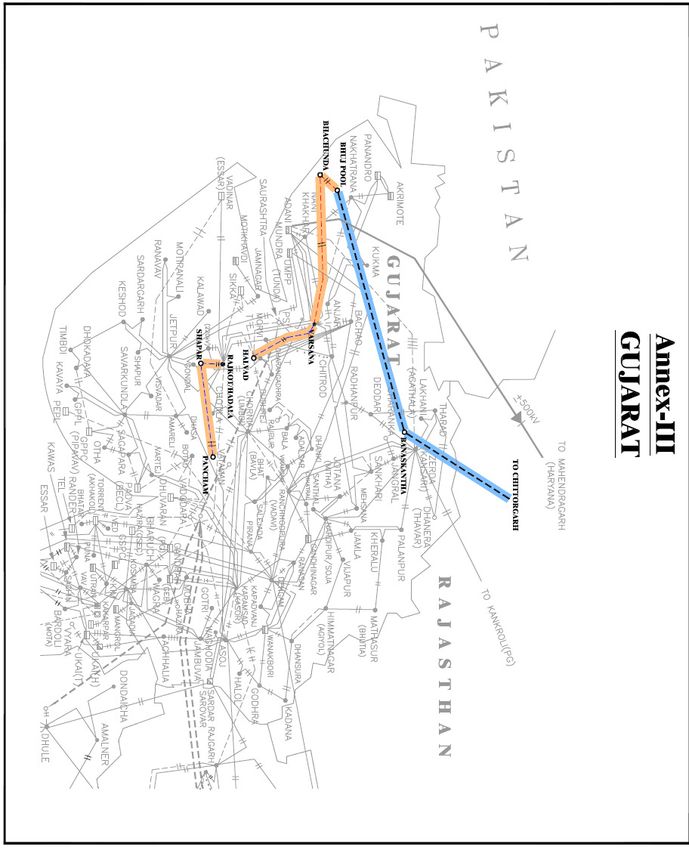
Large Scale Grid Integration of Renewable Energy Sources – Way Forward

 Clause                                    Contents                        Page

 1.            Introduction                                                   3
               Installed Capacity of Wind and Solar Renewable Energy
 2.                                                                           4
               Sources (RES

 3.            12th Plan RES additions                                        8

               Analysis of renewable generation from Wind & Solar Energy
 4.                                                                           9
               Sources
 5.            Forecasting of Wind and Solar Generation                      19
 6.            Present method of balancing by the States                     20
 7.            International Experience                                      23

 8.            Analysis in the Indian context                                26

 9.            Way Forward                                                   35
 10.           Renewable Energy Management Centers ( REMCs)                  36

               Drafting Committee, Acknowledgement, References               38

 Annex-I       Note on pumped storage plants in India                        39

 Annex-II      CEA Grid Connectivity standards for RES                       44

               Maps of major RE transmission corridors under
 Annex-III                                                                   51
               implementation

Large Scale Grid Integration of RES_ CEA                                          1
Acronyms

            AGC             Automatic Generation Control

            AP              Andhra Pradesh

            BU              Billion Unit

            CEA             Central Electricity Authority

            CERC            Central Electricity Regulatory Commission

            DISCOM          Distribution Company

            HP              Himachal Pradesh

            IEGC            Indian Electricity Grid Code

            IPP             Independent Power Producer

            ISGS            Inter State Generating Station

            MU              Million Unit

            MW              Mega Watt

            NLDC            National Load Dispatch Center

            NTPC            National Thermal Power Corporation

            PPA             Power Purchase Agreement

            RE              Renewable Energy

            REMC            Renewable Energy Management Centres

            RES             Renewable Energy Source

            RLDC            Regional Load Dispatch Center

            RPO             Renewable Purchase Obligation

            RRF             Renewable Regulatory Fund

            SERC            State Electricity Regulatory Commission

            SLDC            State Load Dispatch Center

            TSO             Transmission System Operator

            UI              Unscheduled Interchange

Large Scale Grid Integration of RES_ CEA                                2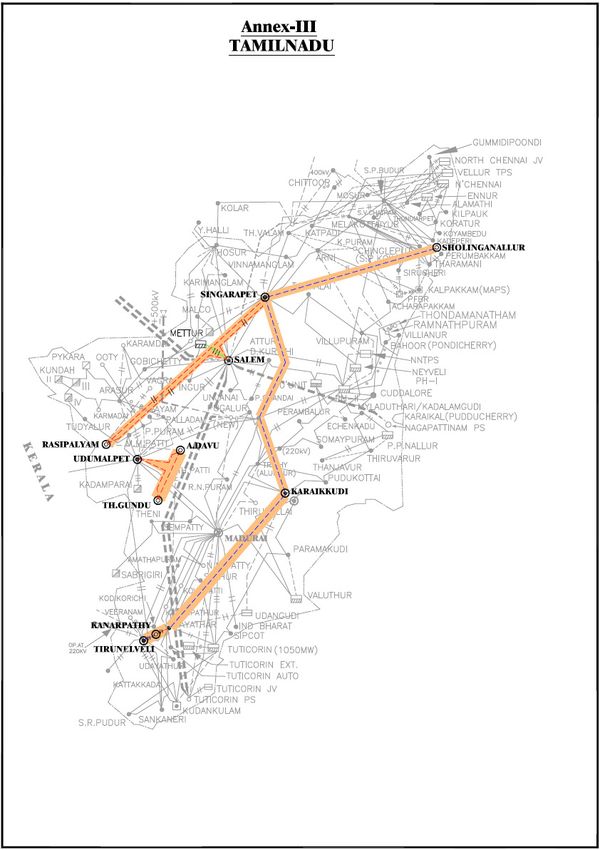
Large Scale Grid integration of Renewable Energy Sources
                                           – Way Forward

1.0 Introduction

      Renewable generation from wind and solar has increased substantially during
      past few years and forms a significance proportion of the total generation in the
      grid. This renewable generation is concentrated in a few states, to the extent that
      it cannot be called marginal generation and serious thought needs to be given to
      balance the variability of such generation. There is an ambitious programme for
      increase of such Renewable Generation and therefore, it is imperative to work
      out a way forward for facilitating large scale integration of such variable
      Renewable Energy Sources (RES), keeping in view the security of the grid.
      Moreover, as we move towards a tighter frequency band, it becomes even more
      challenging to balance this variable RES.

      Generation from RE Sources depends on nature, i.e. wind velocity and sunshine.
      The variability of RES power can be addressed through improved forecasting
      techniques, which are still evolving. When the percentage of RES becomes
      significant, special attention needs to be paid to accurately forecast their output.

      India is a country of continental size and this is helpful in balancing the variable
      output of renewable energy sources located in few states by integrating them into
      all India grid. The inter state and inter regional transmission infrastructure is
      already being developed and it is expected that all the five electrical regions of
      India would be synchronously connected in 2014. However, new transmission
      corridors would be required for evacuating green energy from states such as
      Tamil Nadu, Gujarat, Rajasthan and J & K (Ladakh). It has now been recognised
      by the transmission planners that in view of the short gestation period of RE
      plants, the transmission has to lead generation and would require upfront
      investment. Such transmission corridors required in the next five year time span
      have already been firmed up through the established process of coordinated
      transmission planning and their implementation is being taken up progressively.

      The Report has been prepared on the basis of detailed discussions and inputs
      furnished by Gujarat, Rajasthan and Tamil Nadu.

Large Scale Grid Integration of RES_ CEA                                                     3
2.0 Installed Capacity of Wind and Solar Renewable Energy Sources (RES)

2.1 All India

      The total All India Installed Capacity (IC) as on 31.08.2013 is 2,27,357 MW which
      includes 28,184 MW from Renewable Energy Sources (RES), constituting 12.4%
      of the total capacity. The same is shown in the form of a pi diagram below:

      During 2012-13, the generation from RES sources was around 47 Billion Units
      (BUs), which was about 5% of the total all India generation of 959 BUs. The
      same is shown in the form of a pi diagram below.

Large Scale Grid Integration of RES_ CEA                                             4
2.2 Concentration of RES in certain States

      The RES capacity is concentrated in five states of country, i.e. Rajasthan,
      Gujarat, Maharashtra, Karnataka and Tamil Nadu. The break-up of RES capacity
      vis-à-vis the conventional generation capacity (as on 31.7.2013) is as given
      below:

                                                                                  (Figs. In MW)
                    Conven                 Solar
Sl.   State         tional     Wind        (above   Biomas   Bagass   Small   Total    RES
No.                                        1MW)     s        e        Hydel   RES      capaci
                    Genera
                    tion                                                      MW       ty as
                                                                                       % of
                                                                                       total
                                                                                       genera
                                                                                       ting
                                                                                       capaci
                                                                                       ty
1     Rajasthan                2,683       553      106      0.000    24      3366     26%
                    9,588
2     Gujarat       18,479     3164        857      31       0.000    6       4058     18%
3     Maharashtra              3008        206      127      996      332     4669     14.7%
                    27,137
4     Karnataka                2142        14       106      1147     701     4110     28.6%
                    10,247
5     Tamil Nadu               7179        20       204      659      0.000   8062     40.2%
                    11,974
      Total         77,425     18,176      1,650    574      2802     1,063   24,265   23.86%

2.3 Penetration of variable RES

      The extent of variable type of generation as compared to the total generation
      capacity available in the State plays an important part in determining the action
      required to be taken to handle the variability.

      Gujarat, Tamil Nadu and Rajasthan have substantial percentages 18%, 40.5%
      and 26% of the RES in their total installed capacity respectively, predominant of
      which is wind and solar. These three States put together have 70% of the wind
      generation capacity and 91% of Solar generating capacity of the total all India

Large Scale Grid Integration of RES_ CEA                                                     5
wind (18500 MW) and Solar capacity (1500 MW) respectively. The other States
      with substantial RES capacity are Maharashtra and Karnataka.

      The break-up of the total installed capacity in the five States, showing the
      intermittent generation v/s conventional generation, is depicted below in the form
      of pi diagrams.

Large Scale Grid Integration of RES_ CEA                                              6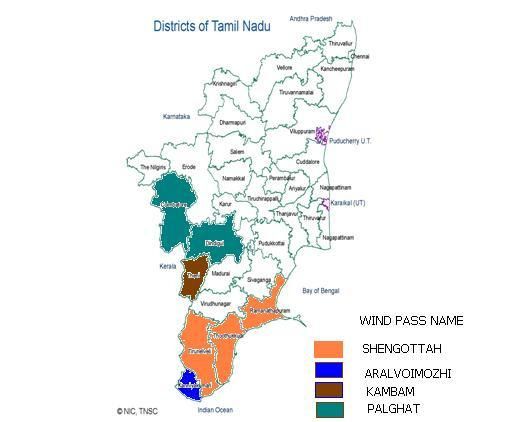
GUJARAT

                                                              Wind, 3164,
                                                               14.04%

                                                                Solar, 857,
                                                                  3.80%

                                            Conventional,         Biomass, 31,
                                           18479, 81.99%             0.14%

                                                            Small Hydel, 6,
                                                               0.03%

Large Scale Grid Integration of RES_ CEA                                         7
2.4 Growth of wind capacity in Tamil Nadu

      The State of Tamil Nadu in India has the highest installed generating capacity of
      wind power in India, i.e. 7158 MW (as at end July, 2013) which is about 40% of
      Wind installed capacity in India. The growth of wind installed capacity in Tamil
      Nadu is shown below:

                       Wind - Yearly Capacity Addition in MW
       7500
                                                                                                                                 7145
                                                                                                                          6970

       6500
                                                                                                               5887.165

       5500
                                                                                                         4889.765

       4500                                                                                        4287.74
                                                                                            3856.765
                                                                                      3475.69
       3500
                                                                               2897.78

       2500
                                                                        2040.225

       1500                                                       1361.49
                                                            990.265
              676.155707.295 725.06   770.735 812.63 856.665

        500

3.0 12th Plan RES additions

      During the 12th five year plan, capacity addition programme of around 88,537
      MW has been planned from conventional generation. CEA has made an
      assessment of capacity addition (wind/ solar/ small hydro) likely to come up
      during the 12th Plan and it is envisaged that about 32,000 MW is likely to come
      up in eight RE rich states i.e. Tamil Nadu, Karnataka, A.P., Maharashtra, Gujarat,
      Rajasthan, Jammu & Kashmir and H.P. The corresponding intra-state and Inter-
      state      transmission               systems           have          already      been      planned.         However,            a
      comprehensive scheme for wind and solar forecasting stations, communication

Large Scale Grid Integration of RES_ CEA                                                                                                8
system and Renewable Energy Management Centres (REMC) is yet to be
      planned and taken up. Out of the 32,000 MW of RES, consisting of Wind, Solar
      and Small Hydro, about 30,000 MW is expected to come from solar and wind
      energy. The break-up of such generation capacity among the various states of
      India is given below:

                                                           SHP
                                     Wind    Solar      (Small Hydro   Total, MW
     State                                                Projects)
     Tamil Nadu                       4339   3014                       7353
     Andhra Pradesh                   3150   1677                       4827
     Karnataka                        3619   253           418          4290
     Gujarat                          3368   1361                       4729
     Maharashtra                      3763   300                        4063
     Rajasthan                        2181   3513                       5694
     Himachal Pradesh                                      1281          1281
     Jammu & Kashmir                   12     102           362          476
     Total                           20432   10220         2061         32713

4.0 Analysis of renewable generation from Wind & Solar Energy Sources

      The peak wind generation in a State occurs in a different season as compared to
      the months of peak requirement of the State. The variation of month-wise
      generation from wind and demand during the year 2012-13 for the three states of
      Gujarat, Tamil Nadu and Rajasthan are shown below:

Large Scale Grid Integration of RES_ CEA                                           9
Gujarat-Energy Requirement (MU) & Wind Generation (MU)-
2012-13
12000 3000
10000 2500
Peak Req Season
8000 2000
MU
6000 1500
4000 1000
2000 500
Peak Wind Season
0 0
Apr May June July Aug Sept Oct Nov Dec Jan Feb Mar
Energy Requirement (MU) Wind Generation (MU)
Large Scale Grid Integration of RES_ CEA 104.1 Wind Generation – Tamil Nadu
The main wind season in Tamil Nadu is from June to September. During this
season, wind contributes about 30-35% of the total energy consumption in Tamil
Nadu. In other wind-rich States, wind contributes about 20% in Karnataka and
Rajasthan, 15% in Gujarat and 10-12% in Maharashtra. The percentage
contribution of wind energy to the total energy consumption in Tamil Nadu, over
various seasons for the last three years is shown in the graph given below:
Large Scale Grid Integration of RES_ CEA 11Tamil Nadu has four passes through which wind blows, viz., Palghat,
Shencottah, Aralvoimozhi and Kambam. These are shown below :
Wind generators fed from these passes are connected to 15 pooling stations at
110kV and 230kV levels through which power is injected into the grid. The
Large Scale Grid Integration of RES_ CEA 12variation of wind generation, for all pooling stations combined, on consecutive
days in Tamil Nadu in the month of May, 2012, is shown below:
Large Scale Grid Integration of RES_ CEA 13The above graphs show that even on consecutive days there is variation of wind
generation. If the variation of wind generation is seen on a pooling station-wise
basis, the variations would be even more, since the variations over wide
geographical areas tend to counter balance each other.
4.2 Wind Generation- Gujarat & Rajasthan
The typical seasonal variation of wind generation in Gujarat is given below:
Monsoon:
Winter:
Large Scale Grid Integration of RES_ CEA 14Summer:
The month-wise maximum wind energy generation in million units and peak wind
generation in MW for various months of the year for the last two years in
Rajasthan is given below:
Large Scale Grid Integration of RES_ CEA 15The wind variation in Rajasthan in MW over consecutive days in the month of
June and July 2012 is given below:
From the above, it may be concluded that the difference between maximum and
minimum wind generation over a day can be quite substantial. The number of
Large Scale Grid Integration of RES_ CEA 16days for range of variation of wind generation over a day going beyond certain
limits in the three States is given below:
States Variation Band (MW) Days
> 500 & 1000 &< 1500 55
1547 1
> 500 &1500 & 3000 2
3385 1
>500 & 1000 11
1164 1
4.3 Solar Generation – Gujarat
The highest solar generating capacity in India is presently in Gujarat, i.e. 857 MW
as on July 2013 against a total generating capacity of about 18,479 MW.
However, solar generating capacity is in the process of coming up in a big way,
due to minimum Renewable Purchase Obligations of 0.25% of the energy
consumption in the State, reducing prices of Solar PV modules and the thrust
given by the National Solar Mission through reducing the cost of solar power by
mixing the same with coal-based power from NTPC Stations. The typical solar
generation over a day in Gujarat for a non-cloudy day is given below:
Large Scale Grid Integration of RES_ CEA 17The solar generation is affected due to appearance of clouds. The solar
generation on some of the cloudy days, in the Charanka Solar Park is given
below :
(1) On 1st September, 2012
On 10th September, 2012
Large Scale Grid Integration of RES_ CEA 18The above diagrams show how the normal shape of the daily solar generation
pattern is affected by clouds coming in the way of the sun and even generation
on consecutive days is different.
5.0 Forecasting of Wind and Solar Generation
In order to ensure that the grid operates safely, it is very important for the System
Operator to foresee what is expected to happen a few hours ahead, in order to
be able to take appropriate measures. A number of firms have entered the realm
of forecasting, based on historical data, wind speed, topological features of the
area, air pressure, humidity, etc. for the purpose of wind forecasting. Solar
forecasting is also expected to become important in the future.
Forecasting techniques have been gradually improving over the years. The
forecasting error has been coming down to 15-25 % for up to day-ahead lead
time. An indicative evolution of forecasting errors is depicted below:
The Evolution of Forecasting Errors versus Lead Time, 2005–2008
In Europe, wind forecasting is done by the system operator and balancing
requirements for the same are assigned to various additional system operators;
in other words, the balancing requirements are socialized. However, the sizes of
countries in Europe are about the size of States in India. There is a proposal to
carry out market integration of the countries in Europe in order for this variability
to be spread out over a wider area for balancing to be done. There is a proposal
Large Scale Grid Integration of RES_ CEA 19to construct transmission corridors linking the high wind generating areas in
Spain, Germany etc. with the hydro reservoirs in Norway.
In India we have the advantage of a large grid integrated by high capacity
transmission corridors. More such inter-state/regional inter-connections are
under implementation.
6.0 Present method of balancing by the States
6.1 Tamil Nadu
Tamil Nadu has stated that it manages the variability through reduction of
generation in their coal-based power plants, which are older plants of 210 MW.
There are 12 such units, whose generation can be varied between 170-210 MW,
below 170 MW they would need oil support, which increases the cost of thermal
power. Tamil Nadu has long term PPA with IPPs totaling to 1000 MW located in
the state, which are backed down, when required. They are constrained from
using their hydro power plants for balancing. As against the total Hydro installed
capacity of 2237 MW in Tamil Nadu, the non-irrigation based stations which
could only be regulated according to the grid requirements is only 1325 MW. As
June- September period has both high winds and high inflows to the reservoirs,
the hydro stations have to be operated at full load and as such are not available
for balancing. Further, the only available Pumped storage scheme of 400MW
Kadamparai is also not operated since being the south west monsoon season,
both upper and lower reservoirs i.e. Upper Aliyar & Kaddamprai are filled up to
their maximum level, and hence, any restriction of generation would result in
spillage of water and therefore wasting of free generation. The gas based
stations in Tamil Nadu are radially connected to the gas wells and therefore gas
flow cannot be varied to produce variable generation.
Tamil Nadu has suggested that the evacuation of the entire wind power needs to
be facilitated by regulating the other generating sources in the Southern Region
and the spinning reserve available in the Southern Region should be extended
for balancing the RES of the whole region which may be extended to national
level.
Large Scale Grid Integration of RES_ CEA 206.2 Gujarat
6.2.1Gujarat presently uses both its thermal and hydro power stations for balancing. It
keeps a margin in its thermal and hydro generation to balance the variations of
wind and solar generation. Their thermal units of 240 MW at Sikka and
Wanakbori can be varied up to 140 MW. They also get supply from NTPC units of
500 MW and NTPC has now agreed to the request of Gujarat to vary their
generation from 60% to 100% of unit capacity for balancing. The increased
cycling and rapid ramping up and down may result in wear and tear impacts that
leads to increased capital and maintenance costs and degraded performance
over a period of time. Heat rates and emissions from fossil fuel generators will be
higher during cycling and ramping than during steady state operation. However,
Gujarat has brought out the commercial disadvantages for managing this
variability. It has stated that against a wind must-run generation with an average
tariff of Rs. 3.56 per unit in June 2012, they had to back down cheaper
generation of about Rs. 2.50 to Rs. 2.70 per unit. In addition they had to buy
costlier power from the market.
6.2.2 Gujarat has created a renewable desk and a dedicated engineer for weather
forecasting. They are in the process of installing weather sensors at places where
wind generation is 50 MW and above, which would measure six parameters of
weather, viz., relative humidity, temperature, wind speed, wind direction,
atmospheric pressure and rainfall every 10 seconds and relay the data to the
weather desk in the SLDC. These are expected to be functional within 2 months.
6.2.3 Operational planning to cope with wind variation
The Gujarat RE desk prepares anticipated variation for wind / solar generation as
well as load for the same day, next day and for next 7 days and updates it every
three hours.
Short term plan:
In case of High wind generation and high load scenario:
1. Keep adequate margin on State thermal, gas and Hydro plants to
accommodate up to 50% of wind generation.
Large Scale Grid Integration of RES_ CEA 212. In absence of above margin, requisite un-requisitioned share of Gujarat in
the central sector power plants and create above margin.
3. In absence of option 1 & 2, the power supply to agriculture feeders shall be
arranged in groups. Curtail the feeder which has completed 50% time limit.
In case of High wind – low load condition scenario:
1. Back down the state generating units to technical minimum.
2. Reduce the schedule of Gujarat from the central sector units such that the
units run on technical / coal minimum.
3. Reserve shut down of smaller state generating units and schedule full share
from central sector units.
4. In case of less regional demand, reserve shut down of smaller central sector
units.
Long term plan:
1. Keep all Hydro machines in operation.
2. A pump head storage plant may be planned.
3. Explore the possibility of use of energy storage technology to store wind
energy at off peak period and use at peak period. A pilot project of such
storage technology may be implemented at state level.
6.3 Rajasthan
Rajasthan has a wind generation capacity of 2539 MW as on 31.03.2013 which
is expected to increase to about 3500 MW by 2016-17. Variations in wind
generation up to 1140 MW have been recorded in a day. Rajasthan uses coal
and lignite based generating plants to balance the wind variability in the State by
reducing to the extent that they do not need oil support for steady flame in the
boiler. They also use their two gas-based stations, Ramgarh (113 MW) and
Dholpur (330 MW) for balancing. Since wind generators do not provide the
required VAR support, over voltage causes over-fluxing in transformers resulting
in tripping.
Large Scale Grid Integration of RES_ CEA 227.0 International Experience
7.1 China
According to the Renewable Energy Law and related regulations, wind power
and other renewables should be given first priority in generation scheduling and
dispatching under normal power system operating conditions. To meet this
requirement, grid operators consider predicted wind power generation in the mid-
to-long term, day-ahead and intra-day operation planning processes and fully
exploit flexibility from conventional power plants, as well as the capacity of inter-
grid tie-lines to accommodate the maximum wind power while maintaining
system security and reliability.
The requirement is also emphasized for Wind Power Plants (WPPs) to be
equipped with control and monitoring systems; these serve to enhance their
controllability and provide operational information to grid operators. All grid-
connected WPPs have been equipped with control and monitoring systems that
can communicate with the dispatching centers in real time. Based on wind power
forecasting at different time scales, a “wind power optimal dispatching decision
support system” had been developed and put into operation in the dispatching
centre.
7.2 Germany
50 Hertz Transmission GmbH (50 Hertz) is one of four TSOs (Transmission
System Operator) in Germany. 50 Hertz operates in the northern and eastern
parts of the country. At the end of 2010, the total installed generation in the 50
Hertz control area (i.e. including the share connected to related distribution grids)
was about 38,000 MW, of which about 30 % was wind. The peak load in 50 Hertz
control area was only about 17,600 MW. This makes 50 Hertz the only known
power system in the world that has this level of wind power capacity, relative to
both peak load and generation. This large constellation of RE generation has
caused several operational challenges in 50Hertz control area, especially when
the actual wind power in-feed exceeded the demand such as during low load
conditions. During these times, the excess wind capacity in 50 Hertz has to be
transported to neighboring TSOs, where the electrical demand is much higher.
This transport requires a very close coordination between 50 Hertz and
neighbouring TSOs in and outside of Germany.
Large Scale Grid Integration of RES_ CEA 23Wind forecasting is currently being used in the 50Hertz control room. 50 Hertz
uses three different forecast tools. It receives wind power forecast data from four
different forecast service providers. The forecast horizon is 96 hrs and beyond
that it’s updated twice a day. The information is combined using a weighted sum.
Dispatchers use the information to develop an operational forecast.
The German “Renewable Energy Sources Act” amendment introduced a new
mechanism for wind power balancing, which requires each system operator to
contribute to balancing the whole country's wind power output in proportion to the
size of its regional grid. This mechanism allocates wind power and the
associated fluctuation to each system operator in real time. It is more equitable in
the distribution of balance services and related costs. The four system operators
have developed a real-time wind power monitoring system to determine the wind
power balancing capacity that every system operator should be responsible for.
In fact, as concerns wind power, the regional grids have integrated into a single
large grid in Germany.
7.3 Japan
Japan’s power system consists of two parts, the Western 60 Hz network and the
Eastern 50 Hz network, which are interconnected through frequency converter
stations. The Eastern network consists of three utilities: the Hokkaido Electric
Power Company (EP), Tohoku EP and Tokyo Electric Power Company
(TEPCO). Hokkaido EP is interconnected with Tohoku EP through DC submarine
cables, and Tohoku EP and TEPCO are connected by a 500 kV double circuit
AC transmission line. The areas suitable for wind power generation are limited by
geographical factors, and they are unfortunately concentrated in areas whose
system capacities are comparatively small. Most wind resources are located in
the smaller Hokkaido and Tohoku EP areas, where peak demand is around 5
GW and 15 GW respectively. In the area of TEPCO, which has an electricity
demand of 60 GW including the Tokyo metropolitan area, there are few suitable
locations for wind power. This situation poses a challenge for wind power
integration, since the amount of RE that can be integrated into a grid depends on
the capacity of the network where the RE is located. To enhance wind power
integration, one option is to use inter-ties between utilities efficiently to balance
wind power generation output with the output of the thermal power plants being
Large Scale Grid Integration of RES_ CEA 24reduced accordingly to absorb the incoming wind power. These collaboration
schemes will improve the utilities’ capability to accommodate wind power, but the
capability is limited by the capacity of the inter-ties. When the capacity of the
inter-ties is insufficient, excess wind power generation has to be curtailed.
7.4 Spain
Red Eléctrica de España, S.A.(REE) is dedicated to the transmission of
electricity and the operation of electricity systems of Spain. Red Eléctrica, the
Spanish TSO, started up a Control Centre of Renewable Energies (CECRE) in
2006, a worldwide pioneering initiative to monitor and control Renewable energy.
CECRE allows the maximum amount of production from renewable energy
sources, especially wind energy, to be integrated into the power system under
secure conditions. CECRE is an operation unit integrated into the Power Control
Centre (CECOEL). After June 30th 2007, all wind production facilities with a total
installed power greater than 10 MW must be controlled by a control center that is
directly connected to the CECRE. These wind generation control centers must
have enough control over the plants that they can execute CECRE’s orders
within 15 minutes at all times.
By means of 23 control centers of the generation companies, which act as
interlocutors, CECRE receives, every 12 seconds, real time information about
each facility regarding the status of the grid connection, production and voltage
at the connection point. This data is used by a sophisticated tool which makes it
possible to verify whether the total generation obtained from renewable energies
can be integrated at any moment into the electricity system without affecting the
security of supply.
The control centres are able to control wind power output according to setting
values issued by CECRE within 15 minutes at any time. For power system
security reasons, if necessary, it has the right to reduce the wind power output.
On one hand, it can determine the maximum RE which the entire system can
accommodate while still guaranteeing system security. On the other hand, using
an optimization method, it can calculate the maximum output of each wind farm.
The resulting setting thus calculated is sent to every control centre.
Although wind farms are declaring their forecasted generation, REE is also doing
wind forecasting separately. SIPREOLICO is a wind prediction tool for the
Large Scale Grid Integration of RES_ CEA 25Spanish peninsular power system. It is a short-term wind power prediction tool
(detailed hourly forecasts up to 48 Hrs in advance & aggregated hourly forecast
up to 10 days in advance)
7.5 USA
Due to different grid composition, rules and wind power penetration, the various
regional grids of the USA have developed widely varying wind power scheduling,
dispatch and operational mechanisms. For example, the California Independent
System Operator (CAISO), as a leader in state-of-the-art mechanisms, has
developed a Participating Intermittent Resource Program (PIRP) that allows
individual wind facilities to self-schedule according to shared forecasting
technologies. One tool the ISO uses in managing the grid is the ancillary services
market. Power suppliers offer special energy products that “stand by” and are
ready to act in case of sudden loss of a power plant or transmission line. There
are four types of ancillary services products: regulation up, regulation down,
spinning reserve and non-spinning reserve. Regulation energy is used to control
system frequency that can vary as generators access the system and must be
maintained very narrowly around 60 hertz. Units and system resources providing
regulation are certified by the ISO and must respond to “automatic generation
control” signals to increase or decrease their operating levels depending upon
the service being provided, regulation up or regulation down.
Spinning reserve is the portion of unloaded capacity from units already
connected or synchronized to the grid and that can deliver their energy in 10
minutes and run for at least two hours. Non-spinning reserve is capacity that can
be synchronized and ramping to a specified load within 10 minutes.
The New York Independent System Operator (NYISO) requires wind farms to
behave like conventional power in order to participate in real-time electricity
markets in certain circumstances, the wind farm must reduce output power or be
fined if it exceeds the value specified in scheduling instructions.
8.0 Analysis in the Indian context
8.1 The basic technical challenge comes from the variability of wind and solar power
which affects the load generation balance, varying demand for reactive power
and impact on voltage stability. Recently 16 SVCs (+300/-200, +400/-300, +600/-
Large Scale Grid Integration of RES_ CEA 26400 MVAR) / STATCOMs ( + 200 MVAR – 7 nos., + 300 MVAR- 6 nos.) have
been decided to be installed at various points in the Indian grid to provide
dynamic voltage compensation. However, further action is required in this
direction and more simulation studies and better modelling of RE sources needs
to be done with the help of international cooperation.
Most of the wind generators, being induction type are absorbing substantial
reactive power during startup and some reactive power during normal operating
condition. Due to intermittent characteristic of wind, generator start up takes
place multiple times during a day, resulting in huge quantum of reactive power
absorption from the grid and causing voltage excursions/ voltage stability.
Further, for type-1 and type-2 machines being induction generators can not
participate in voltage regulation and require switched capacitor banks for reactive
compensation. However, type-3 and type-4 wind turbine generators and solar
inverters depend on AC-DC-AC converters which have inherent control of
reactive power.
Measures must be available to mitigate the effects of the variable reactive
generation of power. As a result of this, the dynamic reactive power
compensation i.e. SVC/ STATCOM shall have to be provided at Renewable
Energy pooling station for dynamic voltage support and avoid any undesirable
reactive power flow to or from the grid.
8.2 The day ahead scheduling in India is done for all inter state schedules as per the
Indian Electricity Grid Code on the basis of 15 minutes time blocks. The deviation
between schedule and actual power flow is called Unscheduled Interchange for
which commercial settlement is done as per the Unscheduled Interchange (UI)
rates specified by the Central Electricity Regulatory Commission (CERC). The UI
rates are variable depending on the frequency and the quantum of drawal and
they tend to discourage over drawal and under generation. The day ahead
schedules can also be revised in real time with a prior notice of 60 to 90 minutes.
8.3 Most of the electricity in India is tied up in long term PPAs. After the enactment of
Electricity Act 2003, generation has been liberalised and open access in
transmission has been implemented. Beginning 2004, an electricity market has
Large Scale Grid Integration of RES_ CEA 27evolved starting with bilateral trade between utilities and subsequently trading on
the power exchange has commenced since 2008. The volume of short term
market is about 40 BUs against the gross generation of about 950 BUs. About 50
MUs are traded everyday through totally automated electronic exchange based
on the principle double sided bidding, uniform clearing price and market splitting
in case of transmission congestion very similar to the Nord Pool Power
Exchange. The price on the Indian power exchange is determined 15 minute
wise. The liquidity on the Indian power exchange has lately increased with the
advent of merchant power plants. The National Electricity Policy 2005
recommends 15% merchant capacity in order to create depth in the electricity
market.
8.4 The transmission planning in the country is done through a coordinated process
with the participation of Central Electricity Authority, Central Transmission Utility
(POWERGRID) and the State Transmission Utilities. A number of “Green
Corridors “ have recently been planned to take care of the expansion of wind ,
solar and small hydro in the states of Tamil Nadu, Gujarat, Rajasthan, Karnataka,
Andhra Pradesh, Maharastra, Himachal Pradesh and Jammu & Kashmir. The
transmission system costing about Rs. 32,000 crores (5 billion US $) have been
planned to cater to the needs of about 32 GW RE capacity addition program for
the 12th Plan (2012-17). These systems include both intra state and inter state
transmission system of 132 kV, 220 kV, 400 kV and 765 kV voltage levels.
Details are available at CEA website http://www.cea.nic.in/ps_wing. Major RE
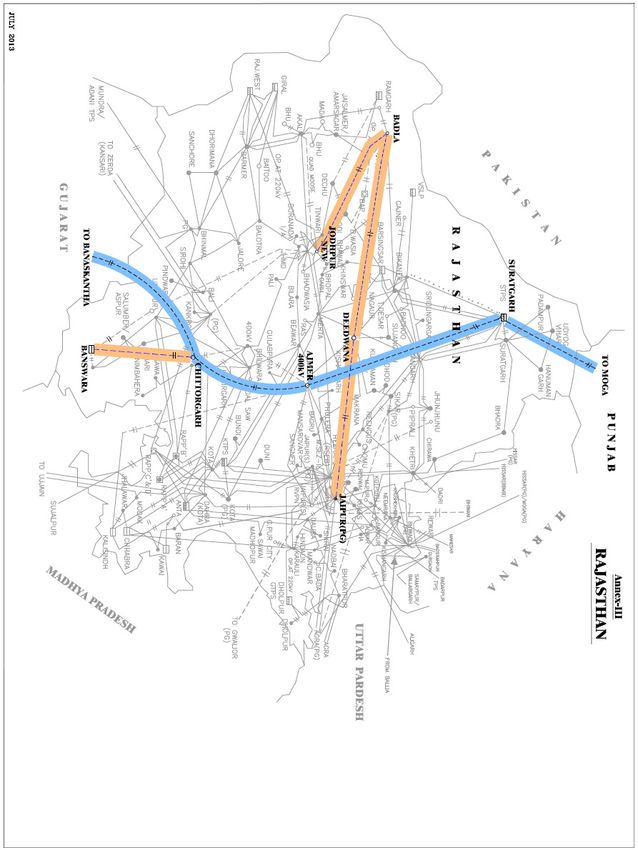
transmission corridors in Gujarat, Rajasthan, Tamil Nadu and Andhra Pradesh
are at Annexure-III.
The existing and the planned transmission facilities are summed up in the tables
below:
Large Scale Grid Integration of RES_ CEA 28Growth of transmission sector
Ach. as on Ach. as on Target
Voltage
Transmission 31.03.2007 31.03.2012 Ach. as on 31.03.2017
(KV) Unit
System Type (End of 10th (End of 11th 30.09.2013 (End of
level
Plan) Plan) 12th Plan)
765 ckm 1704 5250 7910 32250
AC 400 ckm 69174 106819 120693 144819
Transmission
lines 220 ckm 110805 135980 142536 170980
Total ckm 181683 248049 271139 348049
HVDC ckm 5872 9432 9432 16872
Total
ckm 187555 257481 280571 364921
(AC+HVDC)
765 MVA 0 25,000 56500 174000
AC 400 MVA 92942 151,027 170397 196027
Substations
Transformation 220 MVA 156497 223,774 247194 299774
Capacity
Total
MVA 249439 399801 474091 669801
AC
HVDC MW 8000 9750 13500 22500
AC+HVDC 257439 409551 487591 692301
Inter-regional
MW 14050 27750 31850 65550
Capacity
8.5 Given that the penetration of electricity in India is of the order of 70%, there is
tremendous scope for supplementing the resources with RE generation including
distributed micro grids and roof top solar plants. However, due to limited paying
capacity of the people at large and poor financial health of the DISCOMs, the
demand of electricity is sensitive to price. The price of solar energy has come
down by 50% in the last five years due to introduction of competitive bidding for
tariff. However, wind energy continues to be paid preferential or feed in tariff and
as such the price of wind energy has not come down in the last ten years. History
of regulation worldwide bears out that cost plus tariff in generation does not
normally result in reduction in tariff. Further technological breakthroughs and
pressure of competition is required to make RE affordable in India.
8.6 India has a federal setup in respect of electricity wherein each state is
responsible for maintaining its load-generation balance and complying with inter
Large Scale Grid Integration of RES_ CEA 29state grid code (IEGC). There is a provision in the Electricity Act that SERC can
specify the RPO (Renewable Purchase Obligation) on the state distribution
utilities. However, it has to be kept in view that in order to meet any RPO
obligation the state should have requisite renewable balancing capability and
renewable purchase capacity. The all India grid is divided into 28 control areas
interconnected with each other through inter state transmission links and high
capacity corridors. Each state has its own generation sources in addition to the
shared generation resources called inter state generating stations (ISGS). The
induction of RES does not reduce the requirement of conventional sources of
generation which are required to provide backup when the RE power is not
available. Further the introduction of variable RE resources puts pressure on grid
security. State of the art forecasting tools are required to be provided in the RE
rich states in order to improve the quality of forecast for the purpose of
maintaining load-generation balance. Regulatory support is required to
incentivise flexibility of conventional generation sources. The regulations should
compensate the conventional generator for partial operation and start up and
stop costs so that it can perform the balancing function without incurring financial
loss.
8.7 Indian Electricity Grid Code (IEGC) 2010 states that wind energy being of
variable nature, needs to be predicted with reasonable accuracy for proper
scheduling and dispatching of power from these sources in the interconnected
system. Wind generation forecasting can be done on an individual developer
basis or joint basis for an aggregated generation capacity of 10 MW and above
connected at a connection point of 33 kV and above. IEGC specifies the wind
energy forecasting on day ahead basis with 70 % accuracy. If the variation in
actual generation is beyond +/- 30% of the schedule, wind generator would have
to bear the UI charges. For actual generation within +/- 30% of the schedule, no
UI would be payable/receivable by the wind generator. For variation of actual
generation within +/- 30% of the schedule, the host state shall bear the UI
charges which shall be shared among all the States of the country in the ratio of
their peak demands in the previous month based on the data published by CEA,
in the form of a regulatory charge known as the Renewable Regulatory Charge
operated through the Renewable Regulatory Fund (RRF). This provision shall be
Large Scale Grid Integration of RES_ CEA 30applicable with effect from 1.1.2011, for new wind farms with collective capacity
of 10 MW and above connected at connection point of 33 KV level and above ,
and where pooling station was commissioned on or after 3.5.2010 and total
connected generating capacity is 10 MW or above.
The above provision of flexibility in scheduling only provides commercial
compensation to the host states for deviating from the schedule on account of
RES but does not absolve the state SLDC of the responsibility to comply with the
IEGC. Therefore, it is imperative to minimise the deviation by RE generators by
accurate forecasting techniques and revising their schedules at least one to two
hours ahead. If the forecasts are accurate and RE schedules are revised in time
then responsibility of balancing of the host state shall be limited to its own RE
schedule and for the remaining power being exported by the RE rich states the
responsibility of balancing will be passed on to the respective RE buying state.
8.8 CEA Connectivity Standards (2013) for wind and solar generating stations
stipulate that harmonic current injections and flicker introduced shall not be
beyond the limits specified in IEEE Standard 519 and IEC 61000 respectively.
The DC current injection shall not be greater than 0.5% of the full rated output.
The wind generating station shall be capable of supplying dynamically varying
reactive power support so as to maintain power factor within the limits of 0.95
lagging to 0.95 leading. The generating units shall be capable of operating in the
frequency range of 47.5 Hz to 52 Hz and shall be able to deliver rated output in
the frequency range of 49.5 Hz to 50.5 Hz. The wind generating stations
connected to the grid at 66 kV voltage level and above shall have the fault ride
through capability. During the fault/voltage dip, the individual wind generating
units in the generating station shall generate active power in proportion to the
retained voltage and shall maximise supply of reactive current till the time voltage
starts recovering or for 300 ms, which ever time is lower. Please refer Annexure-
II.
8.9 The excursions of grid frequency in India have been brought down progressively
since 2003 after the introduction of penal mechanism of deviation from schedule
known as the UI mechanism. However, this is only a commercial mechanism and
Large Scale Grid Integration of RES_ CEA 31depends on voluntary response by the load and the generators. The permitted
frequency band has been brought down from 49.0-50.5 Hz to 49.7-50.2 Hz.
Nevertheless the grid frequency is not steady and keeps on fluctuating even
though the range of fluctuation has been narrowed The typical excursions of
frequency in a day, in an hour, in 10 minutes and in a minute are depicted below:
Typical frequency excursions in a day
50.3 Hz
49.7 Hz
Typical frequency excursions in an hour
50.3 Hz
49.7 Hz
Large Scale Grid Integration of RES_ CEA 32Typical frequency excursions in 10 minutes
50.3 Hz
49.7 Hz
Typical frequency excursions in a minute
50.3 Hz
49.7 Hz
The frequency excursions are due to the absence of Automatic Generation
Control (AGC). A very large grid of the size of India ought to have steady
frequency with turbine speed governors giving primary response followed by
secondary response from spinning reserves, back up reserves and fast acting
load shedding contracts. This would require the introduction of AGC, extensive
Large Scale Grid Integration of RES_ CEA 33preparation and a well designed plan for which international consultant could be
roped in. Basically, in the event of introduction of AGC each control area/state
would become a tight control area and area control error would have to be
determined by applying frequency correction to unscheduled interchange.
8.10 India has huge hydro power potential and storage type hydro plants are suitable
for providing balancing service. The hydro turbine design should be of the Pelton
wheel type, wherever possible, since the generation from this type of hydro
generator can vary easily from zero to full capacity. Pumped storage power
plants should be encouraged as they provide effective tool for grid balancing.
Presently, out of nine (9) plants of 4,785 MW capacity, only five (5) plants of
2,600 MW total capacity are working as pumped storage. Two plants i.e. Tehri-II
(100 MW) and Koyna LB (80 MW) are under construction. Survey and
Investigation of three plants is in progress these are – Malshej Ghat
(Maharashtra 700 MW), Humbarli (Maharashtra, 400 MW) and Turga (West
Bengal, 1000 MW). Further, a potential of about 92,000 MW of pumped storage
plants was assessed in 90s. Please refer Annexure-I.
8.11 India has a gas based combined cycle capacity of the order of 20,000 MW and
another 8000 MW capacity is ready for commissioning. However, due to shortage
of gas the new capacity has been stranded and the existing plants are running at
very lower plant load factor of less than 30%. The option of running these plants
with imported LNG does not appear to be economically viable. In such a scenario
one cannot conceive gas based capacity contributing towards balancing the grid
even though gas based plants have a high ramping rate and are suitable for such
purpose.
8.12 In view of above India has to use its coal based generating capacity of the order
of 135,000 MW for balancing the variation of RE generations as already been
practised by Tamil Nadu, Rajasthan and Gujarat. The variability (without oil
support) of older 200 MW thermal plants can be restored to 70-100 % from the
present by improving their control systems. The new plants such as supercritical
units can be varied from 50 -100% without oil support.
Large Scale Grid Integration of RES_ CEA 349.0 Way Forward
9.1 In order to deal with variability of renewable generation forecasts are crucial for
resource adequacy during operation and grid security.
9.2 Each state should assess its balancing capacity and enter into RE purchase
obligation accordingly. Based on the status of measures available with the state,
they should assess their present capacity to balance the combined variability of
load & RE generation,
9.3 The respective buyer State of RE power shall be responsible for maintaining its
load-generation balance taking into account the revised forecasts of their RE
portfolios. In order to save time in revision of schedules, the
SLDCs/RLDC/NLDC, as the case may be, would suo-motu revise the RE
schedule of a state based on inputs from the host REMC/SLDC. In this manner
the responsibility of RE balancing would be shared by all the RE purchasing
states.
9.4 The present power exchange provides only one opportunity for buying and
selling on day ahead basis. Real time markets (i.e the opportunity to buy and sell
power about two hours ahead) should be started to provide a platform for selling
surplus power or buying power when in deficit. 10 -15 % merchant capacity in
generating plants as per the National Electricity Policy may be useful for
providing liquidity in the electricity market.
9.5 Technical and regulatory measures to enhance the flexibility of conventional
generation to increase the balancing capacity of the grid.
9.6 Establishment of Renewable Energy Management centers (REMC) equipped
with advanced forecasting tools, smart dispatching solutions, real time monitoring
of RE generation, closely coordinating with SLDC/RLDC should be provided.
9.7 Wind farms may also be set up through competitive bidding in order to reduce
tariff.
9.8 It is necessary that healthiness of grid protection schemes through regular
monitoring and updating is ensured.
9.9 International cooperation for developing REMCs in the RE rich states, balancing
capabilities using indigenous sources of conventional power, optimum
Large Scale Grid Integration of RES_ CEA 35development of enabling transmission infrastructure and capacity building of grid
operators has become necessary at this stage of RE development.
10.0 Renewable Energy Management Centers (REMCs)
10.1 Renewable Energy Management Centers (REMCs) at State, Regional and
National level should be co-located with respective Load dispatch centers (LDC)
and integrated with real time measurement and information flow. There should be
a hierarchical connection between the state Load Dispatch Centre, Regional
Load Dispatch Centre and National Load Dispatch Centre.
10.2 The REMC may have following functions:
i. Forecasting of RE generation in jurisdiction area on day-ahead, hour-ahead,
week-ahead, month-ahead basis.
ii. Real time tracking of generation from RE sources
iii. Geo-spatial visualization of RE generation
iv. Close coordination with respective LDC for RE generation and control for
smooth grid operation.
v. Single source information repository and coordination point for RE
penetration.
10.3 Forecasting should be done by the REMC:
(i) cluster-wise for determination of power flows on intra-State network,
(ii) the state as a whole to predict power flow at the inter-state boundary
(iii) forecasting its own RE portfolio for maintaining the load-generation
balance of the host state
(iv) forecasting the RE portfolio of other states who have contracted RE power
from the host state.
10.4 Forecasting by the state REMC would be passed on to the state SLDC, which
would be used for scheduling. In case RE power is being sold by RE generators
located in a wind-rich state to another state, the revision of schedule, based on
forecast, as mentioned above, would have to be done for the host and
purchasing state at their respective state boundaries. The SLDC of the host state
would pass the schedule to the concerned RLDC for scheduling of wind
generation at the states boundaries. In case the host state and purchasing state
lie in different regions, the RLDC of the host region will inform the NLDC, who will
Large Scale Grid Integration of RES_ CEA 36schedule power at the regional boundaries of the two states. This would lead to
allocation of balancing responsibility among the States to the extent of their
shares in the RE power. Since the forecast is being done by the host State, the
cost of forecasting would be shared by the purchasing States.
Large Scale Grid Integration of RES_ CEA 37Drafting Committee
1. Smt. Neerja Mathur, Chairperson, CEA ( chair@nic.in )
2. Shri Ravinder, Member(Power System), CEA (ravinders.only@gmail.com)
3. Shri Pankaj Batra, Chief Engineer (I/C), RA Division, CEA
(pan_batra@hotmail.com)
4. Shri Pardeep Jindal, Director (SP&PA), CEA ( jindal_pardeep@yahoo.co.in)
Acknowledgements
The drafting committee thankfully acknowledges the valuable inputs and
suggestions from the following:
1. Shri Shailendra Agarwal, CMD, RRVPNL and SLDC Rajasthan
2. Shri S.K. Negi (MD, GETCO) and Shri BB Mehta CE(SLDC), Gujarat
3. Shri S. Akshay Kumar, Director (Trans), TANTRANSCO and SLDC, Tamil
Nadu
4. Shri Y.K. Sehgal, COO(CTU), PGCIL
5. Shri S.K. Soonee, CEO, POSOCO
6. Dr. Subir Sen, GM, PGCIL
Bibliography
1. “Green Corridors” Report of POWERGRID, INDIA.
2. National Electricity Policy, Govt. of India
3. National Electricity Plan ,Govt. of India
4. A white paper on “Grid Integration of Large-Capacity Renewable Energy
Sources and use of large Capacity Electrical Energy Storage- October 2012
5. The Impact of Wind Power on European natural Gas markets- International
energy Agency - WORKING PAPER
6. Indian Electricity Grid Code
7. Integrating Variable Renewable Energy in Electric Power Markets: Best
Practices from International Experience: Jaquelin Cochran, Lori Bird, Jenny
Heeter, and Douglas J. Arent.
8. Western Governors’ Association - Meeting Renewable Energy Targets in
the West at Least Cost: The Integration Challenge, Project Manager and
Editor: Lisa Schwartz. Authors:Kevin Porter, Christina Mudd, Sari Fink and
Jennifer Rogers – Exeter Associates; Lori Bird – National Renewable Energy
Laboratory; Lisa Schwartz, Mike Hogan and Dave Lamont – Regulatory Assistance
Project; Brendan Kirby – Consultant
Large Scale Grid Integration of RES_ CEA 38Annexure – I
Note on Development of Pumped Storage Plants (PSP) in India
1. Background:
Pumped Storage Plants are playing an increasingly important role in providing
peaking power and maintaining system stability in the power system of many of
the developed countries. The base load requirements are generally met by
thermal and / or nuclear generating plants whereas peaking loads are often met
from conventional hydro projects along with pumped storage plants. The decline
of available sites in a conventional hydro-electric generation makes the
development of pumped storage plants relevant. Pumped storage plants are also
relevant when the availability of water decreases in the river system due to
upstream consumptive uses.
The original concept behind the development of pumped storage plants was the
conversion of relatively low cost off peak energy generated in thermal plants into
high value peak power. Pumped storage plants improve overall economy of
power system operation, increase capacity utilization of thermal stations and
reduce operational problem of thermal stations during light load period. The other
advantages of pumped storage development are availability of large reactive
capacity for regulation, availability of spinning reserve at almost no cost to the
system regulating frequency to meet sudden load changes in the network. The
fact that energy gained from the pumped storage development is always less
than energy input should not obscure the fact that this loss to the system is small
when compared with substantial savings in the fuel which are made when these
stations are operated in an integrated manner.
2. Development of Pumped Storage Plants in India:
2.1 Potential Assessed:
Reassessment studies carried out by CEA during 1978-87 identified 63 sites for
pumped storage plants (PSP) with total installation of about 96,500 MW with
individual capacities varying from 600 MW to 2800 MW. Out of these, 7
Pumped Storage Plants with an installation of 2604 MW were under operation /
construction at the time of re-assessment study.
Region wise / state wise distribution of potential sites identified for installation of
pumped storage schemes is given below:
Large Scale Grid Integration of RES_ CEA 39Sl. Region / State Probable Installed
No. Capacity (MW)
Northern
1 Jammu & Kashmir 1650
2 Himachal Pradesh 3600
3 Uttar Pradesh 4035
4 Rajasthan 3780
Sub-Total 13065
Western
1 Madhya Pradesh 11150
2 Maharashtra 27094
3 Gujarat 1440
Sub-Total 39684
Southern
1 Andhra Pradesh 2350
2 Karnataka 7900
3 Kerala 4400
4 Tamil Nadu 3100
Sub-Total 17750
Eastern Region
1 Bihar 2800
2 Orissa 2500
3 West Bengal 3825
Sub-Total 9125
N. Eastern Region
1 Manipur 4350
2 Assam 2100
3 Mizoram 10450
Sub-Total 16900
Total 96524
Large Scale Grid Integration of RES_ CEA 40Western region has the largest potential (about 41% of the total) for development
of pumped storage plants. This is mainly due to the topographical features with
steep gradients of the rivers originating from the Western Ghats.
2.2 Pumped storage plants in operation:
At present 9 pumped storage schemes with aggregate installed capacity of
4785.6 MW are in operation in the country. Out of these, only 5 No. of plants with
aggregate installed capacity of 2600 MW are being operated in pumping mode.
The details of these schemes along with the reasons for the remaining plants not
being able to operate in pumping mode are given below:
S. Name of Installed Capacity Pumping Reasons for
No. Project / State Mode not working in
No. of
Operation Pumping mode
units x Total
MW (MW)
1 Kadana St. I&II 2x60+2x60 240 Not Due to vibration
Gujarat working problem
2 Nagarjuna 7x100.80 705.60 Not Tail pool dam
Sagar Andhra working under
Pradesh construction
3 Kadamparai 4x100 400 Working -
Tamil Nadu
4 Panchet Hill - 1x40 40 Not Tail pool dam
DVC working not constructed
5 Bhira 1x150 150 Working -
Maharashtra
6 Srisailam LBPH 6x150 900 Working -
Andhra
Pradsesh
7 Sardar Sarovar 6x200 1200 Not Tail pool dam
Gujarat working not constructed
8 Purlia PSS 4x225 900 Working -
West Bengal
9 Ghatgar 2x125 250 Working -
Maharashtra
Total 4785.60
Large Scale Grid Integration of RES_ CEA 412.3 Pumped storage plants under construction:
At present, 2 Pumped Storage Plants with aggregate installed capacity of 1080
MW are under construction in the country as given below:
S. No. Name of Project / Installed Capacity
State
No. of units x Total I.C. (MW)
MW
1 Tehri St.-II - 4x250 1000
Uttarakhand
2 Koyna Left Bank – 2x40 80
Maharashtra
Total 1080
These Plants are likely to give benefits in 13th Plan.
2.4 Pumped Storage Plants being taken up for development in India:
Detailed Project Report of one no. pumped storage scheme with installed
capacity of 500 MW has been returned to the state authorities for re-submission
after taking into account the comments of CEA and CWC as given below:
Sl. Name of the State Installed Remarks
No. Scheme Capacity
(MW)
1. Kundah Tamil Nadu 500 DPR returned due to non-
resolution of inter-state
aspects.
Further, 3 pumped storage plants with aggregate installed capacity of 2100 MW
are under Survey & Investigation in the country. Details of these schemes are
given below:
Sl. Name of the State Installed Remarks
No. Scheme Capacity
(MW)
1. Malshej Ghat Maharashtra 700 DPR prepared by THDC.
Implementation
Large Scale Grid Integration of RES_ CEA 42Sl. Name of the State Installed Remarks
No. Scheme Capacity
(MW)
agreement to be signed.
2. Humbarli Maharashtra 400 Under Survey &
Investigation by THDC for
preparation of DPR.
3. Turga West Bengal 1000 Under Survey &
Investigation by WAPCOS
for preparation of DPR
TOTAL 2100
In addition, two PSP namely Mara (1100 MW) and Binauda (2250 MW) were
earlier considered by Madhya Pradesh for development.
3. Issues / Action Points:
• Since the energy gained from Pumped Storage Plants (PSP) is less than
the energy input, it is necessary that off-Peak power to be used as input
may be available at reasonable tariff for making the Pumped Storage Plant
commercially viable.
• As brought out in para 2.2 above, the tail pool dam for Panchet Hill (40 MW)
and Sardar Sarovar (1200 MW) need to be constructed at the earliest. The
vibration problem in Kadana PSP (240 MW) also needs to be resolved.
• The resolution of Inter-State aspects in case of Kundah PSP in Tamil Nadu
needs to be taken up.
• Implementation Agreement needs to be signed for development of Malshej
Ghat PSP (700 MW) in Maharashtra.
• The Survey & Investigation on Humbarli PSP (400 MW) in Maharashtra and
Turga PSP (1000 MW) in West Bengal needs to be completed at the
earliest for taking up these projects for development.
• Survey & Investigation and preparation of DPR needs to be taken up for
Mara PSP (1100 MW) and Binauda PSP (2250 MW) in Madhya Pradesh
expeditiously.
-----x--------x--------x------
Large Scale Grid Integration of RES_ CEA 43Annexure-II
(Published in the Extraordinary Gazette of India, Part III section 4)
Government of India
Ministry of Power
(Central Electricity Authority)
Notification
New Delhi, dated the 15th October, 2013
No.12/X/STD(CONN)/GM/CEA. – Whereas the draft of the Central Electricity
Authority (Technical Standard for Connectivity to the Grid) (Amendment) Regulations,
2012 were published, under sub-section (3) of section 177 of the Electricity Act, 2003
(36 of 2003) and rule 3 of the Electricity (Procedure for previous Publication) Rules,
2005 on 16th march, 2012;
Now, therefore, in exercise of powers conferred by section 7 and clause (b) of
section 73 read with sub-section (2) of section 177 of the Electricity Act, 2003, the
Central Electricity Authority hereby makes the following regulations to amend the
Central Electricity Authority (Technical Standards for Connectivity to the Grid)
Regulations, 2007 , namely:--
1. Short title and commencement. - (1)These regulations may be called the
Central Electricity Authority (Technical Standards for Connectivity to the Grid)
Amendment Regulations, 2013.
(2) These Regulations shall come into force on the date of their publication in
the Official Gazette .
2. In the Central Electricity Authority (Technical Standards for Connectivity to the
Grid) Regulations, 2007 (hereinafter referred to as the said regulations), in regulation
2, -
(a) for clause (10) the following clause shall be substituted, namely :-
“Earthing” means electrical connection between non-energized conducting
parts and the general mass of earth by an earthing device”;
(b) in clause (14) the following paragraph shall be added at the end, namely:-
“In case of Solar Photo voltaic generating station, each inverter along with
associated modules will be reckoned as a separate generating unit”;
(c) for clause (17) the following clause shall be substituted, namely:-
"Interconnection point" means a point on the grid, including a sub-station or a
switchyard, where the interconnection is established between the facility of the
Large Scale Grid Integration of RES_ CEA 44You can also read