Measurements of spatial variability of sub-micron particle number concentrations perpendicular to a main road in a built-up area - Schweizerbart ...
←
→
Page content transcription
If your browser does not render page correctly, please read the page content below
B      Meteorol. Z. (Contrib. Atm. Sci.), Vol. 30, No. 4, 315–331 (published online June 28, 2021)
       © 2021 The authors
                                                                                                        Environmental Meteorology

Measurements of spatial variability of sub-micron particle
number concentrations perpendicular to a main road in a
built-up area
Sabine Fritz∗ , Sebastian Schubert and Christoph Schneider

Geography Department, Humboldt-Universität zu Berlin, Berlin, Germany
(Manuscript received August 24, 2020; in revised form March 26, 2021; accepted March 29, 2021)

             Abstract
             A six-week field study was conducted to determine spatial and temporal variability of sub-micron (diameter
             range 10–1000 nm) particles perpendicular to a main road in the city of Berlin, Germany. Measurements
             were carried out on 17 days with overall 72 runs along a 250 m almost untraveled footpath. Particle number
             concentration (PNC) as well as the share of local sources were analyzed in relation to the distance to the
             road, wind speed and wind direction. This study aims to detect patterns of PNC dispersal along the footpath
             with increasing distance from the road in a built-up urban environment and to identify impact factors. In the
             majority of cases, results can be expressed well in terms of an exponential decrease of PNC with increasing
             distance from the road. Traffic flow along the main road has a substantial impact on concentration levels.
             About 30 % of the PNC at the roadside and 15 % at a distance greater than 100 m can be attributed to traffic.
             Variations in background concentrations, however, contribute the largest share to concentration levels.
             Keywords: air quality, ultrafine particles, spatial distribution, traffic impact, ambient concentration, observa-
             tional data, observation campagnes

1 Introduction                                                               deposition efficiency and the ability to enter the blood
                                                                             stream directly (Hertel et al., 2010; ICRP, 1994).
Issues of air quality are of high relevance within cities.                       While there are legal limit values for particle mass
The impact of particulate matter on human morbidity                          in the form of PM10 and PM2.5 (particulate matter of
and mortality has been well documented (Atkinson                             the listed maximum aerodynamic diameter in µm) in
et al., 2015; Pope and Dockery, 2006), especially the                        most countries around the world, there are no regula-
impact of traffic-induced particles (Khreis et al., 2016).                   tions for PNC, even though sub-micron particles, and
Cities not only comprise a large part of the popula-                         amongst those mainly ultrafine particles (UFP), are the
tion affected by poor air quality, they are also produc-                     main component by particle numbers (Baldauf et al.,
ers of PNC especially by means of combustion pro-                            2016). Sub-micron particles make up the majority of
cesses caused by traffic and domestic combustion (Ku-                        the total particle number (PN). Particles of 6–100 nm
mar et al., 2014; Kukkonen et al., 2016), though back-                       in diameter have been found to account for up to 86 %
ground photochemical processes can contribute to a di-                       (Salma et al., 2014), particles of 5–300 nm in diameter
urnal change in PNC especially in summer as well (Ar-                        even for 99 % (Kumar et al., 2009a) of the PN. PM10
gyropoulos et al., 2016; Kumar et al., 2014; Ma and                          and PM2.5 do not correlate well with PNC (Hagler
Birmili, 2015). Those urban sources, and in particular                       et al., 2009; Birmili et al., 2013a; Grundström et al.,
road traffic, contribute to air quality deterioration not                    2015), and thus cannot generally serve as a proxy for es-
only in terms of quantity but also, and especially, be-                      timating PNC. Combustion processes are a main source
cause of their particular chemical composition (Chen                         for UFP or provide the vapors that nucleate into UFP.
et al., 2016). Recently, the focus of research as well as                    Those smaller particles can then coagulate to become
public interest shifted more and more towards smaller                        bigger particles or they grow in size due to conden-
particles, since they can penetrate further into the body                    sation of gases onto the particles. These particles and
(ICRP, 1994). Due to their small size, sub-micron and                        the associated processes are named accumulation mode
ultrafine particles (UFP, particles smaller than 100 nm)                     with particles in the size range 100 nm–1000 nm (Ku-
can be especially harmful due to their large ratio of sur-                   mar et al., 2008). Those processes as well as meteoro-
face area to volume, and thus a high reactivity (Chen                        logical conditions result in highly spatially and tempo-
et al., 2016). Further, these particles show a high lung                     rally variable PNC.
                                                                                 Previous studies near highways in environments
∗ Corresponding author: Sabine Fritz, Geography Department, Humboldt-        without a large number of obstacles in the vicinity show
Universität zu Berlin, Unter den Linden 9, 10999 Berlin, Germany, e-mail:    an exponential decay of PNC with increasing distance to
sabine.fritz@geo.hu-berlin.de                                                the road with background concentrations not yet reached

                                                                                                                         © 2021 The authors
DOI 10.1127/metz/2021/1058                                   Gebrüder Borntraeger Science Publishers, Stuttgart, www.borntraeger-cramer.com
316               S. Fritz et al.: Particle number concentrations perpendicular to a main road            Meteorol. Z. (Contrib. Atm. Sci.)
                                                                                                                                  30, 2021

Figure 1: Left: Map of the study area with the location of the measurement points (blue); inset map of Berlin showing the location of the
study area (blue dot); data basis: Environmental Atlas Berlin. Right: Photo of study site with the approximate locations of the measurement
points (blue dots) along the footpath.

at distances as far as 100 to 300 m (He and Dhaniyala,                  local from background concentrations. Differences be-
2012; Zhu et al., 2002). Within cities, the measurements                tween stationary and moving traffic during traffic light
of PNC at intersections (Goel and Kumar, 2016) or in                    phases are evaluated near the road and the correlation
street canyons (Kumar et al., 2008; Weber et al., 2013)                 between traffic flow and PNC is determined. Differences
show high levels of PNC due to the proximity to traffic                 of wind speed and wind direction on the overall PNC
as a prominent source of particles. Bonn et al. (2016)                  concentrations during the measurements are assessed as
showed that for Berlin sources of PNC are mostly lo-                    well as the link between different wind directions and
cated within the city and can be attributed mainly to on-               concentration levels along the footpath. An exponential
road traffic.                                                           decline model is fitted to the observed concentration dif-
    The study thus transfers the study design of studies                ferences along the footpath. However, this study aims to
on highway situations to the city of Berlin with a main                 provide insights into the average PNC distribution dur-
road as the center as well, but with urban structures and               ing the day, rather than trying to find highest short-time
conditions in the immediate vicinity. The build-up en-                  observations e.g. during rush-hour. It will thus provide a
vironment creates different micro environmental condi-                  basis for modelling average exposition situations in sub-
tions for PNC dispersal than the open areas of study sites              sequent applications.
outside of city limits. Within the German research pro-
gram “Urban climate Under Change” ([UC]2 ) (Scherer                     2 Methods
et al., 2019b) in the project “Three-dimensional Ob-
                                                                        2.1 Study area
servation of Atmospheric Processes in Cities” (3DO)
(Scherer et al., 2019a) a measurement campaign was                      The study area (Fig. 1) is located in the center of Berlin,
carried out along a 250 m long footpath perpendicular                   in the vicinity of “Straße des 17. Juni”, hereafter referred
to a main road. The study focuses on a built urban en-                  to as “main road”. It is a six lane road with one addi-
vironment and investigates the immediate vicinity of a                  tional lane for parking and an average daily traffic vol-
main road along a footpath open exclusively to supply                   ume of 37 260 vehicles (Senate Department for Ur-
traffic and pedestrians. We analyze spatial variation in                ban Development and Housing Berlin, 2017). The
sub-micron PNC with increasing distance to a main road                  main street is aligned in West–East direction which is
as well as temporal variability between the measurement                 also the predominant wind direction in Berlin with west-
runs.                                                                   erly and easterly winds (Lenschow et al., 2001).
    This paper shows spatial variability of the sub-                        The footpath with the measurement points is located
micron PNC along the footpath and temporal variabil-                    perpendicular to the main road toward North. It is sur-
ity between the measurement runs. The impact of road                    rounded by university buildings with traffic being re-
traffic along the footpath is assessed by distinguishing                stricted to delivery vehicles. Due to the heterogeneity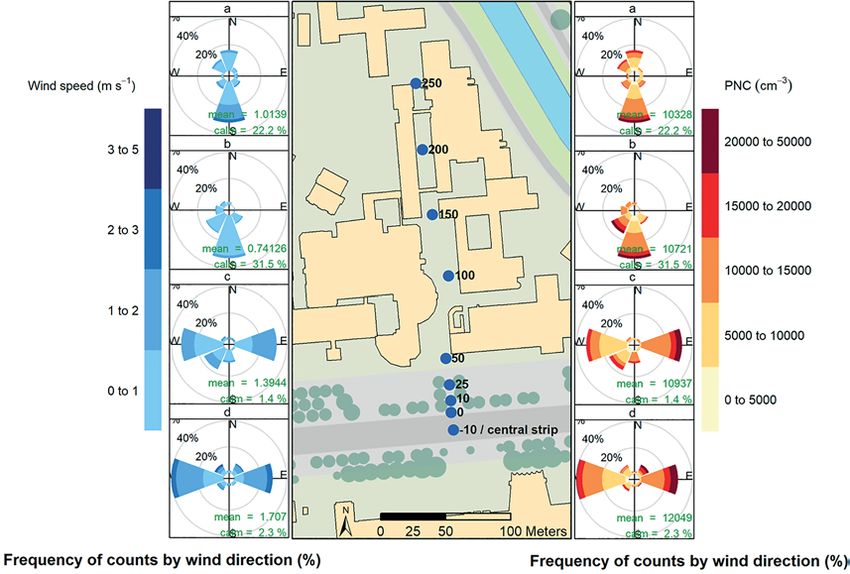
Meteorol. Z. (Contrib. Atm. Sci.) S. Fritz et al.: Particle number concentrations perpendicular to a main road 317
30, 2021
of the surrounding area, nine measurement points were
chosen along the footpath. The first one is located on
the central strip of the main road, hereafter referred to
as −10 m. The others are at a distance of 0 m, 10 m, 25 m,
50 m, 100 m, 150 m, 200 m, 250 m from the curb. The
first three points are located on an open area in front of
the surrounding buildings close to the main road. They
are most likely less affected by surrounding buildings.
The point at 50 m distance is located at the transition be-
tween road space and built-up area. The points at 100 m
to 200 m distance are located between buildings in close
proximity, with a width of the footpath of approximately
13 m. At the 100 m and 250 m points, small intersec-
tions of walkways cross the footpath. Before and after
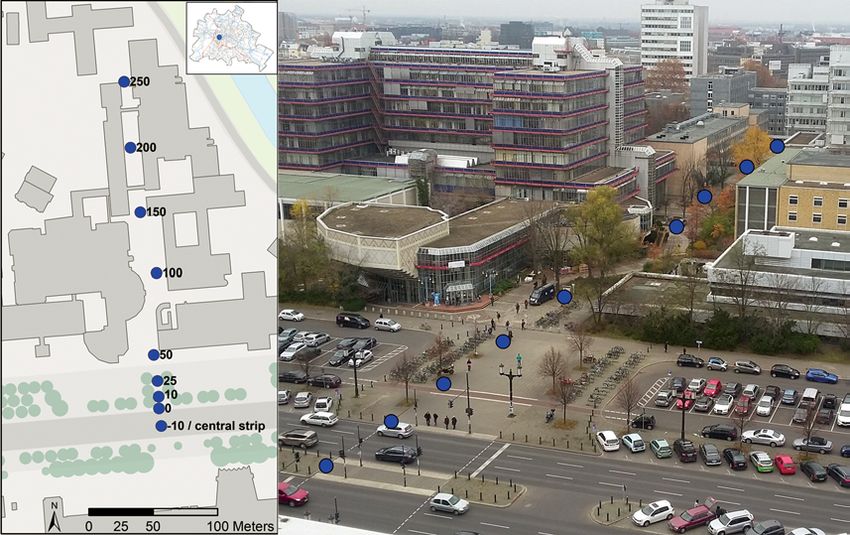
the measurement point at 200 m, the map shows narrow Figure 2: Setup for mobile measurements. Bike trailer as plat-
building parts crossing the footpath. These are enclosed form including a TSI 3007 condensation particle counter and a
footbridges that connect the building parts. The loca- Kestrel 5000 for wind measurements.
tion at 250 m is surrounded by buildings on three sides
with a small walkway toward the West. At the measuring
point 250 m, a difference in height between the ground- Total PNC was measured with a condensation par-
level footpath and the area north of the measuring point, ticle counter (TSI CPC 3007). It provides a particle
located at a 3 m lower level, is bridged by a ramp. Here, size range of 10–1000 nm and an accuracy of ±20 % as
the footpath is offset from the north by a walkway be- specified by the manufacturer with isopropyl alcohol as
low it. A small elevation of 30–50 cm height is located working fluid. The device was calibrated before and af-
between points 50 m and 100 m. ter the measurement campaign against a GRIMM EDM
The study area comprises a typical urban situation 465 UFPC, and during the campaign against the mea-
for pedestrians in Berlin. In the immediate vicinity of surement setup of Forschungszentrum Jülich (Scherer
the main road, there is a rather open space with light et al., 2019a). PNC was recorded with a one-second res-
greenery and high traffic volumes. Adjacent to this is olution with the air inlet at a height of 1.30 m above
a densely built-up and partly green space with a non- ground and a 0.9 m antistatic stainless steel pipe con-
uniform building structure. The footpath opens up some nected to the condensation particle counter (CPC). Flow
areas for pedestrians with places to spend time. The checks were carried out before and after the campaign.
contrast between a heavily trafficked road and an al- Zero checks were performed before each pair of con-
most traffic-free footpath puts the focus on the main road secutive runs. Concentrations above 100 000 cm−3 (less
as the presumed main source of PNC emissions. than 0.2 % of the data) were set to 100 000 cm−3 , the
device’s largest reliable measurement, instead of using
2.2 Instrumentation a correction as proposed in Hankey and Marshall
(2015) or Westerdahl et al. (2005). The exact values
Measurements were carried out during a six-week cam- of very high measurements are of little relevance in this
paign between 18 July and 25 August 2017 on 15 work- study due to the use of the median as the predominant
days and 2 weekend days. The measurements took place average value and the 95th percentile as proxy for high
on days without precipitation and with a focus on situ- values. The minimum PNC recorded was 2721 cm−3 .
ations with low wind speeds. Overall 72 runs were car- Wind speed was measured with a combined wind
ried out totaling 32 hours of monitoring. The first four instrument of the manufacturer Kestrel (Kestrel 5000)
runs were carried out after the typical morning rush including a rotating vane located at 1.3 m above the
hour for weekdays in Berlin (Schneidemesser et al., ground. The time resolution was two seconds. Accuracy
2018). Morning runs started at 930 LT (local time) and is the greater value of either ±0.1 m/s or ±3 %, the spec-
1000 LT, midday runs between 1230 LT and 1330 LT. ification range is 0.6–40 m/s. Wind direction was docu-
Since the focus of the study was on non-rush-hour sit- mented manually as a three-minute average. Calms were
uations, only on three days evening runs were carried recorded when no predominant wind direction was dis-
out during rush-hour at 1730 LT and 1800 LT. Each run cernible. Wind measurements were performed simulta-
lasted for about 30 min. Two runs were carried out con- neously and at the same measurement height as the PNC
secutively in reverse order of the measurement points. measurements in order to capture short-term and small-
The measurement period at each location was three min- scale variations in the prevailing wind during the runs.
utes to cover a sufficiently long period of time to allow During each measurement run, two traffic counts at
for an adjustment of short-term variability. All instru- the main road were conducted over a five-minute pe-
ments were mounted on a manually operated modified riod each. They were carried out simultaneously with the
trailer (Fig. 2). Time synchronization of all devices was PNC and wind measurements at the points on the cen-
carried out before each pair of consecutive runs. tral strip up to the distance of 50 m. Thus, traffic counts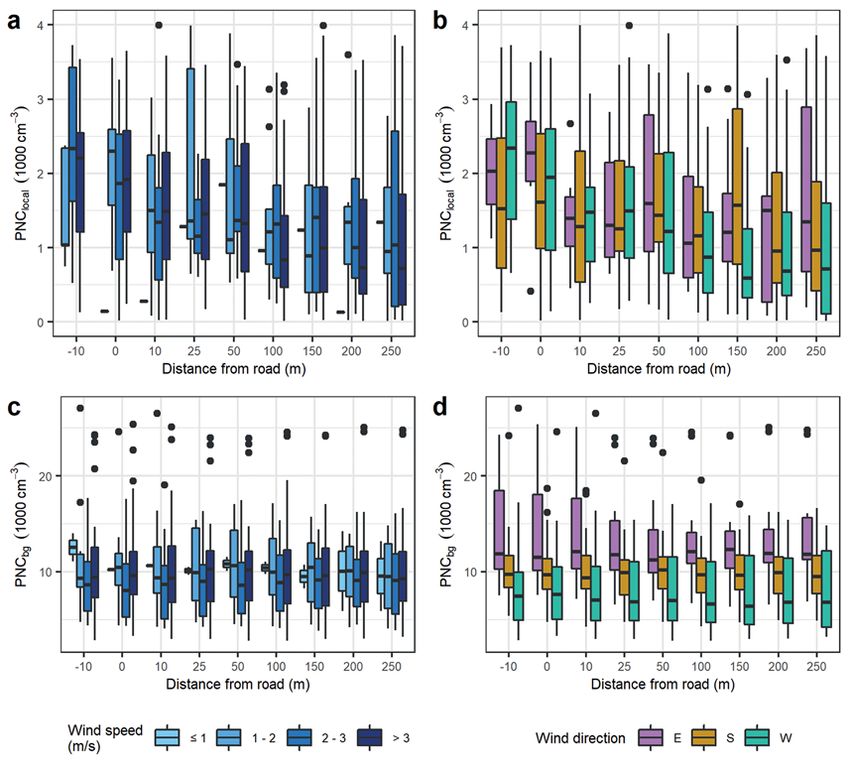
318            S. Fritz et al.: Particle number concentrations perpendicular to a main road          Meteorol. Z. (Contrib. Atm. Sci.)
                                                                                                                             30, 2021

were performed over this maximum period of time in                      For the assessment of the impact of spatial ver-
order to compensate for short-term changes. The counts               sus temporal variability, the dispersion measures stan-
were split into two samples per run to check for vari-               dard deviation (sd), interquartile range (IQR) and the
ability over time. All in all, 144 manual traffic counts             range (R) were calculated on the basis of PNCmedian . For
were carried out. Vehicles were allocated into the cat-              the analysis of temporal variability between the runs, the
egories “small vehicles” (vehsmall , vehicles up to 3.5 t)           mean dispersion was calculated for each measurement
and “big vehicles” (vehbig , vehicles heavier than 3.5 t).           point over all runs. For the analysis of the spatial vari-
A total of 54 traffic light phases on the main road were             ability, the mean dispersion was calculated for each run
documented on 9 days.                                                over all measurement points.
   As a reference station, wind speed and wind direction
data was taken from a nearby weather station of Tech-                2.5 PNC and traffic
nische Universität Berlin. It is located on the building
across the main road opposite to the start of the foot-              A category “all vehicles” was calculated as the sum of
path. Wind data was recorded with an IRGASON from                    small and big vehicles. Traffic flow q was calculated
Campbell Scientific as a 30-minute mean at a height of               in vehicles per hour for each category. PNC for traf-
56 m above ground (Scherer et al., 2019a). These wind                fic light phases were calculated for both stationary and
measurements were used to represent the incident flow.               moving traffic respectively, and averaged as the median
                                                                     per run. Background concentrations (PNCbg ) were cal-
                                                                     culated as the 5th percentile of PNCobs per run over
2.3 Data handling                                                    all distances, similar to the approach of Hankey and
For the comparison of weekdays vs. weekends and time                 Marshall (2015) and Bonn et al. (2016). In accor-
of day, all data were aggregated by weekday (Mon–Fri)                dance with van Poppel et al. (2013) and Lenschow
or weekend (Sat–Sun) or time of day (morning, mid-                   et al. (2001), local PNC (PNClocal ) were calculated as
day, evening), respectively, prior to subsequent statisti-                         PNClocal = PNCmedian − PNCbg .               (2.1)
cal analysis. Data analysis was conducted using R, ver-
sion 3.6.1 (R Core Team, 2018). R package system tidy-               By determining the background concentration as the
verse (Wickham, 2017) was used including dplyr 0.8.3                 5th percentile of PNCobs and calculating the median
for statistical analysis and ggplot2 3.2.1 for visualization         per measurement point, no negative values occurred
of results unless otherwise indicated. The exponential fit           for PNClocal . Local PNC were also used to adjust
was done using nlsLM from the minpack.lm 1.2-1 pack-                 for temporal differences in background concentrations.
age (Elzhov et al., 2016). The package circular 0.4-93,              Shares φ of local PNC in total PNC were calculated as
was used for wind direction arithmetic. Wind roses
                                                                                        φ = PNClocal /PNCmedian .               (2.2)
and pollutant roses were extracted using openair 2.6-6
(Carslaw and Ropkins, 2012).
                                                                     2.6 Analysis for impact of wind on PNC
2.4 Temporal and spatial variability of PNC                          For the analysis of the impact of wind on PNC, we used
                                                                     PNC expressed in terms of PNCmedian , wind speed in
The median, arithmetic mean, 5th and 95th percentile,                terms of its mean and wind direction in terms of its
standard deviation, interquartile range (IQR) and me-                circular mean (Agostinelli and Lund, 2017). From the
dian absolute deviation (MAD) as well as outliers were               TU reference wind dataset, the averaged data was used
calculated over all data. Outliers were defined by the               where the measurement interval overlapped that of a run.
Tukey method (Tukey, 1977) as values above 1.5 times                     Frequency of counts per wind direction were calcu-
the IQR of the 75th percentile as well as below 1.5 times            lated, using wind speed for wind roses and PNC for pol-
the IQR of the 25th percentile. There were only out-                 lutant roses. Wind direction for the roses was classified
liers above the upper whisker in the data. The use of                in 45° angles. Due to their similar patterns (Figure A1),
percentiles was applied in order to give less priority to            measurement points were aggregated as follows for the
extreme values of very short duration (van Poppel et al.,            analysis of differences within the footpath: −10 to 10
2013).                                                               as “near the road”, 25 as “entrance to footpath”, 50 and
    For the evaluation of the variability of PNC with in-            100 as “front part of footpath” and 150 to 250 as “rear
creasing distance to the road, the observed data (PNCobs )           part of footpath”. Calms were declared for wind speeds
was aggregated at each measurement point and run to                  at 0 m/s. For the analysis of the impact on wind speed
calculate the 5th (PNCperc5 ) and 95th (PNCperc95 ) per-             and wind direction on background and local concentra-
centile as well as the median (PNCmedian ) and arithmetic            tions, wind directions were classified in 90° angles.
mean (PNCmean , hereafter referred to as “mean”). For
the analysis of the average PNC along the footpath, the              2.7 Modelling spatial variability of PNC along
arithmetic mean of the statistical parameters was then                   the footpath
calculated over all runs for each measurement point. The
standard deviation of each statistical parameter was cal-            In order to quantify the behavior of PNC along the
culated as a measure of dispersion between runs.                     footpath in terms of the characteristic parameters of an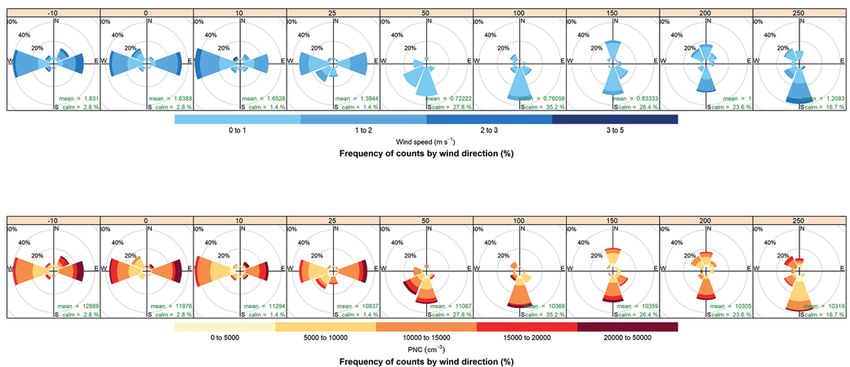
Meteorol. Z. (Contrib. Atm. Sci.)            S. Fritz et al.: Particle number concentrations perpendicular to a main road    319
30, 2021

Table 1: Summary statistics for PNC data [cm−3 ].

                          Measure           All data   Weekday      Weekend     Morning     Midday      Evening
                          Median             10765       11667         7393       11633       10338        9916
                          Mean               12075       13066         7983       12543       11812       10839
                          5th percentile      4452        5023         3194        4072        4438        6301
                          95th percentile    24697       25168        12869       23290       25066       16653
                          IQR                 6434        5977         3539        6438        6796        4692
                          MAD                 4770        4434         2908        4781        5033        2964
                          SD                  8419        8670         5685        8794        8141        7482

exponential decline, the following model was fitted to                3 Results
the observations:
                                                                      3.1 Temporal and spatial variability of PNC
   PNCpredicted = PNCmax local · exp(−x/d) + PNCmin .
                                                  (2.3)               The median of the measured PNC is 10 765 cm−3 with
                                                                      a slightly higher arithmetic mean of 12 075 cm−3 and
Here, PNCmin is the background concentration far away                 an IQR of 6434 cm−3 (Table 1). There are 7230 outliers
from the road and PNCmax local is the additional PNC at               which amounts to 6.2 % of the data. The 95th percentile
the road. d is the decline distance, i.e. the distance to             of PNC is on average 200 % of the median. PNC are
the road up to where the PNCpredicted (x) − PNCmin de-                on average almost 40 % lower on weekends than dur-
creases by 1/e (37 %). These characteristic parameters                ing the week. High concentrations (95th percentile) are
were determined by minimizing the weighted squared                    almost 50 % lower on weekends than on weekdays. Me-
difference between PNCpredicted and PNCmedian summed                  dian and mean PNC slightly decrease from morning to
over all distances x using the Levenberg-Marquardt                    midday to evening runs. However, the 5th percentile of
algorithm (Moré, 1978). The measurement point on                      the evening runs is about 50 % higher than on morning
the central strip of the road was excluded. The MAD                   runs, and about 40 % higher than on midday runs, while
of PNCobs at each distance was used as a measure of                   the 95th percentile is around 30 % lower in the evenings.
uncertainty at that distance. Thus, the squared inverse               IQR and MAD are similar on morning and midday runs
of the MAD was used as weight. This procedure was                     but they are distinctly lower in the evening (IQR: −40 %,
done per run. For combining several runs the arithmetic               MAD: −30 %).
mean of PNCmedian (PNCaverage ) was used as well as                       The 95th percentile shows a clear decrease of PNC
the arithmetic mean of their MADs. The three param-                   up to the distance of 100 m with the highest changes
eters PNCmax local , PNCmin and d that are fitted within              up to a distance of 25 m (Fig. 3). The mean as well as
the model are supposed to be larger than 0.                           the median show a decrease up to a distance of 100 m
    In order to quantify the uncertainty of d, the error              from the road. The mean shows a more distinct de-
ratio err(d) of d was calculated as                                   clining trend while it is more sensitive to outliers. The
                                                                      5th percentile shows hardly any trend. Median, mean
                                    SEd                               and 5th percentile show very little variation in PNC be-
                         err(d) =       ,                   (2.4)
                                     d                                tween 100–250 m distance to the road. The uncertainty
                                                                      range indicates a decrease of dispersion with increas-
where SEd is the standard error of the predicted decline              ing distance to the road for the first four measurement
distance d.                                                           points. At 50 m distance, PNC as well as dispersion is
    In case the data of a specific run does not follow                higher than at the adjacent measuring points. At this
the assumption regarding declining PNC with increas-                  location, the decrease in PNC with increasing distance
ing distance from the main road the model parameters                  from the road is disrupted. This may be due to the fact
cannot be fitted and no solution is returned. In addition,            that there are trees directly in back of it. This may reduce
it was determined for how many of those runs where the                airflow along the footpath, leading to an accumulation of
model returns a solution err(d) is above 2.                           particles. In addition, these trees are located on a slight
    An exponential function was chosen in accordance                  elevation of 30–50 cm, which can further lead to an ob-
with previous studies such as Hagler et al. (2009), Zhu               struction of the airflow.
et al. (2002), and Goel and Kumar (2016). This ap-                        On weekends, 35–42 % lower PNC occur than on
proach is consistent with the current understanding of                weekdays at all distances. Variability along the footpath
PNC dispersion perpendicular to a street. In addition,                is also smaller on weekends than on weekdays, espe-
the approach allows for easy practical application, e.g.              cially closer to the road where the IQR is 54–61 % lower
in an urban planning context. It includes a small number              at distances ≤ 10 m and only 6–22 % lower at distances
of parameters that allow easier comparability of condi-               ≥ 150 m. At distances ≤ 10 m there are more than 73 %
tions and studies.                                                    less outliers on weekends than on weekdays and more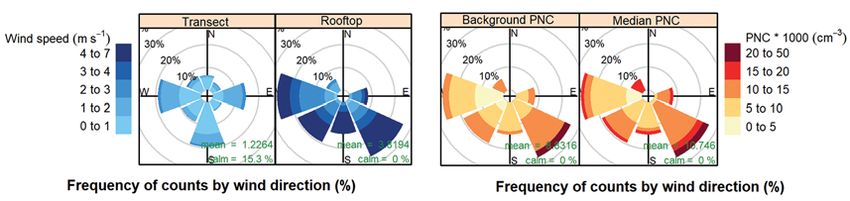
320               S. Fritz et al.: Particle number concentrations perpendicular to a main road            Meteorol. Z. (Contrib. Atm. Sci.)
                                                                                                                                  30, 2021

Figure 3: PNC along the footpath. Statistical parameters were calculated per run. Then the arithmetic mean and standard deviation was
calculated over the runs. a) 5th and 95th percentile, arithmetic mean, median of PNC with the standard deviation (color band); b) aggregated
by weekday (solid) and weekend (dashed); c) aggregated by time of day into averages of morning, midday and evening runs.

Table 2: Mean dispersion of PNCmedian [cm−3 ] per distance over all
                                                                        of 97 % provided as a mean value from long-term traf-
runs (temporal) and per run over all distances (spatial) and ratio      fic counting and modelling (Senate Department for
between the two using standard deviation (sd) and range (R) as          Urban Development and Housing Berlin, 2017).
measures.                                                               Within the weekdays there is very little variation of traf-
                                                                        fic (+/−3 %). On Sundays traffic flow is 14 % lower than
                  temporal     spatial   temporal/spatial
                                                                        on Saturdays. Total traffic flow slightly increases from
           IQR       5925      1871            3.2                      mornings to middays to evenings by 6 and 4 % (2289,
           sd        4856      1759            2.8                      2398, 2426 vehicles/hour), however, the number of big
           R        23549      5239            4.5                      vehicles decreases by 14 and 52 % (132, 113, 52 big ve-
                                                                        hicles/hour). There are no considerable differences be-
                                                                        tween two traffic counts right after each other during
than 98 % less at distances ≥ 25 m with none at all at                  each run, or even between traffic counts before the first
distances ≥ 150 m.                                                      of the two consecutive runs and those at the end of the
    Comparing PNC at different times of day, the 5th per-               second one. This suggests that the traffic volume did not
centile shows higher concentrations in the evenings                     change considerably during measurement runs.
along the footpath than at other times. The 95th per-                       Traffic light phases last for about one minute, with
centile is substantially lower in the evenings while                    traffic flowing for an average of 30 seconds (min: 21 sec.,
mean and median are comparable at all times with only                   max: 37 sec). PNC shows only minor differences in con-
slightly higher average concentrations on mornings and                  centrations for stationary and moving traffic. Overall,
closer to the road.                                                     9 out of 12 runs show slightly higher PNC in stationary
    To compare temporal and spatial variability of PNC,                 traffic than in moving traffic. However, in only 5 of these
mean dispersion was calculated for each measurement                     measurements PNC are more than 10 % higher. The IQR
point over all runs (temporal) and for each run over all                is in 9 of 12 runs on average 17 % higher for stationary
distances (spatial). All dispersion measures (Table 2)                  than moving traffic.
show a higher temporal than spatial variability of PNC.                     On workdays the share of local in total PNC along
The order of magnitude for the ratio of temporal and                    the footpath declines from an average of 30 % at the
spatial variability varies from 2.8 (sd) to 4.5 (R).                    central strip to slightly below 20 % at 25 m. The point
                                                                        at 50 m distance is different from the others as the one
3.2 Impact of traffic on PNC                                            at the transition between the more open area closer
                                                                        to the road and the street canyon area of the footpath
Traffic flow on weekdays (Figure A2) is at an aver-                     further from the road. The decline is almost negligible
age of 2532 vehicles per hour and about 40 % higher                     between the distances of 100 m to 250 m with a share
on weekdays than on weekends (1587 vehicles/hour).                      of 15 % to 13 %. The decline is stronger on workdays
Traffic flow is more consistent on weekdays than on                     than on weekends (24 % on central strip, 15 % at 50 m,
weekends which is evident from a standard deviation of                  13 % at 250 m). More outliers occur on workdays than
206 vehicles/hour during the week compared to 446 ve-                   on weekends (Fig. 4).
hicles/hour on weekends. Especially big vehicles are                        PNC correlates with the traffic flow at the main road
more frequent on weekdays (137 vehicles/hour) than                      right at the main road as well as in 250 m distance
weekends (36 vehicles/hour). Small vehicles account for                 (Fig. 5). Close to the main road, a higher traffic flow
96 % of all vehicles. This is comparable to the ratio                   leads to only slightly higher total PNC than at 250 m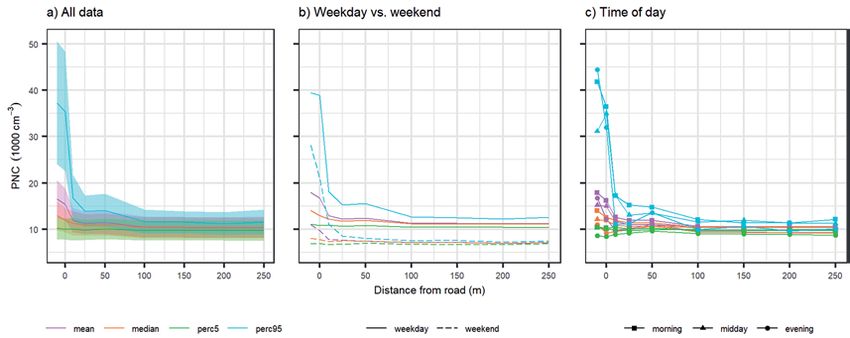
Meteorol. Z. (Contrib. Atm. Sci.)            S. Fritz et al.: Particle number concentrations perpendicular to a main road   321
30, 2021

                                                                      the runs) PNC over 10 000 cm−3 occur in 92 % of the
                                                                      runs. Northwest winds only occurred on 4 runs in com-
                                                                      bination with a median PNC of 15 000 to 17 000 cm−3 .
                                                                          Near the main road wind directions prevail mainly
                                                                      along the direction of this road (Fig. 7). Wind speeds
                                                                      are evenly distributed in all directions with slightly
                                                                      lower wind speeds from Southern directions and only
                                                                      2.3 % calms. Higher concentrations are associated with
                                                                      wind from East and Northeast, especially those above
                                                                      20 000 cm−3 . Near the entrance of the footpath the pat-
                                                                      tern is similar, with lower wind speeds and PNCs of over
                                                                      15 000 cm−3 occurring less frequently. In the front part
                                                                      of the footpath the predominant wind direction is South.
                                                                      Concentrations higher than 15 000 cm−3 coincide only
                                                                      with wind from this direction. Lowest wind speeds and
                                                                      most frequent calms (31.5 %) can be observed here. At
                                                                      the rear part of the footpath highest wind speeds and
                                                                      concentrations are also associated with the predominant
                                                                      wind direction South. However, in about 15 % of the
                                                                      runs there was wind from the North recorded, albeit in
Figure 4: Share of local in the total PNC (φ) per measurement point
in the comparison of weekdays and weekends. The boxes show the
                                                                      combination with slightly lower wind speeds and lower
IQR of the corresponding runs.                                        PNC than during occasions with southerly winds.
                                                                          Local PNC show smaller values as well as a smaller
                                                                      IQR in the vicinity of the main road with higher wind
distance. However, especially the local concentrations                speeds. This leads to larger differences in PNC within
as well as the IQR show a high correspondence be-                     the footpath for situations with lower wind speeds. Lo-
tween particle number concentrations and traffic flow.                cal PNC is higher at a greater distance from the road in
On the central strip, the local PNC for most runs is above            combination with wind speeds lower than 1 m/s (Fig. 8).
1000 cm−3 while that is only the case in about half of the            However, this is most likely due to limited data from
runs at the end of the footpath. While the IQR near the               only two runs with such low wind speeds. For these runs,
                                                                      the wind direction on the roof is given as S and W re-
road is mainly in the range of 1000 cm−3 to 10 000 cm−3 ,
                                                                      spectively, while wind from the north was recorded near
the variability at the back of the footpath is considerably
                                                                      the ground, explaining higher particle number concen-
lower at 100 cm−3 to 1000 cm−3 . For both local PNC
                                                                      trations in the rear part of the footpath. No differences
and IQR, the distinctly higher coefficient of determina-
                                                                      in background concentrations regarding changes in wind
tion for the central strip than at 250 m distance indicates
                                                                      speeds are found.
a considerably stronger impact of the traffic flow near
                                                                          There are large differences in background con-
the road. Even at a distance of 250 m from the main road,
                                                                      centrations with respect to the main wind direction
a slight correlation between background concentrations
                                                                      (Fig. 8). Easterly winds go along with the highest back-
and road traffic is still discernible. This indicates that
even at this distance the urban background level is not               ground concentrations (E: 13 706 cm−3 ; S: 10 018 cm−3 ;
yet fully reached.                                                    W: 8247 cm−3 ). The IQR of background concentrations
                                                                      for easterly winds is higher close to the main road than
                                                                      for other wind directions. With a southerly wind, the dis-
3.3 PNC and wind                                                      persion in the entire footpath is lowest. Westerly winds
                                                                      lead to a higher IQR throughout the footpath but at the
The comparison of wind data along the footpath and                    same time to the lowest background PNC. In contrast,
at 56 m over the roof top level (Figure 6) shows con-                 the highest local PNC can be observed during westerly
siderably higher wind speeds at the reference site due                winds with a higher IQR near the main road than in the
to its higher and more exposed measurement level                      back of the footpath. Concentration differences along
(mean: 3.3 m/s) than in the footpath (mean: 1.2 m/s).                 the footpath are also greatest during westerly wind. The
Calms more frequently occur in the footpath. Wind                     smallest concentration differences along the footpath are
speeds higher than 3 m/s were only recorded on the roof               monitored during southerly wind.
top. While the pattern of wind directions on the rooftop
is dominated by winds from Southeast and West, the                    3.4 Decline model
wind rose along the footpath shows the channeling effect
along the side-street (Fig. A1). The pollutant rose indi-             The decline model with the parameters described in
cates that westerly wind (26 % of the runs) is accompa-               Section 2.7 is applicable for about 70 % of the runs
nied by lower PNC of 10 000 cm−3 or less in 84 % of the               (Table A1). In 23 of the cases the error ratio is below 2
runs. During easterly and southeasterly winds (35 % of                (Fig. A3). For those cases the predicted average decline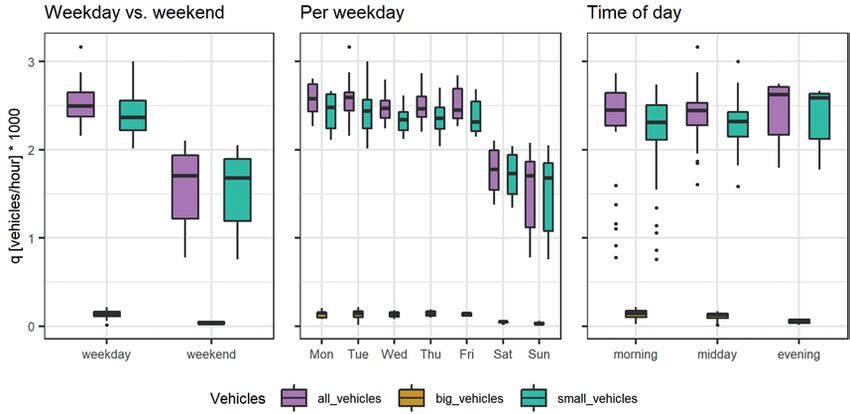
322               S. Fritz et al.: Particle number concentrations perpendicular to a main road            Meteorol. Z. (Contrib. Atm. Sci.)
                                                                                                                                  30, 2021

Figure 5: PNC (logarithmised) and traffic flow at the central strip (top row) and at 250 m distance to the main road (bottom row).

Figure 6: Frequency of occurrence by wind direction is given as a percentage as wind roses (left) for the mean of all measurement points
of the footpath (Transect) as well as the reference site (Rooftop), and as pollution roses (right) for background and median PNC combined
with wind direction of the reference site on the rooftop.

distance is 77 m from the road with a standard error                    the evaluated parameters of Table A1 show significant
of 68 m. The background concentration has an average                    differences in the model results due to the small number
of about 9200 cm−3 with a standard error of half of this                of runs per test scenario and the large dispersion among
amount. The maximum additional local PNC amounts to                     the runs.
an average of approximately 4300 cm−3 with a standard                       The decline model parameters become more con-
error of 90 % of that concentration.                                    fined once the PNCmedian values are averaged before
    Based on the aggregated data a decline model was                    building the models. Table 3 and Fig. 9 show the re-
determined that provides an average function of PNC                     sults when averaging over all runs as well as differen-
along the footpath for various environmental parameters                 tiated by with wind along the footpath and perpendic-
like different wind directions, times of the day of traffic             ular to the footpath. A decline of PNC with increasing
flows (Table A1). There is a considerable difference in                 distance to the road can be observed for all scenarios.
the fitted function between situations with wind along                  The decline distance for all data is at 45.6 m with an ex-
the footpath as opposed to wind perpendicular to the                    ponential decrease of 19.7 % per 10 m distance. Larger
footpath. Westerly or easterly winds lead to a faster de-               differences can be seen in the comparison of PNC dur-
crease of PNC with the distance to the road and an aver-                ing wind along versus across the footpath. With wind
age decline distance of 59 m. With prevailing southerly                 along the footpath, the decline of PNC is slower than
winds, the decline is slower, with an average decline dis-              with a wind direction perpendicular to the footpath. Ac-
tance of 119 m (Fig. 9). For situations with wind perpen-               cordingly, south wind results in a larger decline distance
dicular to the footpath, the model performs more con-                   in combination with a higher standard deviation. Almost
sistently. Note that in both cases, the average standard                twice as high local PNC are modelled for wind at cross-
error of about 60 m is rather large. In general, none of                ways to the footpath.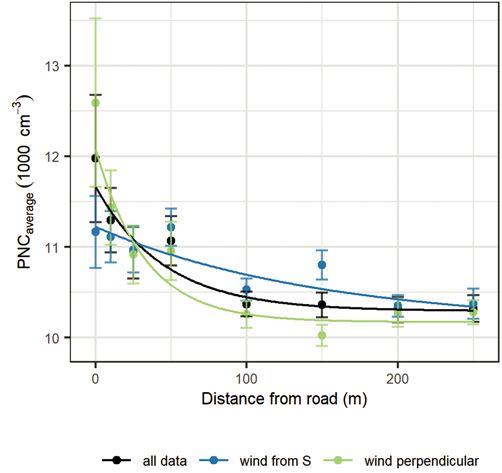
Meteorol. Z. (Contrib. Atm. Sci.)             S. Fritz et al.: Particle number concentrations perpendicular to a main road              323
30, 2021

Figure 7: Wind (left) and pollutant (right) roses along the footpath for a) the rear part of footpath at 150 to 250 m, b) the front part of
footpath at 50 to 100 m, c) the entrance to footpath at 25 m, d) −10 to 10 m near the road. Wind data is from the mobile measurement setup
at ground level. Middle: map of the measurement points, data source: Environmental Atlas Berlin.

Table 3: Parameters of the three decline models produced by averaging over all 72 runs, and differentiated by wind along or perpendicular
to the footpath.

                               number of      PNCmax local   SE PNCmax local    PNCmin        SE PNCmin         decline      SE decline
                                 runs           [cm−3 ]        [cm−3 ]          [cm−3 ]         [cm−3 ]        distance d    distance d
                                                                                                                  [m]           [m]
all data                            72           1371            247            10292            71.2             45.6           15.7
wind along footpath (S)             31           1089            571            10133            672              151            200
wind perpendicular (W, E)           41           1904            541            10171            82.1             32.6           15.2

4 Discussion                                                           decrease in local PNC of 8.5 % per 10 m distance from
                                                                       the road with decrease percentages between 5 and 12 %.
The comparison of temporal and spatial variability                     Even though the composition of the vehicle fleet has
shows that differences between the runs are consider-                  changed since the study of Hagler et al. (2009), the de-
ably higher than changes in concentrations within the                  cline of local PNC with increasing distance to the road is
runs along the footpath. We recommend to use e.g. lo-                  comparable to our study. Figure 10 compares their find-
cal PNC or a relative concentration value rather than ab-              ings with the results of this study.
solute PNC, in order to be able to investigate concen-                     Decreasing overall PNC at the traffic site in the
tration changes along the footpath independently of the                course of the day can be due to an increasing mix-
prevailing meteorological situation and current ambient                ing layer height and enhanced atmospheric convection
concentration levels. This is particularly pertinent when              within the boundary layer. This is associated with in-
comparing measured with modelled PNC. Comparison                       creased turbulent mixing of the air masses into larger
of PNC along the footpath shows an exponential decline                 overall volume (Deventer et al., 2014). Simultane-
of PNC in the majority of runs as well as dispersion up                ously, increasing background concentrations throughout
to a maximal distance of 100 m, providing a clear indi-                the day indicate an accumulating effect of well-diluted
cation that the main road is a major source of particles.              traffic emissions, also triggered by a modest but steady
Other studies also show a decline of the impact of lo-                 increase in traffic flow during the day. Unlike Schnei-
cal traffic on PNC up to a distance of 100 m (Zhu et al.,              demesser et al. (2018) elevated PNC for the evening
2009; Hagler et al., 2009). For the seven studies they                 rush hour could not be observed, which might be due
compared, Hagler et al. (2009) calculated an average                   to the small number of evening runs. The comparably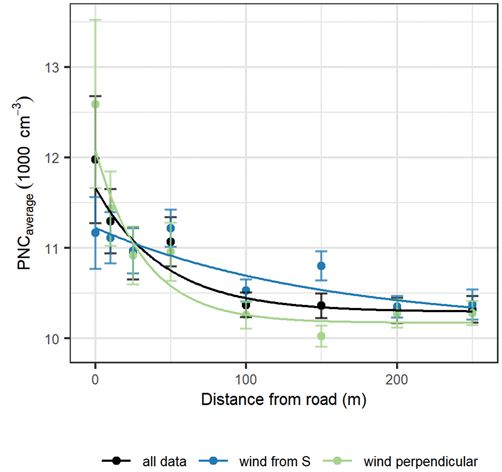
324             S. Fritz et al.: Particle number concentrations perpendicular to a main road        Meteorol. Z. (Contrib. Atm. Sci.)
                                                                                                                            30, 2021

Figure 8: Local and background concentrations within the footpath categorized by wind speed and wind direction of the TU reference
station. The boxes show the IQR of the corresponding runs.

smaller effect of the evening rush hour is comparable to              relationship with a higher traffic volume also leading to
other studies (Hagler et al., 2009). As also observed by              higher PNC. Nonetheless, changes in traffic flow still
Birmili et al. (2013b), Bonn et al. (2016) and Mishra                 have an impact on local concentrations at 250 m dis-
et al. (2012), median concentrations are usually lower                tance.
than when using the arithmetic mean due to outliers. The                  Slightly higher PNC was found for stationary traffic
high amount of outliers consolidates the use of the me-               during the red phases of the traffic lights than for flowing
dian instead of the arithmetic mean for averaging PNC                 traffic. This may be due to a lower mixing of the air
as well using the IQR instead of the standard deviation               masses caused by the lack of wake turbulence around the
as a measure of dispersion.                                           vehicles so that emissions are less dispersed and diluted.
    The 40 % lower traffic volume on weekends than on                 It can be assumed that transformation processes of the
weekdays is reflected in 35–42 % lower PNC on week-                   emitted particles are rather negligible in this context,
ends. Just like for street canyons (Voigtländer et al.,               since they occur on shorter time scales of around 1 s after
2006; Weber et al., 2013), high correlations of PNC and               emission (Kumar et al., 2009b; Uhrner et al., 2007;
traffic flow indicate the importance of traffic as a source           Uhrner et al., 2011). It took longer than 1 s for the
for particles. The link becomes even more obvious when                traffic emissions to reach the measurement device.
the variability between days is reduced by considering                    Background concentrations are still not reached at
only local concentrations. Differences along the foot-                the maximal measurement distance of 250 m, which
path are not as prominent in absolute concentrations, as              Hagler et al. (2009) also found in their study for a
a large share of these are attributable to changes in back-           distance of 300 m at a site mostly free of obstacles.
ground concentrations. After correcting for background                The finding is an indication that for statistical modeling
concentrations, the correlation of traffic volume and lo-             of spatial variability methods should still include a lo-
cal PNC becomes more pronounced regarding a higher                    cal traffic flow parameter even farther away from main
coefficient of determination and also a stronger positive             roads. van Poppel et al. (2013) suggest to using data
Meteorol. Z. (Contrib. Atm. Sci.) S. Fritz et al.: Particle number concentrations perpendicular to a main road 325
30, 2021
measurements in a green area would have prolonged the
measurement period per run considerably. Additional
measurements of particle sizes classes might have pro-
vided additional indicators on the extent of background
in comparison to local PNC (Deventer et al., 2014;
Birmili et al., 2013b).
Local traffic contributes to about 30 % of the PNC
close to the road. The result is a smaller share in com-
parison to the about 50 % estimated by Hankey and
Marshall (2015). Other than in their study most of
our measurements were not carried out during rush-hour
which may explain this difference. The proportion of lo-
cal PNC also strongly depends on the method used to
calculate background concentrations. van Poppel et al.
(2013) apply the 25th percentile of a measurement in
a green zone and subtract this value from all measured
values. This results in lower background concentrations
which can be used to represent a larger spatial scale and
therefore the regional background. However, this leads
to considerably larger local concentrations which are
Figure 9: PNCaverage over all runs (black) as well as averaged sep-
higher by two to three orders of magnitude than those
arately over either wind coming from south (wind along the foot-
path, blue) or perpendicular to the footpath (W, E, green) and the
calculated in this study. Our study applied higher back-
respective decline model. The error bars indicate the respective av- ground concentrations, combining both regional and ur-
erage MAD. Wind from North was not recorded. Wind data is from ban background, in order to focus on micro-scale effects.
the TU reference station. The pollution roses for the whole measurement cam-
paign indicate large-scale regional PNC characteristics
typical for the study region. Predominant westerly winds
in the East of Germany usually bring more humid air
masses of maritime origin and lower overall background
PNC (Birmili et al., 2013b). Those westerly winds go
along with higher wind speed causing good dispersion
of particles and efficient mixing of air masses. This is
comparable to air quality observations regarding PM
in Berlin (Lenschow et al., 2001). Higher background
PNC with east wind in eastern Germany can be at-
tributed to dry, continental air masses (Birmili et al.,
2013b). Further, synoptic situations with east wind are
usually accompanied by low wind speeds, so that less
mixing takes place and air pollutants accumulate in the
canopy layer. Close to the ground along the footpath, a
decay of PNC with increasing distance from the road can
be found for parallel (S) as well as perpendicular (E, W)
Figure 10: Gradient of local PNC with growing distance to a main
wind directions. This is contrary to the study by Zhu
road: Comparison of the average local PNC over all runs of this study
(solid line) from central strip (−10 m) to 250 m with the average
et al. (2009) in Texas, who found hardly any variation
gradient of other studies (dashed line) up to a distance of 100 m of PNC with increasing distance to the road with wind
according to (Hagler et al., 2009). As starting point for the other parallel to the three roads included in their study. How-
studies, the median local PNC of our study at 0 m has been used. An ever, a smaller decay and overall smaller PNC variations
average gradient of 8.5 % per 10 m has been applied. The shading of along the footpath are evident in our study for wind par-
this study refers to the IQR, the shading for the other studies refers allel to the footpath coming from the direction of the
to the differences in the studies (drop of 5 to 12 % per 10 m) included main road (S). The decline curves show that while wind
in Hagler et al. (2009). along the footpath does lead to a decline, it is smaller
than with wind perpendicular to the footpath. This sug-
gests that traffic emissions within the footpath are more
from either a stationary measurement in an area little af- evenly distributed in the case of wind along the footpath
fected by traffic or a measurement point in a larger green and that mixing also continues at greater distances from
zone as an estimate of background concentrations. They the road.
also suggest using the 25th percentile of such a reference Considering the wind and pollutant roses for the foot-
site as background value. During the study, no PNC data path, it becomes apparent that the prevailing wind has a
from a nearby background site was available. Including, clear effect on overall PNC but that local circumstances326 S. Fritz et al.: Particle number concentrations perpendicular to a main road Meteorol. Z. (Contrib. Atm. Sci.)
30, 2021
dominate PNC in the micro-scale. Low wind speeds near path. The use of the exponential function with the pa-
the ground and the deflecting effects of the surrounding rameter d shows how far effects of road traffic extend
buildings lead to a channeling of the wind into the foot- into non-traffic cross streets. They thus allow an assess-
path and thus to a distribution of the emissions along the ment of the pollution situation in the vicinity of main
footpath. Unlike Kumar et al. (2008), this study could roads. Power law or polynomial functions may be an al-
not identify a strong correlation of wind speed and PNC, ternative. Those make a comparison of different condi-
neither close to the main road (distances −10 to 10 m) tions or even studies more challenging due to their more
nor farther in the footpath (distances 100 m to 200 m). complex terms and the large number of parameters. Due
It was also not possible for the decline model to detect to the natural limitation of the length of the footpath
any distinct differences between lower and higher wind to 250 m by to the surrounding buildings, the maximum
speeds. However, the focus of this study was on low spatial limit of the impact of the main street on PNC
wind weather conditions. Therefore, low wind speeds cannot be deducted. The measurement data indicate that
were recorded most often (factor 10 lower than for Ku- even at this distance there is still an impact of the main
mar et al., 2008), so that we cannot conclude anything road on the PNC. However, the decline curves suggest
with respect to the effects of higher wind speed on PNC. that, on average, it extends not much further than about
With comparably low wind speeds like in this study, the distance of 250 m.
Kozawa et al. (2012) were also not able to obtain a neg-
ative correlation of wind speed and PNC. More gener-
ally, since measurements did not take place during situ- 5 Conclusions and outlook
ations with strong wind, high relative humidity (> 80 %)
or precipitation, no insight into correlations of PNC with In this study we investigate the spatial variability of sub-
these weather conditions can be provided. According to micron particle concentrations in a low-traffic footpath
Weber et al. (2013), a stronger correlation between PNC across a main road. Measurements took place during a
and wind might have been found, had a vertical wind six-week measurement campaign using a TSI 3007 con-
component been measured to represent turbulent mixing densation particle counter to record particle number con-
processes. centrations at nine locations up to the distance of 250 m
One of the challenges in the design of the mea- from the main road. We provide a data set on PNC and
surement campaign is the high temporal variability of wind data for the development and validation of statis-
sub-micron particle concentrations in urban areas. Us- tical dispersion models on sub-micron particles away
ing only one measuring device, a trade-off between ac- from a highly trafficked road into a built up urban en-
quiring data from many locations in a short period and vironment. It also provides information about the shares
a sufficient integration interval for each measurement of local versus background PNC needed to implement
had to be considered. Shorter sampling times minimize a in statistical PNC modeling. The strong relationship be-
change in background concentrations during one full run tween traffic and PNC can be used to improve statistical
which eases focusing on spatial variability of PNC. The modeling (e.g. land use regression models) of PNC in
necessary number of measurement points for the hetero- the direct vicinity of main roads based on traffic mon-
geneous study area resulted in a measurement interval itoring. The study shows that an exponential function
of 3 minutes containing 180 values for PNC and 90 val- can describe the decline of PNC with increasing distance
ues for wind speed at each location. This is based on from the road well in the majority of cases. Such a func-
the desired maximum duration of a measurement round tion can be used to derive how far effects of emissions
of 30 minutes, so that two consecutive measurements from road traffic extend into non-traveled cross streets.
could be carried out within one hour. The sampling in- This in turn allows an estimation of the relevance of
terval proved to be reasonable. Traffic light phases on main roads for exposure in its close vicinity. For dy-
the main road consisted of alternating 30 seconds of sta- namic models, the study provides an indication on the
tionary and 30 seconds of moving traffic. Thus, six such dimension of dispersion of particles from a main road
varying traffic conditions were included per sampling in- for approaches of model evaluation. The aggregated de-
terval. Accordingly, the data of each of the measurement clined curves show average dispersion of particles with
points is based on similar traffic conditions at the main growing distance to a main road to compare to disper-
road. By choosing the median as the mean value, short sions calculated by dynamic models.
term extreme situations are further disregarded. The study shows that total PNC as well as its dis-
The use of an exponential function to describe the persion rapidly decreases with increasing distance to the
decrease in PNC with increasing distance from the main main road. The decrease is described with a decline
road has proven effective. Such a function can be ap- model and shows an exponential decrease of PNC in
plied in 70 % of the individual measurement runs. The the majority of runs up to an average decline distance
advantage of this function is the simplicity of the re- of 45.6 m. A smaller decrease could be detected up to
sulting parameters, in our study the decline distance d a distance of 100 m. Weekend days in comparison to
and the standard error SE. Especially when aggregating working days are characterized by lower differences in
the data for different conditions, the effect of road traf- PNC between the main road and the footpath as well as
fic on air quality can thus be compared along the foot- a lower dispersion within the footpath. Traffic volumeMeteorol. Z. (Contrib. Atm. Sci.) S. Fritz et al.: Particle number concentrations perpendicular to a main road 327
30, 2021
has a substantial impact on concentration levels as well Acknowledgements
as temporal variations. Local sources contribute about
30 % of the measured PNC at the roadside of the main The study was carried out as part of the research pro-
road. High PNC along the footpath are only found with gramme Urban Climate under Change (UC2) within
wind coming from the direction of the main road. How- sub-project URBMOBI-GIS, grant No. 01LP1602B,
ever, the temporal differences between the runs account funded by the German Federal Ministry of Research
for greater variations in PNC than the spatial differences and Education (BMBF). We would also like to ex-
along the footpath, which should be considered in any press our gratitude to Stephan Weber, Lars Gerling
kind of concentration level modeling. and Agnes Straaten of Technische Universität Braun-
The impact of traffic volume as a source and wind schweig for their support in the design of the mea-
for dispersion was demonstrated and quantified for this surement setups and the coordination of the study con-
specific location. More generalized the results will as- cept and Klaus Hartmann of Humboldt-Universität zu
sist for the calculation of different scenarios regarding Berlin for the construction of the measurement setup.
traffic management and measures that affect ventilation The authors would like to acknowledge Dieter Klemp
of built-up areas. The results of this study as well as the and Robert Wegener of Forschungszentrum Jülich
data set may contribute to developing an improving sta- for the parallel measurements for the calibration of
tistical dispersion modeling. the instruments and Janani Venkatraman Jagatha
A statistical approximation of the impact of the fac- of Humboldt-Universität zu Berlin for her contribu-
tors is useful to explain differences between average tion within this research project. The authors also ac-
PNC between runs. This will be a good next step to knowledge Achim Holtmann of Technische Univer-
further investigate factors causing differences in decline sität Berlin for providing the reference wind data set.
curves shown in the appendix. In this study, not enough Sabine Fritz thanks the Caroline von Humboldt Pro-
different conditions were represented in the data set gramme of Humboldt-Universität zu Berlin for the fi-
(workday/weekend, rush-hour/non rush-hour, wind di- nancial support in form of the International Research
rections, wind speeds). An even larger data set would be Award. We further thank the reviewers and the editor for
necessary for that type of analysis which is beyond the their helpful suggestions for changes and improvements
scope of this paper. to the paper. We acknowledge support by the German
Research Foundation (DFG) and the Open Access Pub-
lication Fund of Humboldt-Universität zu Berlin.328 S. Fritz et al.: Particle number concentrations perpendicular to a main road Meteorol. Z. (Contrib. Atm. Sci.)
30, 2021
6 Appendix
Figure A1: Wind (top) and pollutant (bottom) roses along the footpath by measurement location. Frequency of occurrence by wind direction
is given as a percentage. Wind data is from the mobile measurement setup at ground level.
Figure A2: Temporal variability of traffic flow q at the main street, differentiated by time: weekday vs. weekend, by weekdays and by times
of day. Vehicles categorized according to small and large vehicles and their sum.Meteorol. Z. (Contrib. Atm. Sci.) S. Fritz et al.: Particle number concentrations perpendicular to a main road 329
30, 2021
Table A1: Parameters of the decline model, comparison of various environmental parameters. The parameter fraction converging shows the
fraction of runs where the numerical method converges following the assumption regarding declining PNC with increasing distance from
the main road. The fraction of good runs shows percentage of converging runs, where err(d) is below 2. A result of the model is defined as
good in the following columns, when a decline of PNC can be observed with increasing distance to the road and err(d) is below 2.
number fraction fraction d SE(d) PNCmax-local SE PNCmax-local PNCmin SE PNCmin
of runs converging good (good) (good) (good) (good) (good) (good)
[%] [%] [m] [m] [cm−3 ] [cm−3 ] [cm−3 ] [cm−3 ]
all data 72 0.68 0.32 77 68 4282 3851 9234 4706
wind direction N 0 – – – – – – – –
wind direction S 31 0.61 0.23 119 61 4393 3586 8263 982
wind direction W 29 0.76 0.34 49 25 3416 3781 8348 4456
wind direction E 12 0.67 0.5 76 103 5595 4527 11845 7035
wind along footpath (S) 31 0.61 0.23 119 61 4393 3586 8263 982
wind perpendicular (W, E) 41 0.73 0.39 59 64 4233 4074 9659 5610
weekend 14 0.71 0.29 68 53 1708 822 6480 2390
weekday 58 0.67 0.33 79 72 4824 4029 9814 4907
morning 34 0.76 0.32 65 54 4137 3651 8664 3637
midday 32 0.56 0.31 96 86 4989 4380 10139 6108
evening 6 0.83 0.33 57 16 1538 74 7849 1914
traffic flow q < 2300 h−1 22 0.59 0.23 58 51 3001 2977 7868 3731
traffic flow q >= 2300 h−1 50 0.72 0.36 83 72 4638 4061 9614 4969
wind speed = 3 m s−1 50 0.68 0.34 84 70 3791 3625 8903 4785
References
Agostinelli, C., U. Lund, 2017: R package ‘circular’: Circular
Statistics. – https://cran.r-project.org/web/packages/circular/
circular.pdf.
Argyropoulos, G., C. Samara, D. Voutsa, A. Kouras,
E. Manoli, A. Voliotis, A. Tsakis, L. Chasapidis, A. Kon-
standopoulos, K. Leftheriadis, 2016: Concentration levels
and source apportionment of ultrafine particles in road mi-
croenvironments. – Atmos. Env. 129, 68–78, DOI:10.1016/
j.atmosenv.2016.01.009.
Atkinson, R.W., I.C. Mills, H.A. Walton, H.R. Anderson,
2015: Fine particle components and health – a systematic re-
view and meta-analysis of epidemiological time series studies
of daily mortality and hospital admissions. – J. Exposure Sci.
Env. Epidemiol. 25, 208–214, DOI:10.1038/jes.2014.63.
Baldauf, R.W., R.B. Devlin, P. Gehr, R. Giannelli,
B. Hassett-Sipple, H. Jung, G. Martini, J. McDonald,
J.D. Sacks, K. Walker, 2016: Ultrafine Particle Metrics and
Research Considerations. Review of the 2015 UFP Work-
shop. – Int. J. Env. Res. Public Health 13, 1054, DOI:10.3390/
Figure A3: Decline model of all 72 runs. Points are PNCmedian , ijerph13111054.
error bars show the MAD. In case the data of a specific run does Birmili, W., J. Rehn, A. Vogel, C. Boehlke, K. Weber,
not follow the assumption regarding declining PNC with increasing F. Rasch, 2013a: Micro-scale variability of urban particle
distance from the main road, the model parameters cannot be fitted number and mass concentrations in Leipzig, Germany. – Me-
and no curve is plotted. Green lines indicate where fitting process teorol. Z. 22, 155–165, DOI:10.1127/0941-2948/2013/0394.
returns a solution with err(d) below 2, pink lines indicate an err(d) Birmili, W., L. Tomsche, A. Sonntag, C. Opelt, K. Wein-
above 2. Values for decline distance d [m] and err(d) [m] are given hold, S. Nordmann, W. Schmidt, 2013b: Variability of
for each run. aerosol particles in the urban atmosphere of Dresden (Ger-
many): Effects of spatial scale and particle size. – Meteorol. Z.
22, 195–211, DOI:10.1127/0941-2948/2013/0395.
Bonn, B., E. von Schneidemesser, D. andrich, J. Que-
denau, H. Gerwig, A. Lüdecke, J. Kura, A. Pietsch,
C. Ehlers, D. Klemp, C. Kofahl, R. Nothard, A. Kersch-
baumer, W. Junkermann, R. Grote, T. Pohl, K. We-
ber, B. Lode, P. Schönberger, G. Churkina, T.M. But-
ler, M.G. Lawrence, 2016: BAERLIN2014 – the influence
of land surface types on and the horizontal heterogeneityYou can also read