Where is also about time: A location-distortion model to improve reverse
←
→
Page content transcription
If your browser does not render page correctly, please read the page content below
Where is also about time: A location-distortion model to improve reverse
     geocoding using behavior-driven temporal semantic signatures

                                     Grant McKenzie, Krzysztof Janowicz
              The STKO Lab, Department of Geography, University of California, Santa Barbara, CA, USA

Abstract
While geocoding returns coordinates for a full or partial address, the converse process of reverse geocoding
maps coordinates to a set of candidate place identifiers such as addresses or toponyms. For example,
numerous Web APIs map geographic point coordinates, e.g., from a user’s smartphone, to an ordered set of
nearby Places Of Interest (POI). Typically, these services return the k nearest POI within a certain radius
and measure distance to order the results. Reverse geocoding is a crucial task for many applications and
research questions as it translates between spatial and platial views on geographic location. What makes
this process difficult is the uncertainty of the queried location and of the point features used to represent
places. Even if both could be determined with a high level of accuracy, it would still be unclear how to map
a smartphone’s GPS fix to one of many possible places in a multi-story building or a shopping mall. In
this work, we break up the dependency on space alone by introducing time as a second variable for reverse
geocoding. We mine the geosocial behavior of users of online location-based social networks to extract
temporal semantic signatures. In analogy to the notion of scale distortion in cartography, we present a
model that uses these signatures to distort the location of POI relative to the query location and time,
thereby reordering the set of potentially matching places. We demonstrate the strengths of our method by
evaluating it against a purely spatial baseline by determining the Mean Reciprocal Rank and the normalized
Discounted Cumulative Gain. Our method performs substantially better than said baseline.
Keywords: Reverse Geocoding, Point of Interest, Semantic Signature, Geosocial Check-in, Time

1. Introduction and Motivation

    Translating back and forth between spatial and placial representations of location is a crucial task
underlying many research questions, applications, and systems. Geocoding, for instance, is the process
of assigning corresponding geographic coordinates to other types of structured geographic identifiers such
as addresses. The converse process, called reverse geocoding, assigns place identifiers, such as toponyms,
to geographic coordinates. More specifically, it maps a geometry in the sense of OGC’s Simple Feature
model to an ordered set of candidate place identifiers. Typically, the Euclidean distance between the query
coordinates and the point-feature representation of the candidate places is used to establish a relevance
ranking. To successfully match a user’s location to a visited place, new geosocial approaches also consider
popularity, e.g., how many users checked-in or wrote reviews about a place. Additionally, many (reverse)
geocoding systems consider place hierarchies and granularity.
    The following queries nicely illustrate the difference between a spatial and placial perspective as well
as the arbitrariness of relying on point coordinates for the query and the candidate places alone. While
not a reverse geocoder in the strict sense, the Flickr flickr.places.findByLatLon API call [8] returns place
IDs given a lat/lng coordinate and accuracy value. This allows users to find photos for particular places.
The API rounds up to the nearest place type, i.e., it returns a city ID for street-level coordinates rather

    Email addresses: grant.mckenzie@geog.ucsb.edu (Grant McKenzie), janowicz@ucsb.edu (Krzysztof Janowicz)

Preprint submitted to Elsevier                                                                          June 11, 2015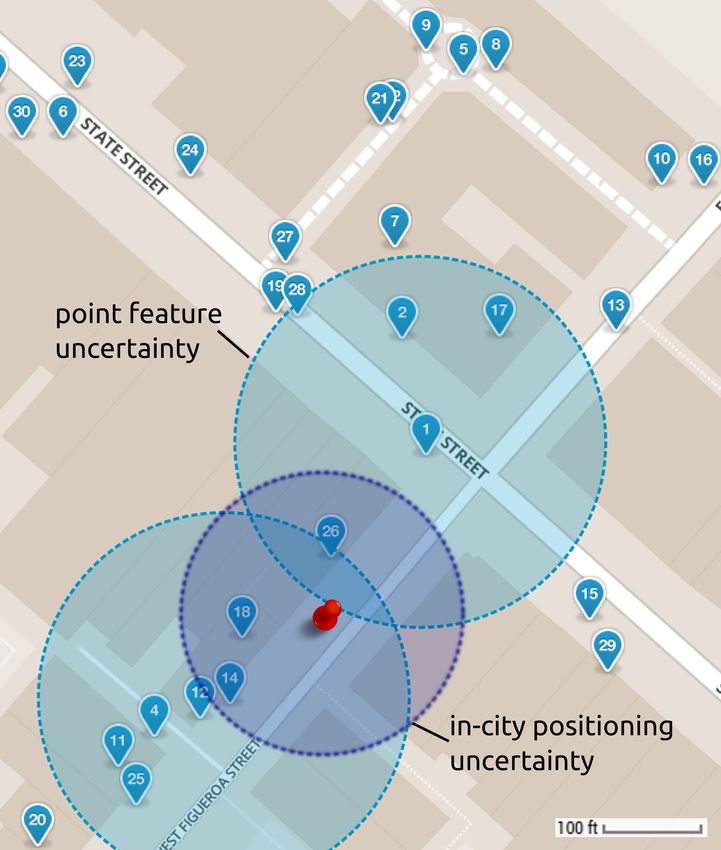
than returning a street or building. Latitudes and longitudes are truncate to three decimal points. In each
case shown below, the query coordinates represent the same fix at the Griffith Observatory in Los Angeles.
However, the query is run with different accuracy levels where 16 corresponds to the street level, 11 to the
city level, and 7 to the county level. The respective responses from the Flickr API are as follows.1
[...] latitude="34.146" longitude="-118.248" [...]
place_type="locality" place_type_id="7" name="Glendale, California,
United States" [...]" /> [...]
[...] place_type="county" place_type_id="9" [...] name="Los Angeles County,
California, United States" [...] /> [...]
The fact that even small differences in spatial accuracy may have strong impacts, e.g., on routing choices,
has been demonstrated in the literature before [3]. What makes the example above interesting is the place
hierarchy. Hollywood is a district of Los Angeles, while Glendale is a city in Los Angeles County. From a
human-centered placial perspective, one would assume the queries to return Hollywood (in fact, it should be
the Los Feliz neighborhood), Los Angeles, and finally Los Angeles County. Instead the neighboring city of
Glendale is returned for the city-level accuracy query, thereby breaking the expected hierarchical composition
of places. From a computation-centric spatial perspective Glendale is returned by the Flickr API simply
because its centroid representation it closer to the query location than the centroid of Los Angeles.
The arbitrariness and imprecision of point-feature representations as well as the effect of missing topo-
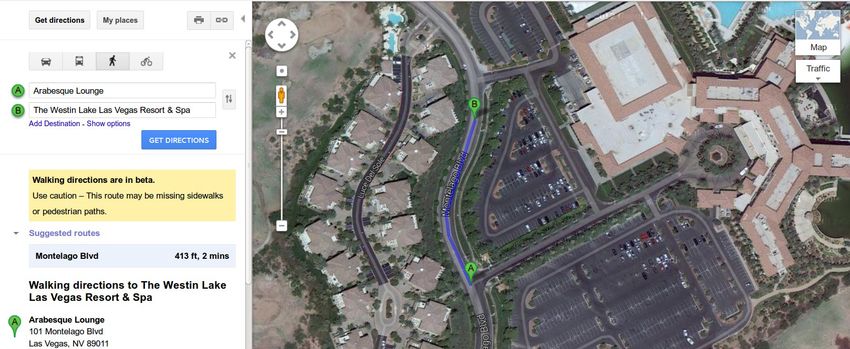
logical relations also strikes on the level of small-scale features such as Places Of Interest (POI).2 Figure 1
illustrates a common issue. First, the resort marker (A) is placed at the entrance to the parking lot. While
this may be acceptable, other POI databases place it at the center of the building which is nearly 150m
away. Second, the lounge is inside the resort but its marker (B) is shown over 100m away from the resorts
marker. As most reverse geocoders rely on distance alone, such differences will lead to substantially different
and often misleading results, e.g., when suggesting a user’s check-in location.
As the omnipresence of location-enabled mobile devices increases, more robust, accurate, context-aware,
and data-rich geolocation services are required. Today, the ability to link spatial coordinates to an actual
place has become essential in many aspects of our everyday lives including navigation applications, place
recommendation, location-based advertising, and critical infrastructure. It is interesting to note that the
challenge is not one of more accurate GNSS and Wi-Fi-based positioning systems (WPS) alone. The
information that a person checked-in or is present at a place is semantically richer than the spatial data
alone. To give a concrete example, the fact that a person is standing in front of a food truck is substantially
different from the fact that a person checked-in to the food truck and is likely to order something. Placial
information is more than just spatial proximity.
Commercial companies such as Google as well as open source platforms like GeoNames have made
names for themselves offering application programming interfaces (APIs) and web services that allow both
developers and consumers to query gazetteers and POI databases using geographic coordinates as input.
With the increase in user-generated geo-content, new services such as Foursquare and Yelp have emerged
allowing anyone with a location-enabled mobile device to contribute or update the location of an entity in
a crowd-sourced system. It is important to note that while these systems involve the contribution of geo-
content from individual users, there is still some discussion as to whether or not they fit in to the category
1 The remainder of the paper will use data from the location-based social network Foursquare.
2 Frequently also referred to as Points Of Interest.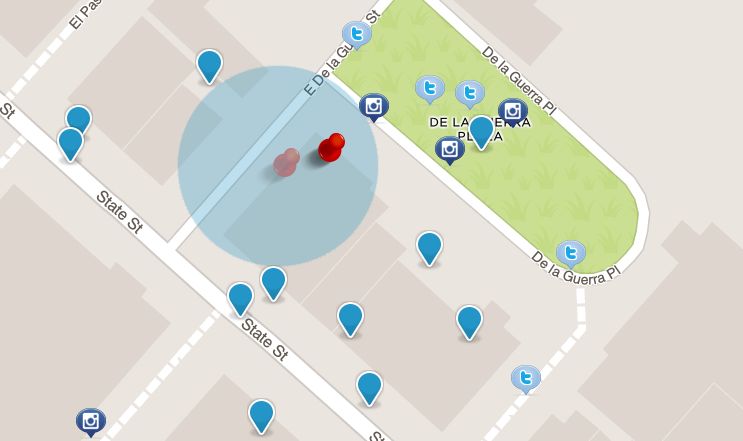
Figure 1: Point-feature distance between a resort and the lounge located inside of it (screenshot from Google Maps).

of Volunteered Geographic Information [12, 17]. Previous work on POI matching has shown that the median
distance of a single POI between different geolocation service providers is 62.8 meters apart and can reach
up to several hundreds meters under extreme circumstances (e.g., for a golf course) [18]. Figure 2 (left)
illustrates this fact by showing the position of markers from five major services. While this offset may not
be a substantial issue in rural areas due to their low POI density, it will cause substantial problems for
geolocation services (e.g., check-in services) in high-density urban areas.
    The task of determining the place an individual is visiting based on coordinates gathered from their
mobile device becomes more difficult given the uncertainty associated with each POI in the dataset. That
is, selecting the nearest POI to a user’s location becomes an artifact of the arbitrary point-coordinate
representation of nearby POI. Leaving the actual POI locations aside, another facet of uncertainty plagues
traditional geolocation services, namely the positional accuracy of a location-enabled device. While most
devices make use of a range of positioning technologies (e.g., GNSS, WPS, Cellular Network), each of these
technologies has its own issues related to accuracy, imparting a level of uncertainty on any device location.
Therein lies one of the problems facing traditional geolocation services such as reverse geocoders. Given
the aforementioned sources of uncertainty, how can a geolocation service be expected to accurately predict
a POI from geographic coordinates? An example of this challenge is shown in Figure 2 (right). A number
of POI are shown on the map along with their associated positional uncertainty. Additionally, the red pin
shows the most probable location of a mobile device and it’s two-dimensional depiction of uncertainty.

2. Research Contribution and Example Scenario

    Clearly, relying on geographic coordinates alone to infer a place based on a user’s mobile device position is
not sufficient. However, there are other contextual clues that can be taken into account. Time is one such clue
and in contrast to many other contextual information it is readily available with every position fix. Current
reverse geocoding services solely exploit geographic location while in reality human behavior dictates that
approximately the same location in geographic space can serve a variety of purposes at different times of the
day or days of the week. The motivation for visiting a specific city block on a Tuesday morning is considerably
different than visiting that same block on a Saturday night. While the geographic coordinates determined by
one’s location-enabled mobile device may be temporally-agnostic, the probability of conducting an activity
at a nearby place is not.
    In fact, place categories are implicitly defined by time. For instance, the likelihood of being at the
Department of Motor Vehicles on a Sunday at 1 AM is negligibly low. Not only is this likelihood driven
Figure 2: Left: Different services list different locations for The French Press Café in Santa Barbara, CA. Google Maps (G),
OpenStreetMap (O), Foursquare (F), Yelp (Y), Bing Maps (B). Right: Uncertainty in POI location and user location. French
Press Café (1) and Los Arroyos Mexican Restaurant (14). The red pin marks the user’s most probable location. Note that the
circles of uncertainty are not drawn to scale; in actuality they would appear larger.
by socio-institutional constraints [23], but also by observable human-placial behavior patterns. Existing
research in this area has shown that categories of places (e.g., Hospital, Restaurant, Bar) can be uniquely
identified by the temporal patterns of their visitors [30, 19, 20]. In this work, we make the case for time being
an additional readily available clue for reverse geocoding and geosocial check-ins in specific. We demonstrate
that given a time-stamp of a location fix, temporal signatures [19] can be combined with existing distance-
only methods to substantially enhance the accuracy of place estimations.
The research contributions of this work are as follows:
• In analogy to the notion of scale distortion in cartography, we present a model that uses temporal
signatures to distort the location of POI relative to the query location and time, thereby reordering
the set of potentially matching places. Using the check-in frequency of a POI category at a specific
time, geographic space is distorted by a factor of the temporal probability. Places that show a high
check-in frequency at the provided time are shifted closer to the queried geographic coordinates of the
user while those with low probabilities are pushed further away. Intuitively, given a user’s location fix
at 10pm, a nearby cinema is preferred over a closer bakery as the temporal signature of the place type
Bakery indicates that people rarely visit bakeries during the night.
• We explore and report on multiple models for this temporal distortion analogy including linear, non-
linear, symmetric and non-symmetric functions. Our study indicates that a non-linear, non-symmetric
rational function produces the best results.
• We demonstrate the strengths of our method by evaluating it against a distance-only baseline (used by
most currently available services) by determining the Mean Reciprocal Rank and the normalized Dis-
counted Cumulative Gain.3 Our enhanced method increases the estimated accuracy of an individual’s
location Mean Reciprocal Rank from 0.359 to 0.453 and the normalized Discounted Cumulative Gain
3 These statistical rank approaches will be further explained in Section 4.3.from 0.583 to 0.711. Additionally, we demonstrate that our model can also be used to improve the
prediction accuracy of geosocial systems such as Foursquare which is noteworthy given their detailed
ground-truth data.
• Several potential contextual clues are available to improve the quality of location services. Examples
include weather information, mode of transportation, previously visited location, user preferences,
and so forth. Many of these, however, are not available outside of commercial data silos, are difficult
to mine, require different index schemes, or substantially increase the complexity of (pre-)computing
candidate places. In contrast, time is readily available with every position fix and we provide signatures
for over 400 place types for each hour of the week. Nonetheless, some use cases may require pre-
computed results and cannot deal with this level of detail. By measuring information gain, we show
that the temporal signatures vary greatly with respect to their indicativeness. Consequently, a few
selected time-frames can already improve place estimation.
• Finally, we present an outlook on user-location distortion models. Our current work uses default
behavior to compute the temporal probability of POI categories for different times. People (and
places), however, do not always follow such established patterns. For instance, there might be an
event at a location that would be closed otherwise. By enriching the default mode with a dynamic
real-time model, we can adjust for such circumstances. We discuss the role of Instagram photos and
Tweets to determine trending areas in real-time. We propose an inverse-distance weighed method to
alter the user’s query location, pulling it closer to areas of high online-social networking popularity.
Stepping back from the research contributions for a moment, let us explore a real-world scenario depicting
the problem. This scenario will act as running example throughout the paper. Figure 3 shows a query
location (red pin) and a number of nearby POI. A standard distance-only approach would simply calculate
the distance between each POI and the query location and return a ranked set of distances allowing the user
to make the assumption that she is currently at the closest POI. In referencing the temporal signatures for
the different POI types, we find a visit probability value for each category of POI at any given hour of the
day on any day of the week.
Table 1 shows the categories associated with each POI in Figure 3, the geographic distance to the query
location, as well as the temporal probabilities for those POI types at both 10 AM on Monday and 11 PM on
Saturday. As one can see, the popularity of nearby POI change significantly between the two times. Rather
than assuming that there is an equal likelihood of a user visiting a POI, irrespective of time and type, it
follows that temporal probability should be included in determining the most likely visited place.
The remainder of the paper is structured as follows. In Section 3 we introduce the extracted temporal
signatures, and the used data. Next, Section 4 discusses our temporal signatures-based location-distortion
model, tested functions that realize these models, and their weights. In Section 5 we evaluate our proposed
method. We present an outlook on dealing with real-time information in Section 6. In Section 7, we contrast
our work to related research and discuss relevant findings. Finally, Section 8 offers conclusions and directions
for future work.
3. Temporal Signatures and GeoSocial Check-in Data
In this Section, we introduce the temporal signatures and the data from which they were derived.
3.1. Activity Categories
When a new POI is contributed through the Foursquare mobile application, the creator is able to assign
a category tag by selecting from a pre-defined hierarchical set of activity categories. Originally generated
by user-contributed tags, governors of the Foursquare application refined the list on multiple occasions,
eventually restricting category assignments to just those provided via the application. While the set does
occasionally undergo minor adjustments, at time of writing, this category set consists of 421 unique place
types divided between three hierarchical levels [9]. Contributors to the application are asked to assign atFigure 3: Coordinates from user’s device (red pin) and nearby POI (blue markers).
least one category to any venue they generate, though this is not enforced [10]. A sample4 of 15,731,452 POI
from across the United States showed that 86.19% of venues were assigned one categorical value, 13.74%
had no category, and 0.07% had 2 or more categories.
3.2. Geosocial Check-ins
Geosocial check-in data were collected via the Foursquare API with the purpose of constructing temporal
signatures for specific venue categories. A total of 908,031 randomly selected Foursquare venues5 were
accessed via the application API, divided amongst 421 categories, with a goal of accessing 240 venues
per category. Unfortunately given the uniqueness of a number of categories (e.g., Molecular Gastronomy
Restaurant) it was difficult to achieve this number of POI for each category. Once the venues were chosen,
check-in data were accessed every hour for four months starting October 2013. Each request for check-in
information returned a value of HereNow which indicates the total number of users checked-in to the specific
venue at any given time. Provided the number of venues listed above, a total of 3,640,893 check-ins were
temporally analyzed. To account for regional variations, the data was collected from Los Angeles, New York
City, Chicago, and New Orleans.
It is worth noting that the Foursquare data is biased towards a particular user population, places, and
place types. For instance, the typical Foursquare user is a 30-year-old American male and more likely to
check-in at a trendy nightclub than a hospital. We mitigate this problem by aggregating the data to the type
level, i.e., over millions of check-ins, even though some places and place types receive less check-ins, nightclub
still peak during weekend nights, while airports have a more uniform high-entropy visiting probability
throughout the day and week with dips in the late night/early morning. More importantly, however, our
4 Accessed through the public-facing API
5 Venue in this case is the Foursquare-specific term for Point of InterestMarker Category Distance (m) Monday 10AM (10−3 ) Saturday 11PM (10−3 )
A Bakery 39.2 6.28 4.08
B Nightclub 41.4 0.26 44.16
C Nightclub 69.9 0.26 44.16
D American Restaurant 62.7 1.61 9.50
E Bakery 73.7 6.28 4.08
F Fast Food 65.0 4.80 5.78
G Apparel Store 85.8 2.51 1.09
H Ice Cream Shop 82.6 0.84 15.88
I Movie Theater 94.2 1.44 11.00
J Pub 88.9 0.53 22.66
K Cosmetics Shop 60.9 3.87 1.57
L Diner 70.0 5.49 7.56
M Italian Restaurant 45.7 1.42 7.96
N Furniture / Home Store 114.9 4.79 5.01
O Grocery Store 147.8 4.53 1.38
P BBQ Joint 82.3 0.43 9.35
Q Burrito Place 88.1 0.54 3.16
R Italian Restaurant 93.6 1.42 7.96
Table 1: POI Categories shown on Figure 3 with distance to device location and temporal probabilities (sum of
probabilities across all categories sums to 1) on Monday 10 AM and Saturday 11 PM.
work is concerned with studying the role of time for reverse geocoding and the different distortion models,
not the particular geosocial dataset. Other data sources, e.g., from large-scale transportation surveys, could
be used as well. Unfortunately, to the best of our knowledge, no alternative data sources with a similar
spatial, temporal, and thematic resolution exist. Finally, the majority of geolocation services target a similar
audience to Foursquare. We will revisit the Foursquare bias in the evaluation (Section 5).
3.3. Constructing Temporal Semantic Signatures
Provided HereNow values for every POI in the venue set, the values were aggregated by category, hour,
and day of the week. The resulting 168 values for each category span every hour of a week. Normalizing
this data by the total number of check-ins for each category shows the check-ins per hour as a percentage
of the total week.
While these check-in data are limited to a four month time-span, the high resolution allows for temporal
signatures to be constructed for each category. In visualizing the temporal distribution of the check-ins
grouped by category, one can extract novel temporal patterns for each category in the set. These are called
temporal bands and signatures in analogy to spectral signatures in remote sensing and follow a semantics-
driven social sensing approach proposed in previous work [15, 1]. A semantic signature may be composed
of one or multiple bands [1]. Simplifying, a signature is the minimal set of bands that jointly identify a
place type. Figures 4 and 5 show daily and hourly temporal bands (respectively) for four POI categories
that jointly form signatures to uniquely identify categories via the spatiotemporal behavior of users of
location-based social networks.
Modeling the daily check-in bands separately from the hourly check-in bands exposes some interesting
nuances in the data. Both Wineries and Nightclubs are social and entertainment venues that serve alcohol,
and show very similar temporal check-in patterns over a week time period with peaks on the weekend. In
contrast, the hourly temporal bands show a very different pattern. These data show Winery visits peaking
in the mid-afternoon while nightclub check-ins peak late at night (very early morning). This presents a
excellent example of why varying temporal scales are necessary for constructing robust temporal signatures.
Figures 4 and 5 also depict a contrast between activities in which time plays a defining role, e.g., Americanfootball games on Sunday afternoons, and those where temporal aspects are less indicative of a POI type,
e.g., Airports.
Figure 4: Daily temporal signatures for four POI categories.
Figure 5: Hourly temporal signatures for four POI categories.
3.4. Indicativeness of Temporal Bands
This leads to the interesting question of which hours and days are most indicative and whether it is
possible to compress the bands instead of storing all potentially relevant 168 values per POI type. To in-
vestigate this question, we look at the signatures from a classification perspective and consider each band
as a discretized feature (attribute) of a class-labeled set of training tuples. Here, we use the entropy-based
information gain as indicativeness measure. Equation 1 shows the computation of Shannon’s informationentropy for a distribution D, where pi is the probability of band i and Equation 2 computes the informa-
|D |
tion gain (∆(bt )) for a temporal band with |D|j being the weight of the jth partition of the training set
according to this band. Table 2 shows the 10 most indicative hours as well as the 10 least indicative hours.
Intuitively, the typical lunchtime hours (11am-12pm), close of business hours (4-5pm), and dinner/nightlife
hours (10-11pm) are most indicative of a POI type, as is the distinction between workdays and weekends. In
contrast, the early morning hours, e.g., Monday 5am, are significantly less-indicative. Consequently, visiting
probabilities at these times will not differ substantially between POI type and thus can be pruned without
severely impacting the signatures to save storage or optimize indexing.
n
X
H(D) = − pi log2 (pi ) (1)
i=1
n
X | Dj |
∆(bt ) = H(D) − × H(Dj ) (2)
j=v
|D|
Band Hour Information Gain Band Hour Information Gain
143 Friday 11pm 0.772 101 Thursday 3am 0.112
59 Monday 11am 0.750 150 Saturday 6 am 0.097
107 Thursday 11am 0.744 124 Friday 4am 0.093
60 Monday 12pm 0.725 26 Mond ay 2am 0.082
35 Sunday 11am 0.712 27 Monday 3am 0.079
161 Saturday 5pm 0.695 125 Friday 5am 0.063
88 Wednesday 4pm 0.693 28 Monday 4am 0.052
167 Saturday 11pm 0.69 100 Thursday 4am 0.046
142 Friday 10pm 0.688 149 Saturday 5am 0.045
131 Friday 11am 0.687 29 Monday 5am 0.034
Table 2: The 10 overall most indicative hours according to their information gain and the 10 least indicative hours.
4. Temporal Signature-based Location-distortion
In this section we introduce the temporal signature-based location-distortion models and discuss concrete
functions and their parametrization that realize these models.
4.1. Distortion Models
The majority of current geolocation services take a position fix as input and return a list of ascending
distance-ranked POI based on the geographic coordinates of those POI. Given a robust set of type-level
temporal probabilities gathered from location-based social networking check-ins, this paper offers a model
for increasing the accuracy of the distance-only approach through the inclusion of a temporal component.
Different types of POI show fluctuations in visiting probabilities throughout the day. Based on check-
in behavior, these fluctuations reflect increases and decreases in POI type popularity. We leverage these
probabilities to enhance distance-only geolocation approaches. To do so, we propose an analogy to scale
distortion in cartography and distort space by a factor of the temporal probability. That is, we
pull or push POI in the users vicinity depending on their type’s visiting likelihood during a particular time
of the day.6 In the following, we discuss four possible models and potential functions for their realization
(Figure 6) that alter the geographic distance between the query location and each POI by a weighted
temporal probability.
6 It is worth noting that all analogies are partial. We mathematically model the relative impact of distance and time to alter
the POI ranking returned to the user but do not actually modify the underlying geo-data.Figure 6: Four possible distortion models and examples of their realization for shifting POI locations based on the temporal
probability of their types (e.g., restaurant); exaggerated.
These four models represent different approaches to combining distance and time. The linear approach
symmetrically adjusts the distance by pushing POI with low check-in probabilities away from the query
location at a linear rate equivalent to the amount that high-probability venues are pulled towards the query
location. Alternatively, one could model a changing, i.e., non-linear, push/pull rate that changes with the
probability. While still symmetrical in its design, the assumption underlying this model is that highly likely
or unlikely places should be pulled or pushed at a different rate while values close to the mean should
approximate a linear behavior. In Figure 6 (Sine), we employ a particular interval of a sine functions for
the symmetric non-linear model. We also explore non-linear, non-symmetrical options. Rational 1 shown
in Figure 6 depicts an example of one such option. In this case, as the probability of a user checking in to
a POI increases, the amount by which the distance decreases diminishes. Correspondingly, as the temporal
probability decreases, the amount by which the distance increases grows. In other words, those POI with
low check-in likelihoods are punished at a higher rate than those with high probabilities are rewarded. The
inverse approach is also presented in Figure 6, Rational 2, decreasing the influence on geographic distance
as temporal probability values move to the left while exponentially increasing the influence on distance as
values move to the right. Intuitively, the rationale behind both non-linear, non-symmetrical models is to
study whether pushing and pulling should be performed at different rates. Each of these four models is
unique in its approach to the data and the distortion analogy. We compare them, their realizations by
particular functions, and their parameterization next.
4.2. Spatiotemporal Distortion Functions
To combine the temporal signatures with the existing spatial distance-based ranking, we introduce a
new ranked-distance attribute, dt , for each POI. The value of this attribute is defined as a distortion ofthe existing geospatial distance (between the POI and the query coordinates) by a factor of the temporal
probability. In determining the value of dt , two steps must be taken: (1) We must select the function
through which time and distance are combined. (2) The ratio of influence (weight) that both distance and
time have on the new attribute must be determined.
Of the four approaches presented in Figure 6, the linear method was the first to be examined. To start,
we calculated the mean of the temporal probability values, t0m , for all venues nearby our query location. In
order to determine if a given venue should be pushed or pulled from the query coordinates the temporal
probability value of the given venue, t0 is subtracted from this mean. The resulting variable, t˜0 , indicates the
direction (sign) and amount by which said venue’s spatial distance (dt ) should be distorted (Equation 3).
Next, a weighted combination of the normalized distance and normalized temporal probability is calculated
(Equation linear-type) where w is the assigned weight and d0 is normalized spatial distance between the
selected POI and the query coordinates. This approach adjusts the spatial coordinates of a chosen POI by
increasing or decreasing the distance between the POI and the query coordinates linearly and symmetrically.
t˜0 = t0m − t0 Where t0 ∈ [−1, 1] (3)
dt = d0 · w + t˜0 · (1 − w) (linear-type)
While effective, this linear distortion approach is restrictive. This method pushes and pulls all POI at
the same rate, regardless of the amount by which their temporal probability value differs from the mean. An
alternative approach is to use a non-linear function, e.g., a sine function. The sine function approximates
the linear method as t˜0 approaches zero, but decreases in magnitude of distortion as temporal probability
values move away from zero. For this second approach, dt as computed as shown in Equation sine-type.
dt = d0 − sin(t˜0 ) · w (sine-type)
Though appropriate for the data, the sine approach (for that particular interval) still assumes that POI
on either side of the temporal mean should be distorted symmetrically. Thus, we explored non-symmetric
models with the purpose of decreasing the distortion of the temporal probability on the positive side of the
mean at a greater rate than those values on the negative side of the mean (for instance). We modeled this
by employing a weight-adjusted rational function (Equation rational-type 1). The inverse approach was also
modeled as shown in Equation rational-type 2. Relaxing the symmetry requirement makes the statement
that those POI that are less probable (of being visited at the given time of the day/week) should arguably
be pushed further away from the query location at a higher rate than those being pulled closer.
0 w
dt = d − 1 − (rational-type 1)
t˜0 + w
w
dt = d0 − −1 (rational-type 2)
−t˜0 + w
Each of the methods discussed in this section offers a unique perspective on the push / pull approach
to spatial distance distortion. While countless other methods could potentially be evaluated, these four
approaches cover the fundamental concepts necessary for this work, namely, symmetric vs. non symmetric
and linear vs. non linear distance distortion.
4.3. Weights
In the next step we determined the most suitable weight ratio between the normalized distance and the
normalized temporal probabilities by using a set of geosocial check-in test data.
Using the Twitter Streaming API [27], 3,500 geolocated Foursquare check-ins were sampled from within
the Greater Los Angeles region between November 1st and November 20th, 2013. The geographic coordinates
as well as the category of the POI in which the Twitter user checked in were accessed. The number of check-
ins (and the associated POI) were reduced to 2,800 to ensure that only those POI that showed at least 15other POI within a 100 meter radius were included in the sample. This restriction ensured that the results
were not biased due to a lack of available POI from which the model could make a selection.
The geographic coordinates of these 2,800 check-ins/POI were employed as the base user locations from
which the geolocation model would be built. In order to mimic the accuracy of a GPS enabled mobile device
and arbitrariness in point-feature placement, an location-uncertainty component was introduced. Altered
test locations were drawn from a normal distribution with a mean of 30 meters and standard deviation of
10 meters from the POI’s known geographic location (from Foursquare). The directional (angular) offset
was randomly assigned for each set of coordinates. These coordinate values were taken as individual user
locations which then formed the basis on which the geolocation model could be trained. As discussed in the
introduction section this is a very conservative estimate of the involved positional uncertainties. Stronger
shifts in position would additionally favor our time-enabled method.
Provided these test user locations, a baseline test was developed. Each of the 2,800 test locations were
queried against a comprehensive set of 15,729 POI and all POI within a 100 meter radius of each queried
test user location were returned and ranked by geographic distance from shortest to longest. The ranked
position of the POI known to be the user’s true check-in location was recorded for each scenario and the
Mean Reciprocal Rank (MRR) was then calculated for the overall test results. MRR, shown in Equation 4, is
a statistical measure for evaluating the results of a ranked set of N (Number of POI in this case) responses.
|N |
1 X 1
M RR = (4)
|N | i=1 ranki
Using the distance-only MRR as a baseline, we tested which combination of weight and function maxi-
mized the MRR value, i.e., we quantified the relative importance of time for reverse geocoding as well as the
particular distortion model that would yield the best results. Four other sets of MRR values were calculated
based on the combination of temporal probability with geographic distance using each of the four functions
discussed earlier (Figure 6). Each model was tested multiple times with a weight value increasing from zero
at increments of 0.1. Figure 7 shows that all of the weighted functions out-perform the distance-only method
at some point.
To validate this finding and ensure that the selected functions and weights are not merely an artifact of
using MRR as the measure, we computed additional rank comparison measures. A sum of the reciprocal
rank (SRR) method was explored as well as counting the number of correctly identified POI (rank position
1). Finally, the popular normalized Discounted Cumulative Gain (Equation 5) measure was computed for
each of the functions where DCG is defined by Equation 6 and P OIcount is the number of POI identified at
the specified ith ranked position. IDCG is the ideal discounted cumulative gain which in this case is 2,800
given that an ideal result would correctly identify all POI in the first ranked position. The maximum MMR
values, SSR, nDCG and first ranked position count along with their associated weights for each function are
shown in Table 3 indicating that the Rational 1 based model produces the best overall results with a weight
of 2.8. It is worth noting that the linear model only performs well within a narrow band of weight values
and that the Rational 1 approach continues to perform well with high weight values.
DCG
nDCG = (5)
IDCG
N
X P OIcounti
DCG = P OIcount1 + (6)
i=2
log2 (i)
Taking this result, we revisited our running example introduced in Section 2 and distorted the query
location and the POI locations by shifting them closer or further away. Figure 8 depicts this adjustment
given a query time of 10 AM on Monday morning. The original distance from the query location to each POI
is shown in the table and the original locations are shown as faded markers on the map. The new distorted
distances are listed in the table as well as shown on the map via the bright blue markers. By comparison,
Figure 9 shows the same process for 11 PM on Saturday night. Note that in the original distance-onlyFigure 7: Mean Reciprocal Rank for Four Equation and associated weight values compared to Distance-only.
Function Max MRR Max SRR nDCG First Pos. Weight
Distance Only 0.392 1095 0.621 485 NA
Linear 0.444 1245 0.665 661 0.7
Sine 0.395 1154 0.642 539 0.1
Rational 1 0.446 1250 0.669 665 2.8
Rational 2 0.442 1239 0.662 657 2.7
Table 3: Maximum Mean Reciprocal Rank (MRR), Maximum Sum of the Reciprocal Rank (Max SRR), normalized Discounted
Cumulative Gain (nDCG), Number of POI ranked in the first position and associated weight for each Equation.
scenario (see Figure 3), the distance to the Bakery (A), the Nightclub (B), and the Italian Restaurant (M)
are similar where the distorted cases lists very different distances with the Bakery (A) being nearest in
Figure 8 and the Nightclub (B) being closest in Figure 9. The marker colors of these POI switch from red to
green and vice versa between the two figures indicating a pull (green) or push (red) from the query location.
Additionally, note that the Italian Restaurant (M) remains red between both figures indicating that it is
not a very probable location at either time.7
5. Evaluation and Discussion
In order to test the validity of the temporally weighted geolocation approach, we designed an experiment
with geosocial user data that tests the selected non-linear non-symmetric model with a weight of 2.8 against
a distance-only based approach for a new test set of known locations and check-ins.
Specifying the Greater Los Angeles region as the boundary, the Twitter Streaming API was used to
collect tweets that shared a Foursquare check-in. When a user of the Foursquare application decides to
7 Keeping in mind that those temporal signatures are derived from data from the US and certain POI type are expected to
have varying signatures across cultures, countries, and regions.Marker Actual Distorted
Dist.(m) Dist.(m)
A 39.2 25.8
B 41.4 71.4
C 69.9 99.9
D 62.7 79.8
E 73.7 60.3
F 65.0 59.5
G 85.8 95.6
H 82.6 106.7
I 94.2 112.8
J 88.9 116.1
K 60.9 61.1
L 70.0 60.6
M 45.7 64.5
N 114.9 109.5
O 147.8 143.9
P 82.3 110.5
Q 88.1 115.2
R 93.6 112.4
Figure 8: Nearby POI locations (dark blue markers) adjusted by temporal probability at 10AM on Monday. Original POI
locations visible as light blue markers. Three example locations (A, B, M) are shown in red, indicating pushed further away
and green, indicating pulled closer to the assumed user location.
check-in to a place, they are given the option of sharing this data on their Twitter Feed. While Foursquare
check-in data itself is not publicly available, the majority of Twitter feeds are. Using this method, 1,663
unique check-ins were accessed over a 24 hour period.
Immediately on receipt of the check-in data, the geographic coordinates of the POI were randomized
using the method described in Section 4.3 to reflect standard GPS inaccuracy and a new set of geographic
coordinates were established for the user. These user coordinates were queried against the Foursquare Venues
API (with the Intent parameter set to Browse 8 ) and a set of 30 nearby POI were returned containing the
distance from the query coordinates, HereNow (number of Foursquare users currently checked in to the
POI), and TotalCheckins (total number of all-time check-ins to a specific POI).
Additionally, a separate query was made to the Foursquare Venues API with the Intent parameter set to
Checkin. According to the Foursquare documentation Browse takes a distance-only approach to querying
the gazetteer returning a set of nearby POI ordered by distance from query location, shortest to longest.
Thus, the Browse mode is equivalent to most available geolocation services. The Checkin approach is not
full explained in the documentation and simply states that the returned set of POI are ordered based on
where a typical user is likely to check-in to at the provided latitude and longitude at the current moment
in time. This option is most likely based on the company’s internal popularity counts. In addition to the
Intent parameter, each query was executed with additional parameters that specified a radius of 100 meters
and minimum of 20 and maximum of 30 nearby POI. This limited bias due to a lack of nearby places.
Provided the set of nearby POI returned for each of the 1,663 queried user locations, the distance-only
method can be compared against our new temporal signatures enhanced method. Since the actual POI
to which the user checked in is known, it is possible to calculate a number of different measures for each
approach. Table 4 presents the difference between these two methods across MRR, SRR, nDCG and 1st
positions measures. The table shows that the inclusion of the temporal signatures model with a weight of
2.8, substantially outperforms the distance only method over all measures. In fact, the mean reciprocal rank
(MRR) values rise from 0.359 to 0.453, an increase of 26.34% and the nDCG values increase by 21.96%.
Ranking the POI based purely on TotalCheckins produces a MRR of 0.678. Such a large discrepancy
in numbers between distance-only and TotalCheckins method is an important reminder of how biased the
8 Foursquare offers four methods for querying their gazetteer: browse, checkin, global and match.Marker Actual Distorted
Dist.(m) Dist.(m)
A 39.2 74.7
B 41.4 32.8
C 69.9 61.3
D 62.7 90.1
E 73.7 109.2
F 65.0 97.8
G 85.8 126.2
H 82.6 101.5
I 94.2 119.5
J 88.9 99.9
K 60.9 100.5
L 70.0 100.2
M 45.7 75.3
N 114.9 148.9
O 147.8 187.7
P 82.3 109.9
Q 88.1 125.1
R 93.6 123.2
Figure 9: Nearby POI locations adjusted by temporal probability at 11PM on Saturday. Original POI locations visible as
light blue markers. Three example locations (A, B, M) are shown in red, indicating pushed further away and green, indicating
pulled closer to the assumed user location.
Method MRR SRR nDCG 1st Pos.
Distance-Only 0.359 443.8 0.583 211
Temporally Adjusted 0.453 793.5 0.711 423
Table 4: Comparing the results of the Distance Only method to our method which includes temporal signatures.
Foursquare data and its users are, i.e., a very high percentage of the total user base predictably visits a
small number of establishments. While TotalCheckins works well for an application such as Foursquare,
the majority of geolocation services do not rely on a closed community and explicit check-ins from their
users, but have to estimate the place based on space (and time) alone. Interestingly, adding our temporal
distortion method to TotalCheckins can further improve Foursquare’s results. If we use the TotalCheckins
values in lieu of geographic distance, first normalizing the values and then subtracting them from 1. This
resulted in an MRR value of 0.692 a 2.1% increase over TotalCheckins alone.
The HereNow approach (ranking POI by the number of users currently checked in) to determining a
user’s placial location is self fulfilling. Note that this validation model is based on real check-in data and
ranking a set of nearby POI based on the number of users currently checked in will always involve a high
degree of bias. The correct POI will always have at least one current check-in. Examining Table 5, the
influence of this bias becomes immediately apparent. The vast majority of POI do not show a single current
check-in with a limited few listing 1. Were this example scenario to be run multiple times, one would expect
the known POI to be correctly identified half of the time and the POI ranked 6th in the list (also showing
a HereNow value of 1) to be identified half of the time. This tie, so to speak, can be broken through
the inclusion of temporal signatures. Again, replacing the d0 variable with the normalized HereNow value
subtracted from 1, Equation rational-type 1 is applied resulting in a 3.1% increase and MRR measure of
0.872.
Lastly, Foursquare’s closed check-in method is examined. It must be reiterated that while the Foursquare
method does produce a very high MRR value (0.733) it relies on data not available to most geolocation
services and involves a significant amount of user bias which is likely exploited by this method [25]. Though
its performance is strong, it may be further enhanced through our temporally-enhanced method. In thisPOI ID Distance(m) TotalCheckins HereNow
4bba348c53649c746bc248fb 16 1398 1
4d14fbb981cea35d9e80d7ec 16 705 0
4a52bc1cf964a520f7b11fe3 22 479 0
4af22b13f964a5204be621e3 24 877 0
4acbf6abf964a52077c820e3 29 900 0
51301edfe4b01507da6114f2 37 675 1
516327d7e4b063c6e8320956 41 8 0
4a12b3baf964a5208e771fe3 43 3282 0
4e01174b1f6ef39c29422260 45 2560 0
4cd19cf9f6378cfa8e8abcd6 45 59 0
Table 5: Example of Foursquare Search API query results ordered by distance and limited to 10. Known check-in location in
bold face.
case, the nearby POI returned from the search query are assigned a rank value based on their order within
the set. This ranked value is normalized and assigned to the d0 variable in the rational-type 1 equation. The
resulting MRR of 0.747 is 2% higher than the proprietary-only approach showing that even a calibrated,
in-house built method can be improved upon through the inclusion of temporal signatures.
6. The Next Step: Geosocially Distorting the User’s location
The previous sections discussed a novel method for distorting the geographic location of POI based on
the temporal probability of an individual visiting these POI as determined by their type. Additionally,
in this section we outline a model that focuses on distorting the geographic location of the user’s device
location based on the presence of geosocial activity nearby. The geosocial activity referred to in this case
pertains to trending online activities such as geotagged tweets and geotagged Instagram photographs that do
not include placial tags but are tagged with geographic coordinates. Since these posts cannot be directly
assigned to POI, they cannot influence the amount and direction by which a POI location is distorted.
Instead, these activities impact the ability to geolocate an individual through distorting the actual query
coordinates themselves.
Figure 10 presents an example scenario. The blue markers on the map indicate the location of POI,
similar to figures shown previously. Instagram (camera icon) and Twitter (t icon) markers are shown on the
map as well. These geosocial activities are collected over a one hour time period. In looking at this map, it
is apparent that an event is occurring at the plaza (green region) given the high number of tweet and photo
activity in the past hour. Combining this information with the knowledge that the user’s query location is
subject to uncertainty, adjusting the query location closer to the plaza is a reasonable proposal.
Using vector addition, a new vector is calculated from which distortion direction is ascertained. The
amount by which the query location is adjusted is based on two factors. An inverse distance weight is
calculated for each geosocial activity, assigning a greater weight to nearby activities than those occurring
further away. Note that actual content of the tweet or Instagram caption is irrelevant in this approach.
While some individual’s may prefer one source of social content over another, for our purposes, all geo-
social activities are of equal value, their influence on the query coordinates are based solely on distance and
direction. The second factor influencing the distortion is the global weight value with which the combination
of these activities influence the query location. This global weight is the focus of future research and will
involve additional training in order to establish an optimal value.
It is worth noting that we do not assume that the presence of a Tweet or Instagram photo in a specific
region indicate that this is the only area where an activity is occurring. This approach takes the presence
of geosocial data as an additional and readily viable variable that can be employed to better geolocate an
individual based on locations that are currently trending. This method makes the assumption that the
presence of a tweet or photo represents an increase in probability that some activity is taking place at this
location.Figure 10: Example visualization of a user’s actual location (faded red pin), adjusted location (bright red pin), location
uncertainty (large blue circle), Foursquare POI (blue markers) and Twitter and Instagram activity markers.
Intuitively, the temporal signatures-based method introduced in this paper exploits assumptions about
the default behavior of people, e.g., nightclubs are visited predominantly on weekend nights. In contrast,
adjusting the user’s potential location towards centers of (real-time) activity as observed from social media
gives us the possibility to deviate from the default behavior. We call this the bust-mode to indicate that it
overrides the default view on place and time [19]. The difference between default and burst mode could also
be applied for other tasks in the future, e.g., for anomaly detection.
7. Related Work
Existing research on user and mobile device specific geolocation services can be split in to two roughly
defined groups. One approach focuses on the technical aspects associated with determining one’s location,
increasing the accuracy of location-based technologies [26, 7] as well as enhancing the efficiency of location
services on mobile devices [24, 21]. For better or worse, these advances are reflected in a number of patents
filed recently [33, 4]. While useful, these approaches do not consider non-technical sources of geolocation
information, but instead focus on reducing the uncertainty associated with a device’s geographic coordinates.
The second approach has arisen from place recommendation research. Many of these approaches take
advantage of the rise in geosocial check-ins and posts to explore user-similarity, [16, 5, 29] as well as user’s
home locations [2, 14]. Additionally, recent work has begun to explore temporal patterns in user behavior
through online social networking check-ins [11, 6] as well as human mobility patterns through mobile device
tracking [32, 22]. Shaw et al. [25] explored the use of check-in data for enhancing venue search results in
the Foursquare application. While the authors did investigate both the temporal and spatial components of
check-ins, they did so without exploiting category types. Additionally, their methodology for merging spatial
and temporal data is sparse and clearly does not consider distorting space by a function of time. Lastly,
though their work does produce promising results, these results are specific to the Foursquare application
and founded on a level of data-access restricted to Foursquare employees and thus of limited use to the
reverse geocoding community outside of the company.
From a temporal signatures perspective, early work by Ye et al., [30] extracted check-in behavior from
the online location-based social network Whrrl to determine daily and hourly default temporal patterns for
a number of Whrrl place types. Yuan et al. [31] took this a step further using these temporal patterns torecommend points of interest based on the time of day. Furthermore, Wu et al. [28] show how social media
check-in data can be used for combining a movement-based approach with activity-based analysis in studying
human mobility patterns. In exploring Flickr data, Hauff [13] recently found that the popularity of venues
plays an important role (orders of magnitude) in the accuracy of geotagged Flickr photos. Additionally, a
large study on mobile phone usage by Yuan et al. [32] found unique activity patterns based on age and gender
indicating that temporal signatures may differ not only by POI category, but also by visitor demographics.
While much of this work has focused on extracting user behavior from social-sharing platforms, it has
been used to estimate, predict or make recommendations on places an individual may have visited (past)
or should/may visit (future). To the authors’ knowledge, very little research has focused on using existing
public, place-based check-in behavior to enhance existing technical approaches to geolocation in real-time.
Additionally, no published work can be found that distorts geographic distance by a factor of temporal
probability.
8. Conclusions & Future Work
The striking increase in location-based mobile applications in recent years is driving the need for better
and more accurate geolocation services to the forefront of geo-computational research. Compounded by
the inaccuracies of user-generated geo-content, positioning technologies, arbitrariness of the point-feature
based representation of places, and to forth, the need for geolocation methods built on more than mere
Euclidean distance are a necessity. Online geosocial networking solutions now offer researchers the ability
to study human activity behavior which supply the foundation for categorically unique check-in signatures.
By incorporating these semantic signatures with existing distance-only based geolocation services, more
accurate results can be ascertained.
In this paper we demonstrate a novel technique for incorporating temporal signatures with geographic
distance by virtually distorting (pushing and pulling) the geographic coordinates of nearby Places of Interest.
In order to achieve the highest accuracy, a non-linear, non-symmetric approach was employed significantly
outperforming the distance-only based geolocation service. Additionally, this same method was used to
enhance existing state-of-the-art check-in and proprietary methods offered by top mobile applications on
the market today. Finally, we outline a method for the enhancement of this approach through the use of
geotagged social content such as tweets and Instagram photographs.
Future work in this area will include the continued enhancement and fine-tuning of the existing temporal
signature weight and function. The methods above outline one possible technique for incorporating time
with spatial reverse geocoding and future work will focus on improving the formula as well as including
geosocial activities outlined in Section 6. While the method used in this work improved upon the distance-
only baseline by between 12-26% for MRR (and has high as 50% for 1st Position Ranking), another sample
set from another region may produce slightly different results. A limitation of this work is evident in the three
month span of data collection. An increase in the temporal extent of the data will allow further research into
seasonal effects, holidays and climate fluctuation to name a few. Additional work aims to investigate regional
variance in categorical-temporal signatures (e.g., Nightclubs in New York vs. Nightclubs in Los Angeles) as
well as the influence of local weather patterns and daylight effects. The enhancement of the existing dataset
will serve to increase the accuracy and robustness of the temporal signatures-based approach. Finally, an
online service is in development that will allow interested parties to increase the accuracy of existing services
in real-time and over large datasets.
References
[1] Adams, B., Janowicz, K., 2015. Thematic signatures for cleansing and enriching place-related linked data. International
Journal of Geographical Information Science (ahead-of-print), 1–24.
[2] Backstrom, L., Sun, E., Marlow, C., 2010. Find me if you can: improving geographical prediction with social and spatial
proximity. In: Proceedings of the 19th international conference on World wide web. ACM, pp. 61–70.
[3] Bowling, E., Shortridge, A., 2010. A dynamic web-based data model for representing geographic points with uncertain
locations. In: Spatial Accuracy Dymposium 2010. pp. 1–4.[4] Brewington, B. E., Brown, B. G., Guggemos, J. A., Hawkins, D., Stout, B., Sep. 10 2013. Augmentation of place ranking
using 3d model activity in an area. US Patent 8,533,187.
[5] Cheng, H., Arefin, M. S., Chen, Z., Morimoto, Y., 2013. Place recommendation based on users check-in history for
location-based services. International Journal of Networking and Computing 3 (2), 228–243.
[6] Cheng, Z., Caverlee, J., Lee, K., Sui, D. Z., 2011. Exploring millions of footprints in location sharing services. ICWSM
2011, 81–88.
[7] Fallah, N., Apostolopoulos, I., Bekris, K., Folmer, E., 2013. Indoor human navigation systems: A survey. Interacting with
Computers 25 (1), 21–33.
[8] Flickr, 2014. Flickr developer documentation.
URL http://www.flickr.com/services/api/flickr.places.findByLatLon.htm
[9] Foursquare, 2014. Foursquare category hierarchy.
URL https://developer.foursquare.com/categorytree
[10] Foursquare, 2014. What is the style guide for adding and editing places?
URL http://support.foursquare.com/hc/en-us/articles/201064960-What-is-the-style-guide-for-adding-and-editing-places
[11] Gao, H., Tang, J., Hu, X., Liu, H., 2013. Exploring temporal effects for location recommendation on location-based social
networks. In: Proceedings of the 7th ACM conference on Recommender systems. ACM, pp. 93–100.
[12] Harvey, F., 2014. We know where you are. and were more and more sure what that means. In: Emerging Pervasive
Information and Communication Technologies (PICT). Springer, pp. 71–87.
[13] Hauff, C., 2013. A study on the accuracy of Flickr’s geotag data. In: Proceedings of the 36th international ACM SIGIR
conference on Research and development in information retrieval. ACM, pp. 1037–1040.
[14] Hecht, B., Hong, L., Suh, B., Chi, E. H., 2011. Tweets from Justin Bieber’s heart: the dynamics of the location field in
user profiles. In: Proceedings of the SIGCHI Conference on Human Factors in Computing Systems. ACM, pp. 237–246.
[15] Janowicz, K., 2012. Observation-driven geo-ontology engineering. Transactions in GIS 16 (3), 351–374.
[16] McKenzie, G., Adams, B., Janowicz, K., 2013. A thematic approach to user similarity built on geosocial check-ins. In:
Geographic Information Science at the Heart of Europe, Proceedings of the 2013 Association of Geographic Information
Laboratories in Europe Conference (AGILE ’13). Springer, pp. 39–53.
[17] McKenzie, G., Janowicz, K., 2014. Coerced geographic information: The not-so-voluntary side of user-generated geo-
content. In: Extended Abstracts of the Eighth International Conference on Geographic Information Science.
[18] McKenzie, G., Janowicz, K., Adams, B., 2014. A weighted multi-attribute method for matching user-generated points of
interest. Cartography and Geographic Information Science 41 (2), 125–137.
[19] McKenzie, G., Janowicz, K., Gao, S., Yang, J.-A., Hu, Y., In Press. POI Pulse: A multi-granular, semantic signatures-based
approach for the interactive visualization of big geosocial data. Cartographica: The International Journal for Geographic
Information and Geovisualization.
[20] Noulas, A., Scellato, S., Mascolo, C., Pontil, M., 2011. An empirical study of geographic user activity patterns in foursquare.
ICWSM 11, 70–573.
[21] Paek, J., Kim, J., Govindan, R., 2010. Energy-efficient rate-adaptive GPS-based positioning for smartphones. In: Pro-
ceedings of the 8th international conference on Mobile systems, applications, and services. ACM, pp. 299–314.
[22] Palmer, J. R., Espenshade, T. J., Bartumeus, F., Chung, C. Y., Ozgencil, N. E., Li, K., 2013. New approaches to human
mobility: Using mobile phones for demographic research. Demography 50 (3), 1105–1128.
[23] Raubal, M., Miller, H. J., Bridwell, S., 2004. User-centered time geography for location-based services. Geografiska Annaler:
Series B, Human Geography 86 (4), 245–265.
[24] Schilit, B. N., LaMarca, A., Borriello, G., Griswold, W. G., McDonald, D., Lazowska, E., Balachandran, A., Hong, J.,
Iverson, V., 2003. Challenge: Ubiquitous location-aware computing and the place lab initiative. In: Proceedings of the 1st
ACM international workshop on Wireless mobile applications and services on WLAN hotspots. ACM, pp. 29–35.
[25] Shaw, B., Shea, J., Sinha, S., Hogue, A., 2013. Learning to rank for spatiotemporal search. In: Proceedings of the sixth
ACM international conference on Web search and data mining. ACM, pp. 717–726.
[26] Tawk, Y., Tomé, P., Botteron, C., Stebler, Y., Farine, P.-A., 2014. Implementation and performance of a GPS/INS tightly
coupled assisted pll architecture using mems inertial sensors. Sensors 14 (2), 3768–3796.
[27] Twitter, 2014. Twitter developer documentation.
URL https://dev.twitter.com
[28] Wu, L., Zhi, Y., Sui, Z., Liu, Y., 2014. Intra-urban human mobility and activity transition: Evidence from social media
check-in data. PloS one 9 (5), e97010.
[29] Xiao, X., Zheng, Y., Luo, Q., Xie, X., 2010. Finding similar users using category-based location history. In: Proceedings
of the 18th SIGSPATIAL International Conference on Advances in Geographic Information Systems. ACM, pp. 442–445.
[30] Ye, M., Janowicz, K., Mülligann, C., Lee, W.-C., 2011. What you are is when you are: the temporal dimension of feature
types in location-based social networks. In: Proceedings of the 19th ACM SIGSPATIAL International Conference on
Advances in Geographic Information Systems. ACM, pp. 102–111.
[31] Yuan, Q., Cong, G., Ma, Z., Sun, A., Thalmann, N. M., 2013. Time-aware point-of-interest recommendation. In: Pro-
ceedings of the 36th international ACM SIGIR conference on Research and development in information retrieval. ACM,
pp. 363–372.
[32] Yuan, Y., Raubal, M., Liu, Y., 2012. Correlating mobile phone usage and travel behavior–a case study of harbin, china.
Computers, Environment and Urban Systems 36 (2), 118–130.
[33] Zeto III, M. J., Rippetoe, D., Shaw, D., Mercer, A. R., Gaxiola Jr, G., Williams, R. T., Johansson, E. A. O., Jun. 6 2013.
System and methods for delivering targeted marketing content to mobile device users based on geolocation. US Patent
App. 13/911,956.You can also read