Identifying unknown Indian wolves by their distinctive howls: its potential as a non invasive survey method - Nature
←
→
Page content transcription
If your browser does not render page correctly, please read the page content below
www.nature.com/scientificreports
OPEN Identifying unknown Indian wolves
by their distinctive howls: its
potential as a non‑invasive survey
method
Sougata Sadhukhan1, Holly Root‑Gutteridge2,3 & Bilal Habib1*
Previous studies have posited the use of acoustics-based surveys to monitor population size and
estimate their density. However, decreasing the bias in population estimations, such as by using
Capture–Mark–Recapture, requires the identification of individuals using supervised classification
methods, especially for sparsely populated species like the wolf which may otherwise be counted
repeatedly. The cryptic behaviour of Indian wolf (Canis lupus pallipes) poses serious challenges to
survey efforts, and thus, there is no reliable estimate of their population despite a prominent role in
the ecosystem. Like other wolves, Indian wolves produce howls that can be detected over distances
of more than 6 km, making them ideal candidates for acoustic surveys. Here, we explore the use
of a supervised classifier to identify unknown individuals. We trained a supervised Agglomerative
Nesting hierarchical clustering (AGNES) model using 49 howls from five Indian wolves and achieved
98% individual identification accuracy. We tested our model’s predictive power using 20 novel howls
from a further four individuals (test dataset) and resulted in 75% accuracy in classifying howls to
individuals. The model can reduce bias in population estimations using Capture-Mark-Recapture and
track individual wolves non-invasively by their howls. This has potential for studies of wolves’ territory
use, pack composition, and reproductive behaviour. Our method can potentially be adapted for other
species with individually distinctive vocalisations, representing an advanced tool for individual-level
monitoring.
Accurate population estimates are a critical part of wildlife biology, conservation and inform management
strategies1. Informed management decisions rely on accurate estimates which can be hard to achieve but are criti-
cal as the conservation status of any species is dependent on its population size, which is inversely correlated with
extinction risk2. Therefore, it is of the foremost importance to have a statistically robust population estimation
technique. However, widely used population estimation methods such as camera trapping and sighting-based
distance sampling fall short in analysing population trends of certain elusive species or species living in extensive
home ranges3,4. Many of these species are vocally active, which inspired scientists to study the effectiveness of an
acoustics-based population abundance model for these species5–8. Acoustic monitoring has long been used to
monitor the presence of aquatic animals, amphibians, insects, and birds9–13. The critical advantages of acoustic
monitoring are that it can be operative at day and n ight14 and detect visually cryptic species or those spread over
large home r anges7,15,16. Like camera traps, passive acoustics devices can operate throughout the day for weeks
without intervention, and this perpetual data can be analysed easily with the advancement of methodologies
for automating the p rocess17. Recordings from these devices can be used in calculating a wide range of metrics
including acoustic indices18,19, animal diversity19,20, animal localisation21–23, and density24,25 estimation. This
density estimation is mostly obtained through Spatially Explicit Capture-Recapture (SECR) that relies on mul-
tiple recording stations for Capture-Mark-Recapture (CMR), and instead of ‘recapture’ with time, it considers
‘redetection’ in different points in s pace24–26. This methodology is applied to individuals that are not identifi-
able from their c alls25,27. The conventional CMR model requires identification at the individual level27,28, but it
provides a robust population e stimation28 and much additional information such as home-range, survival rate,
animal movement pattern, and population viability analysis29. However, the difficulty of successfully identifying
unknown individuals from their calls has prevented its use for more species, though new techniques are being
1
Animal Ecology and Conservation Biology, Wildlife Institute of India, Dehradun 248001, India. 2Animal Behaviour,
Cognition and Welfare Group, University of Lincoln, Lincoln, UK. 3Reby Lab, School of Psychology, University of
Sussex, Brighton, UK. *email: bh@wii.gov.in
Scientific Reports | (2021) 11:7309 | https://doi.org/10.1038/s41598-021-86718-w 1
Vol.:(0123456789)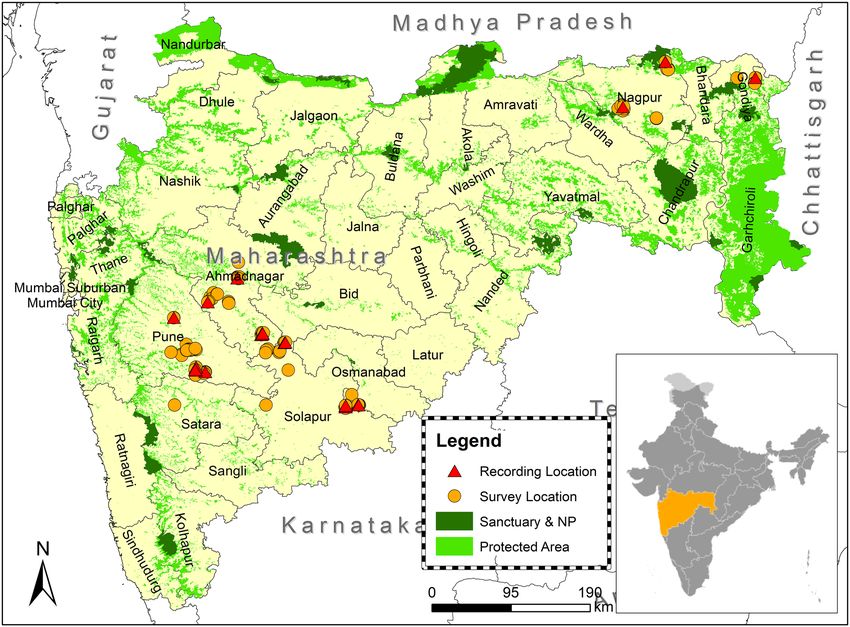
www.nature.com/scientificreports/
developed for some species, including the use of unsupervised classifiers to cluster c alls30. Here, we explore the
potential of identifying individuals through supervised classification from their vocal features to potentially
improve identification to the point where CMR surveys are possible for an elusive and wide-ranging species.
Like other grey wolf subspecies, Indian grey wolves are known for their long-ranging communication via
howls31. Howling is a social communication process, vital for the overall behaviour of many canid s pecies32. It
has evolved in wolves to communicate with other group members over a long distance as well as to demarcate
their vast t erritories33. Due to its high amplitude and low frequency, a howl can travel for six kilometres or
more34–36. Hence, an acoustics survey using howling may be more advantageous than a visual survey or other
methods, such as snow-tracking22,23,35,37. As vocalisations of wolves were found to be highly variable within and
among individuals31,38, the howl is a useful tool to identify i ndividuals39–41; thus, wolves are ideal candidates for
acoustic monitoring techniques.
Previously the ‘Howlbox’, a self-contained active acoustics-monitoring device that broadcasts howls and
records the responses automatically, was tested for its capability to detect w olves42,43. This device was unsuc-
cessful in surveying wolves due to low detection rate as, instead of howling back, the wolves visited the device
site without howling, and various technical failures42. A few studies using passive acoustic devices show the
potentiality of successful localisation and monitoring of the grey w olf23,44. However, these only allowed for pres-
ence to be detected and stopped short of individual identification. In contrast, the identification of wolves from
their distinctive howls will open an opportunity for more conventional CMR methods45, and this will improve
population estimation without bias and help to measure other ecological variables, such as site occupancy and
home-range. With the ability to identify individual wolves from howl recordings, information on population
sizes, dispersal patterns, pack composition and the presence of pups could be obtained. These would be used to
develop conservation management strategies and to examine population trends with howl surveys conducted
over multiple years. Therefore, our study aimed to record howls from Indian wolves (Canis lupus pallipes) and
test the feasibility of identifying unknown individuals from their howls alone using a supervised classification
method.
Methods
Study species. Indian wolf, subspecies of the grey wolf is among the keystone species found in the Central
Indian landscape46 and reside in arid grasslands, floodplains, and the buffer of dense forests46–49. The Indian wolf
plays a significant ecological role in controlling ungulate populations in the human-dominated landscapes50,51.
The population status of Indian wolves is entirely u nknown52. It is known that Indian wolves face a major threat
from humans as their habitat is increasingly used by humans, and human-wildlife conflict is increasing53. There-
fore, time is a critical factor to their conservation. The major challenges for population estimation of the wolf are
its vast home range of ~ 230 km248 and that they actively avoid camera traps because of camera sound, light, and
odour emission54. Since implementing standard population monitoring tools in these landscapes is a tremendous
challenge, monitoring their population through howls can be an essential technique. The average fundamental
frequency and duration of Indian wolf howls are 422 Hz and 5.21 s, r espectively55. Due to its low-frequency
range and longer duration, it can be heard from an extended distance like howls of other s ubspecies23,35,36.
Study site. The study was conducted on captive individuals of Jaipur Zoo and free-ranging, wild wolves of
Maharashtra, India.
Jaipur Zoo is situated at the heart of Jaipur City, Rajasthan, India. Since Jaipur is one of the major tourist
destination and capital of Rajasthan, the anthropogenic noise is reasonably high in and around the zoo. All the
wolves (n = 10) in Jaipur zoo were offspring of captive-bred individuals except one adult male recently captured
from a wild population of Rajasthan.
The data of free-ranging wild wolves were collected from six districts of Maharashtra. Pune, Ahmednagar,
Solapur and Osmanabad (Fig. 1) districts fall under the semi-arid drought-prone area of the Deccan peninsula
Biogeographic Zone (Zone 6)56. The dominant habitat type in our sampling areas was Deccan thorn scrub forests57.
The terrain is gently undulating with mild slopes and flat-topped hillocks with intermittent shallow valleys, which
forms the primary drainage channels. Grassland area is distributed in fragmented patches, creating a mosaic of
grazing land, agricultural land and human settlements. Striped hyenas (Hyaena hyaena), golden jackals (Canis
aureus indicus), and Indian leopards (Panthera pardus fusca) are the co-predators in this landscape48,58. Wild
prey include blackbucks (Antilope cervicapra), chinkaras (Gazella bennettii) and wild pigs (Sus scrofa cristatus);
but a significant part of their diet is domestic livestock48,50,59.
In Maharashtra, Nagpur and Gondia districts come under the central Deccan Plateau with Tropical dry
deciduous broadleaf f orests56,57. Due to moderate to high rainfall, vegetation is dense in most of the areas. Our
sampling areas were mostly packed with open forest and modest density forest. The terrain is generally flat.
Nagpur division is surrounded by Many National parks and Sanctuaries. Wolves are primarily found in the
buffer areas of these protected areas. Co-predators in those stretches are tigers (Panthera tigris tigris), Indian
leopards, sloth bears (Melursus ursinus), striped hyenas, dholes (Cuon alpinus), and golden jackals. Prey species
are sambar (Rusa unicolor), nilgai (Boselaphus tragocamelus), chital (Axis axis), chousingha (Tetracerus quad-
ricornis), and wild pigs.
Data collection. The howls from the Indian wolves were recorded from November 2015 to July 2016. The
howls were recorded during the systematic howling surveys accompanied by the opportunistic and spontane-
ous recordings of captive and free-ranging wolf howls. Howling surveys were done in the early morning (from
4:30 am onwards) and early evening hours (up to 7:45 pm) [time varies depending on sunrise and sunset]. The
survey protocol was adapted from Harrington and M ech60. Each howling session consisted of five trials with
Scientific Reports | (2021) 11:7309 | https://doi.org/10.1038/s41598-021-86718-w 2
Vol:.(1234567890)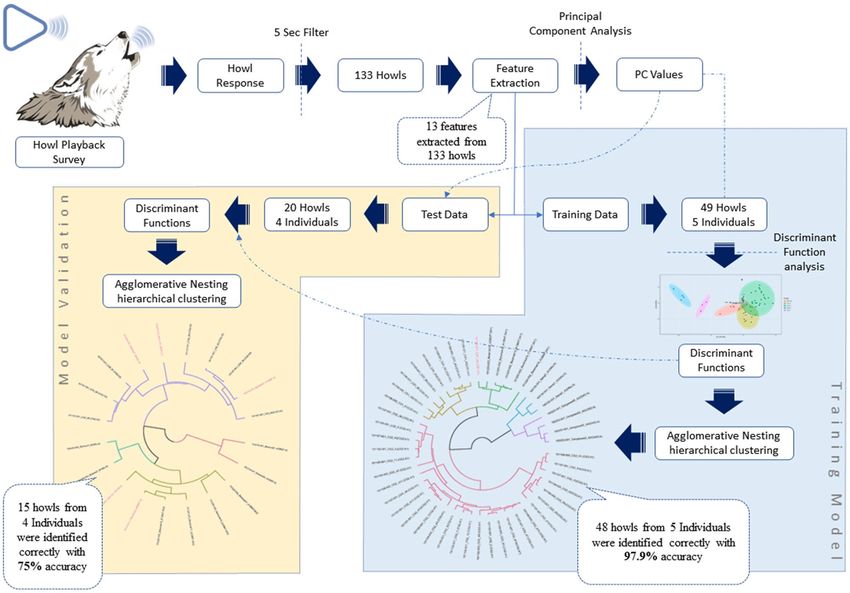
www.nature.com/scientificreports/
Figure 1. Map showing howling recording locations of the free-ranging wolf in six districts of Maharashtra.
Yellow round bullets indicate the survey locations and Red triangular bullets represent the howling recording
sites.
three-minute intervals. A series of 50-s-long pre-recorded solo howls (from an individual in Jaipur Zoo) was
played three times with increasing amplitude; the session was followed by a 50-s-long chorus howl (from three
individuals in Jaipur Zoo) in the order of mid and highest amplitude level of the speaker respectively. A 40-W
JBL Xtreme speaker (Harman International Industries, 2014) was used for the playbacks. If howling responses
were recorded, the playback session was terminated and repeated after 15 to 20 min. All howls were recorded in
a single microphone setup, using a Blue Yeti Pro USB Condenser Microphone (Blue Microphone, 2011) attached
with Zoom H4N Handheld Audio Recorder (Zoom Corporation, 2009) with a sampling rate of 44.1 kHz and
16-bit depth.
Ethical approval. The study on captive wolves in zoos was done with the permission of the Director of
Jaipur Zoo and the Forest Department of Rajasthan, India [Letter no- 3(04)-II/CCFWL/2013/4586–87; Dated
30th Oct 2015]. The survey of free-ranging wolves of Maharashtra was performed with the consent of the Princi-
pal Chief Conservator of Maharashtra Forest Department [Letter no- 22(8)/WL/CR-947(14–15)/1052/2015–16;
Dated- 6th Aug 2015]. No animal was harmed during the study, and the standard non-invasive protocol of howl-
ing survey was maintained. All the data collection were approved by the Animal Ethics committee of Wildlife
Institute of India, Dehradun, India.
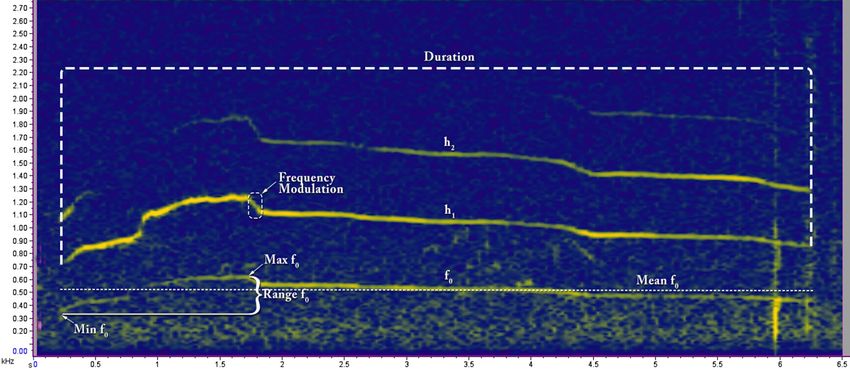
Feature extraction. The howls were sorted, and spectrograms were generated using a Discrete Fourier
Transform (DFT) algorithm in Raven Pro 1.5 software61. Discrete Fourier Transform (DFT) algorithm transforms
the same length sequence of equally spaced sample points (N, where N is a prime number) with circular convo-
lution being implemented on the points62. All the spectrograms were produced using Hann windows at the rate
of 1800 samples on 35.2 Hz 3 dB filter (Fig. 2). Only recordings with low levels of background noise and without
any overlapping sounds, where the howls were clearly visible as contours, were selected for further analysis.
Spectral images were digitised using Web Plot Digitizer Software63. Thirteen different features (Table 1) were
measured from the digitised value by using Microsoft Excel. The details methodology is represented in Fig. 3.
One hundred and thirty-three howls that were longer than 5-s were used for further analysis, with more than
ten individual wolves included. The 5 s cut off were chosen to avoid social squeak calls that are very similar to
Scientific Reports | (2021) 11:7309 | https://doi.org/10.1038/s41598-021-86718-w 3
Vol.:(0123456789)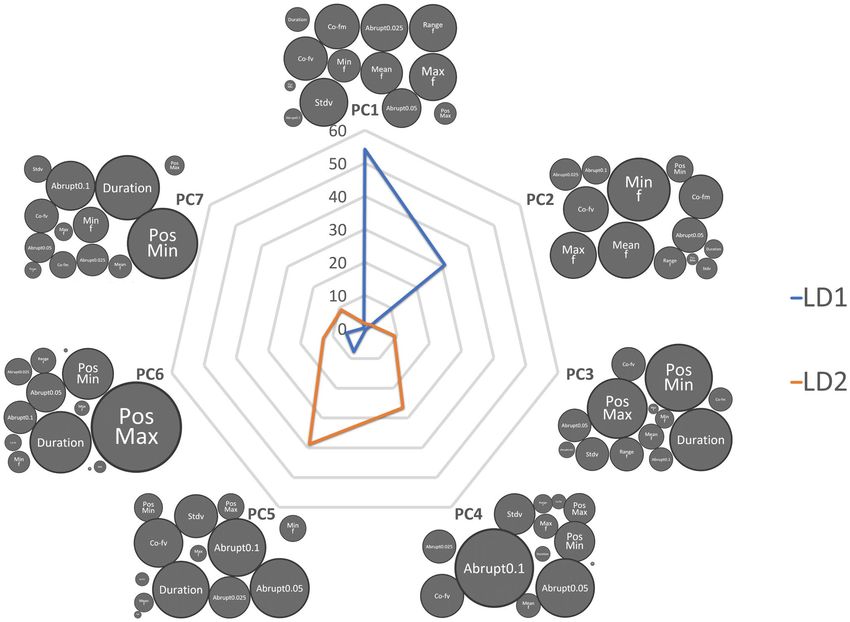
www.nature.com/scientificreports/
Figure 2. Spectrogram of Gangewadi Wolf howl (160203-001_Gangewadi2_A5) showing how different
variables were measured.
Variable name Definition of variable
Min f The minimum frequency of the fundamental (f0)
Max f The maximum frequency of f0
Range f Range of f0; f0 = Max f – Min f
Mean f Mean frequency of f0 at 0.1 s interval over the duration
Duration Duration of Howl measured at f0; Duration = tend- tstart
Abrupt0.025 Number of abrupt changes in f0 more than 25 Hz at single time step (0.1 s)
Abrupt0.05 Number of abrupt changes in f0 more than 50 Hz at single time step (0.1 s)
Abrupt0.1 Number of abrupt changes in f0 more than 100 Hz at single time step (0.1 s)
Stdv Standard deviation of f0
Co fm Coefficient of frequency modulation of f0 = Σ|f(t)–f (t + 1)|/(n − 1) × 100/Mean f0
Co fv Coefficient of frequency variation of f0 = (SD/mean) × 100
Pos Min Position in the howl at which the minimum frequency occurs = (time of Minf)/Dur
Pos Max Position in the howl at which the maximum frequency occurs = (time of Maxf)/Dur
Table 1. Thirteen different variables that were measured from the fundamental frequency ( f0) [Lowest
frequency of periodic waveform of each howl].
howl but shorter ( x = 3.87 s) and high-frequency variable calls, described by Sadhukhan et al.55. Also, the longer
howls might contain more identification features than the shorter howls do. Principal Component Analysis (PCA)
was conducted on measured parameters of 133 howls to reduce the dimension and emphasise the variation
between each howl. Out of 133 howls, only 69 howls were identified to an individual. The 69 howls were from nine
wolves with known identities: three were captive wolves and six wild, free-ranging wolves, which were identified
from their visual features when they were howling in front of the observer and thus howls could be attributed to
them individually. The data was further subdivided into training and test datasets. Forty-nine howls from five
individuals (2 captives; 3 wild) were used as the training data, and 20 howls from four different individuals (1
captive, 3 wild) as test data to ensure the validity of the method (Table 2). Since the known wolf howls were used
test data never used in building model, it provides ‘unbiased sense of model effectiveness’64.
Discriminant function analysis. Linear discriminant function analysis (DFA) was performed with 49
howls from five individuals (training data) using seven PCA values that contributed more than 5% variation
(Table 3) [The cut off value was chosen from scree plot, See Supp. Material 1: PCA.pdf]. The objective of DFA
was to construct the linear combination of independent principal component variables (PC1–PC7) that will dis-
criminate howls of different individuals. The howls were plotted with discriminant functions at two-dimensional
space followed by the group prediction (Fig. 4).
Scientific Reports | (2021) 11:7309 | https://doi.org/10.1038/s41598-021-86718-w 4
Vol:.(1234567890)www.nature.com/scientificreports/
Figure 3. The pictorial representation of methodology for identifying unknown Indian wolves by their howls.
Training/testing Wolf name Captive/wild Capture date No. of howl
BMT.SA1 Wild 20/12/2015 5
06/11/2015 3
CG1.A1 Captive
08/11/2015 6
05/11/2015 8
Training data (n = 49)
CG2.A1 Captive 07/11/2015 11
08/11/2015 9
GWD.A Wild 03/02/2016 4
NNJ.A Wild 30/01/2016 3
BMT.A Wild 19/12/2015 4
BMT.SA2 Wild 20/12/2015 4
Test data (n = 20)
CG2.A2 Captive 07/11/2015 7
NU.A Wild 28/04/2016 5
Table 2. Table showing the information on each individual wolf and their capture date with the number of
howls were used in this analysis.
Hierarchical clustering. To test the success rate of identifying different individuals from their howls with
Linear Discriminant (LD) score, an Agglomerative Nesting hierarchical clustering (AGNES) was executed on 49
howls (training data) that were used in DFA. AGNES initially considers each howl as a different cluster and use
a ‘bottom-up’ algorithm to join different clusters based on the similarities65. The analysis was performed in R
using ‘agnes’ function in the package ‘dendextend’ and ‘manhattan’ metric was used to build the cluster66. The
same analysis was performed on the test data to determine the accuracy of identifying unknown individuals and
estimating the number of wolves from their howls. While the test data contained howls from known individuals,
the wolves’ identities were not included in the model. The variables of these 20 howls were calculated from the
equation of DFA of 49 howls for cluster analysis.
Scientific Reports | (2021) 11:7309 | https://doi.org/10.1038/s41598-021-86718-w 5
Vol.:(0123456789)www.nature.com/scientificreports/
2.5
PC4
PC6 Groups
PC7
PC3
LD2 (8.63%)
BMT.SA1
0.0 PC1
PC2 CG1.A1
CG2.A1
GWD.A
NNJ.A
PC5
-2.5
-10 -5 0 5
LD1 (87.57%)
Figure 4. Figure showing a two-dimensional plot of discriminant function analysis using LD1 (Linear
Discriminant) and LD2. Each colour represents each wolf. 100% accuracy was achieved in identifying 49 howls
from five Indian wolves.
Component importance (%)
PC1 41.2
PC2 16
PC3 10.5
PC4 8.1
PC5 6.8
PC6 6.5
PC7 5.7
PC8 2
PC9 1.7
PC10 1.1
PC11 0.4
PC12 0
PC13 0
Table 3. Table showing the percentage of variation each principal component (PC) accounts for first seven PC
function (marked as bold) contributed 94.8% in describing the variable.
Results
Dimensions reduction to emphasis on variation among howls. Seven Principal Components (PC)
that explained more than five percent of the variance (Table 3) each were generated from 13 scalar variables
(Table 1). These seven PCs together explained 94.8% variance among different howls (Fig. 5). SD of the funda-
mental frequency (f0), Frequency ( f0) range, Maximum f0 and the number of abrupt change (> 25 Hz) were the
most important contributing factors for building PC1 which contributed 41.2% explaining the variable (Fig. 5).
Building discriminant function to emphasis on howl variation among different individu‑
als. The objective of DFA was to build an equation that discriminates the howls of different individuals. The
LD score also highlights the variation among howls from different individuals. DFA achieved 100% accuracy in
identifying five individuals from 49 howls (Fig. 4). As the first two Linear Discriminants (LD1 and LD2) were
responsible for 96.2% of the variance to differentiate between howls of different individuals (LD1 = 87.57% and
LD2 = 8.63%), we calculated LD1 and LD2 for rest of the howls using the same function (equation) from last
DFA. PC1 and PC2 contributed 85% in building LD1; PC4 and PC5 are the most crucial factor (65%) for LD2
function (Fig. 5).
Scientific Reports | (2021) 11:7309 | https://doi.org/10.1038/s41598-021-86718-w 6
Vol:.(1234567890)www.nature.com/scientificreports/
Figure 5. The spider web bubble plot is describing how the Simple Scalar Variables (SSV) are ultimately
contributing to two LD functions through PC values. The bubble size of each SSV represents the contribution
for building each PC function. The blue line represents LD 1, and Orange represents LD2. Since PC1 and PC2
contribute 85% for LD1, the most important SSVs are Stdv f0, Min f0, Max f0 and Mean f0. Similarly Duration,
Abrupt changes, Co-fv contribute the most in building the LD2 function via PC4 and PC5. LD1 was best
defined by the different fundamental frequency factors, while LD2 was best defined through the shape of the
frequency contour. Therefore, the critical factors for individuality were encoded in X and Y variables.
Identifying individuals from their howls in testing dataset. First, we tested AGNES on the training
dataset (49 howls from 5 individuals) and found 48 howls (~ 97.9% accuracy) were identified correctly at 2.2
clustering scale (Fig. 6). When the same analysis was performed on 20 howls of four different individuals to test
the accuracy for the non-training dataset, 15 out of 20 howls from (75% accuracy) four individuals were identi-
fied correctly at 2.2 clustering scale (Fig. 7; Table 4). Two howls from wolf BMT.A were misclassified to wolves
BMT.SA2 and CG2.A2; Three howls from wolf NU.A were misclassified to wolves BMT.SA2 (1 howl) and CG2.
A2 (2 howls) (Fig. 7; Table 4).
Discussion
Here, we presented a new approach to train the classification model, which can identify individuals from their
howls and determine the number of wolves present in a certain number of howls, allowing for fine-scale popula-
tion surveys. In this study, we built an identification model with known training data which was verified with
novel test data. The testing data included howls from the known individuals of both captive and wild Indian
wolves but independent from the training dataset so that we can cross-check the identification accuracy without
bias. The key finding of our study was 97.9% wolf howls were identified correctly from training data, whereas
the accuracy of the model on the testing data was 75%. Moreover, we were able to identify four individuals accu-
rately from the testing dataset. The primary significance of this study is that it can be replicated for any other
wolf sub-species with a set of a known wolf howls. This study increases the feasibility of wolf pack census using
a howling s urvey35,60. Since wolves may actively avoid camera t raps54 and photo-identification of wolf requires
arduous effort3,67, identifying wolves from their howls is a big step towards population estimation using CMR.
Although CMR associated with camera trapping provides population estimation without bias for an identifi-
able animal like a tiger68, camera trapping has several limitations for non-identifiable and long-ranging species
like the wolf3. Other non-invasive methods like DNA-based CMR resulted in biased population estimation due
Scientific Reports | (2021) 11:7309 | https://doi.org/10.1038/s41598-021-86718-w 7
Vol.:(0123456789)www.nature.com/scientificreports/
BMT.SA1-howl2
wl1
CG1.A1-howl7
CG1.A
wl4
A1-ho
CG1
1-ho
wl5
CG
1
.A1-
-howl5
BMT.S
-ho
.SA
1 .A
3
CG
how
wl
A1
1 -h
BMT
-ho
1
T.S
.A
l6
ow
A1
CG
1-h
BM
l4
T. S
1
1.
ow
wl
A1
CG
BM
ho
l3
-h
1.
A-
l2
o
A1
J.
ow
wl
NN
-h -h
9
CG ow A
1.A l8 J.
1- NN l3
ho ow
wl -h
.A
CG
1.A
2
N NJ
1-h wl2
ho
ow
l1 D .A-
CG GW
2.A
1-h l4
owl2 -how
5 D.A
GW
CG2.A
1-how wl3
l15 .A-ho
GWD
CG2.A1-h
owl22 1
GWD.A-howl
CG2.A1-howl16
CG2.A1-howl1
howl11
CG2.A1-
CG2.A
1-how
l24
wl7
1-ho
CG2.A CG2
.A1-
3 how
-h owl l23
.A1 CG
CG2 2.A
6 1-h
wl2 ow
l4
1 -ho CG
2.A 2.A
CG 20 1-h
o wl CG ow
-h l9
. A1 1 2.
A1
G2 l2 -h
C ow ow
-h
CG
l2
A1 8
l10
2.
2.
A1
ow
CG
G
C
-h
l8
-h
2.A
ow
ow
A1
CG
l1
l14
1-
1-h
2.
8
CG
2.A
ho
CG
l17
ow
2.A
CG2.A
wl
-howl12
CG2.A1-how
1-h
2.A
CG2.A1-howl6
1-h
how
2
CG
ow
1-ho
2.A
.A1-
l27
1-how
CG
CG2.A1
wl1
CG2
9
l5
l13
Figure 6. Hierarchical Clustering of 49 howls from five individuals. These 49 howls were used in training the
data. 48 howls were identified correctly with the accuracy of 97.9%. The wrongly identified howl is marked in
red.
to the animals’ non-uniform scent-marking p atterns59,69. However, acoustics based surveys allow vast area sam-
pling with limited resources as compared to camera trapping and other non-invasive m ethods3. Furthermore,
our field observations of wolves have shown that the whole pack typically howls during choruses and that all
individuals are acoustically active.
For population size estimation through an acoustics-based survey, a combination of CMR and Distance
Sampling is required to reduce bias and heterogeneity in detection probability27,70. Identifying individual wolves
from their howls close this gap of implementing the CMR technique for the population assessment of this
elusive and challenging to track species7,25,27. While a few studies have established that howls carry individual-
ity information38 and known howls can be distinguished from each o ther39,45,71, no study has been successful
before in identifying unknown individuals from a set of howls. Furthermore, attempts to count the number of
individuals present in a recording have been limited by difficulties in minimising confidence intervals18,72. There
are two ways to identify individual wolves or packs—supervised clustering and unsupervised clustering. While
supervised clustering requires a set of known training data and cluster validation is straightforward, unsupervised
clustering requires ground-truthing before it can be used to monitor populations at a survey level and does not
allow individual level CMR or t racking30.
Although DNA-based identification from faecal sampling is more accurate in identifying individuals than
our result, it has drawbacks, such as biased population estimation and the increased cost and effort required to
collect and analyse the f aeces59,69. Nevertheless, the acoustics-based identification model requires further work
to increase its accuracy, though we believe that the successful implementation of this method as a CMR-based
supervised population estimation model is already possible.
Wolves mostly live in packs that habitually howl together, and it is challenging to identify the specific wolf that
is howling, particularly in choruses. If included and incorrectly attributed to a particular wolf, these howls could
Scientific Reports | (2021) 11:7309 | https://doi.org/10.1038/s41598-021-86718-w 8
Vol:.(1234567890)www.nature.com/scientificreports/
l7 ow
NU.A-h
CG2.A2-h
l2
ow
owl2
NU
2-h
.A-
2.A
h
CG
ow
l3
3
C
wl
G
o
2.
-h
A2
A2
-h
2.
ow
CG
l6
wl1
CG -ho
2.A
2-h T.A
ow BM
l5
l1
2-how
CG2.A2 CG2.A
-howl4
owl4 BMT.A
NU.A-h -howl2
wl1 BM
ho T.A
.A- -ho
NU wl3
l5
BM
ow
T.
-h
SA
.A
U
2-
N
ho
w
l1
wl4
BM
-ho
T.S
T.A
2-howl3
A2
BMT.SA
-ho
BM
wl4
BMT.SA
2-howl2
Figure 7. Hierarchical Clustering of 20 howls from four Indian wolves. None of the 20 howls was used in
training the data. 15 howls were identified correctly with the accuracy of 75%, and all the four individuals were
identified correctly as different clusters. The correctly identified howls are marked in black, and the five wrongly
identified howls are marked in red.
Predicted group membership
Individuals BMT.A BMT.SA2 CG2.A2 NU.A Identification accuracy (correct/total) Total
Count
BMT.A 2 1 1 0 2/4 15/20
BMT.SA2 0 4 0 0 4/4
CG2.A2 0 0 7 0 7/7
NU.A 0 1 2 2 2/5
Percent
BMT.A 50 25 25 0 50 75%
BMT.SA2 0 100 0 0 100
CG2.A2 0 0 100 0 100
NU.A 0 20 40 40 40
Table 4. Details of individual identification accuracy using hierarchical clustering on testing data (20 howls
from four individual). 15 out of 20 howls were identified correctly with the accuracy of 75%.
lead to erroneous predictions by the model. Therefore, this limited our potential data set to those howls which
were conclusively attributed to a known individual, and we dropped many howls, especially the chorus howls,
from the analysis to avoid misleading the model. However, larger training datasets from different wolf popula-
tions might increase the efficacy of the identification model and verification with more wolf howls conceding
lycatcher73. Thus, our result of 75% may represent a baseline,
better reliability as found for Southwestern Willow F
Scientific Reports | (2021) 11:7309 | https://doi.org/10.1038/s41598-021-86718-w 9
Vol.:(0123456789)www.nature.com/scientificreports/
not a limit, on the accuracy we could achieve. The inclusion of multiple series of howls from every individual
would give a more precise result. However, since none of the free-ranging wolves was radio-collared or marked,
this was not possible for the wild wolves. Studying howls of collared wolves would help in adding multiple howl
sequences from many free-ranging wolves in the training data and may fill this research gap.
This study revealed that the number of wolves present in the recordings could be determined from their
howls and the individuality information is sufficient for supervised population estimation through CMR
techniques7,25,27,30. Therefore, wolves recorded in one location can be acoustically recaptured at another location,
and we can identify them individually. Since our model is exclusively built on fundamental frequency, changes in
terrain or vegetation should not affect the accuracy of the model. The information gained from recapturing wolves
across different locations would help in deriving territoriality (home-range) information, and this information
is crucial for spatially explicit individual-based point process models. This is a clear advancement for develop-
ing howling playback surveys as a wolf pack census method. Regular population monitoring will help towards
conserving and saving this cryptic species before its population falls beyond a recovery level. Furthermore, since
wolf howls can be detected across distances of more than 6 km, identifying wolves from their howls also opens
up a new opportunity for non-invasive tracking of this species across large landscapes.
Guidelines to implement the methodology on the field. We used this methodology to identify indi-
vidual Indian wolf howl. However, one can use this methodology to identify species, sub-species or individual
from their calls. This requires a set of calls to make up the training dataset and a set of calls to make up the testing
dataset. We recommend some precautions and step by step guidelines for adapting this method.
I. Before the data collection, one should be cautious about choosing the recorder and data collection
methodology. Although we are not definite about the impact of multi-recorder setup in identification
accuracy, we recommend using a single microphone set up to keep consistency, especially for individual
identification as differences in sensitivity and recording parameters can influence acoustic integrity
[See45].
II. The multiple groups in the training dataset should be carefully selected to represent distinct group mem-
ber calls with high confidence (e.g. species/sub-species/individuals), as a single incorrectly identified call
in the training dataset can lead the model to erroneous results.
III. The selection of appropriate spectral features is important. While many species encode their identity in
the same features, some encoding is species-specific. We tested a wide range of software which fell short
in feature extraction for overlapping calls or where background noise was present. The feature description
is only as reliable as the extraction. Here, we used web-plot digitiser software for spectrogram digitisation.
We recommend the use of any semi-automated graph digitiser tool for noisy or overlapping spectral data.
IV. The training data should contain only known groups (multi-species/multiple sub-species/multiple indi-
viduals). Each training group should have at least three to five calls and recordings from multiple sessions
will increase the accuracy of the model as the animals may have higher intra-individual variation across
days than within them. Thus, the higher the intra-individual or intra-group variation, the greater the
number of vocalisations and individuals that should be included in the training dataset to make a robust
model for the testing dataset.
V. Even though one can choose an unknown dataset as test data, we recommend using a known dataset
when originally validating the model. Using multiple test datasets will increase the model’s confidence.
VI. We recommend using multiple small batches as test data (50–100 sample of calls) instead of large data
to avoid confusion in cluster groups that may represent other variation in the calls.
VII. To allow study replication, we have made our data and codes available in the Supplementary Materials.
While the data needs to be replaced for each study, the system of analysis and classification should be
robust and replicable.
Conclusion
Our study reached substantial accuracy in identifying wolves from their howls. Since the methodology was
validated using known wolf data and was found to be reasonably reliable, unknown howls can also be classified.
This opens up a new opportunity for population estimation and tracking of wolves through howling surveys.
Although we analysed our data with Indian wolf howls, the procedure is replicable for other subspecies that have
a set of known howls from different individuals and could potentially be applied to other species with individually
distinctive vocalisations. This would refine and improve both population estimates and the ability to monitor
individuals in situ, with global implications for conservation and ecology.
Appendices: Supplementary materials
All the data and R code require to recreate the analysis are hosted in https://github.com/bhlabwii/wolf_howlID
platform. Raw sound files are available on request to the corresponding author. Compiled reports from R Scripts
can be found in following supporting material:
Filename Description
PCA.pdf Principal Component Analysis of 133 howl
DFA.49H5ID.PCvalue.pdf Discriminant Function Analysis of 49 howls from five individuals
Agglomerative Nesting hierarchical clustering (AGNES) using 49
known_dend_49H5ID.pdf
howls from five individuals
Scientific Reports | (2021) 11:7309 | https://doi.org/10.1038/s41598-021-86718-w 10
Vol:.(1234567890)www.nature.com/scientificreports/
Filename Description
Agglomerative Nesting hierarchical clustering (AGNES) using 20
Dendrogram.test.pdf
howls from four different individuals to test the model
Received: 27 December 2020; Accepted: 19 March 2021
References
1. Buckland, S. T., Anderson, D. R., Burnham, K. P. & Laake, J. L. Introductory concepts. In Distance Sampling. Estimating Abundance
of Biological Populations 446 (1993). https://doi.org/10.1002/9780470752784.part1.
2. Mace, G. M. et al. Quantification of extinction risk: IUCN’s system for classifying threatened species. Conserv. Biol. 22, 1424–1442
(2008).
3. Garland, L., Crosby, A., Hedley, R., Boutin, S. & Bayne, E. Acoustic vs. Photographic monitoring of gray wolves (Canis lupus): a
methodological comparison of two passive monitoring techniques. Can. J. Zool. 98, 219–228 (2020).
4. Crunchant, A. S., Borchers, D., Kühl, H. & Piel, A. Listening and watching: do camera traps or acoustic sensors more efficiently
detect wild chimpanzees in an open habitat?. Methods Ecol. Evol. 11, 542–552 (2020).
5. Wood, C. M. et al. Using the ecological significance of animal vocalizations to improve inference in acoustic monitoring programs.
Conserv. Biol. https://doi.org/10.1111/cobi.13516 (2020).
6. Rhinehart, T. A., Chronister, L. M., Devlin, T. & Kitzes, J. Acoustic localization of terrestrial wildlife: current practices and future
opportunities. Ecol. Evol. 10, 6794–6818 (2020).
7. Kidney, D. et al. An efficient acoustic density estimation method with human detectors applied to gibbons in Cambodia. PLoS
ONE 11, 1–16 (2016).
8. Thompson, M. E., Schwager, S. J., Payne, K. B. & Turkalo, A. K. Acoustic estimation of wildlife abundance: methodology for vocal
mammals in forested habitats. Afr. J. Ecol. 48, 654–661 (2010).
9. Parra, J. M. Passive acoustic aquatic animal finder apparatus and method. US patent 5,099,455 (1992).
10. Riede, K. Acoustic monitoring of Orthoptera and its potential for conservation. J. Insect Conserv. 2, 217–223 (1998).
11. Petrusková, T., Pišvejcová, I., Kinštová, A., Brinke, T. & Petrusek, A. Repertoire-based individual acoustic monitoring of a migra-
tory passerine bird with complex song as an efficient tool for tracking territorial dynamics and annual return rates. Methods Ecol.
Evol. 7, 274–284 (2016).
12. Sanders, C. E. & Mennill, D. J. Acoustic monitoring of nocturnally migrating birds accurately assesses the timing and magnitude
of migration through the Great Lakes. Condor 116, 371–383 (2014).
13. Acevedo, M. A. & Villanueva-Rivera, L. J. From the field: Using automated digital recording systems as effective tools for the
monitoring of birds and amphibians. Wildl. Soc. Bull. 34, 211–214 (2006).
14. Wrege, P. H., Rowland, E. D., Keen, S. & Shiu, Y. Acoustic monitoring for conservation in tropical forests: examples from forest
elephants. Methods Ecol. Evol. 8, 1292–1301 (2017).
15. Pérez-Granados, C. et al. Vocal activity rate index: a useful method to infer terrestrial bird abundance with acoustic monitoring.
Ibis (Lond. 1859) 161, 901–907 (2019).
16. Kimura, S. et al. Comparison of stationary acoustic monitoring and visual observation of finless porpoises. J. Acoust. Soc. Am. 125,
547–553 (2009).
17. Gibb, R., Browning, E., Glover-Kapfer, P. & Jones, K. E. Emerging opportunities and challenges for passive acoustics in ecological
assessment and monitoring. Methods Ecol. Evol. https://doi.org/10.1111/2041-210X.13101 (2018).
18. Papin, M., Aznar, M., Germain, E., Guérold, F. & Pichenot, J. Using acoustic indices to estimate wolf pack size. Ecol. Indic. 103,
202–211 (2019).
19. Depraetere, M. et al. Monitoring animal diversity using acoustic indices: implementation in a temperate woodland. Ecol. Indic.
13, 46–54 (2012).
20. Wheeldon, A., Mossman, H. L., Mathenge, J. & De Kort, S. R. Comparison of acoustic and traditional point count methods to
assess bird diversity and composition in the Aberdare National. Afr. J. Ecol. https://doi.org/10.1111/aje.12596 (2019).
21. Wilson, S. J. & Bayne, E. M. Use of an acoustic location system to understand how presence of conspecifics and canopy cover
influence Ovenbird (Seiurus aurocapilla) space use near reclaimed wellsites in the boreal forest of Alberta. Avian Conserv. Ecol.
https://doi.org/10.5751/ACE-01248-130204 (2018).
22. Gable, T. D., Windels, S. K. & Bump, J. K. Finding wolf homesites: improving the efficacy of howl surveys to study wolves. PeerJ
6, e5629 (2018).
23. O’Gara, J. R. et al. Efficacy of acoustic triangulation for gray wolves. Wildl. Soc. Bull. https://doi.org/10.1002/wsb.1089 (2020).
24. Dawson, D. K. & Efford, M. G. Bird population density estimated from acoustic signals. J. Appl. Ecol. 46, 1201–1209 (2009).
25. Stevenson, B. C. et al. A general framework for animal density estimation from acoustic detections across a fixed microphone
array. Methods Ecol. Evol. 6, 38–48 (2015).
26. Royle, J. A., Chandler, R. B., Sollmann, R. & Gardner, B. Spatial Capture–Recapture (Academic Press, 2013).
27. Marques, T. A. et al. Estimating animal population density using passive acoustics. Biol. Rev. 88, 287–309 (2013).
28. Adi, K., Johnson, M. T. & Osiejuk, T. S. Acoustic censusing using automatic vocalization classification and identity recognition. J.
Acoust. Soc. Am. 127, 874–883 (2010).
29. Lettink, M. & Armstrong, D. P. An introduction to using mark-recapture analysis for monitoring threatened species. Dep. Conserv.
Tech. Ser. 28A, 5–32 (2003).
30. Clink, D. J. & Klinck, H. Unsupervised acoustic classification of individual gibbon females and the implications for passive acoustic
monitoring. Methods Ecol. Evol. 1, 1–2 (2020).
31. Theberge, J. B. & Falls, J. B. Howling as a means of communication in timber wolves. Am. Zool. 7, 331–338 (1967).
32. Kershenbaum, A. et al. Disentangling canid howls across multiple species and subspecies: structure in a complex communication
channel. Behav. Process. 124, 149–157 (2016).
33. Harrington, F. H. & Mech, D. L. Wolf howling and its role in territory maintenance. Behaviour 68, 207–249 (1978).
34. Joslin, P. Summer Activities of Two Timber Wolf (Canis lupus) Packs in Algonquin Park (University of Toronto, 1966).
35. Suter, S. M., Giordano, M., Nietlispach, S., Apollonio, M. & Passilongo, D. Non-invasive acoustic detection of wolves. Bioacoustics
4622, 1–12 (2016).
36. Harrington, F. H. & Mech, D. L. Wolf vocalization. In Wolf and man, 109–132 (Elsevier, 1978). https://doi.org/10.1016/B978-0-
12-319250-9.50014-1.
37. Blanco, J. C. & Cortés, Y. Surveying wolves without snow: a critical review of the methods used in Spain. Hystrix 23, 35–48 (2012).
38. Tooze, Z. J., Harrington, F. H. & Fentress, J. C. Individually distinct vocalizations in timber wolves, Canis lupus. Anim. Behav. 40,
723–730 (1990).
39. Root-Gutteridge, H. et al. Improving individual identification in captive Eastern grey wolves (Canis lupus lycaon) using the time
course of howl amplitudes. Bioacoust. Int. J. Anim. Sound Rec. 23, 39–53 (2014).
Scientific Reports | (2021) 11:7309 | https://doi.org/10.1038/s41598-021-86718-w 11
Vol.:(0123456789)www.nature.com/scientificreports/
40. Hull, C., McCombe, C. & Dassow, A. Acoustic identification of wild gray wolves, Canis lupus, using low quality recordings. Am.
J. Undergrad. Res. 16, 41–49 (2020).
41. Wasser, S. K., Smith, H., Madden, L., Marks, N. & Vynne, C. Scent-matching dogs determine number of unique individuals from
scat. J. Wildl. Manag. 73, 1233–1240 (2009).
42. Brennan, A., Cross, P. C., Ausband, D. E., Barbknecht, A. & Creel, S. Testing automated howling devices in a wintertime wolf
survey. Wildl. Soc. Bull. 37, 389–393 (2013).
43. Ausband, D. E., Skrivseth, J. & Mitchell, M. S. An automated device for provoking and capturing wildlife calls. Wildl. Soc. Bull. 35,
498–503 (2011).
44. Papin, M., Pichenot, J., Guérold, F. & Germain, E. Acoustic localization at large scales: a promising method for grey wolf monitor-
ing. Front. Zool. 15, 1–10 (2018).
45. Root-Gutteridge, H. et al. Identifying individual wild Eastern grey wolves (Canis lupus lycaon) using fundamental frequency and
amplitude of howls. Bioacoust. Int. J. Anim. Sound Rec. 23, 55–66 (2014).
46. Singh, M. & Kumara, H. N. Distribution, status and conservation of Indian gray wolf (Canis lupus pallipes) in Karnataka, India. J.
Zool. 270, 164–169 (2006).
47. Jhala, Y. V. & Giles, R. H. The status and conservation of the wolf in Gujarat and Rajasthan, India. Conserv. Biol. 5, 476–483 (1991).
48. Habib, B. Ecology of Indian wolf [Canis lupus pallipes sykes. 1831), and modeling its potential habitat in the great Indian bustard
sanctuary, Maharashtra, India (Aligarh Muslim University, Aligarh, India, 2007).
49. Dey, S., Sagar, V., Dey, S. & Choudhary, S. K. 2 Sight record of the Indian wolf Canis lupus pallipes in the river Gandak floodplains.
J. Bombay Nat. Hist. Soc. 107, 51 (2010).
50. Jethva, B. D. & Jhala, Y. V. Foraging ecology, economics and conservation of Indian wolves in the Bhal region of Gujarat, Western
India. Biol. Conserv. 116, 351–357 (2004).
51. Jethva, B. D. & Jhala, Y. V. Computing biomass consumption from prey occurrences in Indian wolf scats. Zoo Biol. 23, 513–520
(2004).
52. Jhala YV. Human conflict in India. In “Beyond: Realties of Global Wolf Restoration” Symposium February, 23–26 (2020).
53. Habib, B. & Kumar, S. D. shifting by wolves in semi-wild landscapes in the Deccan Plateau, Maharashtra, India. J. Zool. 272, 259–265
(2007).
54. Meek, P. D. et al. Camera traps can be heard and seen by animals. PLoS ONE 9, e110832 (2014).
55. Sadhukhan, S., Hennelly, L. & Habib, B. Characterising the harmonic vocal repertoire of the Indian wolf (Canis lupus pallipes).
PLoS ONE 14, e0216186 (2019).
56. Rodgers, W. A. & Panwar, S. H. Biogeographical classification of India. New For. Dehra Dun, India (1988).
57. Reddy, C. S., Jha, C. S., Diwakar, P. G. & Dadhwal, V. K. Nationwide classification of forest types of India using remote sensing and
GIS. Environ. Monit. Assess. 187, 777 (2015).
58. Majgaonkar, I. et al. Land-sharing potential of large carnivores in human-modified landscapes of western India. Conserv. Sci. Pract.
1, e34 (2019).
59. Morin, D. J., Kelly, M. J. & Waits, L. P. Monitoring coyote population dynamics with fecal DNA and spatial capture-recapture. J.
Wildl. Manag. 80, 824–836 (2016).
60. Harrington, F. H. & Mech, D. L. An analysis of howling response parameters useful for wolf pack censusing. J. Wildl. Manag. 46,
686–693 (1982).
61. Bioacoustics Research Program. Raven Pro: interactive sound analysis software. The Cornell Lab of Ornithology (2014).
62. Rader, C. M. Discrete Fourier transforms when the number of data samples is prime. Proc. IEEE 56, 1107–1108 (1968).
63. Rohatgi, A. WebPlotDigitizer. (2017).
64. Kuhn, M. et al. Applied Predictive Modeling Vol. 26 (Springer, 2013).
65. Kaufman, L. & Rousseeuw, P. J. Agglomerative nesting (Program AGNES). In Finding Groups in Data 199–252 (Wiley, 2009).
66. Galili, T. dendextend: an R package for visualizing, adjusting, and comparing trees of hierarchical clustering. Bioinformatics https://
doi.org/10.1093/bioinformatics/btv428 (2015).
67. Galaverni, M. et al. Monitoring wolves (Canis lupus) by non-invasive genetics and camera trapping: a small-scale pilot study. Eur.
J. Wildl. Res. 58, 47–58 (2012).
68. Jhala, Y. V, Qureshi, Q. & Nayak, A. K. Status of tigers, co-predators and prey in India 2018: summary report. (2019).
69. López-Bao, J. V. et al. Toward reliable population estimates of wolves by combining spatial capture-recapture models and non-
invasive DNA monitoring. Sci. Rep. 8, 1–8 (2018).
70. Laake, J. L. & Borchers, D. L. Methods for incomplete detection at distance zero. Advance in Distance Sampling (eds Buckland, S.
T., Andersen, D. R., Burn, K. P., Laake, J. L. & Thomas, L.) 108–189 (2004).
71. Palacios, V., Font, E. & Márquez, R. Iberian wolf howls: acoustic structure, individual variation, and a comparison with North
American populations. J. Mammal. 88, 606–613 (2007).
72. Passilongo, D., Mattioli, L., Bassi, E., Szabó, L. & Apollonio, M. Visualizing sound: counting wolves by using a spectral view of the
chorus howling. Front. Zool. 12, 12–22 (2015).
73. Fernández-Juricic, E., del Nevo, A. J. & Poston, R. Identification of individual and population-level variation in vocalizations of
the endangered Southwestern Willow Flycatcher (Empidonax traillii extimus). Auk 126, 89–99 (2009).
Acknowledgements
We want to thank the authority and staffs of the Jaipur Zoo and Maharashtra Forest Department for permit-
ting to conduct this research. We sincerely acknowledge the funding agencies, the Department of Science and
Technology, the Govt of India (No. EMR/2015/000036) and the Forest Department of Maharashtra (No. 1852).
We appreciate all our field personals (Daut Shaikh, Shivkumar More, Sarang Mhamane) and wildlife enthusiast
groups (Pune Wolfgang, Mihir Godbole, Vineet Arora, R. V. Kasar, Rajesh Pardeshi, Sawan Behkar and others)
from Maharashtra who helped in local information gathering and various logistic arrangement during data
collection. The first author is thankful for the effort of Shivam Shrotriya assisting during the initial analysis. The
authors are grateful to Dr Arik Kershenbaum, foe his consistent support. We are delighted for having continuous
support from the Wildlife Institute of India, Dehradun and our lab members.
Author contributions
B.H. conceptualised the study. S.S. collected all the data and did data extraction, analysis and writing the manu-
script. H.R.G. and B.H. both supervised in data interpretation along with the manuscript writing. B.H. played
a sole role in funding acquisition. All authors contributed critically to the drafts and gave final approval for
publication.
Scientific Reports | (2021) 11:7309 | https://doi.org/10.1038/s41598-021-86718-w 12
Vol:.(1234567890)www.nature.com/scientificreports/
Funding
This research was funded by Maharashtra Forest Department (http://mahaforest.gov.in) (Grant No. 1852) and
Department of Science and Technology, Govt of India (http://www.dst.gov.in/) (Grant No. EMR/2015/000036).
BH was the principal investigator of both the project, and SS was the researcher in those projects. The funders
had no role in study design, data collection and analysis, decision to publish, or preparation of the manuscript.
Competing interests
The authors declare no competing interests.
Additional information
Supplementary Information The online version contains supplementary material available at https://doi.org/
10.1038/s41598-021-86718-w.
Correspondence and requests for materials should be addressed to B.H.
Reprints and permissions information is available at www.nature.com/reprints.
Publisher’s note Springer Nature remains neutral with regard to jurisdictional claims in published maps and
institutional affiliations.
Open Access This article is licensed under a Creative Commons Attribution 4.0 International
License, which permits use, sharing, adaptation, distribution and reproduction in any medium or
format, as long as you give appropriate credit to the original author(s) and the source, provide a link to the
Creative Commons licence, and indicate if changes were made. The images or other third party material in this
article are included in the article’s Creative Commons licence, unless indicated otherwise in a credit line to the
material. If material is not included in the article’s Creative Commons licence and your intended use is not
permitted by statutory regulation or exceeds the permitted use, you will need to obtain permission directly from
the copyright holder. To view a copy of this licence, visit http://creativecommons.org/licenses/by/4.0/.
© The Author(s) 2021
Scientific Reports | (2021) 11:7309 | https://doi.org/10.1038/s41598-021-86718-w 13
Vol.:(0123456789)You can also read