Diffusion-mediated HEI10 coarsening can explain meiotic crossover positioning in Arabidopsis - Nature
←
→
Page content transcription
If your browser does not render page correctly, please read the page content below
ARTICLE
                  https://doi.org/10.1038/s41467-021-24827-w                  OPEN

                  Diffusion-mediated HEI10 coarsening can explain
                  meiotic crossover positioning in Arabidopsis
                  Chris Morgan           1,4,   John A. Fozard         1,4,   Matthew Hartley1, Ian R. Henderson2, Kirsten Bomblies3 &
                  Martin Howard            1✉
1234567890():,;

                  In most organisms, the number and distribution of crossovers that occur during meiosis are
                  tightly controlled. All chromosomes must receive at least one ‘obligatory crossover’ and
                  crossovers are prevented from occurring near one another by ‘crossover interference’.
                  However, the mechanistic basis of this phenomenon of crossover interference has remained
                  mostly mysterious. Using quantitative super-resolution cytogenetics and mathematical
                  modelling, we investigate crossover positioning in the Arabidopsis thaliana wild-type, an over-
                  expressor of the conserved E3 ligase HEI10, and a hei10 heterozygous line. We show that
                  crossover positions can be explained by a predictive, diffusion-mediated coarsening model, in
                  which large, approximately evenly-spaced HEI10 foci grow at the expense of smaller, closely-
                  spaced clusters. We propose this coarsening process explains many aspects of Arabidopsis
                  crossover positioning, including crossover interference. Consistent with this model, we also
                  demonstrate that crossover positioning can be predictably modified in vivo simply by altering
                  HEI10 dosage, with higher and lower dosage leading to weaker and stronger crossover
                  interference, respectively. As HEI10 is a conserved member of the RING finger protein family
                  that functions in the interference-sensitive pathway for crossover formation, we anticipate
                  that similar mechanisms may regulate crossover positioning in diverse eukaryotes.

                  1 John Innes Centre, Norwich Research Park, Norwich, UK. 2 Department of Plant Sciences, University of Cambridge, Cambridge, UK. 3 Institute of Molecular

                  Plant Biology, Department of Biology, Swiss Federal Institute of Technology (ETH) Zürich, Zürich, Switzerland. 4These authors contributed equally: Chris
                  Morgan, John A. Fozard. ✉email: martin.howard@jic.ac.uk

                  NATURE COMMUNICATIONS | (2021)12:4674 | https://doi.org/10.1038/s41467-021-24827-w | www.nature.com/naturecommunications                               1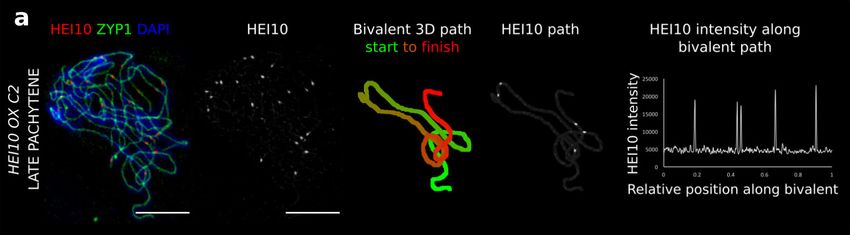
ARTICLE                                                                 NATURE COMMUNICATIONS | https://doi.org/10.1038/s41467-021-24827-w

A
          central feature of meiosis is the reciprocal exchange of           = 104 cells) using this automated approach, which is comparable
         DNA between pairs of homologous chromosomes via the                 with previous values obtained from manual counts8, and an
         formation of crossovers (COs)1,2. COs are crucial for               average total SC length per cell of 240μm (s.d. ± 32 μm, n = 203
promoting stable chromosome segregation during meiosis I and                 cells). This total SC length is higher than previous values obtained
for introducing genetic diversity within offspring. COs are gen-             from EM analysis (~165 μm)10 and may result from this method’s
erated by the repair of programmed DNA double-strand breaks                  enhanced ability to detect length excursions along the z-axis, or
(DSBs) during meiotic prophase I, when chromosomes are                       from differences in slide preparation methods. Using this tech-
organised along the meiotic axis into threadlike arrays of chro-             nique, we also measured the total intensity of HEI10 at all stages
matin loops. In most species, DSBs vastly outnumber COs, with                (Fig. 1B, left), and of late-stage HEI10 specifically in foci (Fig. 1B,
most DSBs being repaired via the formation of recombination                  middle left), along individual bivalents, as normalized by total
intermediate (RI) joint molecules that are channelled into a non-            HEI10 bivalent intensity in the cell and total focal HEI10 intensity
crossover repair pathway1. The relative positions, and therefore             in the cell, respectively. The rationale for using per-cell normal-
numbers, of RIs that progress to form COs are tightly con-                   ized intensity values, as opposed to absolute intensity values, is
strained: the formation of a CO at one chromosomal position                  that this approach controls for the influence of cell-to-cell var-
inhibits the formation of additional COs nearby. This phenom-                iation in factors such as antibody binding and differences in the
enon, crossover interference (COI)3,4, was first described over a             local slide environment, that can cause large variations in absolute
century ago5 and occurs widely across eukaryotes.                            intensity between cells (even between cells on the same slide).
   The mechanisms that underlie CO positioning, including COI,               Comparing normalized intensity values also allowed us to modify
still remain to be fully elucidated, despite the proposal of elegant         imaging conditions for each cell to optimise the quality of 3D-
theoretical models4. In Arabidopsis, altered cellular abundance of           SIM imaging, avoid the introduction of undesirable reconstruc-
HEI10, a conserved E3-ligase domain-containing protein, is                   tion artefacts, and also controls for any small differences in sta-
known to alter CO numbers6. Over-expression of HEI10 has been                ging, as all foci within the same cell will necessarily be at the same
shown genetically to weaken COI7. However, the effect of HEI10               stage. We found these per-cell normalized HEI10 intensity
dosage on the positioning of COs along prophase I chromosomes                measures for mid- and late-stage cells positively correlate with SC
has remained cytologically unexplored. During meiotic prophase               length as normalized by total SC length within the cell. This
I, HEI10 localises as discrete foci along fully-synapsed pachytene           correlation held also within a subset of the data in which we only
chromosomes, initially in numbers that correlate with MSH4-                  considered bivalents with two late HEI10 foci, thereby reducing
labelled RIs8. These foci undergo a dynamic reduction in number              any influence of focus number on total focal HEI10 intensity
(>100 foci to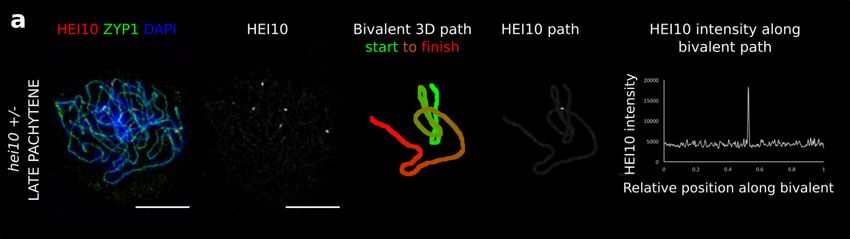
NATURE COMMUNICATIONS | https://doi.org/10.1038/s41467-021-24827-w ARTICLE
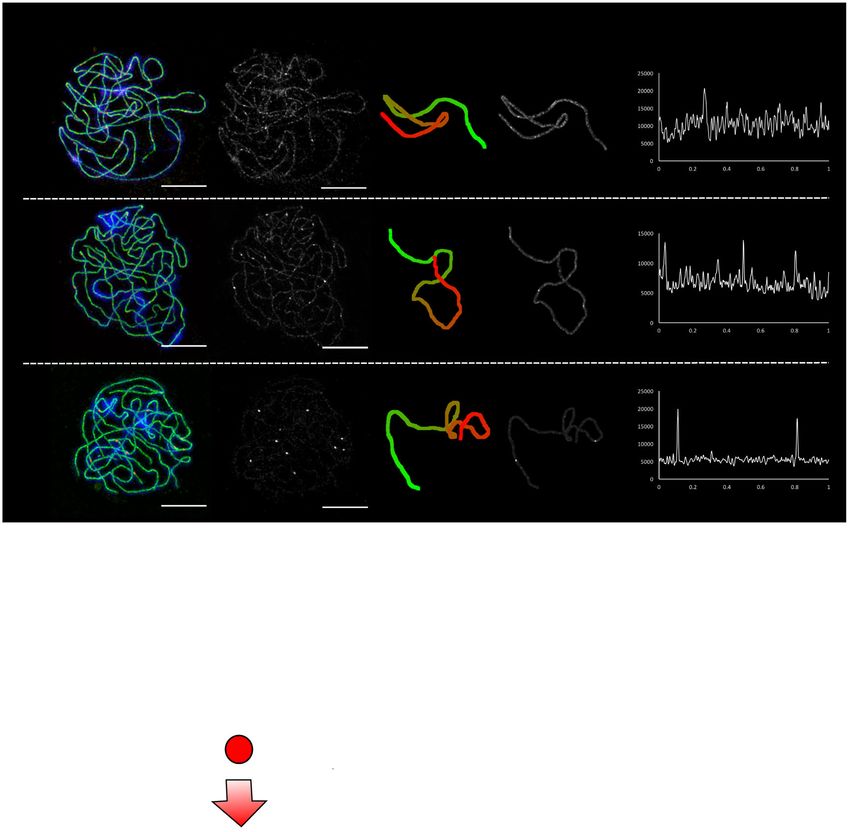
Bivalent 3D path HEI10 intensity along
A HEI10 ZYP1 DAPI HEI10
start to finish
HEI10 path
bivalent path
HEI10 intensity
PACHYTENE
EARLY
Relative position along bivalent
PACHYTENE
HEI10 intensity
MID
Relative position along bivalent
HEI10 intensity
PACHYTENE
LATE
Relative position along bivalent
B All late bivalents
All late bivalents
with two foci 1.0
20
single
R 2 = 0.34 R 2 = 0.19
HEI10 per bivalent
HEI10 per bivalent
HEI10 per bivalent
Relative total focal
Relative total focal
0.5 late 0.27 0.4 n=79
0.3 0.8
mid 0.20
Relative total
p=2.1e-17
0.4
Frequency
0
early 0.06 0.3 0.6
100
p=2.5e-35
0.2 double
0.3 n=354
0.2 0.4
p=2.0e-10
0.2 0
0.1 100
0.1 0.2 triple
0.1 n=258
0.0 0.0 0.0 0.00
0.0 0.1 0.2 0.3 0.0 0.1 0.2 0.3 0.0 0.1 0.2 0.0.
0 0.0 0.2 0.1
0.4 0.6 0.2
20.8 1.0
Relative bivalent Relative bivalent Relative bivalent Relative HEI10
SC length SC length SC length focus intensity
C pro-crossover protein (HEI10)
load per unit of bivalent length
recombination (i.e. longer bivalents will load
pachytene intermediates more protein)
bivalent (RIs)
PACHYTENE
protein forms foci
at RI sites
EARLY
larger foci grow
while smaller foci shrink
foci distribution
coarsens
PACHYTENE
Density
MID
PACHYTENE
large, late foci tend
to be evenly spaced and
LATE
promote crossover formation
length drawn at random from the experimental bivalent SC was also proportional to SC length. HEI10 is able to diffuse along
length distributions. RIs were placed at random positions along the SC, in agreement with the behaviour of the HEI10
the five bivalents, in accordance with the cytologically defined homologue, ZHP-3, in C. elegans13. At each RI, HEI10 is
random or weakly-interfering nature of early recombination absorbed from the SC into immobile foci at a constant rate α and
nodules in plants11. The total number of RIs on the five bivalents escapes back onto the SC at a rate β .The rate β itself depends
was consistent with cytologically reported A. thaliana RI values12 non-linearly on the amount of HEI10 in the focus, where larger
and early pachytene HEI10 foci number8, and for each bivalent foci have reduced escape rates. In this way, larger foci tend to
NATURE COMMUNICATIONS | (2021)12:4674 | https://doi.org/10.1038/s41467-021-24827-w | www.nature.com/naturecommunications 3
ARTICLE                                                                       NATURE COMMUNICATIONS | https://doi.org/10.1038/s41467-021-24827-w

Fig. 1 HEI10 protein dynamics in pachytene nuclei. A HEI10 immuno-fluorescent intensity, focus number and position quantitatively measured along fully-
synapsed bivalents in early, mid and late-pachytene nuclei stained for HEI10 (red), ZYP1 (green) and DAPI (blue), and imaged using 3D-SIM (images shown:
maximum intensity projections of 3D image stacks). Representative images are shown. Data were collected from 75 early, 205 mid and 520 late pachytene
bivalents for further analysis. Scale bars = 5 µm. B Left: total HEI10 intensity per bivalent, relative to total HEI10 bivalent intensity in the cell, plotted against
bivalent SC length, relative to total measured SC length in the cell. Data (dots) coloured by pachytene stage (data from 75/205/520 bivalents for early/
mid/late stages). Numbers in legend indicate R-squared values for linear regression. Middle left: same as left, but for HEI10 specifically in foci for late-stage
cells, relative to sum of all HEI10 foci intensities in the cell (data from 370 bivalents). Middle right: same as middle left, but for late-stage cells with two HEI10
foci (data from 177 bivalents). Lines: linear regression best-fits (least-squares); colour-coded by stage. Right: distributions of HEI10 focus intensity for cases
with 1, 2, 3 late HEI10 foci relative to sum of all HEI10 foci intensities in the cell. Numbers on right show (Bonferroni corrected) p-values from a one-sided
Dunn’s test of multiple comparisons using rank sums, following a Kruskal–Wallis test ðχ 2 ¼ 160:3; df ¼ 2; p
NATURE COMMUNICATIONS | https://doi.org/10.1038/s41467-021-24827-w ARTICLE
a
SC
b
Late stage data Simulation output
c Bivalent CO number
200
Number of bivalents
Number of bivalents
2500
150 2000
1500
100 CO Homeostasis
1000 i
50 1.00
500
Relative number of
COs per bivalent
0 0 0.95
0 1 2 3 4 5 0 1 2 3 4 5
Number of COs Number of COs 0.90
d All COs
0.85
100 1250
Number of COs
Number of COs
0.80
80 1000
0.6 0.8 1.0
60 750 Relative RI density
40 500
20 250
j Simulation time course
0 0
0.0 0.2 0.4 0.6 0.8 1.0 0.0 0.2 0.4 0.6 0.8 1.0 0 10 2 0
10 2
HEI10 (arb. units)
HEI10 (arb. units)
Relative position along bivalent Relative position along bivalent
2 2
e Single COs 10 1
time (hr)
time (hr)
10 1
4 4
25
250
Number of COs
Number of COs
6 10 0 6 10 0
20
200
8 8
15
150 10 −1
10 − 1
10 10
10 100 0 20 40 0 20 40
posit ion ( μ m ) posit ion ( μ m )
5 50
0 0
0.0 0.2 0.4 0.6 0.8 1.0 0.0 0.2 0.4 0.6 0.8 1.0 0 10 2
Intensity (arb. units)
HEI10 (arb. units)
Relative position along bivalent Relative position along bivalent 100
2
f Double COs 10 1 80
time (hr)
4
60
50
Number of COs
Number of COs
6 10 0 40
40 600
8 20
30 400 10 − 1
0
10
20 0 10 20 30 0.0 2.5 5.0 7.5 10.0
200 posit ion ( μ m ) Time (hr)
10
0
0.0 0.2 0.4 0.6 0.8 1.0
0
0.0 0.2 0.4 0.6 0.8 1.0
Late stage data Simulation output
Relative position along bivalent Relative position along bivalent k Double CO HEI10 focus intensity vs position
g Triple COs
N= 206 R 2 = 0.23 N= 206 (sam ple) R 2 = 0.26
50 600
Left CO relative intensity
Left CO relative intensity
0.7 0.7
Number of COs
Number of COs
40
0.6 0.6
400
30
0.5 0.5
20
200
0.4 0.4
10
0.3 0.3
0 0
0.0 0.2 0.4 0.6 0.8 1.0 0.0 0.2 0.4 0.6 0.8 1.0 0.2 0.4 0.6 0.8 0.4 0.6
Relative position along bivalent Relative position along bivalent Midpoint relative position Midpoint relative position
h N=418
CO spacing
N=5282 l CO HEI10 focus intensity
0.04 1 1250 1
Number of COs
Number of COs
0.04
100 2 2
Frequency
Frequency
1000
0.03 0.03 3 3
75
4+ 750 4+
0.02 0.02 50 500
0.01 0.01 25 250
0.00 0.00 0 0
0 20 40 60 0 20 40 60 0.0 0.1 0.2 0.3 0.0 0.1 0.2 0.3
Spacing ( μ m ) Spacing ( μ m ) Relative CO intensity Relative CO intensity
demonstrated that a ~40% reduction in SC length per cell com- shift in global CO positioning away from chromosome ends
pared with male meiocytes19 is accompanied by an equivalent (Supplementary Fig. 4), in full agreement with experiments.
~40% reduction in CO number per cell, with a shift in COs away Within our own experimental dataset, we also identified a ten-
from the telomeres20. Consistent with these findings, we found dency for longer bivalents (measured in µm of SC length) to have
that reducing SC length in our model (with otherwise default more COs, with a comparable relationship identified in model
parameters, including an RI density of 1 RI per 2 μm of SC) by simulations (Supplementary Fig. 5), further supporting a link
40% resulted in a 36% reduction in CO number per cell, with a between SC length and CO number in A. thaliana.
NATURE COMMUNICATIONS | (2021)12:4674 | https://doi.org/10.1038/s41467-021-24827-w | www.nature.com/naturecommunications 5ARTICLE NATURE COMMUNICATIONS | https://doi.org/10.1038/s41467-021-24827-w
Fig. 2 Comparison between experiments and coarsening model. a, b Model schematic: HEI10 molecules (with 1D concentration c) (red) diffuse along SC
(green), absorb into foci (yellow, with HE10 amounts Cn at rate α, escape foci onto SC at rate β (Eqs. (1–3)). Boundary, initial conditions (Eqs. (4–5)). Initial
HEI10 amount at RI focus drawn from truncated normal distribution NT (mean C0, std dev σ, values restricted within ±3σ). The graph shows function
f modulating initial HEI10 RI loading near bivalent ends. Table: model parameter values. c–h Comparison of late-stage bivalent cytology data (left) with
simulations (right) (experimental data from 395 bivalents from 95 individual cells from 11 wild-type plants). Crossovers (COs) in the experimental data are
defined as the positions of late-HEI10 foci. c Number of COs per bivalent. d–g CO positions along bivalents. (813 COs). d All COs. e Bivalents with single
CO. f Stacked histograms for double COs, showing positions of 1st/2nd CO. g Triple COs, showing positions of 1st/2nd/3rd CO. h Distribution of spacing
between adjacent COs. i Effect of varying initial RI density on CO number per bivalent relative to wild-type (data18: red crosses; model prediction: blue line).
j Example simulation kymographs of HEI10 focus intensities for triple (top left), double (top right), single (bottom left) COs. Shading: loge focus intensity.
Traces of foci intensity against time (bottom right), showing triple CO simulation (top left). k Analysis of double CO HEI10 focus intensities; experiments
(left), simulations (right): On arbitrarily aligned SC, intensity of left CO, relative to sum of both intensities, against relative position (measured from left
end) of the midpoint between the two COs (CO ‘catchment area’). Blue lines: linear-regression best-fits. l Histograms of intensities of CO HEI10 foci,
relative to sum of all foci within a cell, colour-grouped according to CO number per bivalent (inset); experiments (left), simulations (right). Source data are
provided as a source data file.
HEI10 patterning in lines with variable HEI10 dosage. After different cellular processes22, such as the well-characterised Wnt
fitting and validating model parameters using wild-type data, we signal transduction pathway23. Furthermore, related models, in
next tested how cytological data obtained from lines exhibiting which proteins diffuse in one dimension along DNA, and which
variable HEI10 dosage compared with model predictions. For contain specific regions where the protein has distinct binding/
these cases, all earlier parameter values were fixed except for those unbinding behaviour, have been successfully used to model other
parameters (c0, C0 and σ, Fig. 2b) specifying the initial con- biological phenomena (e.g. bacterial SpoIIIE24).
centrations of HEI10, both on the SC and at the RI, which were Note that HEI10 coarsening dynamics in the model occur
each multiplied by a constant factor for each variable dosage line. purely in cis, solely along individual pairs of synapsed bivalents,
Cytological late-HEI10 focus positioning data were obtained from without further exchange with the nucleoplasm. This prevents
the well-characterised HEI10 over-expressor line C26 and from a competition between non-homologous chromosomes for HEI10
hei10-2 + /− heterozygous T-DNA insertion line, using the same and promotes CO assurance. Based on recent evidence, we pro-
quantitative imaging pipeline used for the wild-type (Figs. 3a and pose that the SC may act as a potential candidate for promoting
4a, Supplementary Fig. 1). We detected an average of 19.9 (s.d. ± cis-coarsening, with Arabidopsis zyp1 mutants losing CO inter-
3.7, n = 33) and 8.6 (s.d. ± 2.3, n = 40) late-HEI10 foci per cell, ference, CO assurance and the wild-type patterning of HEI10
and 239 μm (s.d. ± 35 μm, n = 68) and 237 μm (s.d. ± 32 μm, n = along the SC in zygotene and early pachytene cells, whilst
62) total SC length per cell, in the HEI10 over-expressor and maintaining the presence of late-HEI10 foci in late prophase
hei10-2 + /− heterozygous lines, respectively. The best fit for the cells25,26. It has also been shown that male/female differences in
over-expressor was found with a 4.5-fold increase in HEI10, CO number are abolished in Arabidopsis SC mutants, suggesting
broadly consistent with measured mRNA levels in HEI10 over- that the SC is directly involved in mediating heterochiasmy25.
expressing lines6. Overexpressor simulations were then a close As COI is a conserved phenomenon, our coarsening paradigm
match for cytological observations of late-HEI10 focus number, may, therefore, represent a conserved feature of meiotic crossover
positioning and relative intensity (Fig. 3). In particular, the model positioning in other organisms. Consistent with this hypothesis,
could capture a much greater number of bivalents experiencing HEI10 is a member of a broadly conserved family of RING-finger
>4 COs, and that COs were positioned much closer together domain-containing proteins with similar dynamics that function
whilst still experiencing weak interference (compare Fig. 3e to within the class I (COI sensitive) CO pathway8, including Zip3 in
Fig. 2h). For the hei10 + /− lines, the HEI10 cytological data S. cerevisiae27, HEI10 and RNF212 in mammals28,29, Vilya in
could again be well fitted to the model across a range of CO Drosophila30 and ZHP-3 in C. elegans31. Whilst we propose
measures (Fig. 4) using a 40% reduction in HEI10. For example, HEI10 coarsening to be a key mechanism for CO positioning, we
the model successfully predicted a much greater number of note that perturbations in proteins that affect any of the para-
bivalents experiencing a single CO (but still with no zero-CO meters or initial conditions within our model may also exert
bivalents, thus maintaining CO assurance and the obligate CO, measurable effects on interference. We also emphasise that the
Fig. 4b). COs were also found to be generally positioned further coarsening mechanism may act synergistically with other ele-
apart from one another, thus exhibiting stronger interference, as ments, such as mechanical stress, to achieve robust regulation of
found cytologically for late-HEI10 foci (compare Fig. 4g to CO positioning32,33.
Fig. 3e). Overall, the model fits for cases with variable HEI10
dosage were in good agreement with the data, though with some Methods
overrepresentation of HEI10 foci in telomeric regions in our Plant materials. Arabidopsis thaliana lines used in this study were wild-type Col-0,
simulations. the HEI10 overexpressor-line C28 and heterozygotes of the hei10-2 T-DNA
insertion line (Salk_014624). hei10-2 genotyping was performed using the primers
hei10-2-F, hei10-2-R and the LBb1.3 T-DNA left border primer. The presence of
Discussion the HEI10 transgene in the C2 lines was confirmed using the primers HEI10-F and
In this work, we propose a model whereby diffusion-mediated HEI10-R. All primer sequences are listed in Supplementary Table 1. Plants were
coarsening dynamics of HEI10 is itself the primary driver of CO grown in controlled environment rooms with 16 h of light (125 mMol cool white)
positioning and COI in Arabidopsis, as speculated over 4 decades at 20 °C and 8 h of darkness at 16 °C.
ago by Robin Holliday21. Our results also demonstrate that COI
strength can be tuned simply by altering the cellular abundance of Immunocytology. Immunostained spreads of Arabidopsis pachytene cells were
HEI10 in A. thaliana. Our model incorporates dynamical clus- prepared for 3D-SIM imaging as follows34. To roughly stage the meiocytes, a single
anther from a floral bud was removed and squashed in a drop of water on a clean
tering of signalling proteins to generate biomolecular foci with a slide under a coverslip and inspected using brightfield microscopy. Early- and mid-
high local protein concentration and, hence, high signalling pachytene meiocytes were still stuck together within a meiocyte column, whilst
activity. Similar dynamics have been described in a variety of late-pachytene meiocytes had begun to break apart from one-another. More precise
6 NATURE COMMUNICATIONS | (2021)12:4674 | https://doi.org/10.1038/s41467-021-24827-w | www.nature.com/naturecommunicationsNATURE COMMUNICATIONS | https://doi.org/10.1038/s41467-021-24827-w ARTICLE
Late stage data Simulation output Late stage data Simulation output
Bivalent CO number CO HEI10 focus intensity
b d
30 1500
Number of bivalents
Number of bivalents
150
Number of COs
Number of COs
6000
20 1000 100 4000
10 500 50 2000
0 0 0 0
0 1 2 3 4 5 6 7 8 0 1 2 3 4 5 6 7 8 0.000 0.025 0.050 0.075 0.100 0.000 0.025 0.050 0.075 0.100
Number of COs Number of COs Relative CO intensity Relative CO intensity
CO position CO spacing
c e N=397 N=16958
3000 0.06 0.08
60
Number of COs
Number of COs
Frequency
Frequency
0.06
40 2000 0.04
0.04
20 1000 0.02
0.02
0 0 0.00 0.00
0.0 0.2 0.4 0.6 0.8 1.0 0.0 0.2 0.4 0.6 0.8 1.0 0 20 40 60 0 20 40 60
Relative position along bivalent Relative position along bivalent Spacing ( μ m ) Spacing ( μ m )
Fig. 3 Analysis for HEI10 over-expressor. a 3D-SIM image and example SC measurements from a late pachytene cell of the HEI10 over-expressor (OX)
line C2. Representative image shown. Data were collected from 121 late pachytene bivalents for further analysis. Scale bars = 5 µm. b–e Experimental data
(left) and simulation outputs (right) for HEI10 over-expressor, with simulated HEI10 levels 4.5-times WT (data from 121 bivalents from 32 cells from 4
plants). Crossovers (COs) in the experimental data are defined as the positions of late-HEI10 foci. b Number of COs per bivalent. c CO positions (all) along
bivalents. (Data from 518 COs.) d Histograms of intensities of CO HEI10 foci, relative to sum of all foci within a cell. e Distribution of spacing between
adjacent COs. Source data are provided as a source data file.
staging of early and late pachytene meiocytes was also based on previously defined HEI10) channels of our system. To determine the best refractive index, 200 nm
HEI10 behaviour8, with mid pachytene meiocytes exhibiting an intermediate TetraSpeck microspheres (Invitrogen) were dried on a coverslip at 1/100 dilution,
phenotype. The remaining 5 anthers containing meiocytes of the desired stage were mounted on a slide in 7 μl Vectashield, and imaged using the same microscope
dissected from the staged buds. They were then macerated using a brass rod on a settings as used for the experiments. The symmetry of the point spread function for
No. 1.5H coverslip (Marienfeld) in 10 µl digestion medium (0.4% cytohelicase, each channel was then assessed in orthogonal sections through the stack. Channel
1.5% sucrose, 1% polyvinylpyrolidone in sterile water) for 1 min. Coverslips were alignment was performed using the same Tetraspeck beads and the ‘affine’ align-
then incubated in a moist chamber at 37 °C for 4 min before adding 10 µl of 2% ment algorithm that is included in Zeiss’ Zen Black software. Occasional post-
lipsol solution followed by 20 µl 4% paraformaldehyde (pH 8). Coverslips were processing mismatches in z-alignment were manually adjusted in some cells by
dried in the fume hood for 3 h, blocked in 0.3% bovine serum albumin in 1× trimming the top or bottom stacks to ensure maximal co-localisation of ZYP1 and
phosphate-buffered saline (PBS) solution and then incubated with primary anti- HEI10 signals to facilitate downstream image analysis. For optimal image quality
body at 4 °C overnight and secondary antibody at 37 °C for 2 h. In between anti- and to minimise the introduction of reconstruction artefacts, microscope laser
body incubations, coverslips were washed 3 times for 5 min in 1× PBS plus 0.1% power and camera gain values were adjusted for the red (HEI10) and green (ZYP1)
Triton X-100. Coverslips were then incubated in 10 µl DAPI (10 µg/ml) for 5 min, channels within a range of 10–30% and 1–3 units, respectively, for each cell to
washed and mounted on a slide in 7 µl Vectashield. The following primary anti- improve contrast and reduce fluorophore bleaching. Bleaching and contrast of raw
bodies were used at 1:500 dilutions: anti-HEI10 (rabbit), anti-ZYP1 (rat) and anti- images was assessed using the SIMcheck plugin to FIJI35.
ASY1 (guinea-pig). The following secondary antibodies were used at 1:200 dilu-
tions: anti-rat Alexa Fluor 488 (RRID AB_2534074), anti-rabbit Alexa Fluor 555
(RRID AB_2535849) and anti-guinea pig Alexa Fluor 647 (RRID AB_2735091).
Immunostained cells were imaged using 3D structured illumination microscopy Image analysis. Each 3D-SIM image contained one nucleus (in a small number of
(3D-SIM) on a Zeiss Elyra PS1 microscope equipped with an EM-CCD camera, a cases multiple nuclei were present, which did not affect the analysis). The image
Plan-Apochromat ×63, NA 1.40 oil objective and 405, 488, 561 and 642 nm solid- analysis pipeline (Supplementary Fig. 1) contained six main steps: bivalent skeleton
state laser diodes. Slides were imaged in 3D SIM mode with three stripe angles and tracing, trace fluorescence intensity quantification, HEI10 peak detection, HEI10
five phases according to the microscope manufacturer’s instructions. Z-stacks were foci identification, HEI10 foci intensity quantification, and total bivalent HEI10
captured at an interval size of 0.0909 μm, with the size of each stack being suffi- intensity quantification. Note that the normalization steps used for foci identifi-
ciently large for the cell to be out of focus at both ends. An immersion oil with a cation differ from those used for foci intensity quantification; the former was
refractive index of 1.515 was used that was optimised for the green/red (ZYP1/ intended to robustly identify foci from noisy traces, whilst the latter was used to
carefully quantify foci HEI10 levels.
NATURE COMMUNICATIONS | (2021)12:4674 | https://doi.org/10.1038/s41467-021-24827-w | www.nature.com/naturecommunications 7ARTICLE NATURE COMMUNICATIONS | https://doi.org/10.1038/s41467-021-24827-w
Late stage data Simulation output Late stage data Simulation output
Bivalent CO number Double COs
b e
80 2500
20
Number of bivalents
Number of bivalents
600
Number of COs
Number of COs
2000
60
15
1500 400
40 10
1000
200
20 5
500
0 0 0 0
0 1 2 3 4 0 1 2 3 4 0.0 0.2 0.4 0.6 0.8 1.0 0.0 0.2 0.4 0.6 0.8 1.0
Number of COs Number of COs Relative position along bivalent Relative position along bivalent
All COs CO HEI10 focus intensity
c 1000
f
2000
80
1 1
Number of COs
Number of COs
Number of COs
Number of COs
30 800 2 2
60 1500
3+ 3+
600
20 1000
40
400
10 20 500
200
0 0 0 0
0.0 0.2 0.4 0.6 0.8 1.0 0.0 0.2 0.4 0.6 0.8 1.0 0.0 0.1 0.2 0.3 0.0 0.1 0.2 0.3
Relative position along bivalent Relative position along bivalent Relative CO intensity Relative CO intensity
Single COs CO spacing
d g 0.04 N=102 N=2818
15 500 0.04
Number of COs
Number of COs
Frequency
Frequency
400 0.03
0.03
10
300 0.02
0.02
200
5
0.01 0.01
100
0 0 0.00 0.00
0.0 0.2 0.4 0.6 0.8 1.0 0.0 0.2 0.4 0.6 0.8 1.0 0 20 40 60 0 20 40 60
Relative position along bivalent Relative position along bivalent Spacing ( μ m ) Spacing ( μ m )
Fig. 4 Analysis for hei10 heterozygote. a 3D-SIM image and example SC measurements from a late pachytene cell of the hei10-2 +/− line. Representative
image shown. Data were collected from 164 late pachytene bivalents for further analysis. Scale bars = 5 µm. b–g Experimental data (left) and simulation
outputs (right) for hei10 +/−, with simulated HEI10 levels 0.6-times WT (data from 164 bivalents from 40 cells from 3 plants). Crossovers (COs) in the
experimental data are defined as the positions of late-HEI10 foci. b Number of COs per bivalent. c–e CO positions along bivalents. (Data from 266 COs). c
All COs. d Bivalents with single CO. e Stacked histograms for double COs, showing positions of 1st/2nd CO. f Histograms of intensities of CO HEI10 foci,
relative to sum of all foci within a cell, colour-grouped according to CO number per bivalent (inset). g Distribution of spacing between adjacent COs.
Source data are provided as a source data file.
(1) For bivalent skeleton tracing, individually synapsed pachytene-bivalents segments during the initial SNT tracing step led to the premature truncation of
were traced and segmented in 3-dimensions from 3D-SIM z-stack images using the skeleton-traces during the voxel-ordering step and, hence, these traces were
Simple Neurite Tracer (SNT) plugin to ImageJ36. Traces were made using the linear excluded from the final analysis.
ZYP1 signal, which localises along the SC. As cells were also stained for ASY1, (2) HEI10 intensities on the path were extracted using the mean intensity from
which localises to asynaptic regions of the meiotic axis, any very small regions of a spherical region of radius 0.2 µm centred at each voxel.
asynapsis that persist into pachytene were incorporated within the measurements (3) HEI10 intensity trace data (at each point using the average over the
to ensure five complete pachytene-bivalents were traced end-to-end in each cell spherical region of radius 0.2 µm) was normalized by subtraction of the mean and
(Supplementary Fig. 1). 3D-skeletons of each pachytene-bivalent path were division by the standard deviation of the HEI10 intensities along the trace. (Note
generated using SNT. Bivalent lengths (in µm) were exported to a Microsoft Excel that subtraction of the median, as used in step 4 below, leads to almost identical
worksheet for analysis. Further analysis was performed using custom Python results). Peaks in the above HEI10 trace intensities were identified using the scipy37
scripts [https://github.com/jfozard/HEI10]. Starting from an arbitrary bivalent end, find_peaks criterion. This criterion identifies local maxima, rejecting peaks whose
skeleton voxels were ordered. Occasionally, the accidental introduction of branched prominence was less than half of the standard deviation of the HEI10 intensity
8 NATURE COMMUNICATIONS | (2021)12:4674 | https://doi.org/10.1038/s41467-021-24827-w | www.nature.com/naturecommunicationsNATURE COMMUNICATIONS | https://doi.org/10.1038/s41467-021-24827-w ARTICLE
values along the trace, or within 5 voxels (along the traced skeleton) of a more differences present in the original widefield images were retained within the 3D-
intense maximum. Occasionally, small flecks of HEI10 foci from separate, nearby SIM reconstructed images. The same significant differences between relative
bivalents (intruding foci) were identified within the 0.2 µm spherical regions. These maximum HEI10 foci intensity and late-HEI10 foci number per bivalent were also
intruding foci usually cause a small peak on the bivalent trace that they intrude detected within the pseudo-widefield data (Supplementary Fig. 2e). A
upon, but a larger peak on the correct bivalent trace. To eliminate the impact of Kruskal–Wallace test was used to identify significant differences in relative
intruding foci during peak identification we compared absolute trace peak maximum HEI10 foci intensity on bivalents with different late-HEI10 foci number
intensities with those on all bivalents within a spheroidal region (10 voxels in each (chi-squared = 27.061, df = 2, p-value = 1.33e−06 and chi-squared = 25.465, df =
dimension, with the image resolution being 0.04 µm × 0.04 µm × 0.9 µm), rejecting 2, p-value = 2.953e−06 for the pseudo-widefield and 3D-SIM data, respectively,
peaks where a larger peak was present within this region. n = 101 foci) followed by a post-hoc Dunn’s test of multiple comparisons using
(4) For foci identification, the same intensity normalization was used as in step rank sums with a Bonferonni correction (Supplementary Fig. 2e, f). The R packages
3. Peaks from step 3 were then identified as foci if their normalized intensity was ‘kruskal.test’ and ‘dunn.test’ were used.
more than 0.4 times the intensity of the largest peak.
(5) For late-HEI10 focus intensity quantification, the median HEI10 intensity
Mathematical modelling. We employed a hybrid stochastic/deterministic simu-
along each trace was used as an estimate of background fluorescence and
lation approach, where the initial conditions incorporate stochasticity both in the
subtracted from the intensities at each focus peak (from step 4). Due to differences
initial loading of HEI10 onto the SCs, and in the length of the SC, but thereafter the
in factors such as antibody penetration and local slide conditions, we found that
dynamics follow a deterministic trajectory specified by differential equations. The
absolute fluorescent intensity values for the same primary and secondary antibody
initial stochasticity is essential given the observed highly variable nature of the
combinations varied considerably between cells, including between cells on the
HEI10 loading in our experiments. As these initial conditions are stochastic,
same slide. Therefore, intensities were normalized relative to the sum of all foci
multiple realisations were simulated (1000 for each chromosome length). For the
intensities within the same cell, in order to minimize the effects of differences in
subset of the late-stage WT data for which all the bivalents within each cell were
imaging conditions between cells (e.g. Fig. 1b (middle left, middle right)).
well-traced, we sorted the bivalent skeleton traces (described in ‘Image analysis’
(6) To quantify the total HEI10 intensity per bivalent (e.g. for cells earlier in
section) by length, and used these lengths to estimate the empirical distributions of
pachytene, where HEI10 foci are difficult to identify—see Fig. 1a upper), the each of the first to fifth longest bivalents within each cell. Note that, in the absence
median HEI10 intensity (same value as in step 5) was subtracted from each trace,
of another marker, we were unable to identify SCs with specific chromosomes other
and then the resulting value integrated along each bivalent trace. Similar to focus
than through their lengths. Mean and standard deviation parameters of these
intensity quantification (step 5), these intensities were then normalized through
distributions are listed in Supplementary Table 2. First, for each of the five SC
division by the sum of the integrated intensities from all bivalents in the same cell.
lengths (first to fifth longest SC within a cell), a length L was generated at random
Further processing of peak intensity and position data were performed using the
from the appropriate empirical distribution, approximated by a normal distribu-
Python packages imageio, numpy38, pandas, statsmodels and matplotlib. For the
tion (with values clamped to the range within three standard deviations of the
analysis of per bivalent relative total HEI10 intensities in Fig. 1b (left), wild type
mean). For each sampled L, the number N of RIs was chosen to give 1 RI per 2 µm,
cells of the appropriate stage (‘early’, ‘mid’ or ‘late’) were included in the analysis. rounded to the nearest integer, consistent with our SC measurements and
Cells that could not be clearly staged were excluded from the analysis. Relative SC
experimentally measured RI numbers12, and early HEI10 foci numbers8 per cell.
lengths were calculated by dividing each SC length by the total length of the SCs in
These N RIs were then placed at random positions, sampled from a uniform
the cell. SC relative HEI10 intensities were calculated as in step 6 above. For the
distribution on the length of the SC, and sorted in order of their position along the
central two panels of Fig. 1b, analysis was restricted to all ‘late’ cells for which all
SC. The RI positions were denoted by x1 < x2 1 controls how rapidly the escape rate
Fig. 2b). Maximum intensity values were then obtained for each focus and
diminishes for increasing Cn. No flux boundary conditions (4) were imposed at SC
normalized by dividing these values by the summed maximum intensity values of
ends. Note that, by construction, this system of equations conserves the total
all late-HEI10 foci values within the same cell to give a relative maximum intensity
amount of HEI10 on each SC.
value for each focus. The 5 individual bivalents within a cell were segmented and
Eq. (1, see Fig. 2b) was discretized by dividing each SC into M = 2000
identified using the 3D-SIM ZYP1 channel and the simple-neurite tracer plugin to
compartments of length h = L/M, with a compartment HEI10 concentration given
FIJI36 (Supplementary Fig. 2c). Once again, using this alternative method, we
by cm(t) where m ¼ 1; ¼ ; M and replacing the spatial second derivative by its
identified significant differences in late-HEI10 relative focus intensity for foci on
standard finite-volume approximation (see e.g. ref. 41), giving
bivalents with different total numbers of late-HEI10 foci (Supplementary Fig. 2f). !
Additionally, whilst the 3D-SIM image reconstruction method used on the ELYRA dc1 c c 1
microscope is derived from linear algorithms40 and, hence, should retain relative ¼D 2 2 1þ ∑ ðβðC n ÞC n αc1 Þ ð6Þ
dt h h n s:t: 0 ≤ xnARTICLE NATURE COMMUNICATIONS | https://doi.org/10.1038/s41467-021-24827-w
Julia package. The equations were integrated over a period 0 ≤ t≤ T, with the 2. Wang, Y. & Copenhaver, G. P. Meiotic recombination: mixing it up in plants.
parameter T = 36,000 s = 10 h. This numerical integration method used an Ann. Rev. Plant Biol. 69, 577–609 (2018).
adaptive timestep with relative error tolerance of 10−12, and a non-negativity 3. Zickler, D. & Kleckner, N. A few of our favorite things: pairing, the
constraint on all variables at intermediate integration timepoints. Foci were bouquet, crossover interference and evolution of meiosis. Semin. Cell Dev.
identified as COs using the same criterion as for the experimental data (i.e. if their Biol. 54, 135–148 (2016).
intensity was more than 0.4 times the intensity of the brightest focus). 4. Otto, S. P. & Payseur, B. A. Crossover interference: shedding light on the
The diffusion coefficient, D = 1.1 μm2 s−1, was chosen to be compatible with evolution of recombination. Ann. Rev. Genet. 53, 19–44 (2019).
measurements of the diffusion coefficient for an analogous protein, ZHP-3, in C. 5. Sturtevant, A. H. The behavior of the chromosomes as studied through
elegans13. The remaining default parameters are listed in Fig. 2b. These values were linkage. Zeitschrift für Induktive Abstammungs- und Vererbungslehre 13,
fitted through comparison of simulation outcomes with our experimental data. 234–287 (1915).
Because of the model simplicity, we were able to find these parameter values 6. Ziolkowski, P. A. et al. Natural variation and dosage of the HEI10 meiotic E3
through manual exploration of simulation outputs without the need for automated ligase control Arabidopsis crossover recombination. Genes Dev. 31, 306–317
parameter searches. To assess robustness to parameter value choices, simulations (2017).
were performed in which each parameter value was perturbed by 10%, giving 7. Serra, H. et al. Massive crossover elevation via combination of HEI10 and
broadly comparable results. recq4a recq4b during Arabidopsis meiosis. Proc. Natl Acad. Sci. USA 115,
We also developed a version of the model for female bivalents (Supplementary
2437–2442 (2018).
Fig. 4). For all female bivalent length distributions, the mean and the standard
8. Chelysheva, L. et al. The Arabidopsis HEI10 is a new ZMM protein related to
deviation were reduced by 40% compared to their male counterparts.
Zip3. PLoS Genet. 8, e1002799 (2012).
We also developed a version of the model with an alternative form for the RI
9. Hans de Jong, J., Fransz, P. & Zabel, P. High resolution FISH in plants;
escape rate, namely
techniques and applications. Trends Plant Sci. 4, 258–263 (1999).
βðCÞ ¼ βC =ð1 þ δeC=K C Þ ð9Þ 10. López, E., Pradillo, M., Romero, C., Santos, J. L. & Cuñado, N. Pairing and
With appropriately modified parameter values, we were again able to obtain a synapsis in wild type Arabidopsis thaliana. Chromosome Res. 16, 701–708
reasonable fit to the wild-type data (Supplementary Fig. 6). We note that an (2008).
important feature of this escape rate is that it decreases faster than 1/C for large C, 11. Anderson, L. K., Hooker, K. D. & Stack, S. M. The distribution of early
so that RIs with high levels of HEI10 outcompete those with lower levels. However, recombination nodules on zygotene bivalents from plants. Genetics 159,
if the escape rate decreases too quickly, coarsening stalls and too many foci are 1259–1269 (2001).
generated at the end of pachytene. 12. Higgins, J. D. et al. AtMSH5 partners AtMSH4 in the class I meiotic crossover
The model captures the phenomenon of the ‘obligatory crossover’, with very pathway in Arabidopsis thaliana, but is not required for synapsis. Plant J. 55,
few SCs having zero COs at the end of the simulation. Such robust behaviour is a 28–39 (2008).
natural property of coarsening models and motivated our initial model 13. Stauffer, W. T., Zhang, L. & Dernburg, A. Diffusion through a liquid
development. Provided that the initial HEI10 loading is sufficiently high, HEI10 crystalline compartment regulates meiotic recombination. In Proc.SPIE vol.
foci exceeding a critical threshold will form and grow at the expense of the smaller 10888 (2019).
foci, concentrating HEI10 into progressively smaller numbers of foci. However, the 14. Brauns, F., Weyer, H., Halatek, J., Yoon, J. & Frey, E. Wavelength Selection by
focus number cannot drop below one, as after coarsening into a single focus, that Interrupted Coarsening in Reaction-Diffusion Systems. Physical Review Letters
focus is necessarily stable, as there is then nowhere else for HEI10 to accumulate. 126, 104101 (2021).
At sufficiently low HEI10 levels the model will fail to coarsen, and instead will be 15. Prusicki, M. A. et al. Live cell imaging of meiosis in Arabidopsis thaliana. eLife
attracted to the (now stable) steady state with equal levels of HEI10 at each RI. 8, e42834 (2019).
In the model, HEI10 can bind back and forth between the foci and a freely 16. Armstrong, S. J., Franklin, F. C. H. & Jones, G. H. Nucleolus-associated
diffusible form on the SC. We emphasise that this change in location will almost telomere clustering and pairing precede meiotic chromosome synapsis in
certainly involve accessory proteins and modification of the HEI10 protein itself to Arabidopsis thaliana. J. Cell Sci. 114, 4207–4217 (2001).
make such transitions energetically possible. However, such accessory proteins 17. Martini, E., Diaz, R. L., Hunter, N. & Keeney, S. Crossover homeostasis in
could simply be RI and/or SC localised and therefore not show any further yeast meiosis. Cell 126, 285–295 (2006).
dynamical patterning. We have, therefore, not explicitly included such proteins in 18. Xue, M. et al. The number of meiotic double-strand breaks influences
the simulations. They are instead treated implicitly as allowing successive cycles of crossover distribution in Arabidopsis. Plant Cell 30, 2628 (2018).
HEI10 localisation and release from HEI10 foci. It is possible that these accessory 19. Drouaud, J. et al. Sex-specific crossover distributions and variations in
proteins could play a more dynamic patterning role, for example, by functioning as interference level along Arabidopsis thaliana chromosome 4. PLoS Genet. 3,
a repressor of HEI10 away from the foci. They could then exhibit coarsening e106–e106 (2007).
behaviour along with HEI10. Our model could easily be generalised into such a 20. Giraut, L. et al. Genome-wide crossover distribution in Arabidopsis thaliana
form. However, such proteins are clearly not logically required to explain CO
meiosis reveals sex-specific patterns along chromosomes. PLoS Genet. 7,
positioning, as our model, which lacks such explicit repressive factors, can explain
e1002354 (2011).
essentially all our current data. Furthermore, there is currently little evidence for
21. Holliday, R. Recombination and meiosis. Philos. Trans. R. Soc. Lond. B Biol.
the presence of such proteins, at least in A. thaliana.
Sci. 277, 359–370 (1977).
22. Banani, S. F., Lee, H. O., Hyman, A. A. & Rosen, M. K. Biomolecular
Reporting summary. Further information on research design is available in the Nature condensates: organizers of cellular biochemistry. Nat. Rev. Mol. Cell Biol. 18,
Research Reporting Summary linked to this article. 285–298 (2017).
23. Bienz, M. Head-to-tail polymerization in the assembly of biomolecular
Data availability condensates. Cell 182, 799–811 (2020).
Data supporting the findings of this work are available within the paper and its
24. Chara, O., Borges, A., Milhiet, P.-E., Nöllmann, M. & Cattoni, D. I. Sequence-
Supplementary Information files. Imaging data used in this study, which is associated
dependent catalytic regulation of the SpoIIIE motor activity ensures
with all figures, was deposited to the Image Data Resource (https://idr.openmicroscopy.
directionality of DNA translocation. Sci. Rep. 8, 5254 (2018).
org) under accession number idr0107. Source data are provided with this paper.
25. Capilla-Pérez, L. et al. The synaptonemal complex imposes crossover
interference and heterochiasmy in Arabidopsis. Proc. Natl Acad. Sci. USA 118,
e2023613118 (2021).
Code availability 26. France, M. G. et al. ZYP1 is required for obligate cross-over formation and
Custom Python scripts for data analysis, and Julia code to perform numerical simulation cross-over interference in Arabidopsis. Proc. Natl Acad. Sci. USA 118,
of the model, is available at https://github.com/jfozard/HEI10 (https://doi.org/10.5281/ e2021671118 (2021).
zenodo.5076176). 27. Agarwal, S. & Roeder, G. S. Zip3 Provides a link between recombination
enzymes and synaptonemal complex proteins. Cell 102, 245–255 (2000).
28. Reynolds, A. et al. RNF212 is a dosage-sensitive regulator of crossing-over
Received: 3 November 2020; Accepted: 12 July 2021; during mammalian meiosis. Nat. Genet. 45, 269–278 (2013).
29. Qiao, H. et al. Antagonistic roles of ubiquitin ligase HEI10 and SUMO
ligase RNF212 regulate meiotic recombination. Nat. Genet. 46, 194–199
(2014).
30. Lake, C. M. et al. Vilya, a component of the recombination nodule, is required
for meiotic double-strand break formation in Drosophila. eLife 4, e08287 (2015).
References 31. Jantsch, V. et al. Targeted gene knockout reveals a role in meiotic
1. Gray, S. & Cohen, P. E. Control of meiotic crossovers: from double-strand recombination for ZHP-3, a Zip3-related protein in Caenorhabditis elegans.
break formation to designation. Ann. Rev. Genet. 50, 175–210 (2016). Mol. Cell. Biol. 24, 7998–8006 (2004).
10 NATURE COMMUNICATIONS | (2021)12:4674 | https://doi.org/10.1038/s41467-021-24827-w | www.nature.com/naturecommunicationsNATURE COMMUNICATIONS | https://doi.org/10.1038/s41467-021-24827-w ARTICLE
32. Kleckner, N. et al. A mechanical basis for chromosome function. Proc. Natl Author contributions
Acad. Sci. USA 101, 12592 (2004). C.M., J.A.F. and M. H. jointly conceived the study, and designed the mathematical
33. de Boer, E., Stam, P., Dietrich, A. J. J., Pastink, A. & Heyting, C. Two levels of model. C.M. performed the experiments, imaging, and the initial data analysis. J.A.F,
interference in mouse meiotic recombination. Proc. Natl Acad. Sci. USA 103, C.M. and M. H. developed the image processing pipeline. J.A.F. performed numerical
9607–9612 (2006). simulations and analysis. I.R.H. provided plant materials. C.M., J.A.F., M. H., M. H. and
34. Morgan, C. & Wegel, E. In Plant Meiosis. Methods in Molecular Biology, Vol K.B. wrote the paper.
2061 (ed. Pradillo, M., H. S.). https://doi.org/10.1007/978-1-4939-9818-0_4.
(Humana, New York, NY, 2020).
35. Ball, G. et al. SIMcheck: a toolbox for successful super-resolution structured
Competing interests
The authors declare no competing interests.
illumination microscopy. Sci. Rep. 5, 15915 (2015).
36. Longair, M., Baker, D. & Armstrong, J. Simple neurite tracer: open source
software for reconstruction, visualization and analysis of neuronal processes. Additional information
Bioinforma. (Oxf., Engl.) 27, 2453–2454 (2011). Supplementary information The online version contains supplementary material
37. Virtanen, P. et al. SciPy 1.0: fundamental algorithms for scientific computing available at https://doi.org/10.1038/s41467-021-24827-w.
in Python. Nat. Methods 17, 261–272 (2020).
38. Harris, C. R. et al. Array programming with NumPy. Nature 585, 357–362 Correspondence and requests for materials should be addressed to M.H.
(2020).
39. Du, G. et al. Spatial dynamics of DNA damage response protein foci Peer review information Nature Communications thanks Osvaldo Chara and other,
along the ion trajectory of High-LET particles. Radiat. Res. 176, 706–715 anonymous, reviewer for their contributions to the peer review of this work. Peer review
(2011). reports are available.
40. Gustafsson, M. G. L. et al. Three-dimensional resolution doubling in wide-
field fluorescence microscopy by structured illumination. Biophys. J. 94, Reprints and permission information is available at http://www.nature.com/reprints
4957–4970 (2008).
41. LeVeque, R. J. Finite Volume Methods for Hyperbolic Problems. Cambridge Publisher’s note Springer Nature remains neutral with regard to jurisdictional claims in
Texts in Applied Mathematics. https://doi.org/10.1017/CBO9780511791253 published maps and institutional affiliations.
(Cambridge University Press, 2002).
42. di Marzo, G. A. RODAS5(4) - Méthodes de Rosenbrock d’ordre 5(4) adaptées
aux problemes différentiels-algébriques. MSc Mathematics Thesis; Faculty of
Open Access This article is licensed under a Creative Commons
Science, University of Geneva, Switzerland (1993).
Attribution 4.0 International License, which permits use, sharing,
43. Rackauckas, C. & Nie, Q. DifferentialEquations.jl—a performant and feature-
adaptation, distribution and reproduction in any medium or format, as long as you give
rich ecosystem for solving differential equations in Julia. J. Open Res. Softw. 5,
appropriate credit to the original author(s) and the source, provide a link to the Creative
15 (2017).
Commons license, and indicate if changes were made. The images or other third party
material in this article are included in the article’s Creative Commons license, unless
indicated otherwise in a credit line to the material. If material is not included in the
Acknowledgements article’s Creative Commons license and your intended use is not permitted by statutory
We gratefully acknowledge E. Coen, F.C.H. Franklin and members of the X. Feng lab for regulation or exceeds the permitted use, you will need to obtain permission directly from
fruitful discussions on this topic, F.C.H. Franklin for supplying the primary antibodies the copyright holder. To view a copy of this license, visit http://creativecommons.org/
and E. Wegel for microscopy support. This work was supported by BBSRC Institute licenses/by/4.0/.
Strategic Programme GEN (BB/P013511/1) to M. Howard and K.B, European Research
Council Consolidator grant (CoG EVO-MEIO 681946) to K.B., and JIC Institute Strategy
© The Author(s) 2021
Fund grant CX516F13A to C.M.
NATURE COMMUNICATIONS | (2021)12:4674 | https://doi.org/10.1038/s41467-021-24827-w | www.nature.com/naturecommunications 11You can also read