Students with
Disabilities Engaged
with Support Services
in Higher Education in
Ireland 2019/20
←
→
Page content transcription
If your browser does not render page correctly, please read the page content below
Students with Disabilities Engaged with Support Services in Higher Education in Ireland 2019/20
ISBN No: 978-1-8380513-2-7

Research: Christine Hynes (data collection/design)
Yazeed Kelly (data analysis)

Edited by Dara Ryder

Published by:

AHEAD Educational Press
East Hall
UCD
Carysfort Avenue
Blackrock
Co. Dublin

Tel: (01) 7164396
Email: ahead@ahead.ie

Supported by the Higher Education Authority
Students with
Disabilities
Engaged with
Support Services in
Higher Education in
Ireland 2019/20
Contents
Foreword                                                    1

Introduction                                                5

  AHEAD’s Strategy                                          6

Survey Method                                               7

Findings                                                    9

  Participation Rates of Students with Disabilities         9

  Undergraduate and Postgraduate                           13

  New Entrant Undergraduates with Disabilities             15

  New Entrant Disclosure Rates – HEA Data Comparison   	   16

New Registrations                                          16

Mature Students                                            17

International Students                                     17

Nature of Disability                                       18

  New Entrant Disability Breakdown                         21

  Undergraduate Disability Breakdown                       22

  Postgraduate Disability Breakdown                        23

Fields of Study                                            25

  Fields of Study Breakdown by Disability                  28
Exam Accommodations                                                  50

  Exam Accommodations by Category of Disability                      50

  Exam Accommodation by Type                                         51

  Extra Time Breakdown                                               52

 Alternative Venue Breakdown                                         53

Inside Services                                                      55

On the Ground - Opinion                                              57

  Selected Comments                                                  60

Summary                                                              63

Recommendations                                                      66

Bibliography                                                         70

Appendices                                                           72

 Appendix 1 - Number of students with disabilities studying within each
 responding higher education institution	   				  72

 Appendix 2 - Fields of Study                                        73

 Appendix 3 - Inside the Service Comments                            78

 Appendix 4 - On the Ground Comments to Question 1    	              79
Foreword
    By Dara Ryder, CEO, AHEAD

                     It is my pleasure to introduce the results of the AHEAD Survey
                     on the number of students with disabilities engaging with
                     support services in higher education in Ireland for the academic
                     period 2019/20. It has been an extremely challenging year
                     all round with the arrival of the COVID-19 virus to Ireland in
                     February, 2020. The impact of government imposed restrictions,
                     to curb the spread of this deadly virus in participating
    institutions, resulted in an immediate response to shift the continuation of the
    delivery of learning for the remainder of the academic year, off-campus, largely
    remotely via online technology. Bear in mind when reading this report that this
    survey period covers an academic year that was completed part on-campus and
    part remotely.

    AHEAD is very interested to learn and understand how this transition to off
    campus was managed and maintained and in particular with regard to the
    provision of supports to students with disabilities. The current on-campus
    model of provision of supports, is according to AHEAD, not a sustainable model
    and is, in reality, one that is no longer fit for purpose. This imposed transition,
    I believe, has created a golden opportunity to explore how participating
    institutions delivered on the provision of supports to students with disabilities
    located as they were, off campus and in a variety of accommodation/home
    settings. It is an ideal time to reflect on its merits.

    AHEAD has been recommending for some time now that a more sustainable
    model of supports provision to students with disabilities in higher education is
    now required and that such a model should be unperpinned by the principles of
    Universal Design for Learning (UDL). The Covid19 experience has exposed the
    need for flexible approaches to the learning environment. The UDL framework is
    one in which adaptability and flexibility are core components to the development
    of inclusive learning environments. AHEAD hopes that this challenging and
    strangest of academic years will shine a light that will generate valuable insight
    into new approaches to learning moving forward and begin the long overdue
    process of overhauling the existing model of support provision to students with
    disabilities.

1
As one contributor put it:
“…All components of service delivery will need to be redesigned in response
to the emerging situation and in light of institute guidelines.”
(Comment from contributor - listed in full at back of Report).
In the academic year 2019/20 students with disabilities engaging with support
services represented 6.3% of the total student population, a minor increase
from the previous survey (6.2%). Taking a look at the trend over a period of time,
there remains a consistent trajectory in the number of students with disabilities
in higher education since surveys commenced (93/94). The last eleven years
alone has seen a reported 77% rise in the student population of participating
institutions of higher education (from AHEAD survey 08/09 to 19/20) but an over
226% rise in the number of students with disabilities engaging with support
services (4,853 (08/09) - 15,846 (19/20) in the same period. All staff working on
access to higher education should be commended for the great strides made
in recent years in terms of increased access.Nonetheless, the impact of this
huge increase in the numbers of students with disabilities on the system of
support provision to this cohort needs close examination as this support model
struggles to keep up with the increase in demand.
This general trend of growing at a significantly higher rate than the general
student population does not hold for all students with disabilities and, in
particular, for students with sensory disabilities, that is students who are
listed under the Deaf/Hard of hearing or Blind/Visually impaired categories.
In the academic period 19/20 students with sensory disabilities collectively
represented 4% of the population of students with disabilities, while eleven
years ago it stood at 7% (AHEAD Survey, 08/09). AHEAD has raised and
publicised (2015) this issue in the past and the Higher Education Authority (HEA)
has identified both categories as target groups to promote their advancement
in education. AHEAD would welcome an opportunity for all levels of the
education system to come together to examine the specific issues affecting the
progression of these cohorts to higher education.
2AHEAD has equally raised the issue of undertaking part-time vs full-time
courses by people with disabilities. The HEA’s review of the fund for students
with disabilities and its subsequent agreement in 2020 to extend the fund
to cover part-time courses was welcomed by AHEAD. In 2019/20 there was
a marginal decrease in the number of students studying full time and a
marginal increase in the numbers of those studying part-time. However,
the rate of participation of students with disabilities studying part-time as a
percentage of the student population undertaking part-time studies remain
relatively low at just 1.3%. The hope is that the opening up of access of the
fund to this cohort of students will, in time, have a positive impact in terms of
participation and progression.
At the time of writing and with no clear date in sight to be permitted to return
to Campus, AHEAD believes that the learning to be had from the experiences
of remote learning from participating institutions, staff and students alike,
will be an invaluable resource to inform the delivery of learning as we look to
and plan for the future. AHEAD recommends Universal Design for Learning
(UDL) as a good framework for institutions of higher education that will better
meet the needs of the increasing level of diversity in our further and higher
education systems.
This survey is made possible only with the support of the staff in the
participating institutions and the HEA’s support for AHEAD’s core activities. On
behalf of AHEAD I offer our thanks and appreciation to you all. I encourage the
dissemination of the survey findings and its insights and revelations contained
therein.
3226 %
rise in the number of students
with disabilities engaging
with support services over the
last 11 years
4Introduction
AHEAD is an independent, non-profit organisation whose mission is to
create inclusive environments in education and employment for people with
disabilities. This annual research report on the participation rates of students
with disabilities engaging with support services in higher education is part of
AHEAD’s efforts to achieve this goal.
This research is made possible by the substantial work of the staff in the
participating higher education institutions who supply statistics yearly, and
also through the consistent support provided by the Higher Education Authority
(HEA) as part of their commitment to further the promotion of equal opportunity
in higher education (HEA, 2015). This research also plays an important role in
aiding the Department of Further and Higher Education, Research, Innovation
and Science to respond to the needs of students with disabilities and plan the
national approach to supporting access and participation for this cohort.
This report provides an accurate measure of the number of students with
disabilities registered with disability support/access services in higher
education in Ireland in a given academic year. It forms part of a series of
now-annual research reports conducted by AHEAD on this topic which first
began in 1993. The survey findings support the work of AHEAD along with key
stakeholders by providing an accurate picture of engagement with disability
support services, and amongst other useful information, a detailed breakdown
of the population of students with disabilities, their chosen fields of study and
their engagement with different modes of study.
5AHEAD’s Strategy
AHEAD is focused on building inclusive learning environments in higher
education that embed flexibility and equality into learning and assessment
practices across the sector. AHEAD seeks to achieve its mission by pursuing
three core strategic themes (AHEAD strategic Plan 19/22):
— To influence national policy to impact positively on the inclusion of students
and learners with disabilities in all learning environments.
— To sustain the organisation of AHEAD to promote inclusion in education and
employment through the building of networks and collaboration with key
strategic partners in all learning environments.
— To promote the principles of Universal Design for Learning (UDL) by creating
an understanding of UDL in all learning environments.
— To influence national policy to impact positively on the inclusion of students
and learners with disabilities in all learning environments.
— To sustain the organisation of AHEAD to promote inclusion in education and
employment through the building of networks and collaboration with key
strategic partners in all learning environments.
— To promote the principles of for Learning (UDL) by creating an
understanding of UDL in all learning environments.
6Survey Method
The AHEAD survey on the participation rates of students with disabilities
in higher education in Ireland for the academic period 2019/20 was carried
out with the support of participating institutions of higher education and, in
particular, with the support of Disability/Access Officers therein. A survey
questionnaire was sent out to the disability/access office in each of the higher
education institutions involved.
Participating institutions were selected on the basis that they are funded by
the Higher Education Authority (HEA) and are included in the HEA’s annual
statistics on the general student population in higher education in Ireland, with
one exception–the National College of Ireland. The National College of Ireland,
although funded by the Department of Education and Skills, is included in the
AHEAD survey because it hosts a large student population and is therefore
deemed too significant to omit.
AHEAD compares the results of its annual survey on the participation rates of
student with disabilities in higher education with that of the HEA’s statistics for
the same corresponding period. 25 institutions were approached to partake in
the survey. The 23 institutions which responded are listed next:
7University College Cork (UCC) Technical University Dublin (TuD)
University College Dublin (UCD) Athlone Institute of Technology (AIT)
National University of Ireland, Galway (NUIG) Cork Institute of Technology (CIT)
Trinity College Dublin (TCD) Dundalk Institute of Technology (DKIT)
Maynooth University (MU) Institute of Technology Carlow (ITC)
Dublin City University (DCU) Institute of Technology Sligo (ITS)
University of Limerick (UL) Institute of Technology, Tralee (ITTRA)
Mary Immaculate College (MIC) Letterkenny Institute of Technology (LYIT)
Marino Institute of Education (MIE) Limerick Institute of Technology (LIT)
National College of Art and Design (NCAD) National College of Ireland (NCI)
Royal College of Surgeons Ireland (RCSI) Waterford Institute of Technology (WIT)
St. Angela’s College (St. Ang.)
Dún Laoghaire Institute of Art, Design and Technology (IADT) and Galway-Mayo
Institute of Technology (GMIT) are not included in this year’s findings as survey
questionnaires were not returned.
8Findings
Please note that when the phrase “students with disabilities” is used in this
report, it refers specifically to students with disabilities registered with disability
support/access services in higher education, which is the cohort captured
and analysed here. AHEAD acknowledges that there is a sizeable cohort of
students with disabilities studying in higher education which have not disclosed
a disability to their institution in any capacity or registered for support and it is
important to note that these students are not captured or represented in the
findings which follow.
Participation Rates of Students with Disabilities
Across the 23 responding higher education institutions, there were 15,846
students with disabilities registered with disability support services for the
academic year 2019/20, representing 6.3% of the total student population
reported in participating institutions (252,614). Relative to 2018/19, this
represents a 1% increase in the number of students with disabilities in the
responding institutions. The 2018/19 report registered 15,696 students with the
disability support services, representing 6.2% of the total student population
in participating institutions (253,178) and a 7% increase in the total student
population relative to 2017/18 (236,731).
The trend remains, that there is consistent year on year growth, in the numbers
of students with disabilities registering with supports services in higher
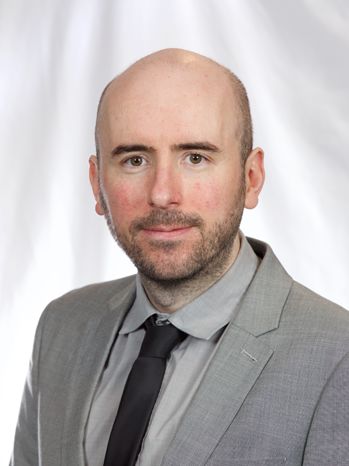
education; an increase of over 220% in the last eleven years (from 4,853, AHEAD
Survey, 2008/2009), illustrating the substantial progress made in providing
increased access for students with disabilities to higher education in this time,
as shown in Figure 1.
9Total students with disabilites Undergraduates with disabilities Postgraduates with disabilities
18000 6.2% 6.3%
6.2% 15,696 15,846
16000 14,720
5.7%
14000 12,630
5.2%
5.1% 11,244 7.2%
10,773 7.1% 14,548
12000 4.7%
4.6% 9,694 7% 14,490
13,487
4.0% 9,082
10000 7,957 6.4%
3.9%%
3.3% 6,932 11,619
8000 6,321 5.7% 5.8%
3.4% 10,213
4,853
5.2% 9,777
5.0% 8,769
6000 3.2% 5.1% 8,258
3,608
4.8% 7,247
4000 1.1% 3.7% 6,328
0.7% 1,410 5,243 2.5% 2.8% 2.4% 2.5%
990 3.8% 2.1% 2.5% 2.5% 2.5% 2.5% 2.6% 1,011 1,233 1,206 1,298
2000 3330 4,392 1.5% 604 710 824 925 996 1,031
399
1367
0
1.8%
42 278 461
1993 1998 2005 2008 2009 2010 2011 2012 2013 2014 2015 2016 2017 2018 2019
/94 /99 /06 /09 /10 /11 /12 /13 /14 /15 /16 /17 /18 /19 /20
Figure 1. Number of students with disabilities in higher education (and
percentage of total student population they represent) since 1993/94
In 2019/2020, the number of students with disabilities in the IT/Other Sector was
4,169 (5.8%), representing an overall decrease of 2,422 (36.7%) students with
disabilities from the previous year (at 6,591, 6.2%). The number of students with
disabilities in the university sector was 11,677 (6.5%), representing an overall
increase of 2,572 (28.2%) from the previous year (at 9,105, 6.2%). The significant
change in these sectoral figures year on year can be explained by the merging
of Dublin Institute of Technology, Tallaght Institute of Technology and Institute
of Technology Blanchardstown, previously listed in the IT/Other sector, to the
newly formed Technical University Dublin, now listed in the current report in the
University sector.
10At an institutional level the participation rates of students with disabilities varies
across the responding institutions, where students with disabilities represent
anywhere from 3% to 10.5% of each institution’s total student population. In
2019/20, St. Angela’s College recorded the highest representation of students
with disabilities at 10.5% of the total population, followed by The National
College of Art and Design at 10.4% and Limerick Institute of Technology at 9.9%.
There is a full breakdown of the participation rate of students with disabilities by
institution listed in Appendix 1.
1115,846
students with disabilities
registered with disability
support services for the
academic year 2019/20
across the 23 responding
higher education institutions
12Undergraduate and
Postgraduate
This section examines the participation of students with disabilities at
undergraduate and postgraduate level for 2019/20 of the 23 responding
institutions. In the last number of years of AHEAD research there has been
a steady increase in the rate of students with disabilities represented at
undergraduate level, however, there has been a persistently low representation
at a postgraduate level. The 2019/20 data shows that this trend continues.
There were 14,548 undergraduate students with disabilities registered
with disability support/access services across the responding institutions,
representing 7.2% of the student population at undergraduate level. This
reflects a 0.4% (58) increase compared with last year (14,490, 7.1%).
In 2019/20, postgraduate level continued to have a significantly lower
participation rate of students with disabilities than at undergraduate level
across the responding institutions. 1,298 postgraduate students registered with
disability support services, representing 2.5% of the total postgraduate student
population, a 7.6% population increase from last year’s report (1,206, 2.4%).
This trend is consistent with previous surveys (AHEAD 2019, 2018; 2017; 2016;
2015; 2013; 2012; 2011). The scope of this research is not designed to capture
the reasons for the persistent low representation of students with disabilities at
postgraduate level, however AHEAD acknowledges that there may be a range of
variables, both personal and systemic, which influence this finding and which
may require further research to determine why this is the case.
13Full Time and Part Time
The responding institutions provided a breakdown of the number of students
with disabilities registered with support services enrolled in full time and part
time undergraduate/postgraduate study in 2019/20. The research found that
there were 15,071 students with disabilities in full time study, representing 7.8%
of the total student population studying full time programmes. Within the same
period, there were just 775 students with disabilities registered with support
services that were enrolled in part time studies, representing 1.3% of the total
student population studying part time.
Compared with 2018/19, the 2019/20 figures represent a 1% (160) year on year
increase in the number of students with disabilities studying full time, and a 1%
(10) decrease in those studying part time. Historically, the low participation of
students with disabilities in part-time study is a persisting issue which has been
highlighted by these annual surveys over a long period of time (AHEAD, 2019;
2017; 2016; 2015; 2013; 2012, 2011).
Figure 2 illustrates the breakdown of students with disabilities (as a percentage
of the total student population) studying full and part time courses at
undergraduate and postgraduate levels as well as the overall combined totals
for 2019/20.
14Full & part time combined Full time Part time
9% 8.7%
8% 7.8%
7.2%
7%
6.3%
6%
5%
4%
3.2%
3% 2.5%
2% 1.4% 1.3%
1.3%
1%
0%
Undergraduate Postgraduate Total
Figure 2. Percentage of students with disabilities in full time and part time
education as a percentage of the overall student population 2019/20
New Entrant Undergraduates with Disabilities
The responding institutions reported a total number of 4,076 new entrants (i.e.
students entering their first year of studies in third level) with disabilities in
2019/20, representing 7.5% of the total reported new entrant student population
(54,119). The year-on-year number of new entrant students with disabilities has
increased by 3% (116), up from 3,960 in 2018/19 (AHEAD 2019).
15New Entrant Disclosure – HEA Data Comparison
According to data provided to AHEAD by the Higher Education Authority (HEA)
on the student population in higher education in Ireland for the academic year
2019/2020, the proportion of first year, full time, new entrants with a disability
stands at 12.3%. That is nationally, 12.3% of all first year, full time, new entrant
undergraduates disclose a disability through the Equal Access Survey. An
interesting comparison can be made with AHEAD Survey findings for the same
academic period (2019/2020) to highlight the sizable cohort of non-disclosed
students with disabilities in higher education in Ireland. It should be noted
when interpreting this comparison that the underlying datasets are not the
same and some discrepancies exist between them.
As referenced above, the responding institutions in the AHEAD Survey reported
that 7.5% of all new entrants in participating institutions in this survey period
disclosed a disability and registered for support.
Despite the differences in the underlying datasets, the significant variation
between the HEA figure of 12.3% (first year, full time new entrant undergraduate
students who report a disability in the Equal Access Survey) and the AHEAD
figure of 7.5% (first year new entrants registered for disability support in
participating institutions), suggests that there is a sizeable cohort of new
entrant undergraduate students with a disability who did not disclose and
register for support in the academic year 2019/2020.
AHEAD recognises that disclosure of disability is a complex issue and there are
likely myriad reasons for non-disclosure which require further investigation,
such as no requirements for support, a desire for independence, or reasons
related to the perceived stigma which may be felt by some individuals engaging
with support services.
16New Registrations
New Registrations are students who register with disability services for the first
time in their higher education institution during the academic year, including
students who are not in their first year of study. This data allows AHEAD to
deduce if there are students with disabilities who have gone through at least one
or more years of study without receiving designated disability support.
In 2019/20, there were 5,113 new registrations across the disability services
in the 23 responding institutions. Of the new registrations, 1,037 were not in
their first year of study, making up 20% of all new registrations to the disability
services for the academic year 2019/20 and representing 6.5% of the total
population of students with disabilities.
Mature Students
In 2019/20, there were 1,547 mature students with disabilities identified across
the 23 responding institutions, representing 9.8% of the total population of
students with disabilities. This represents a 19.4% (372) decrease in the number
of mature students with disabilities in comparison to 2018/19 (at 1,919, 12%).
International Students
In 2019/20, there were 704 international students with disabilities recorded
across the 23 responding institutions, which represents 4.4% of the total
population of students with disabilities. This is a 19% (112) increase in the
number of international students registered with disabilities, in comparison to
the 2018/19 survey (at 592, 3.8%).
17Nature of Disability
The categories of disability which are utilised as part of this study are based
on the categories of disability applied by the Higher Education Authority in the
Fund for Students with Disabilities guidelines for higher education institutions,
with an addition of the Other category which is added to cater for any additional
registrations with the disability service that do not fall under the HEA specified
categories (for example those with intellectual disabilities). Students are
categorised by their primary disability only, regardless of whether more than
one disability is present.
2.4% 1.6% 0.7%
4.7%
Specific Learning Difficulty
5.0%
Mental Health Condition
36.9%
6.3% Significant Ongoing Illness
Asperger’s/Autism
DCD - Dyspraxia
6.3%
Physical Disability
ADD/ADHD
Neurological/Speech and Language
7.6% Deaf/Hard of Hearing
Blind/Visually Impaired
Other
11.8%
16.7%
Figure 3. Breakdown of students registered with disability support/access
services by category of disability 2019/20
18Figure 3 illustrates the breakdown of 15,846 students with disabilities by
category of primary disability in the responding institutions in 2019/20. The
largest category of disability was Specific Learning Difficulty representing
36.9% (5,848) of all students with disabilities enrolled within that academic
year; the second largest was Mental Health Condition at 16.7% (2,639); followed
by Significant On-going Illness at 11.8% (1,867). 7.6% (1,206) of students with
disabilities were registered in the Asperger’s/Autism category, 6.3% (999) in
the DCD- Dyspraxia/Dysgraphia category, 6.3% (994) in the Physical Disability,
5% (797) in the ADD/ADHD category, 4.7% (743) in the Neurological/Speech &
Language category, 2.4% (379) in the Deaf/Hard of Hearing category, 1.6% (261)
in the Blind and Visually Impaired category, and 0.7% (113) in the Other category.
There was some significant year on year changes in the overall percentage
breakdown of students with disabilities across the categories of disability and
the actual numbers in those categories. In particular, the number of students
with disabilities registered under the Asperger’s/Autism category rose by 14.3%
from 1,055 in 2018/19 to 1206 in 2019/20, and in the Mental Health category
the number of students with disabilities rose by 8.1% from 2,441 (16.1%) in
2018/19 to 2,639 (16.7%) in 2019/20. There was a 5.8% increase in the Significant
Ongoing Illness category from 1764 (11.6%) in 2018/19 to 1867 (11.8%) and a
5.4% increase in the ADD/ADHD category from 756 (5%) in 2018/19 to 797 (5.1%)
in 2019/20. The other categories experienced changes in the order of less than
5%, as shown in Figure 4. It should be noted in interpreting this data that the list
of institutions who reported data on this question year on year are not identical,
but the general trend of reduced numbers in the sensory disability categories in
comparison to others should be noted nonetheless.
19Percentage difference between 2018/19
and 2019/20 populations
As
pe
-5.0%
0.0%
5.0%
10.0%
15.0%
rg
er
s/A
uti
sm
14.3%
AD
Bl D/
disability category
ind AD
/V HD
isu
all
5.4%
yI
-4.4%
mp
De air
af/ ed
Ha
DC rd
D- of
Dy he
sp ar
ra ing
xia
/D
Me ys
gr
Ne nta ap
ur lH hia
olo ea
-4.3%
gic
al/
lth
Co 1.5%
Sp nd
ee itio
ch n
an
8.1%
Sig dL
nifi an
ca gu
nt ag
On e
go
2.1%
ing
Illn
% increase since last year
Ph es
ys s
ica
5.8%
Sp lD
ec isa
ific bil
Le ity
ar
nin
4.3%
gD
iffi
cu
lty
2.3%
Ot
he
r
0.9%
To
tal
4.4%
% decrease since last year
Figure 4 - Percentage difference between 2018/19 and 2019/20 populations by
20New Entrant Disability Breakdown
The responding institutions provided the breakdown by disability of 4,076 new
entrants with disabilities. Broken down by category, 362 (8.9%) were in the
Asperger’s/Autism category, 236 (5.8%) in the ADD/ADHD category, 61 (1.5%)
in the Blind/Visually Impaired category, 93 (2.3% ) in the Deaf/Hard of Hearing
category, 291 (7.1%) in the DCD Dyspraxia-Dysgraphia category, 655 (16.1% ) in
the Mental Health Condition category, 202 (5%) in the Neurological/Speech &
Language category, 453 (11.1%) in the Significant On-going Illness category, 264
(6.5%) in the Physical category, 1,427 (35%) in the Specific Learning Difficulty
and 32 (0.8%) in the Other category.
2.3% 1.5% 0.8%
5.0%
Specific Learning Disability
5.8%
Mental Health Condition
35.0%
6.5% Significant ongoing illness
Asperger’s/Autism
DCD - Dyspraxia/Dysgraphia
7.1% Physical disability
ADD/ADHD
Neurological/Speech and Language
8.9% Deaf/hard of hearing
Blind/visually impaired
Other
11.1% 16.1%
Figure 5. Breakdown of new entrant students by category of disability in
2019/20
21Undergraduate Disability Breakdown
The responding institutions recorded 14,548 undergraduate students with
disabilities in 2019/20. Of those, 5,364 (36.9%) were registered with Specific
Learning Difficulties, the largest cohort of students with disabilities enrolled in
undergraduate programmes that year. The next largest group of undergraduate
students had a Mental Health Condition at 2,424 (16.7%), followed by Significant
On-going Illness at 1,705 (11.7%), Asperger’s/Autism at 1,137 (7.8%), DCD/
Dyspraxia at 944 (6.5%), Physical Disability at 881 (6.1%), ADD/ADHD at 740
(5.1%), Neurological/Speech and Language Difficulties at 666 (4.6%), Deaf/Hard
of Hearing at 351 (2.4%), Blind/Visually Impaired at 227 (1.6%), and the Other
category at 109 (0.7%).
Overall, seven out of the eleven categories showed an increase in undergraduate
student numbers from last year, while the other four showed a decrease. The
three most significant year to year increases in student numbers were: a 13.1%
rise in the Asperger’s/Autism category (to 1,137 from 1,005 in 2018/19), a 7.2%
rise in the Mental Health Condition category (to 2,424 from 2,262 in 2018/19),
and a 6.9% rise in the Physical Disability category (to 881 from 824 in 2018/19).
The Significant on-going Illness and ADD/ADHD categories showed increases of
6.2% and 4.4% respectively. The remaining four categories showed decreases of
5% or less (ranging from 0.2% to 5%), in comparison with last year. It should be
noted in interpreting this data that the list of institutions who reported data on
this question year on year are not identical but the general trends are notable.
22Postgraduate Disability Breakdown
The responding institutions reported a total of 1,298 students with disabilities
registered with disability support/access services that were studying at
postgraduate level in 2019/20, a 7.9% increase from the previous year (from
1,203 in 2018/19). Students in the Specific Learning Difficulty Category
represented the largest cohort of students with disabilities studying at
postgraduate level at 37.3% (484), followed by Mental Health Condition at
16.6% (215) and Significant On-going Illness Category at 12.5% (162). This is
reflective of the same three largest categories at undergraduate level. The next
largest categories were Physical Disability at 8.7% (113), Neurological/Speech
Language at 5.9% (77), Asperger’s/Autism at 5.3% (69), ADD/ADHD at 4.4%
(57), Blind/Visually Impaired at 2.6% (34), Deaf/Hard of Hearing at 2.2% (28)
and DCD-Dyspraxia at 4.2% (55). The category with the lowest percentage at
postgraduate level in 2019/20 was the Other category at 0.3% (4).
There were some significant changes noted year on year in the number of
post graduate students with disabilities by category, a 44.7% rise in the DCD-
Dyspraxia category (to 55 from 38 in 2018/19), a 38% rise in the Asperger’s/
Autism category (to 69 from 50 in 2018/19), a 21.2% rise in the ADD/ADHD
category (to 57 from 47 in 2018/19), a 19.4% rise in the Mental Health Condition
category (to 215 from 180 in 2018/19), and an 18.4% rise in the Neurological/
Speech Language category (to 77 from 65 in 2018/19). The Specific Learning
Difficulty category saw a 4% increase (to 484 from 465 in 2018/19). Only two
categories showed decreases: a 12.4% drop in the Physical Disability category
(to 113 from 129 in 2018/19) and a 9.7% drop in the Deaf/Hard of Hearing
category (to 28 from 31 in 2018/19). Two categories showed no change from
last year: Blind/Visually Impaired category (to 34 from 34 in 2018/19) and the
Significant On-going Illness category (to 162 from 162 in 2018/19). It should
be noted in interpreting this year-on-year data that the list of institutions who
reported data on this question year on year are not identical, but the general
trends are noteworthy.
23Other 0.7
0.3
Undergraduate
Blind/visually impaired 1.6 Postgraduate
2.6
Deaf/hard of hearing
2.4
2.2
ADD/ADHD 5.1
4.4
Neurological 4.6
/Speech and Language 5.9
DCD - Dyspraxia/Dysgraphia 6.5
4.2
Aspergers/Autism 7.8
5.3
Physical disability 6.1
8.7
Significant ongoing illness 11.7
12.5
Mental Health Condition 16.7
16.6
Specific Learning Disability 36.9
37.3
0% 5% 10% 15% 20% 25% 30% 35% 40%
Figure 6. Disability Profile of Undergraduate and Postgraduate students with
disabilities in 2019/2020 stats
24Fields of Study
The following section breaks down the fields of study of the 15,846 students
with disabilities identified in the responding institutions. Each institution was
given the subject breakdown in line with the ISCED (International Standard
Classification of Education) classifications of subjects. Figure 7 illustrates
the comparison of the students with disabilities fields of study in comparison
to the general student population across each field of study in 2019/20. The
statistics on the breakdown of fields of study of the total student population for
comparison were provided by the Higher Education Authority.
Generic programmes and qualifications
1.1%
0.5%
Students with Disabilities
Agriculture, forestry, 1.6% Total Student Population
fisheries and veterinary 2.5%
4.0%
Services
3.0%
Information and Communication 6.2%
Technologies (ICTs) 6.8%
Education 7.0%
5.4%
Social sciences, journalism 5.8%
and information 8.7%
Natural sciences, mathematics 9.9%
and statistics 10.8%
Engineering, manufacturing 11.3%
and construction 10.5%
Health and welfare
17.1%
14.9%
Arts and humanities
14.5%
21.1%
Business, administration and Law
21.5%
15.8%
0% 5% 10% 15% 20% 25%
Figure 7. Breakdown of fields of study of students with disabilities compared
to the total student population
2570 %
of colleges responded
“yes” to whether they
believed that students with
disabilities were adversely
impacted by working
remotely
26The field of “Arts and humanities” had the highest percentage of students with
disabilities once again in 2019/20 with 21.1% (3,339) of students with disabilities
studying in this field. This was followed by “Business, administration and law”
with 15.8% (2,511), “Health and welfare” with 14.9% (2,362), “Natural sciences,
mathematics and statistics” with 10.8% (1,707), “Engineering manufacturing
and construction” with 10.5% (1,664), “Social sciences, journalism and
information” with 8.7% (1,382), “Informatics and communication technologies”
with 6.8% (1,077), and “Education” with 5.4% (862). The least common fields of
study for students with disabilities were “Services” with 3.0% (469), “Agriculture,
forestry, fisheries and veterinary” with 2.5% (397), and “Generic” with 0.5% (76).
The largest differences between the percentage-representation of the overall
student population studying a field, compared to the percentage-representation
of students with disabilities, were in the fields of “Arts and Humanities” and
“Business, administration and law”. 21.1% of students with disabilities studied in
the field of “Arts and humanities” in comparison to 14.5% of the general student
population.
Conversely, 15.8% of students with disabilities studied in the field of “Business,
administration and law” in comparison to 21.5% of the general student
population.
14.9% of students with disabilities studied in the field of “Health and Welfare” in
comparison to 17.1% of the general student population. 5.4% of students with
disabilities studied in the field of “Education” in comparison to 7% of the general
student population.
The trend of students with disabilities having a higher average representation
in the field of ‘Humanities and Arts’ and a lower representation in the field of
“Health and Welfare” and “Education” remains consistent over many years of
AHEAD’s survey findings (AHEAD, 2020, 2019; 2018; 2017; 2016).
27Fields of Study Breakdown by Disability
The 23 responding institutions provided information on the participation of
15,846 students with disabilities, by category of disability and field of study in
2019/20.
The following sub sections examine the fields of study of students in each
category of disability, with accompanying tables and two to four findings on the
representation of each category of disability in comparison to other students
with disabilities and to the general student population in 2019/20. Because
of the diverse nature of the conditions in the “Other” category, no analysis is
provided here.
The fields of study included in this section are based on the ISCED
Classifications. http://uis.unesco.org/sites/default/files/documents/
international-standard-classification-of-education-fields-of-education-and-
training-2013-detailed-field-descriptions-2015-en.pdf
28ADD/ADHD
Table 1 - Breakdown by field of study for students in the ADD/ADHD Category
compared to the breakdown by field of study for all SWDs and for the student
population in general.
Numbers in % of Students % of SWDs
5.0% of all SWDs % of Total
% of Total SWD ADD/ADHD in ADD/ADHD Studying Field
are in ADD/ADHD Students
Studying Field Category Category in ADD/ADHD
Category Studying Field
Studying Field Studying Field Category
Generic programmes
1.1% 0.5% 8 1.0% 10.5%
and qualifications
Education 7.0% 5.4% 15 1.9% 1.7%
Arts and humanities 14.5% 21.1% 192 24.1% 5.8%
Social sciences,
journalism and 5.8% 8.7% 82 10.3% 5.9%
information
Business,
administration and 21.5% 15.8% 138 17.3% 5.5%
law
Natural sciences,
mathematics and 9.9% 10.8% 82 10.3% 4.8%
statistics
Information and
Communication 6.2% 6.8% 57 7.2% 5.3%
Technologies (ICTs)
Engineering,
manufacturing and 11.3% 10.5% 94 11.8% 5.6%
construction
Agriculture, forestry,
fisheries and 1.6% 2.5% 16 2.0% 4.0%
veterinary
Health and welfare 17.1% 14.9% 96 12.0% 4.1%
Services 4.0% 3.0% 17 2.1% 3.6%
Total 797
29— Students in the ADD/ADHD Category were more than three times less likely
to study in the field of “Education” when compared to the general student
population, and more than two times less likely when compared to other
students with disabilities.
— Students in the ADD/ADHD Category were significantly more likely to
study both the “Arts and humanities” and “Social sciences, journalism and
information” fields when compared to the general student population.
30Asperger’s/Autism
Table 2 - Breakdown by field of study for students in the Asperger’s/Autism Category
compared to the breakdown by field of study for all SWDs and for the student
population in general.
Numbers in % of Students % of SWDs
7.6% of all SWDs are % of Total Aspergers/ in Aspergers/ Studying Field
% of Total SWD
in Aspergers/Autism Students Autism Autism in Aspergers/
Studying Field
Category Studying Field Category Category Autism
Studying Field Studying Field Category
Generic programmes
1.1% 0.5% 5 0.4% 6.6%
and qualifications
Education 7.0% 5.4% 19 1.6% 2.2%
Arts and humanities 14.5% 21.1% 369 30.6% 11.1%
Social sciences,
journalism and 5.8% 8.7% 68 5.6% 4.9%
information
Business,
administration and 21.5% 15.8% 145 12.0% 5.8%
law
Natural sciences,
mathematics and 9.9% 10.8% 186 15.4% 10.9%
statistics
Information and
Communication 6.2% 6.8% 234 19.4% 21.7%
Technologies (ICTs)
Engineering,
manufacturing and 11.3% 10.5% 105 8.7% 6.3%
construction
Agriculture, forestry,
fisheries and 1.6% 2.5% 13 1.1% 3.3%
veterinary
Health and welfare 17.1% 14.9% 41 3.4% 1.7%
Services 4.0% 3.0% 21 1.7% 4.5%
Total 1206
31— Students in the Asperger’s/Autism Category were more than four times
less likely to study in the field of “Education” when compared to the general
student population, and more than three times less likely than other students
with disabilities.
— Students in the Asperger’s/Autism Category were almost three times as
likely to study in the field of “Information and communication technologies”
when compared with the general student population and other students with
disabilities.
— Students in the Asperger’s/Autism Category were two times more likely to
study in the field of “Arts and humanities” when compared to the general
student population and almost half more likely than other students with
disabilities.
— Students in the Asperger’s/Autism Category were almost half as likely to
study in the field of “Business, administration and law” when compared to
the general student population.
— Students in the Asperger’s/Autism Category were significantly less likely to
study in the fields of “Agriculture, forestry, fisheries and veterinary”, “Health
and welfare” and “Services” than both the general student population and
other students with disabilities.
32Blind/Visually Impaired
Table 3 - Breakdown by field of study for students in the Blind/Visually Impaired
Category compared to the breakdown by field of study for all SWDs and for the
student population in general.
% of Students % of SWDs
Numbers in in Blind/ Studying
1.6% of all SWDs % of Total
% of Total SWD Blind/Visually Visually Field in Blind/
are in Blind/Visually Students
Studying Field Impaired Impaired Visually
Impaired Category Studying Field
Studying Field Category Impaired
Studying Field Category
Generic programmes
1.1% 0.5% 3 1.1% 3.9%
and qualifications
Education 7.0% 5.4% 13 5.0% 1.5%
Arts and humanities 14.5% 21.1% 67 25.7% 2.0%
Social sciences,
journalism and 5.8% 8.7% 29 11.1% 2.1%
information
Business,
administration and 21.5% 15.8% 47 18.0% 1.9%
law
Natural sciences,
mathematics and 9.9% 10.8% 19 7.3% 1.1%
statistics
Information and
Communication 6.2% 6.8% 22 8.4% 2.0%
Technologies (ICTs)
Engineering,
manufacturing and 11.3%r 10.5%r 14 5.4% 0.8%
construction
Agriculture, forestry,
fisheries and 1.6% 2.5%r 2 0.8% 0.5%
veterinary
Health and welfare 17.1% 14.9% 37 14.2% 1.6%
Services 4.0% 3.0% 8 3.1% 1.7%
Total 261
33— Students in the Visually Impaired Category were significantly more likely
to study in the field of “Arts and humanities” than the general student
population.
— Students in the Visually Impaired Category were almost twice as likely to
study in the field of “Social sciences, journalism and information” than those
in the general student population.
— Students in the Visually Impaired Category were approximately half as
likely to study in the field of “Engineering, manufacturing and construction”
when compared to the general student population and other students with
disabilities.
34Deaf/Hard of Hearing
Table 4 - Breakdown by field of study for students in the Deaf/Hearing Impaired
Category compared to the breakdown by field of study for all SWDs and for the
student population in general.
% of Students % of SWDs
Numbers in
in Deaf/ Studying
2.4% of all SWDs % of Total Deaf/Hearing
% of Total SWD Hearing Field in Deaf/
are in Deaf/Hearing Students Impaired
Studying Field Impaired Hearing
Impaired Category Studying Field Category
Category Impaired
Studying Field
Studying Field Category
Generic programmes
1.1% 0.5% 3 0.8% 3.9%
and qualifications
Education 7.0% 5.4% 29 7.7% 3.4%
Arts and humanities 14.5% 21.1% 83 21.9% 2.5%
Social sciences,
journalism and 5.8% 8.7% 24 6.3% 1.7%
information
Business,
administration and 21.5% 15.8% 62 16.4% 2.5%
law
Natural sciences,
mathematics and 9.9% 10.8% 34 9.0% 2.0%
statistics
Information and
Communication 6.2% 6.8% 21 5.5% 1.9%
Technologies (ICTs)
Engineering,
manufacturing and 11.3% 10.5% 34 9.0% 2.0%
construction
Agriculture, forestry,
fisheries and 1.6% 2.5% 12 3.2% 3.0%
veterinary
Health and welfare 17.1% 14.9% 71 18.7% 3.0%
Services 4.0% 3.0% 6 1.6% 1.3%
Total 379
35— Students in the Deaf/Hard of Hearing Category were significantly more likely
to study in the field of “Arts and humanities” when compared to the general
student population.
— Students in the Deaf/Hard of Hearing Category were almost twice as likely
to study in the field of “Agriculture, forestry, fisheries and veterinary” than
the general student population.
— Students in the Deaf/Hard of Hearing Category were half as likely to study in
the field of “Services” when compared to the general student population and
other students with disabilities.
36DCD-Dyspraxia
Table 5 - Breakdown by field of study for students in the DCD-Dyspraxia
Category compared to the breakdown by field of study for all SWDs and for the
student population in general.
% of Students % of SWDs
Numbers
6.3% of all SWDs are % of Total in DCD - Studying
% of Total SWD in DCD -
in DCD - Dyspraxia Students Dyspraxia Field in DCD
Studying Field Dyspraxia
Category Studying Field Category - Dyspraxia
Studying Field
Studying Field Category
Generic programmes
1.1% 0.5% 0 0.0% 0.0%
and qualifications
Education 7.0% 5.4% 44 4.4% 5.1%
Arts and humanities 14.5% 21.1% 224 22.4% 6.7%
Social sciences,
journalism and 5.8% 8.7% 86 8.6% 6.2%
information
Business,
administration and 21.5% 15.8% 183 18.3% 7.3%
law
Natural sciences,
mathematics and 9.9% 10.8% 102 10.2% 6.0%
statistics
Information and
Communication 6.2% 6.8% 98 9.8% 9.1%
Technologies (ICTs)
Engineering,
manufacturing and 11.3% 10.5% 112 11.2% 6.7%
construction
Agriculture, forestry,
fisheries and 1.6% 2.5% 22 2.2% 5.5%
veterinary
Health and welfare 17.1% 14.9% 81 8.1% 3.4%
Services 4.0% 3.0% 47 4.7% 10.0%
Total 999
37— Students in the DCD-Dyspraxia Category were significantly less likely to
study in the fields of “Education” and “Business, administration and law”
than the general student population.
— Students in the DCD-Dyspraxia Category were significantly more likely to
study in the field of “Information and communication technologies” than the
general student population and other students with disabilities.
— Students in the DCD-Dyspraxia Category were more than half as likely to
study in the field of “Health and welfare” compared to the general student
population, and almost half as likely than other students with disabilities.
38Mental Health Condition
Table 6 - Breakdown by field of study for students in the Mental Health Condition
Category compared to the breakdown by field of study for all SWDs and for the
student population in general.
% of Students % of SWDs
Numbers in
in Mental Studying
16.7% of all SWDs % of Total Mental Health
% of Total SWD Health Field in
are in Mental Health Students Condition
Studying Field Condition Mental Health
Condition Category Studying Field Category
Category Condition
Studying Field
Studying Field Category
Generic programmes
1.1% 0.5% 19 0.7% 25.0%
and qualifications
Education 7.0% 5.4% 118 4.5% 13.7%
Arts and humanities 14.5% 21.1% 753 28.5% 22.6%
Social sciences,
journalism and 5.8% 8.7% 273 10.3% 19.8%
information
Business,
administration and 21.5% 15.8% 372 14.1% 14.8%
law
Natural sciences,
mathematics and 9.9% 10.8% 355 13.5% 20.8%
statistics
Information and
Communication 6.2% 6.8% 109 4.1% 10.1%
Technologies (ICTs)
Engineering,
manufacturing and 11.3% 10.5% 118 4.5% 7.1%
construction
Agriculture, forestry,
fisheries and 1.6% 2.5% 52 2.0% 13.1%
veterinary
Health and welfare 17.1% 14.9% 435 16.5% 18.4%
Services 4.0% 3.0% 35 1.3% 7.5%
Total 2639
39— Students in the Mental Health Condition Category were less than half as
likely to study in the field of “Engineering, manufacturing and construction”
when compared to the general student population and other students with
disabilities.
— Students in the Mental Health Condition Category were almost twice as
likely to study in the fields of “Arts and humanities” when compared to the
general student population.
— Students in the Mental Health Condition Category were significantly less
likely to study in the field of “Business, administration and law” than the
general student population and significantly more likely to study in the field
of “Social sciences, journalism and information”.
— Students in the Mental Health Condition Category were very significantly
less likely to study in the field of “Services” when compared to the general
population, and other students with disabilities.
40Neurological/Speech and Language
Table 7 - Breakdown by field of study for students in the Neurological/Speech and
Language Category compared to the breakdown by field of study for all SWDs and for
the student population in general.
% of % of SWDs
Numbers in Students in Studying
4.7% of all SWDs
% of Total Neurological/ Neurological/ Field in
are in Neurological/ % of Total SWD
Students Speech and Speech and Neurological/
Speech and Language Studying Field
Studying Field Language Language Speech and
Category
Studying Field Category Language
Studying Field Category
Generic programmes
1.1% 0.5% 2 0.3% 2.6%
and qualifications
Education 7.0% 5.4% 50 6.7% 5.8%
Arts and humanities 14.5% 21.1% 158 21.3% 4.7%
Social sciences,
journalism and 5.8% 8.7% 65 8.7% 4.7%
information
Business,
administration and 21.5% 15.8% 142 19.1% 5.7%
law
Natural sciences,
mathematics and 9.9% 10.8% 74 10.0% 4.3%
statistics
Information and
Communication 6.2% 6.8% 35 4.7% 3.2%
Technologies (ICTs)
Engineering,
manufacturing and 11.3% 10.5% 62 8.3% 3.7%
construction
Agriculture, forestry,
fisheries and 1.6% 2.5% 20 2.7% 5.0%
veterinary
Health and welfare 17.1% 14.9% 113 15.2% 4.8%
Services 4.0% 3.0% 22 3.0% 4.7%
Total 743
41— Students in the Neurological/Speech and Language Category were
significantly more likely to study in the fields of “Arts and humanities” and
“Social sciences, journalism and information” than the general student
population.
— Students in the Neurological/Speech and Language Category were very
significantly more likely to study in the field of “Agriculture, forestry,
fisheries and veterinary” when compared to the general student population.
42Significant On-going Illness
Table 8 - Breakdown by field of study for students in the Significant On-going Illness
Category compared to the breakdown by field of study for all SWDs and for the
student population in general.
Numbers in % of Students % of SWDs
11.8% of all SWDs are % of Total Significant in Significant Studying Field
% of Total SWD
in Significant Ongoing Students Ongoing Illness Ongoing Illness in Significant
Studying Field
Illness Category Studying Field Category Category Ongoing Illness
Studying Field Studying Field Category
Generic programmes
1.1% 0.5% 11 0.6% 14.5%
and qualifications
Education 7.0% 5.4% 144 7.7% 16.7%
Arts and humanities 14.5% 21.1% 347 18.6% 10.4%
Social sciences,
journalism and 5.8% 8.7% 172 9.2% 12.4%
information
Business,
administration and 21.5% 15.8% 304 16.3% 12.1%
law
Natural sciences,
mathematics and 9.9% 10.8% 230 12.3% 13.5%
statistics
Information and
Communication 6.2% 6.8% 94 5.0% 8.7%
Technologies (ICTs)
Engineering,
manufacturing and 11.3%rs 10.5% 132 7.1% 7.9%
construction
Agriculture, forestry,
fisheries and 1.6% 2.5% 34 1.8% 8.6%
veterinary
Health and welfare 17.1% 14.9% 357 19.1% 15.1%
Services 4.0% 3.0% 42 2.2% 9.0%
Total 1867
43— Students in the Significant On-going Illness Category were significantly
more likely to study in the field of “Social sciences, journalism and
information” than the general student population.
— Students in the Significant On-going Illness Category were significantly
less likely to study in the fields of “Business, administration and law” and
“Engineering, manufacturing and construction” than the general student
population.
— Students in the Significant On-going Illness Category almost half as likely
to study in the field of “Services” when compared to the general student
population, and significantly less likely than other students with disabilities.
44Physical Disability
Table 9 - Breakdown by field of study for students in the Physical Disability Category
compared to the breakdown by field of study for all SWDs and for the student
population in general.
% of Students % of SWDs
Numbers
6.3% of all SWDs are % of Total in Physical Studying Field
% of Total SWD in Physical
in Physical Disability Students Disability in Physical
Studying Field Disability
Category Studying Field Category Disability
Studying Field
Studying Field Category
Generic programmes
1.1% 0.5% 2 0.2% 2.6%
and qualifications
Education 7.0% 5.4% 62 6.2% 7.2%
Arts and humanities 14.5% 21.1% 222 22.3% 6.6%
Social sciences,
journalism and 5.8% 8.7% 99 10.0% 7.2%
information
Business,
administration and 21.5% 15.8% 181 18.2% 7.2%
law
Natural sciences,
mathematics and 9.9% 10.8% 109 11.0% 6.4%
statistics
Information and
Communication 6.2% 6.8% 61 6.1% 5.7%
Technologies (ICTs)
Engineering,
manufacturing and 11.3% 10.5% 52 5.2% 3.1%
construction
Agriculture, forestry,
fisheries and 1.6% 2.5% 26 2.6% 6.5%
veterinary
Health and welfare 17.1% 14.9% 157 15.8% 6.6%
Services 4.0% 3.0% 23 2.3% 4.9%
Total 994
45— Students in the Physical Disability Category were significantly more likely to
study in the fields of “Arts and humanities”, “Social sciences, journalism and
information” and “Agriculture, forestry, fisheries and veterinary”, than the
general student population.
— Students in the Physical Disability Category were approximately half as
likely to study in the fields of “Engineering, manufacturing and construction”
when compared to the general student population and other students with
disabilities.
— Students in the Physical Disability Category were significantly more likely to
study in the field of ‘Services’ compared to the general student population
and to other students with disabilities.
46Specific Learning Difficulty
Table 10 - Breakdown by field of study for students in the Specific Learning Difficulty
Category compared to the breakdown by field of study for all SWDs and for the
student population in general.
Numbers % of Students % of SWDs
in Specific in Specific Studying Field
36.9% of all SWDs are % of Total
% of Total SWD Learning Learning in Specific
in Specific Learning Students
Studying Field Difficulty Difficulty Learning
Difficulty Category Studying Field
Category Category Difficulty
Studying Field Studying Field Category
Generic programmes
1.1% 0.5% 23 0.4% 30.3%
and qualifications
Education 7.0% 5.4% 362 6.2% 42.0%
Arts and humanities 14.5% 21.1% 899 15.4% 26.9%
Social sciences,
journalism and 5.8% 8.7% 468 8.0% 33.9%
information
Business,
administration and 21.5% 15.8% 923 15.8% 36.8%
law
Natural sciences,
mathematics and 9.9% 10.8% 506 8.7% 29.6%
statistics
Information and
Communication 6.2% 6.8% 340 5.8% 31.6%
Technologies (ICTs)
Engineering,
manufacturing and 11.3% 10.5% 933 16.0% 56.1%
construction
Agriculture, forestry,
fisheries and 1.6% 2.5% 194 3.3% 48.9%
veterinary
Health and welfare 17.1% 14.9% 955 16.3% 40.4%
Services 4.0% 3.0% 245 4.2% 52.2%
Total 5848
47You can also read