Plasmodium falciparum transcription in different clinical presentations of malaria associates with circulation time of infected erythrocytes ...
←
→
Page content transcription
If your browser does not render page correctly, please read the page content below
ARTICLE
                  https://doi.org/10.1038/s41467-021-25062-z                 OPEN

                  Plasmodium falciparum transcription in different
                  clinical presentations of malaria associates with
                  circulation time of infected erythrocytes
                  Richard Thomson-Luque1, Lasse Votborg-Novél 1,2, Wanangwa Ndovie3, Carolina M. Andrade1,
                  Moussa Niangaly2,4, Charalampos Attipa3,5, Nathalia F. Lima1, Drissa Coulibaly4, Didier Doumtabe4,
                  Bouréima Guindo4, Bourama Tangara4, Fayçal Maiga4, Abdoulaye Kassoum Kone4, Karim Traore4,
1234567890():,;

                  Kassoum Kayentao4, Aissata Ongoiba4, Safiatou Doumbo4, Mahamadou A. Thera 4, Boubacar Traoré4,
                  Karl Seydel6,7, Nuno S. Osório 8,9 & Silvia Portugal 1,2 ✉

                  Following Plasmodium falciparum infection, individuals can remain asymptomatic, present with
                  mild fever in uncomplicated malaria cases, or show one or more severe malaria symptoms.
                  Several studies have investigated associations between parasite transcription and clinical
                  severity, but no broad conclusions have yet been drawn. Here, we apply a series of bioin-
                  formatic approaches based on P. falciparum’s tightly regulated transcriptional pattern during
                  its ~48-hour intraerythrocytic developmental cycle (IDC) to publicly available transcriptomes
                  of parasites obtained from malaria cases of differing clinical severity across multiple studies.
                  Our analysis shows that within each IDC, the circulation time of infected erythrocytes without
                  sequestering to endothelial cells decreases with increasing parasitaemia or disease severity.
                  Accordingly, we find that the size of circulating infected erythrocytes is inversely related to
                  parasite density and disease severity. We propose that enhanced adhesiveness of infected
                  erythrocytes leads to a rapid increase in parasite burden, promoting higher parasitaemia and
                  increased disease severity.

                  1 Centre of Infectious Diseases, Parasitology, Heidelberg University Hospital, Heidelberg, Germany. 2 Max Planck Institute for Infection Biology,

                  Berlin, Germany. 3 Malawi-Liverpool-Wellcome Trust Clinical Research Programme, Blantyre, Malawi. 4 Mali International Center of Excellence in Research,
                  Malaria Research and Training Centre (MRTC), University of Sciences Techniques and Technologies of Bamako, Bamako, Mali. 5 Department of Tropical
                  Disease Biology, Liverpool School of Tropical Medicine, Liverpool, UK. 6 Blantyre Malaria Project, University of Malawi College of Medicine, Blantyre, Malawi.
                  7 College of Osteopathic Medicine, Michigan State University, East Lansing, MI, USA. 8 Life and Health Sciences Research Institute (ICVS), School of

                  Medicine, University of Minho, Braga, Portugal. 9 ICVS/3B’s – PT Government Associate Laboratory, Braga, Portugal. ✉email: portugal@mpiib-berlin.mpg.de

                  NATURE COMMUNICATIONS | (2021)12:4711 | https://doi.org/10.1038/s41467-021-25062-z | www.nature.com/naturecommunications                                    1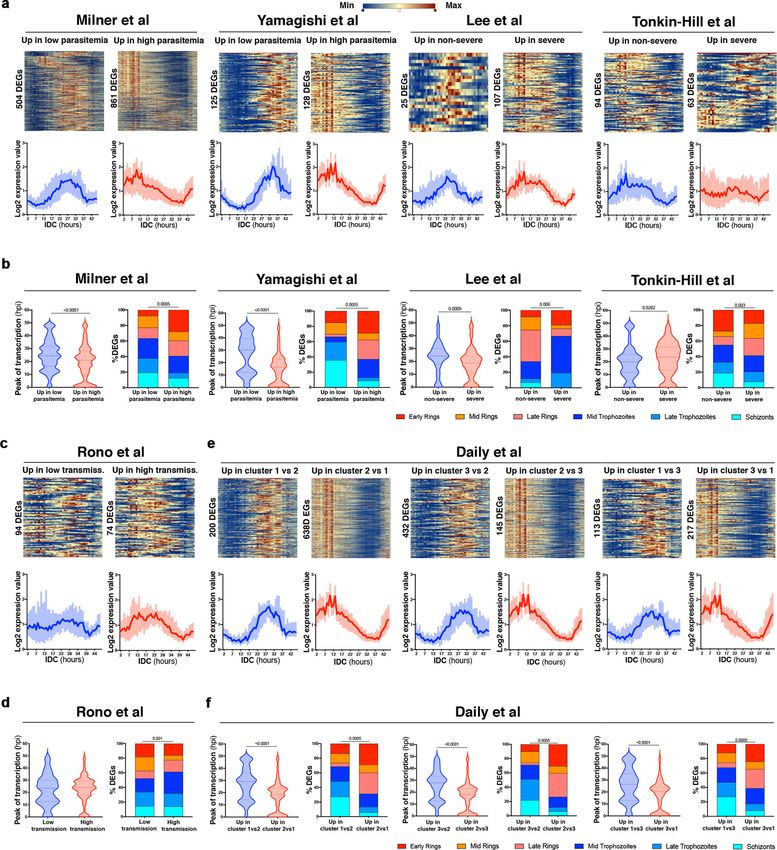
ARTICLE                                                                 NATURE COMMUNICATIONS | https://doi.org/10.1038/s41467-021-25062-z

W
            orldwide over 200 million malaria cases occur yearly,            comprise transcripts peaking at later stages of the IDC, whereas
            out of which ~2 million progress to severe disease,              genes that are differentially upregulated in less-developed stages
            leading in 2019 to more than 400,000 deaths, mostly of           represent transcripts peaking earlier in the IDC. Accordingly, an
African children under the age of five1. The major causative agent            approach using in vitro grown parasite lines previously assigned
of malaria, Plasmodium falciparum, causes disease through con-               ~4400 P. falciparum transcripts to a particular IDC stage,
tinuous asexual intraerythrocytic developmental cycles (IDCs),               allowing predictions of the stage composition of mixed parasite
each lasting ~48 h and producing 8–30 new parasites2. Circula-               samples24, which we also applied here. Furthermore, we use
tion of young parasite forms within each IDC, called ring stages,            previously described algorithms integrating the parasites’ full
is a hallmark of P. falciparum malaria3, while more developed                transcriptome to determine expected stage-compositions17, and
stages express parasite antigens at the host cell surface to promote         the maximum likelihood estimate of average parasite age in hours
their adhesion to the vascular endothelium and avoid splenic                 post erythrocyte invasion (hpi)16 of a given sample. Applying
clearance4,5. P. falciparum infection can produce a range of                 these bioinformatic methods to previously published studies we
clinical outcomes: remaining asymptomatic despite infection,                 determine the expression profile of differentially expressed genes
presenting with fever and other non-specific symptoms in                      (DEGs)20, and predict the developmental stages present in each
uncomplicated malaria, or exhibiting one or several signs of                 sample24. Our re-interpretation of the transcriptional analyses
severe disease leading to cerebral malaria, severe anaemia, coma,            and the calculations of parasites’ age in the various studies reveals
pulmonary oedema, or metabolic acidosis6. This array of malaria              new transcriptional signatures supporting the hypothesis that
presentations associates with parasite burden, and with different            shorter circulation time of infected erythrocytes within the ~48 h
stages of a progressively developing protective immunity which               IDC associates with increased parasite growth rates, virulence,
increases with parasite exposure and host age7,8. Protection from            and disease severity.
severe malaria is rapidly acquired after a few clinical episodes in
areas of high transmission9, and years of exposure result in
mostly asymptomatic infections in adolescence and                            Results
adulthood8,10,11. Accordingly, in malaria-endemic areas, para-               Similarities and differences in P. falciparum transcriptional
sitaemia with high parasite burden is often seen in young children           profiles across studies. To investigate a possible broad signature
with severe malaria12. In contrast, lower parasitaemia typifies               of P. falciparum transcription associating with parasite burden
uncomplicated malaria or asymptomatic infections in older                    and/or disease severity, we identified ten published studies
individuals13,14, reflecting cumulative exposure and gradual                  between 2007 and 2020 that reported transcriptional differences
naturally acquired immunity to malaria. Nevertheless, in age-                between malaria parasites isolated from individuals presenting
matched individuals with apparently similar parasite exposures,              with a spectrum of malaria symptoms and parasitaemias and
different clinical outcomes have been linked to parasites causing            residing in areas of different transmission intensities (Table 1).
severe malaria with higher or lower parasitaemias15, or parasites            With the exception of one study that compared acute vs chronic
promoting non-severe vs severe malaria16,17, without allowing for            P. coatneyi infection in non-human primates in the laboratory
major conclusions regarding the contribution of parasite tran-               setting25, all studies analyzed P. falciparum samples from natu-
scription to disease outcome. Recently, in a cohort study in the             rally infected humans. Seven studies reported transcriptional
seasonal transmission setting of Mali, we compared parasites                 differences between P. falciparum samples collected from indi-
persisting at low parasitaemias in asymptomatic children at the              viduals presenting with distinct disease severities, parasite bur-
end of the 6-month dry season with parasites causing uncom-                  dens, transmission intensities, or NMF-generated clusters
plicated malaria in age-matched individuals during the ensuing               immediately after blood draw15,17,18,26–29, and two studies com-
wet season, and found highly different transcriptional signatures.           pared cultured late trophozoites or schizont stages of P. falci-
We determined that gene expression differences were strongly                 parum samples from individuals with different disease severities
associated with the developmental stage of circulating P. falci-             and parasitaemias16,30. The studies used different numbers of
parum within the ~48 h IDC18. Indeed, during each IDC, P.                    samples collected from diverse geographic settings, employed
falciparum follows a tightly regulated, developmental stage-                 microarray or next-generation sequencing methodologies to
dependent19 transcriptional pattern from merozoite invasion of               quantify parasite transcripts, and used various analytical
erythrocytes, through the ring- and trophozoite-stages, until the            approaches to define differential gene expression. A varying
multinucleated schizont releases new merozoites at the end of the            number of DEGs were reported comparing higher vs lower
IDC20–22, and parasite transcription from patients’ blood can                parasitaemias15,16,18,25,27,30, severe vs mild malaria16,17,27,29, and
reveal the stage composition of circulating parasites16,17,23,24. Our        mild malaria vs asymptomatic parasite carriage18,25,30, clusters of
recent data showed that during the dry season, P. falciparum-                transcriptionally similar groups of samples15,26, or differing
infected erythrocytes circulate longer within the ~48 h IDC and              transmission intensities28 (Table 1). Considering the seven P.
low parasitaemia is maintained for several months through                    falciparum studies that reported DEGs, we observed only limited
increased splenic clearance18, hinting that previously reported              and not consistent overlap of DEGs; there was not a single DEG
transcriptomes from P. falciparum field isolates causing distinct             that was common across the seven studies (Fig. 1a and Supple-
clinical outcomes may also have been influenced by differences in             mentary Table 1). Moreover, there was no enrichment of com-
adhesion efficiency and circulation times of parasitized                      mon terms identified across studies within gene ontology (GO) or
erythrocytes.                                                                functional category (Fig. 1b). We noted, however, the overlap
   In this work, we revisit ten studies published between 2007 and           between DEGs found in lower asymptomatic parasitaemias in the
2020 that report parasite transcriptional differences between                dry season vs higher parasitaemias in clinical malaria cases in the
distinct disease severities, parasite burdens, non-negative matrix           wet season in Mali18, and those identified in lower vs higher
factorization (NMF) clustering of expression profiles, or trans-              parasitaemias in cerebral malaria cases in Malawi15, and some
mission intensities to bioinformatically interrogate transcriptional         trend of DEGs connect with the similar directionality between the
differences dependent on developmental stage. Our approach                   two studies. Transcripts increased in higher parasitaemias in
centered on the tight transcriptional pattern governing the ~48 h            Andrade et al. were also increased in higher parasitaemias in
IDC20; and based on the simple idea that genes that are differ-              Milner et al.. We also observed connections between upregulated
entially upregulated in more vs less-developed parasite stages               transcripts in higher parasitaemias in Milner et al. and Lee et al.,

2                NATURE COMMUNICATIONS | (2021)12:4711 | https://doi.org/10.1038/s41467-021-25062-z | www.nature.com/naturecommunications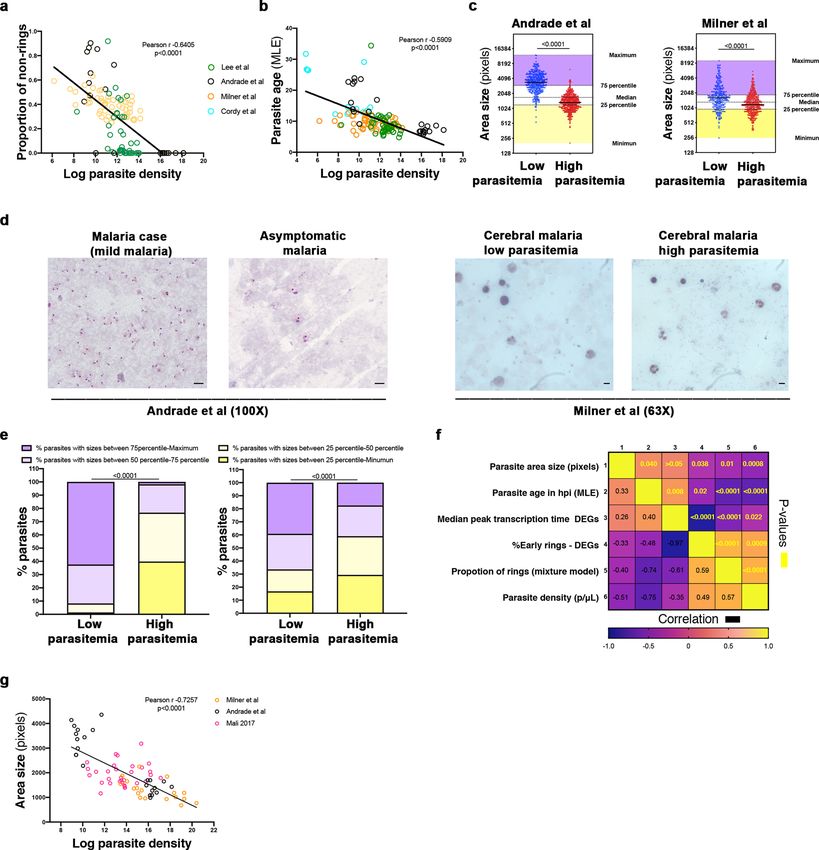
NATURE COMMUNICATIONS | https://doi.org/10.1038/s41467-021-25062-z ARTICLE
and between severe cases of Tonkin-Hill et al. and higher para-
DEGs (n)
reported
reported
reported
sitaemias in Andrade et al. or Milner et al., where we also detected
2774
1609
some connections of DEGs aligned with parasitaemia direction-
436
234
278
236
358
Not
Not
Not
ality (Fig. 1a and Supplementary Data 1). In addition, although
the GO and functional analyses did not identify significant
enrichment of common pathways between studies (Fig. 1b),
similar tendencies of gene expression of transcripts belonging to
GSEA-Gene Set
Limma package
Limma package
the fatty acid biosynthesis pathway, which appeared significantly
Not specified
DEG method
not specified
GenePattern
increased in higher parasitaemias of Andrade et al., were detected
in samples of higher parasitaemias in Milner et al. and Lee et al.
DESeq2
DESeq2
DESeq2
EdgeR (Fig. 1c). Likewise, the spliceosome pathway that was shown to be
significantly increased in higher parasitaemias of Milner et al.
showed a similar trend of overexpression in higher parasitaemias
of Lee et al. and Tonkin-Hill et al. (Fig. 1c). The RNA binding
pathway distinguished between groups in Milner et al. and Lee
Microarray
Microarray
Microarray
Microarray
Microarray
Technique
et al. (Fig. 1b, c), but also partially in Andrade et al., and in
RNAseq
RNAseq
RNAseq
RNAseq
RNAseq
Tonkin-Hill et al. when samples were ordered by increasing
number of housekeeping gene reads (Fig. 1c). Altogether these
data highlight the modest overlap of DEGs between the datasets,
while hinting that differences in parasitaemia observed across the
studies may produce common transcriptional signatures.
Dry asymptomatic vs Wet
Asymptomatic vs cerebral
High vs low transmission
Severe vs uncomplicated
High vs low parasitemia
Acute vs post-subRx vs
Severe vs non-severe
season mild malaria
Clusters 1 vs 2 vs 3
Parasite circulation time drives transcriptional difference
between asymptomatic dry season infections and mild malaria-
Mild vs severe
Mild vs severe
causing parasites in the wet season. Recently, we have shown that
differences in circulation time of infected erythrocytes prior to
settings
Groups
malaria
chronic
cytoadhesion between persisting low parasitaemias at the end of the
dry season in asymptomatic children and malaria-causing P. falci-
parum parasites in the wet season associated with major transcrip-
tional differences that were linked to the developmental stage of
circulating parasites18. Now, we quantitatively characterized those
Transmission intensity
associations with a series of bioinformatic approaches centered on the
Severity/parasitaemia
Severity/parasitaemia
Severity/parasitaemia
Seasonality/severity/
Severity/parasitemia
expression profiles
tight transcriptional pattern governing P. falciparum during the ~48 h
NMF clustering of
Severity/parasite
IDC20. First, we outlined the expression pattern of DEGs upregulated
Disease phase/
severity (CM)
Parasitaemia/
parasitaemia
parasitaemia
in the low dry season parasitaemias or in the higher malaria cases’
Variable
parasitaemias along the ~48 h IDC in the reference HB3 P. falci-
biomass
parum parasite line in vitro, according to Bozdech et al.20, and
obtained very different heatmaps and associated expression curves
(Fig. 2a and Supplementary Data 2). While transcripts upregulated in
low dry season parasitaemias mostly showed high expression
between 12 and 36 h post invasion in the reference HB3 P. falci-
Table 1 Characteristics of the studies included in the analyses.
parum parasite in vitro, the upregulated transcripts in the higher
samples
parasitaemias of clinical malaria cases in the wet season presented the
No. of
opposite trend, higher expression between 0 and 12 h post invasion,
214
116
44
46
96
24
43
58
17
4
or at very late stages after 40 h (Fig. 2a), when genes of merozoite
invasion and early ring stages start to be transcribed again20. This
agrees with the presence of more developed parasite stages in the low
parasitaemias in dry season samples, and young ring stages in the
higher burden malaria cases18. Interestingly, this gene-level metric of
The Gambia
The Gambia
and Sudan
Study site
NA (lab P.
DEGs along the IDC in the reference HB3 P. falciparum in vitro was
Cameroon
and Benin
Indonesia
Indonesia
coatneyi)
Senegal
Malawi
independent of the fold change in expression observed between dry
Kenya
Mali
season and malaria cases (Supplementary Fig. 1 and Supplementary
Data 2). We then used another pre-established gene-specific metric,
the time of peak expression of a transcript within the ~48 h IDC
determined through a periodogram analysis24. Examining the time of
peak expression of upregulated DEGs in the dry season (low para-
Ref.
30
26
28
29
25
27
18
16
15
17
sitaemias), and in malaria cases (high parasitaemias), we observed
later peaks (24.1 h 95% CI 23.9, 24.4) in upregulated genes in the dry
season, and earlier peaks (12.4 h 95% CI 11.1, 15.5) for the upregu-
lated genes in malaria cases (p < 0.0001, Mann–Whitney) (Fig. 2b
Daily et al. 2007
Rono et al. 2017
Lee et al. 2018
and Supplementary Data 2). The DEGs between low parasitaemias in
et al. 2009
et al. 2020
the dry season and higher parasitaemias in the wet season were also
Tonkin-Hill
et al. 2014
et al. 2014
et al. 2019
et al. 2018
et al. 2012
Yamagishi
Andrade
Lemieux
assessed with another approach proposed by Painter et al.24, which
Almelli
Milner
Cordy
Study
previously assigned a particular IDC stage to ~4400 P. falciparum
transcripts, thus allowing for the prediction of stage composition of
NATURE COMMUNICATIONS | (2021)12:4711 | https://doi.org/10.1038/s41467-021-25062-z | www.nature.com/naturecommunications 3
ARTICLE                                                                  NATURE COMMUNICATIONS | https://doi.org/10.1038/s41467-021-25062-z

mixed parasite samples from their DEGs. This categorization applied           (Fig. 2c and Supplementary Data 2). Also estimating the proportion
to the upregulated DEGs in the dry (low parasitaemias) or wet sea-            of developmental stages composing each sample of Andrade et al.,
sons (high parasitaemias) again revealed more developed parasites             but this time using their entire transcriptional profile through a
alongside fewer ring stages from transcripts upregulated in the dry           mixture model proposed by Tonkin-Hill et al.17, we obtained further
season, while transcripts upregulated in malaria cases associated with        evidence that low parasitaemia samples in the dry season contained
higher proportions of early ring stages (p < 0.001, Fisher’s exact test)      P. falciparum trophozoites, while malaria cases samples in the wet

4                 NATURE COMMUNICATIONS | (2021)12:4711 | https://doi.org/10.1038/s41467-021-25062-z | www.nature.com/naturecommunications
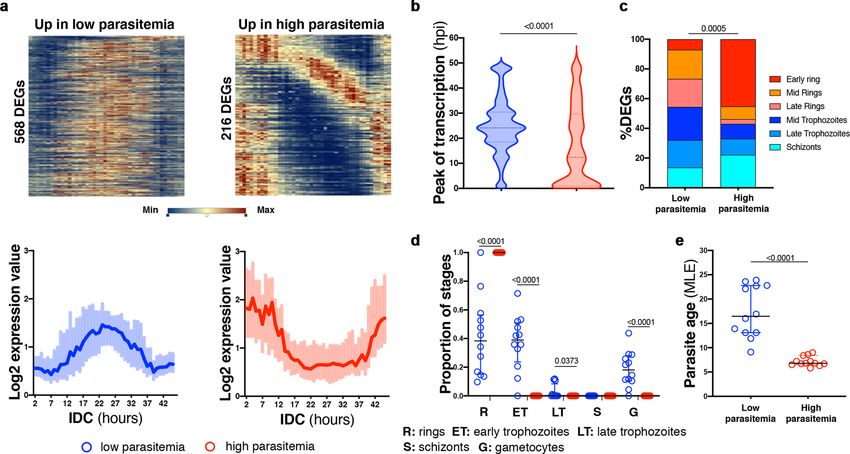
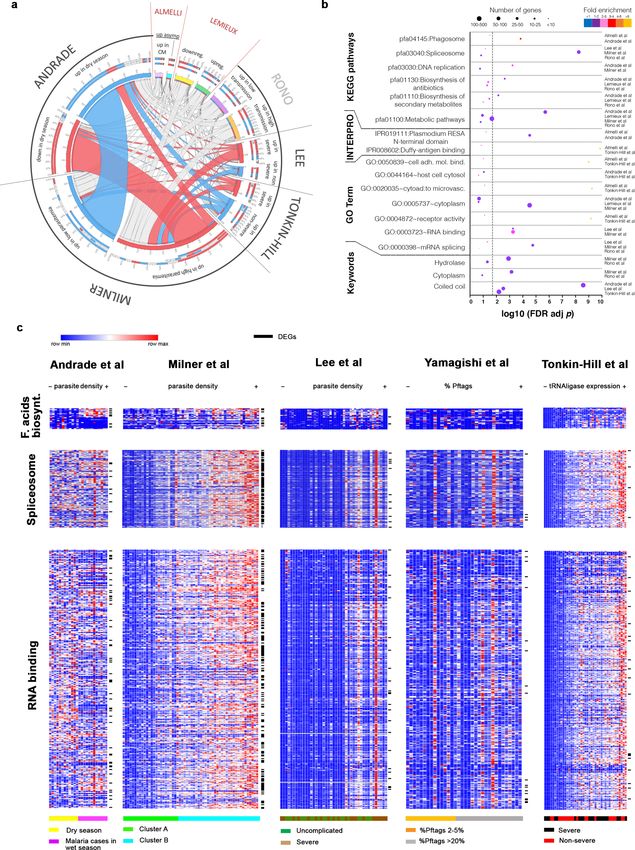
NATURE COMMUNICATIONS | https://doi.org/10.1038/s41467-021-25062-z                                                                             ARTICLE

Fig. 1 Similarities and differences in P. falciparum transcriptional profiles across different studies. a Circos plot showing interstudy connection of
reported DEGs samples of Andrade et al., Milner et al., Tonkin-Hill et al., Lee et al., and Rono et al. (non-cultured), and Lemieux et al. and Almelli et al.
(in vitro cultured to late trophozoites and schizont stages). From outside to inside are (i) study, (ii) variables analyzed, (iii) percentage of shared genes
between modules; (iv) number of shared genes between modules. Blue highlights upregulated DEGs in lower parasitaemias; red highlights upregulated
DEGs in higher parasitaemias; gray highlights DEGs from variables of studies not parasitaemia related (different colors—pink, light blue, yellow, green,
purple, orange—distinguish the different variables studied). b Summary of GO terms, keywords, KEGG pathways, INTERPRO protein domains significantly
enriched with DEGs reported in the different studies represented and sorted by adjusted p value (–log10 Fisher’s exact test one-sided p values corrected for
multiple comparisons using false discovery rate). The dot size indicates the number of DEGs associated with the functional group in each study and the dot
color indicates the fold enrichment. Gray dashed line indicates the p value threshold (–log10 (0.05) = 1.3). c Heatmaps showing normalized reads of genes
involved in different GO terms (rows) for each subject (columns) of Andrade et al., Milner et al., Lee et al. Yamagishi et al., and Tonkin-Hill et al.; genes are
ordered by peak time of transcription in vitro according to Painter et al.24, Within each study, subjects are ordered by parasite densities from lowest (−) to
highest (+) (in parasite/μL, % of Pf tags, or housekeeping gene expression). DEGs show “–” marks and are highlighted in Supplementary Data 1 of the
source data file.

Fig. 2 Parasite circulation time drives transcriptional differences between asymptomatic dry season infections and mild malaria-causing parasites in
the wet season. a Heatmaps (top) and log2 expression value curves (bottom) in the P. falciparum HB3 reference along the ~48 h IDC in vitro according to
Bozdech et al.20 of Andrade et al. DEGs upregulated in low parasitaemias at the end of the dry season (left, n = 568, 50.22% of the total 1131 DEGs) and
upregulated in high parasitaemias in malaria cases in the wet season (right, n = 216, 45.38% of the total 476 DEGs). For log2 expression value curves
(bottom) data indicate median ± IQR. b Time of peak transcription in hours post invasion in P. falciparum HB3 reference along the ~48 h IDC in vitro
according to Painter et al.24 of DEGs upregulated in low parasitaemias at the end of the dry season (n = 971, 85.85% of the total 1131 DEGs), and DEGs
upregulated in high parasitaemias in malaria cases in the wet season (n = 397, 83.40% of the total 476 DEGs). Data indicate median ± IQR; two-tailed
Mann–Whitney test, p < 0.0001. c Predicted stage composition according to Painter et al.24 of DEGs upregulated in low parasitaemias at the end of the dry
season (n = 857, 75.77% of the total 1131 DEGs) and DEGs upregulated in high parasitaemias in malaria cases in the wet season (n = 221, 46.43% of the
total 476 DEGs). Two-tailed Fisher’s exact test of DEGs assigned to developmental stages. d Predicted proportion of ring, early trophozoite, late
trophozoite, schizont, and gametocyte stages according to Tonkin-Hill et al.’s mixture model17 using whole transcriptome data from low parasitemia
samples from the dry season (blue, n = 12) and high parasitemia samples from malaria cases in the wet season (red, n = 12), One-way ANOVA with Sidak
multiple comparisons test. e Maximum likelihood estimation (MLE) according to Lemieux et al.16 of parasite age in hours post invasion of low parasitemia
samples from the dry season (blue, n = 12) and high parasitemia samples from malaria cases in the wet season (red, n = 12). Data indicate mean ± SD;
two-tailed Mann–Whitney test, p < 0.0001.

season revealed only young ring stages and not further developed                  highlight the strong link between the transcriptional signature
parasites (p < 0.0001, one-way ANOVA) (Fig. 2d and Supplementary                  observed in low parasitaemias and the increased age of the circulating
Data 2). Finally, as reported earlier18, the maximum likelihood esti-             parasites.
mation (MLE) method defined by Lemieux et al.16 applied to the
transcriptomes of parasites collected in the dry season and malaria
cases determined that the expected age in hpi was higher in parasites             DEGs from earlier studies show increased parasite circulation
circulating in the dry vs the wet season (p < 0.0001, Mann–Whitney)               time in low vs high parasitaemias. To determine if parasite
(Fig. 2e and Supplementary Data 2). Altogether, these analyses using              circulation time could also associate with transcriptional differ-
DEGs and the whole transcript data of low vs high parasitaemias                   ences identified in other studies, we applied these same

NATURE COMMUNICATIONS | (2021)12:4711 | https://doi.org/10.1038/s41467-021-25062-z | www.nature.com/naturecommunications                                       5
ARTICLE                                                                 NATURE COMMUNICATIONS | https://doi.org/10.1038/s41467-021-25062-z

bioinformatic strategies to publicly available datasets. Some                severe malaria cases, which mostly peak expression early post
studies provided a DEG list (Milner et al., Tonkin-Hill et al., Lee          invasion in Milner et al., Yamagishi et al., and Lee et al., and to a
et al., Lemieux et al., and Rono et al.) and for others we calcu-            lesser extent in Tonkin-Hill et al. (Fig. 3a and Supplementary
lated from their accessible gene count matrices (Yamagishi et al.,           Data 3). In agreement with these differences, the peak expression
Daily et al., and Cordy et al., see Methods). Strikingly, we                 time within the ~48 h IDC according to Painter et al.24 of
observed that the four studies comparing freshly obtained                    upregulated DEGs in low parasitaemia samples was later in
parasites from low vs high parasitaemias (Milner et al. and                  Milner et al. (25.1 h 95% CI 24.3, 25.9 in low parasitaemias, and
Yamagishi et al.) and mild vs severe disease (Lee et al. and                 19.5 h 95% CI 18.8, 20.2 in high parasitaemias), Yamagishi et al.
Tonkin-Hill et al.) showed similar patterns as the observed                  (27.1 h 95% CI 25.4, 28.9 in low parasitaemias, and 15.0 h 95%
comparison between dry and wet season parasites. Curves of                   CI 13.4, 16.6 in high parasitaemias), and Lee et al. (23.2 h 95% CI
expression and heatmaps along the ~48 h IDC in the reference                 20.1, 26.3 in non-severe, and 18.6 h 95% CI 16.7, 20.5 in severe
HB3 P. falciparum parasite in vitro showed that DEGs upregu-                 cases) (p < 0.001 Mann–Whitney) (Fig. 3b and Supplementary
lated in low parasitaemias or mild symptoms peak later in the                Data 3). However, in the Tonkin-Hill et al. study such difference
IDC than the upregulated transcripts in high parasitaemias or                was not found in the direction of later peak in lower

6                NATURE COMMUNICATIONS | (2021)12:4711 | https://doi.org/10.1038/s41467-021-25062-z | www.nature.com/naturecommunications
NATURE COMMUNICATIONS | https://doi.org/10.1038/s41467-021-25062-z                                                                          ARTICLE

Fig. 3 DEGs from earlier studies show increased parasite circulation time in low vs high parasitaemias. a Heatmaps (top) and log2 expression value
curves (bottom) in P. falciparum HB3 reference along the 48 h IDC in vitro according to Bozdech et al.20 of DEGs upregulated in low parasitaemia samples
in Milner et al. and Yamagishi et al., and non-severe samples in Lee et al. and Tonkin-Hill et al.; and DEGs upregulated in high parasitaemias or severe
malaria cases of the same studies. For log2 expression value curves (bottom) data indicates median ± IQR. b Time of peak transcription in P. falciparum HB3
reference along the 48 h IDC in vitro (left) and the predicted stage composition (right) according to Painter et al.24 of DEGs upregulated in low
parasitaemia samples or in non-severe samples in Milner et al. (n = 58), Yamagishi et al. (n = 36), Lee et al. (n = 46), and Tonkin-Hill et al. (n = 44), and
DEGs upregulated in high parasitaemias or severe malaria cases of the same studies. c Heatmaps (top) and log2 expression value curves (bottom) in P.
falciparum HB3 reference along the 48 h IDC in vitro according to Bozdech et al.20 of DEGs upregulated in samples from a low transmission area, and
upregulated in samples from a high transmission area in Rono et al. For log2 expression value curves (bottom) data indicates median ± IQR. d Predicted
stage composition according to Painter et al.24 of DEGs upregulated in samples from a low transmission area and DEGs and upregulated in samples from a
high transmission area in Rono et al. (n = 96). e Heatmaps (top) and log2 expression value curves (bottom) in P. falciparum HB3 reference along the 48 h
IDC in vitro according to Bozdech et al.20 of DEGs upregulated in each of the cluster comparisons described by Daily et al. f Time of peak transcription in P.
falciparum HB3 reference along the 48 h IDC in vitro (left) and the predicted stage composition (right) according to Painter et al.24 of DEGs upregulated in
each of the cluster comparisons described by Daily et al. (n = 43. For log2 expression value curves (bottom) data indicates median ± IQR. Data in b, d, and f
indicate median ± IQR; two-tailed Mann–Whitney test (left), and two-tailed exact Fisher’s done over absolute values of DEGs assigned to developmental
stages (right).

parasitaemias, nor were the differences as pronounced (20.3 h                    95% CI 23.8, 29.4 in cluster 1 and 20.6 h 95% CI 18.0, 22.2 in
95% CI 18.3, 22.2 in non-severe, and 22.5 h 95% CI 20.3, 24.8 in                 cluster 3) (p < 0.0001, Mann–Whitney) (Fig. 3f and Supplemen-
severe malaria) (Fig. 3b), likely due to the small number of DEGs                tary Table 3). This categorization is in line with what Daily et al.
found in the study and also possibly due to the largely over-                    refer in their original study, namely, that cluster 2 is the closest to
lapping parasitaemias between individuals included in non-                       early ring-stage profiles and also the cluster with the highest
severe and severe cases, which were not significantly different.                  average parasitaemia and thus likely younger in hpi than the
The stage composition prediction according to Painter et al.24                   other two clusters, but also that cluster 3 is the one with most
identified more developed parasites from upregulated transcripts                  severe cases and presenting higher parasitaemias than what is
in low parasitaemia groups across the different studies, while                   observed in cluster 126 is also in line with the predicted stage
transcripts upregulated in the high parasitaemia groups asso-                    composition with later forms in the cluster 1 and 3 vs 2, and
ciated with higher proportions of ring stages (p < 0.001, Fisher’s               cluster 1 vs 3 (Fig. 3f).
exact test) (Fig. 3b); and again the comparison between non-
severe and severe cases without strong parasitaemia differences
included in Lee et al. or Tonkin-Hill et al. resulted in much less               Whole transcriptome analyses across different studies support
pronounced differences in predicted stages (Fig. 3b).                            increased circulation time of infected erythrocytes in low vs
   Rono et al., a study that did not segregate sample groups based               high parasitaemias. We applied the mixture model proposed by
on parasitaemia or severity of disease but instead compared                      Tonkin-Hill et al.17 to the whole transcriptomes of the different
samples from high vs low transmission settings across all parasite               studies and consistently found lower proportions of rings and/or
burdens, did not show pronounced differences in heatmaps or                      higher proportions of early trophozoites or later developmental
expression curves of DEGs upregulated in low and high                            stages in the samples originating from lower parasitaemia con-
transmission settings along the ~48 h IDC in HB3 P. falciparum                   ditions (Milner et al. and Yamagishi et al.) and mild malaria cases
reference in vitro (Fig. 3c and Supplementary Data 3), nor were                  (Lee et al. and Tonkin-Hill et al.). Conversely, more young stages
the peak expression times according to Painter et al.24 of                       were predicted in the samples originating from high para-
upregulated DEGs in low or high transmission settings different                  sitaemias or severe malaria cases in the same studies (p < 0.05
(23.4 h 95% CI 18.1, 24.5 in low transmission, and 24.0 h 95% CI                 one-way ANOVA) (Fig. 4a and Supplementary Data S4). The
23.2, 25.1 in high transmission) (Fig. 3c). Accordingly, the                     MLE method by Lemieux et al.16 applied to the four tran-
predicted differences of developmental stages associating with the               scriptomes (Milner et al., Yamagishi et al., Lee et al., and Tonkin-
DEGs upregulated in high or low transmission settings although                   Hill et al.) determined significantly more mature parasites in the
significant were not particularly striking (Fig. 3d and Supple-                   low parasitaemias in Milner et al. and in the less severe malaria
mentary Data 3).                                                                 samples from Tonkin-Hill et al. (Fig. 4b and Supplementary
   Interestingly, in Daily et al., a study clustering samples from a             Data 4), while the differences were not statistically significant in
range of clinical presentations through NMF according to their                   Yamagishi et al. or Lee et al. Microarray data from Daily et al. and
transcriptional similarity into three groups of samples without                  Rono et al. were not compatible with running the mixture model
significant differences in parasite densities, our analyses never-                proposed by Tonkin-Hill et al.17 or the MLE calculation method
theless highlighted the presence of more developed parasites in                  defined by Lemieux et al.16.
samples of cluster 1 and cluster 3 than in cluster 2. Heatmaps and                  The particular case of the study by Cordy et al. analyzing P.
expression curves along the ~48 h IDC showed later expression in                 coatneyi in four rhesus macaques is the only study involving
DEGs upregulated in cluster 1 and 3 vs cluster 2, and the same                   longitudinal parasite sampling, including acute malaria with high
was true for cluster 1 vs cluster 3, with DEGs upregulated in                    parasitaemias and chronic low-level infection following sub-
cluster 3 showing high expression in early hours of the IDC                      curative treatment25. Applying the MLE method to the whole
(Fig. 3e). Also, the peak expression times within the IDC                        transcriptome of the different groups of samples, we observed
according to Painter et al.24 revealed that upregulated DEGs in                  that a higher proportion of younger parasites were present in
clusters 1 or 3 peaked later than DEGs upregulated in cluster 2                  acute infection/higher parasitaemias than in low parasitaemias
(29.3 h 95% CI 27.0, 29.9 in cluster 1 vs 18.35 h 9% CI 17.1, 19.9               immediately or long after the sub-curative treatment (Fig. 4c and
in cluster 2) and (28.0 h 95% CI 25.2, 25.9 in cluster 3 vs 18.0 h               Supplementary Data 4), and that the estimated parasite age in hpi
95% CI 17.56, 19.5 in cluster 2) and also upregulated DEGs in                    increased as the macaques’ parasitaemias decreased (Fig. 4d and
cluster 1 peaked later than upregulated DEGs in cluster 3 (26.4 h                Supplementary Data 4).

NATURE COMMUNICATIONS | (2021)12:4711 | https://doi.org/10.1038/s41467-021-25062-z | www.nature.com/naturecommunications                                    7
ARTICLE                                                                     NATURE COMMUNICATIONS | https://doi.org/10.1038/s41467-021-25062-z

Fig. 4 Whole transcriptome analyses across different studies supports increased circulation time in lower vs higher parasitaemias. a Predicted
proportion of ring, early trophozoite, late trophozoite, schizont, and gametocyte stages according to Tonkin-Hill et al.’s mixture model17 using whole
transcriptome data from low parasitemia samples in Milner et al. (n = 58). and Yamagishi et al. (n = 36), and non-severe samples in Lee et al. (n = 46) and
Tonkin-Hill et al. (n = 44) (blue) and higher parasitaemias or severe malaria cases of the same studies (red). One-way ANOVA with Sidak multiple
comparisons test. b Maximum likelihood estimation (MLE) of the hours post invasion of parasites in low parasitemia samples in Milner et al. (n = 58) and
Yamagishi et al. (n = 46) and non-severe samples in Lee et al. (n = 46) Tonkin-Hill et al. (n = 44) (blue) and higher parasitaemias or severe malaria cases
of the same studies (red). Data indicate mean ± SD; two-tailed Mann–Whitney test. c Maximum likelihood estimation (MLE) according to Lemieux et al.16
of the hours post invasion of longitudinal P. coatneyi parasites during acute (red), post sub-curative treatment (orange), and chronic (blue) infection of four
monkey samples in Cordy et al. RM one-way ANOVA (with Greenhouse–Geisser correction). d P. coatneyi parasite densities (triangles) and average
parasite age by MLE (circles) during acute (red), post sub-curative treatment (orange), and chronic (blue) infection of four macaque samples in
Cordy et al.

Low parasitaemia is associated with longer circulation time of                   the size of infected erythrocytes on thick smears collected at the
infected erythrocytes. We then aimed to determine if parasite                    time of blood draw in two of these studies (Andrade et al. and
developmental stages in circulation correlated with parasitaemia.                Milner et al.), and we confirmed that the average parasite size was
Some but not all studies included in the current analyses ori-                   significantly larger in low than in high parasitaemias (Fig. 5c, d
ginally reported individual parasite densities (in parasites/μL of               and Supplementary Data 5). Of note, we illustrated with 3D7 P.
blood), which allowed us to seek associations between para-                      falciparum parasites grown in vitro after merozoite isolation and
sitaemia and the predicted proportions of non-ring stages                        synchronized invasion of erythrocytes, that differences in parasite
according to the mixture model by Tonkin-Hill et al.17 as a proxy                sizes at early hours of development can be detected (Supple-
for parasite development, or whenever possible, the calculated                   mentary Fig. 2). Accordingly, despite an obvious overlap close to
parasite age in hpi through the MLE algorithm by Lemieux                         overall median size within each study, the proportions of para-
et al.16. In accordance with our hypothesis of longer circulation of             sites falling into the 1st and 4th quartiles were very much linked
infected erythrocytes with more mature parasites in low para-                    with parasite burden; with high parasitaemias showing larger
sitaemias, we found significant negative correlations between the                 proportions of parasites in the 1st quartile and low parasitaemias
proportion of non-rings (Fig. 5a and Supplementary Data 5) or                    showing increased proportions of 4th quartile sized parasites
the predicted age in hpi (Fig. 5b and Supplementary Data 5) and                  (Fig. 5e and Supplementary Data 5). For these two studies we
parasite density of samples in different studies (r = –0.64 and                  could also assemble a correlation matrix including six quantified
r = –0.59, respectively; p < 0.0001). We were also able to measure               features in our analyses (circulating parasite size, estimated

8                   NATURE COMMUNICATIONS | (2021)12:4711 | https://doi.org/10.1038/s41467-021-25062-z | www.nature.com/naturecommunications
NATURE COMMUNICATIONS | https://doi.org/10.1038/s41467-021-25062-z                                                                             ARTICLE

Fig. 5 Infected erythrocytes circulate longer in low than in high parasitaemias. a Correlation between parasite density and estimated proportion of non-
ring stages according to Tonkin-Hill et al.17 of all samples in Andrade et al. (black), Milner et al. (orange), Lee et al. (green). p and r determined by Pearson
correlation. b Correlation between parasite density and average parasite age by MLE in hours post invasion estimated according to Lemieux et al.16 of all
samples in Andrade et al. (black), Milner et al. (orange), Lee et al. (green), and Cordy et al. (light blue). p and r determined by Pearson correlation. c P.
falciparum area measured from thick smears in low parasitaemia samples (blue) in Andrade et al. and Milner et al., and in high parasitaemia samples (red)
of the same studies. Yellow and purple shaded regions indicate 1st and 4th quartiles highlighting smallest and largest parasite sizes, respectively. Data
indicate median ± IQR; two-tailed Mann–Whitney test, p < 0.0001. d P. falciparum parasites in thick blood films collected straight from the arm of children
with low parasitaemia samples (left) in Andrade et al. and Milner et al., and high parasitaemia samples (right) of the same studies. Data show
measurements of one of 3–4 independent readers blinded of sample grouping with interclass correlation of 0.963 and 0.889 for Malian and Malawian
samples, respectively. Scale bar = 5 μm. e Proportion in percentages of parasites imaged in thick blood films collected directly from children with low and
high parasitaemia samples in Andrade et al. (n = 24) and Milner et al. (n = 32), falling into 1st, 2nd, 3rd, and 4th quartiles. Fisher’s exact done over absolute
values of parasites assigned to the different quartiles. f Correlation matrix of variables obtained or determined from Andrade et al. and Milner et al. The
cells are colored according to the scale: yellow indicates positive correlation and purple indicates negative correlation. Correlation matrix of every variable
with each other without adjustment for multiple comparisons. p values determined by Pearson correlation are highlighted in yellow. g Correlation between
parasite density and parasite areas measured from thick smears in samples across a wide range of parasitaemias including Andrade et al., Milner et al., and
a third study (Coulibaly et al. in preparation) with samples from uncomplicated and severe malaria cases collected in Mali. p and r determined by one-tailed
Pearson correlation.

NATURE COMMUNICATIONS | (2021)12:4711 | https://doi.org/10.1038/s41467-021-25062-z | www.nature.com/naturecommunications                                       9
ARTICLE                                                                 NATURE COMMUNICATIONS | https://doi.org/10.1038/s41467-021-25062-z

parasite age according to Lemieux et al.16, median peak expres-              PfEMP1 on the surface of iRBCs with earlier responses observed
sion time of DEGs according to Painter et al.24, and proportion of           to pathogenic domain variants with particular binding
rings estimated by DEGs, and by the mixture model according to               phenotypes36,37. In agreement with this concept, our present data
Painter et al.24 and Tonkin-Hill et al.17, respectively, and parasite        reanalyzing multiple published studies comparing parasite tran-
density), and we observed that while the area size of circulating            scription of higher vs lower parasitaemias, or more vs less severe
parasites correlated positively with estimated age in hpi and peak           malaria-causing parasites identified transcriptional profiles of
expression times of DEGs (all indicative of more developed                   younger parasites in circulation in higher parasitaemias and more
parasites); it correlated negatively with the proportion of ring             severe malaria cases than in lower parasitaemias or more mild
stages predicted by Painter categorizations of DEGs or by the full           malaria cases (Figs. 2–4). A simple overlay of DEGs lists could not
transcriptome mixture model method, and it also correlated                   show extensive parallels between the studies, and affected mole-
negatively with parasite density (Fig. 5f and Supplementary                  cular pathways showed only moderate similarities (Fig. 1a–c),
Data 5). Finally, we aimed to cover a comprehensive range of                 which may be in part be explained by the many differences in
parasite densities and investigate a possible correlation with size          methodology and analytical pathways and overlapping para-
of circulating parasites. We compiled the measurements of                    sitaemias between groups of samples in some studies (Table 1).
parasites from the two studies mentioned above, Milner et al.                However, using analytical approaches described earlier to infer
comparing cerebral cases with high and low parasitaemias, and                the stage composition and parasite developmental age from
Andrade et al. comparing asymptomatic vs mild malaria cases                  DEGs20,23,24, and from whole transcriptome16,17, we showed
(Fig. 5c, d), and we added measurements from samples from a                  within each study comparing parasite of lower vs higher para-
third study (Coulibaly et al. in preparation, see Methods) com-              sitaemias that we could detect more mature parasites in the lower
paring severe vs mild malaria. The correlation between parasite              parasitaemia samples and less mature signatures in the higher
densities found in the blood of children and the parasite sizes              parasitaemia samples. Transcripts upregulated in higher para-
across the studies was statistically significant and negative                 sitaemias tended to be early-expressed genes in the ~48 h IDC,
(r = –0.726, p < 0.0001), and particularly evident at low para-              while upregulated transcripts in lower parasitaemias were later-
sitaemias where circulating parasites are larger (Fig. 5g and                expressed genes within the asexual cycle; across the whole tran-
Supplementary Data 5).                                                       scriptome through algorithms previously established, more
                                                                             developed parasites were consistently predicted in lower vs higher
                                                                             parasitaemias (Figs. 2 and 4). A study not involving parasite
Discussion                                                                   burden or clinical severity in the original parasite transcriptome
Although the parasite and host factors that determine the clinical           analysis, but instead comparing P. falciparum from higher and
outcome of P. falciparum infections are not fully understood,                lower transmission settings across all parasitaemias28, did not
higher parasitaemia is frequently associated with poorer                     reveal any signature related to parasite circulation time when we
prognoses6,15,16,18,30,31. In this study, we accessed publicly               applied our analytical approach (Fig. 3c, d). None of the human
available transcriptional profiles of parasites from reports across           parasite studies available for this reanalysis reported longitudinal
the malaria clinical spectrum and parasitaemia range. We showed              data of P. falciparum infections, which would help determine if
a clear relation between circulation of older parasites within each          the progression of infection and consequent immunity would lead
~48 h asexual replication cycle and lower parasitaemia. Our data             to a signature of more developed circulating parasites. However, a
support a model in which higher parasite burdens result from                 non-human primate malaria study analyzing transcription of P.
parasites sequestering from peripheral circulation by competently            coatneyi during acute malaria, and following sub-curative anti-
binding to endothelial cells and thus evading splenic clearance,             malarial drug treatment that allowed immunity to control
contributing to more rapid parasitaemia growth and worse clin-               infection to low parasitaemias25 provided us longitudinal data of
ical presentations. Asymptomatically infected children typically             high parasitaemia during symptomatic malaria and low para-
present with low-level parasitaemias, which are often sub-                   sitaemias in the absence of symptoms. We found that the
microscopic32,33, mild, or uncomplicated malaria cases typically             orthologous transcriptional signature of the higher symptomatic
associated with higher parasite burdens than the ones observed in            parasite burden seen in acute malaria aligned with less-developed,
asymptomatic infected children18,30, but lower than what is fre-             younger parasites forms than the low parasite burden following
quently seen in severe or complicated malaria cases31. This gra-             sub-curative treatment (Fig. 4c, d).
dient led to the hypothesis that intrinsic replication rates of P.              In two studies included in this reanalysis, data supporting
falciparum may contribute to the level of parasitaemia. However,             further developed parasites circulating in lower parasitaemias and
in vitro culture of parasites collected from uncomplicated and               less severe malaria cases were already reported at that time, albeit
severe malaria cases fails to consistently explain parasitaemia              possibly not clearly or knowingly. Tonkin-Hill et al. described a
differences found in clinical settings34,35, and our recently pub-           bias toward early trophozoite transcription in the uncomplicated
lished data show similar in vitro replication ability between                compared to the ring-stage transcriptional profile of the severe
parasites causing mild malaria and asymptomatic infection18.                 malaria cases analyzed ex vivo17, and Lemieux et al. reported that
Furthermore, we recently reported transcriptional differences                a shorter period of hours in culture was needed to achieve schi-
between parasites causing mild and subclinical malaria associated            zont stages in parasites collected from uncomplicated cases (24 h
with increased circulation time of parasites causing subclinical             95% CI 23, 44) than the period needed to have parasites reach the
malaria18, which we confirmed here (Fig. 2). Cumulative parasite              same stage from severe malaria cases (38 h 95% CI 24, 48) (p =
exposure and the acquisition of humoral immunity are surely at               0.05 t test)16. These are two clues in two different publications, of
the center of clinical protection in malaria-endemic areas, but the          what we now put in evidence across multiple studies, and is
factors that determine whether similarly exposed individuals                 possibly a major driver of P. falciparum ability to grow within a
present with symptoms or not, or which parasites will increase to            host. Early stage adhesion of infected erythrocytes results in
disease-causing levels in each individual are unknown. We pro-               effective evasion of splenic clearance and a subsequent rapid
pose that the binding ability to vascular endothelium of infected            increase in parasitaemia and severity of disease. With two
erythrocytes that are not cleared by antibodies affects the rate of          studies15,18 we could relate the parasite transcriptional signatures
increase of parasite load and hence malaria severity, which is               with size measurements of circulating parasites within the lower
supported by the ordered acquisition of antibodies recognizing               and higher parasitaemia groups, which confirmed the presence of

10               NATURE COMMUNICATIONS | (2021)12:4711 | https://doi.org/10.1038/s41467-021-25062-z | www.nature.com/naturecommunications
NATURE COMMUNICATIONS | https://doi.org/10.1038/s41467-021-25062-z ARTICLE
more mature parasites in individuals with lower parasitaemias Milner et al. 2012: 58 P. falciparum cerebral malaria samples clustered into low
(Fig. 5d), validating longer circulation within the ~48 h IDC (24) and high (34) parasitaemia in Malawi. DEGs were reported.
Yamagishi et al. 2014: 116 samples from varying P. falciparum parasitaemias
detectable through transcriptomic analyses leads to less rapid (defined by % of Pf RNAseq tags within a sample ranging from 0.001 to 72.95%)
increase in parasite burden. Adding a third study (Coulibaly et al. and clinical presentations in Indonesia. DEGs were not originally reported. We
in preparation) we were able to cover a wide range of parasite determined DEGs between 16 samples with Pf tags >20% (high parasitaemia) and
densities across an array of clinical presentations and quantify 20 samples with Pf tags between 2 and 5% (low parasitaemia).
parasite sizes of freshly isolated parasites from multiple studies Lee et al. 2018: 21 samples from uncomplicated P. falciparum malaria cases and
25 severe P. falciparum malaria samples, including cerebral malaria (5),
evidencing more developed parasites in samples from lower hyperlactatemia (8), and both (12) from The Gambia. DEGs were reported.
parasitaemias and milder malaria forms, and showing a negative Tonkin-Hill et al. 2018: 21 samples from non-severe P. falciparum malaria
association between parasitaemia and developmental stage of cases, and 23 samples from severe malaria patients in Papuan adults. DEGs were
circulating parasites (Fig. 5g). It remains to be explained how P. reported.
Rono et al. 2017: 96 samples of P. falciparum uncomplicated malaria cases from
falciparum alters its adhesive properties driving increased splenic areas of different transmission intensities in Kenya and Sudan. DEGs were
clearance and maintaining lower parasitaemias. We propose that reported.
circulating antibodies control parasites with stronger binding Daily et al. 2007: 43 samples from P. falciparum positive individuals across
abilities and thus potential fast-growth, leading to the biased diverse clinical presentations and age clustered in three groups. DEGs were not
originally reported. We determined DEGs including all samples and using the same
presence in the circulation of immune or semi-immune indivi- clustering.
duals of parasites binding less efficiently. These parasites would Lemieux et al. 2009: 8 samples from P. falciparum mild malaria cases and
not be able to increase to high levels because their longer presence 9 samples from severe P. falciparum malaria in The Gambia cultured until the
in circulation promotes splenic clearance. Although very difficult schizont stage. DEGs between each group and reference 3D7 were reported.
Almelli et al. 2014: 3 pooled samples of six P. falciparum field isolates effectively
due to the variable nature of the parasite gene families promoting cultured in vitro until trophozoite stage from asymptomatic children, children with
cytoadhesion, the study of sequential expression and humoral uncomplicated malaria, or children with cerebral malaria in Cameron. DEGs were
responses to variant surface antigens in P. falciparum may inform reported.
how less-adhesive parasites appear gradually in individuals, and Cordy et al. 2019: P. coatneyi samples collected during acute infection, following
how virulence is regulated favoring persistence. Within the ten sub-curative treatment and at chronic stage of four laboratory-reared Rhesus
macaques. DEGs were not reported.
studies reanalyzed here, only Andrade et al. and Tonkin-Hill et al. An 11th study was included to investigate the relation of parasite sizes on thick
discussed possible associations between disease severity and var- blood smear and parasite density, which was not included in any gene expression
iant gene family transcripts, but none of the studies included analyses.
longitudinal sampling. In the small number of samples analyzed Coulibaly et al. in preparation: a case–control study of severe malaria in
Bandiagara, Bamako, Sikasso, and satellites villages with 6-month to 10-year-old
in Andrade et al., there was no significant enrichment of parti- participants enrolled and followed from October 2014 to December 2018 in Mali.
cular vars, and only a trend of higher expressed var genes in Cases were recruited among children hospitalized or seeking care with cerebral
individuals with clinical malaria vs asymptomatic in the dry malaria (Blantyre score ≤2) or severe anaemia (hemoglobin level ≤5 g/dl) at the
season18. Tonkin-Hill et al. detected no differences between dedicated health facilities. Controls were children suffering from uncomplicated
malaria seeking care at the same health facilities and matched by age class,
severe and uncomplicated malaria cases in total number of var residence, sex and ethnicity to the index case. The study protocol obtained ethical
gene reads, but identified segregation at the multidomain and clearance from the Ethics Committee of Faculty of Pharmacy and Faculty of
individual domain level between severe and uncomplicated dis- Medicine and Odonto-stomatology, University of Sciences, Techniques and
ease. However, Tonkin-Hill et al. also found genes involved in Technologies of Bamako, Mali; letter of approval #2014//97/CE/FMPOS. Individual
informed consent was obtained from parents or guardians. Data were anonymized
PfEMP1 transport and regulation to be downregulated in severe to guarantee confidentiality of volunteers’ identities.
malaria leading the authors to suggest that var gene expression
was reduced in severe cases17, which in light of our current data Gene expression and DEG overlap between studies. Most studies provided gene
could also simply indicate less-developed parasites. expression data; however, Lee et al. did not. Raw sequencing reads from Lee et al. and
Although we favor a hypothesis where lower parasitaemias and Andrade et al. were processed through Cutadapt (-q 30 --pair-filter=any -m 25) and
milder malaria cases are promoted by decreased cytoadhesion of mapped to P. falciparum 3D7 (PlasmoDB release 47)46 by Hisat247. Reads of Lee et al.
were additionally mapped to human (UCSC hg38)48 to only use reads that uniquely
longer circulating parasites, achieved through imposed switching mapped to P. falciparum. FeatureCount (-g ID --primary -C -Q 30 -p -t gene)49 were
following humoral immunity against better-binding parasite used to create the final gene expression table. Gene annotations were obtained from
variants, we cannot exclude alternative scenarios. Other GENCODE (release 34)50 and PlasmoDB (release 47). Conversion between new and
mechanisms affecting circulation of infected erythrocytes linked old gene names was done by gene aliases from PlasmoDB (release 47), and genes of
Cordy et al. were converted into the annotated P. falciparum orthologs.
to decreased expression levels of PfEMP118,30, the potential effect DEGs of studies not providing a DEG list (Yamagishi et al., Daily et al., and
of the host febrile temperatures38,39 and cytokine Cordy et al.) were determined by the quasi-likelihood F-test in the EdgeR
environment40–44, other host cues independent of humoral package51 with TMM normalization52, p < 0.05 and fold change >1.5. The EDAseq
immunity45 and promoted by different clinical presentations may package53 was used for principal component analysis, relative log expression (RLE),
be at place; or even the possibility that factors independent and and mean variance trend. Samples in each study with mean RLE exceeding ±0.1
after limma/voom normalization54,55 were excluded from analysis. Genes of all
parallel to longer circulating parasites should be investigated. studies were filtered by more than 2 counts per million in ten or more samples.
In conclusion, we revealed through transcriptional signatures Shared reported DEGs between different studies were assessed and highlighted
that parasite circulation time associates with growth potential and through the online platform “circos table viewer” (http://mkweb.bcgsc.ca/
parasite virulence, influencing disease outcome, and potentially tableviewer/visualize/)56, and the Venn diagrams obtained through the platform
from Bioinformatics and Evolutionary Genomics at Ghent University (http://
highlight cytoadhesion dynamics as a major force driving the bioinformatics.psb.ugent.be/webtools/Venn/) available online.
clinical prognosis of malaria.
Gene ontology (GO) and functional category analysis. Over-represented
functional annotations, keywords, and pathways were defined using DAVID57 for
Methods GO terms, keywords, KEGG pathways, and INTERPRO protein domains, and
Description of studies and transcriptional datasets included. The studies sorted by adjusted p value (–log10 (Bonferroni-corrected p values) for the different
included in the analyses were selected through a PubMed search using “Plasmodium” studies. The number of DEGs associated with the functional group in each study
“transcription” “field samples,” and similar terms, and we further identified studies was calculated together with the fold enrichment. The statistical threshold was set
cited in the search results. Ten studies were included in the transcriptional analyses. as (–log10 (0.05) = 1.3).
Andrade et al. 2020: 12 P. falciparum RDT+ samples from asymptomatic
children in the dry season, and 12 malaria case samples from the wet season in GO term-related heatmap. Normalized reads of DEGs involved in GO terms
Mali. DEGs were reported. (rows) for each subject (columns) were included in heatmaps, where samples from
NATURE COMMUNICATIONS | (2021)12:4711 | https://doi.org/10.1038/s41467-021-25062-z | www.nature.com/naturecommunications 11You can also read