Microbiomes from feces vs. gut in tadpoles: distinct community compositions between substrates and preservation methods - Salamandra ...
←
→
Page content transcription
If your browser does not render page correctly, please read the page content below
SALAMANDRA 57(1): 96–104
                                                             Sten Anslan et al.
                                                                                                              SALAMANDRA
15 February 2021          ISSN 0036–3375                                                                      German Journal of Herpetology

                                Microbiomes from feces vs. gut in tadpoles:
                                distinct community compositions between
                                   substrates and preservation methods

                                Sten Anslan1, Huan Li2, Sven Künzel3 & Miguel Vences1

             1)
                Zoological Institute, Technische Universität Braunschweig, Mendelssohnstr. 4, 38106 Braunschweig, Germany
2)
     Institute of Occupational Health and Environmental Health, School of Public Health, Lanzhou University, Lanzhou 730000, China
                   3)
                      Department of Evolutionary Genetics, Max Planck Institute for Evolutionary Biology, Plön, Germany

                                Corresponding author: Sten Anslan, e-mail: s.anslan@tu-braunschweig.de

                                                   Manuscript received: 12 January 2020
                                              Accepted: 2 December 2020 by Stefan Lötters

         Abstract. Sample type and preservation methods are likely to influence the results of microbiome analyses. Here, we sam-
         pled tadpoles of Nanorana parkeri non-invasively for feces, and subsequently for hindgut through dissection. Gut and fe-
         cal samples were stored in ethanol, and additionally, part of the gut samples were frozen, but temporarily thawed during
         transport as it often happens under difficult field conditions. Our results showed that both substrate (gut vs. feces) as well
         as preservation method can influence the analysis of intestinal microbiomes. Frozen gut samples strongly differed from
         ethanol-stored samples, and most of the frozen samples were dominated (in relative abundance) by a set of Proteobacteria
         OTUs that were completely absent from the ethanol-stored samples. This blooming of contaminant bacteria occurred after
         less than 12 h of thawing, thus caution should be taken when constancy of cold temperatures cannot be maintained in the
         field for sample preservation purposes. Among ethanol-stored samples, whereas the recovered bacterial richness and phy-
         logenetic diversity did not differ, the community structure varied significantly. Thus, for meaningful gut microbiome me-
         ta-analyses it is important to acknowledge the effect of the sampling substrate for the microbial community composition.
         Key words. Amphibia, Anura, Nanorana parkeri, gut microbiota, fecal samples, metabarcoding, 16S rRNA gene.

                            Introduction                                  ous microbiome (McKenzie et al. 2012, Kueneman et al.
                                                                          2019), often in the context of its effects on pathogenic fungi
Many studies have targeted the composition, dynamics and                  causing amphibian declines (Bletz et al. 2013, Walke &
highlighted the health relevance of the human gut micro-                  Belden 2016). In particular, work on the amphibian gut
biome (e.g. Clemente et al. 2012, Tuddenham & Sears                       microbiome is scarce (Bletz et al. 2016, Weng et al. 2016,
2015). Likewise, animal-associated microbial communi-                     Knutie et al. 2017, Fontaine et al. 2018, Huang et al. 2018,
ties play important roles in the biology and health of their              Lyra et al. 2018, Wiebler et al. 2018) but of substantial bio-
hosts (McFall-Ngai et al. 2013), including food degrada-                  logical interest especially in frogs, given the drastic restruc-
tion and energy harvest (Tremaroli & Bäckhed 2012),                       turing of the gut during metamorphosis from a largely her-
immunity regulation (Round & Mazmanian 2009), and                         bivorous tadpole to an exclusively carnivorous frog (Kohl
physical development (Sommer & Bäckhed 2013). These                       et al. 2013, Vences et al. 2016).
studies are typically based on high-throughput sequencing                    Understanding which factors influence microbiomes
(HTS) of short 16S rRNA gene amplicons, where signifi-                    at local and global scale is of importance to unravel gen-
cantly different composition and diversity patterns of the                eral biogeographic and macro-ecological trends (Amend
host-associated microbiomes are driven by host taxonomy,                  et al. 2013, Bahram et al. 2018b, Kueneman et al. 2019)
ecology and environment (Engel & Moran 2013, Kohl et                      and host-microbiome interactions (Reese & Dunn 2018),
al. 2014, Shapira 2016, Vences et al. 2016, Lyra et al. 2018,             including diseases. Sampling the microbiome of the intes-
Reese & Dunn 2018).                                                       tine is a moderately to strongly invasive approach, espe-
    While the intestinal microbiome of mammals has been                   cially in small animals where it requires killing the studied
the subject of numerous studies (e.g. Li et al. 2016a, 2016b,             individuals. Instead, samples of fresh feces are often used
Sonnenburg et al. 2016), research on microbiomes as-                      and the fecal microbiome is considered as representative
sociated with amphibians is still in its infancy. Work on                 of the gut microbiome (e.g. Reese & Dunn 2018, Zierer
this vertebrate group has typically focused on the cutane-                et al. 2018). However, indications exist that fecal character-
© 2021 Deutsche Gesellschaft für Herpetologie und Terrarienkunde e.V. (DGHT), Mannheim, Germany
96 access at http://www.salamandra-journal.com
Open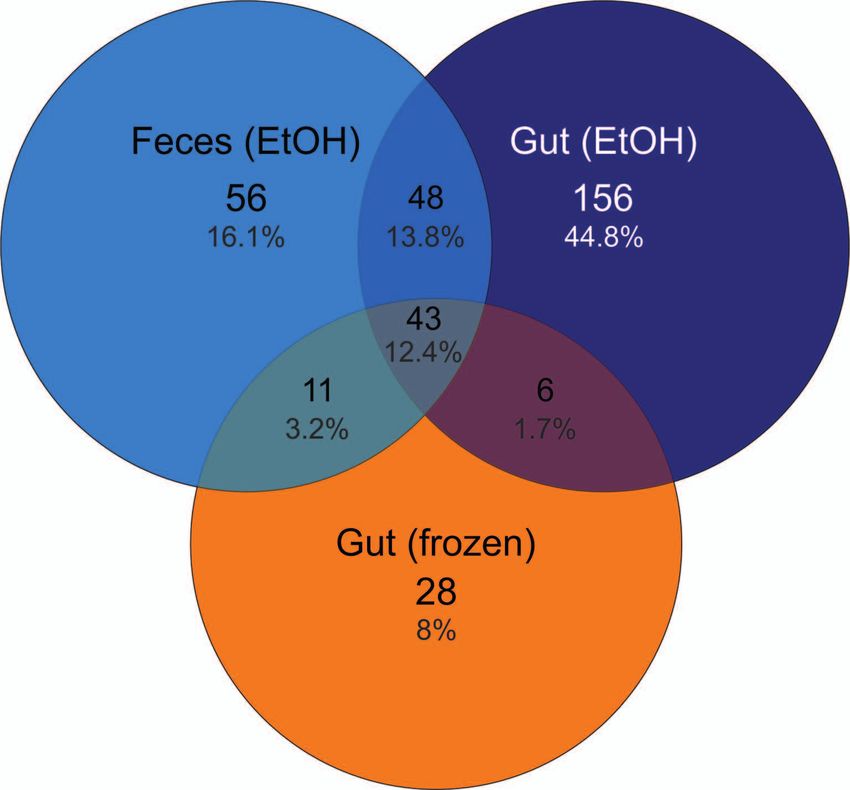
Microbiomes from feces vs. gut in tadpoles
istics influence the composition and richness of detected ing of the specimens was reported to the animal welfare
microbiota (Falony et al. 2018). Therefore, it is uncertain officer of Technische Universität Braunschweig in compli-
to which extent the fecal microbiome may serve as proxy ance with German animal welfare law, section 4(3). We col-
for the gut microbiome across hosts, and whether commu- lected the feces accumulated in the bags using pipettes, as
nities from feces and gut samples are fully comparable (e.g. well as a portion of hindgut of every individual. In sum-
Ericsson et al. 2018). In particular, only few studies ad- mary, we obtained three replicate samples per specimen:
dress this question in tadpoles (Song et al. 2018). (1) feces, stored in 96% EtOH; (2) hindgut, stored in 96%
For large-scale analyses, especially meta-analyses of EtOH; (3) hindgut, frozen at -20°C right after collection
data sets originating from a diversity of sources, compa- (Fig. 1). Samples were frozen upon collection, but as typical
rability of data is a basic prerequisite. This refers not only for suboptimal fieldwork conditions, underwent two thaw-
to laboratory methods but also extends to sampling and ing-freezing cycles during transport to the lab, with tem-
sample preservation (Fricker et al. 2019). Thus, a further peratures of 10–15°C for a limited time (< 12 h each time).
factor influencing the inference of microbiome composi- In the laboratory, all samples were stored at -20ºC until
tion from high-throughput sequencing of amplicons is the further processing.
method of sample preservation. Freezing samples at -20°C
immediately upon collection has been defined as the gold
standard to ensure the microbial community does not Molecular analysis
change until DNA extraction (Song et al. 2016). Keeping
samples uninterruptedly at this temperature is however Following the manufacturer’s instructions, DNA was ex-
not always possible under difficult field conditions, which tracted using a DNeasy PowerSoil Kit (QIAGEN, Germa-
might lead to alterations of the microbial community com- ny). PCR was performed using the forward primer 515F
position during episodes of thawing (Choo et al. 2015). (5’-GTGCCAGCMGCCGCGGTAA-3’) and reverse prim-
In our study, we tested the effect of sampling substrate, er 806R (5’-GGACTACHVGGGTWTCTAAT-3’) to target
feces vs. hindgut, to characterize the gut microbiota of tad- the V4 region of 16S rRNA gene (Caporaso et al. 2011).
poles of the High Himalaya frog (Nanorana parkeri, Di- The used primer and tag (unique molecular identifier for
croglossidae). In addition, we compared the similarity of multiplexing) combinations for each sample are specified
the detected microbiota using freezing vs. ethanol (EtOH) in Supplementary Table S2. For PCR, the 25 µl mixture per
preservation method of the samples from the same spec- sample comprised of 2 µl DNA (3 µl for repeated samples),
imens. The sample types per specimen included EtOH- 0.5 µl each of the primer (10 µM), 4 µl 5× HOT FirePol®
stored feces, EtOH-stored gut and frozen gut samples. As Blend Master Mix (Solis BioDyne, Tartu, Estonia) and the
feces samples are widely considered to reflect gut micro rest of the volume was filled with sterile dH2O. PCR was
biota, we expected similar richness and community pat- carried out in two replications in the following thermocy-
terns from the EtOH-stored feces and gut samples. In this cling conditions: an initial 15 min at 95°C, followed by 35
study, the frozen gut samples were exposed to thawing epi- cycles of 94°C for 45 s, 50ºC for 60 s, 72°C for 90 s, and a fi-
sodes during sample transport from the remote location, nal cycle of 10 min at 72°C. PCR products per sample were
thus we predicted a skewed microbial community compo- pooled and their relative quantity was estimated during
sition in comparison with EtOH-stored gut samples and gel electrophoresis of 5 µl DNA sample on 1% agarose gel.
tested the extent and constancy of this effect. Based on gel band intensity, all PCR products were pooled
at approximately equimolar concentration. The DNA li-
brary was purified using Favor-Prep™ Gel/PCR Purifica-
Methods tion Kit (Favorgen-Biotech Corp., Vienna, Austria), fol-
Study site and sampling methods lowing the manufacturer’s instructions. Sequencing was
performed on an Illumina MiSeq instrument (2×250) us-
Tadpoles of Nanorana parkeri in Gosner stages (Gosner ing the MiSeq Reagent Kit v2. Steps of DNA extraction,
1960) 26–30 were collected on 2 July 2018 from the cen- PCR and sequencing included both negative and positive
tral Qinghai-Tibetan Plateau, China, in a small pond di- controls (Supplementary Table S2). Sequencing data (in-
rectly nearby a small tributary stream, in the area of Lake cluding control samples) have been deposited in the Se-
Nam Co (30.82840° N, 91.06397° E; 4,740 m above sea lev- quence Read Archive (SRA): BioProject ID PRJNA533915.
el). Tadpoles were collected using dip nets and placed indi-
vidually into sterile Whirl-Pak bags together with a small
amount of clean water from the respective water bodies. A Bioinformatics
pond water control sample was collected by dipping a ster-
ile swab into the water, placing it into a cryotube and freez- The paired-end sequence data was processed in QIIME
ing it (list of taxa found from pond water are outlined in (v1.9.0; Caporaso et al. 2010) using the Environmen-
Supplementary Table S1). Specimens were kept overnight tal Microbiome and Bioinformatic Analysis Platform of
(ca. 14 h) in the bags, anesthetized with tricaine methane School of Public Health in Lanzhou University. Data anal-
sulfonate (MS222; Sigma-Aldrich, St. Louis, MO, USA) so- ysis methods were as described previously (Li et al. 2016b).
lution and subsequently overdosed using MS222. Sacrific- Briefly, paired-end sequences were joined using Flash soft-
97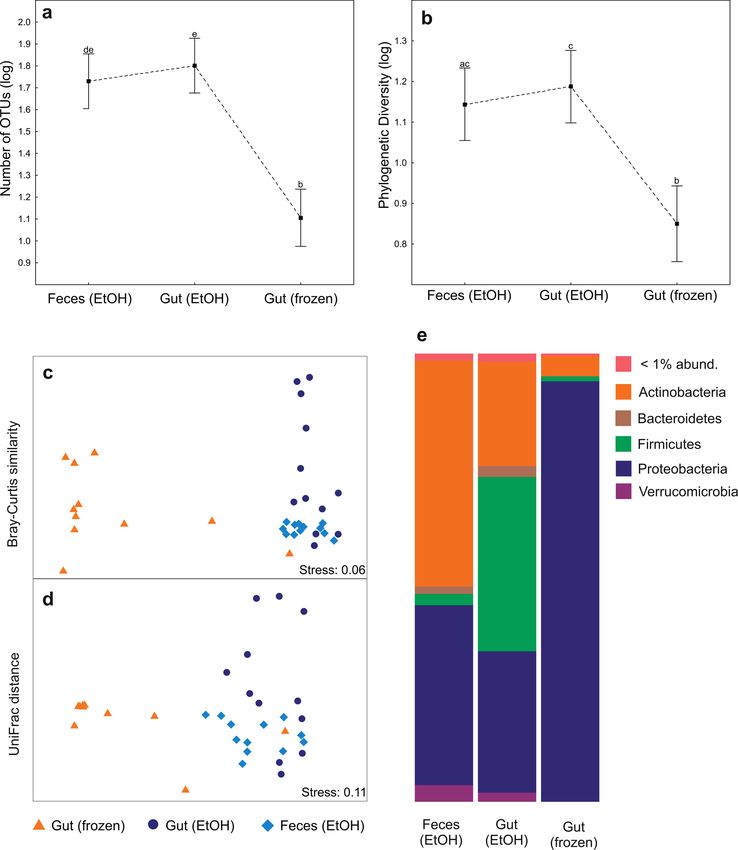
Sten Anslan et al.

ware (v1.2.8; Magoc & Salzberg 2011). Those sequences               al scaling (NMDS) graphs, we used Hellinger-transformed
with length < 300 bp, average base quality score < 30 or            Bray-Curtis as well as UniFrac distance (unweighted) OTU
ambiguous bases, were removed for the downstream anal-              matrices. UniFrac distance and PD were calculated by ap-
ysis. The Uchime algorithm (Edgar et al. 2011) was used to          plying the PhyloMeasures package (v2.1; Tsirogiannis
filter out potential chimeric reads. The filtered sequences         & Sandel 2016) in R (R Core-Team 2020) using a Maxi-
were clustered into operational taxonomic units (OTUs)              mum-Likelihood based phylogenetic 16Sr RNA gene tree
at a 97% identity threshold using UCLUST algorithm                  generated with RAxML (Stamatakis 2014). The similar-
(Edgar 2010). Taxonomy was assigned using the Ribos-                ity between Hellinger-transformed Bray-Curtis distance
omal Database Project classifier (Wang et al. 2007). OTUs           based NMDS ordinations of each sample type was test-
not classifying to Bacteria, Eukaryota and Archaea line-            ed using Procrustes analyses using the R-package ‘vegan’
ages, were removed. Although Archaea may represent an               (Oksanen et al. 2015). We used indicator species analysis
important part of gut microbiome (Raymann et al. 2017),             (‘indicspecies’ v1.7.6 package in R; De Caceres et al. 2016)
we removed this group from the analyses because of the              to determine which OTUs are significantly (using 9,999
low specificity of the used primers (515F/806R) to Archaea          permutations) associated with particular sample types. A
(Bahram et al. 2018a, Raymann et al. 2017) (our data set            Venn diagram of shared OTUs between sample types was
contained < 0.001% of Archaea sequences). To account for            created using mothur (Schloss et al. 2009).
the unequal sequencing depth, each sample was rarefied to
the same number of reads (5,654 sequences). The latter led
to discarding one of the frozen gut sample from the down-                                       Results
stream analysis. The OTU table was further filtered to re-
move singleton OTUs and low-abundance read records of               Our analysis comprised samples of 12 individual tadpoles
OTUs per sample (< 10 reads). After these steps, cyanobac-          (Fig. 1). Replicate samples of EtOH-stored feces, EtOH-
terial OTUs were removed from the analysis as these taxa            stored gut and frozen gut per specimen demonstrated sig-
likely do not represent true gut microbiota (e.g. Nostoco-          nificant (Kruskal-Wallis test: P < 0.001) and high (3.8-fold)
phycideae, Synechococcophycideae, Oscillatoriophycideae             OTU richness variability (Supplementary Fig. S1). This
(Patzelt et al. 2014)). Additionally, taxa that were assigned       pattern was driven by the frozen gut samples that exhibited
to ‘mitochondria’, were also excluded from the analyses as          significantly lower OTU richness and phylogenetic diver-
potential mitochondrial reads of the host itself. The filtered      sity (PD) values as compared to the other samples (Figs 2a–
OTU table used for the analyses is specified in Supplemen-          b). Consequently, there was no strong positive sample by
tary Table S3.                                                      sample correlation of the detected OTU richness between
                                                                    frozen gut and other treatments (Spearman R = 0.179, P =
                                                                    0.599 for gut (EtOH) vs. gut (frozen); Spearman R = -0.378,
                      Statistical analysis                          P = 0.251 for feces (EtOH) vs. gut (frozen); Supplementary
                                                                    Fig. S2). This correlation was highest between EtOH pre-
The effect of sample type (EtOH-stored feces, EtOH-stored           served samples (gut vs. feces; Spearman R = 0.494), how-
gut and frozen gut) on log-transformed OTU richness and             ever, the association was statistically non-significant (P =
phylogenetic diversity (PD) were tested using Kruskal-              0.103; Supplementary Fig. S2).
Wallis analysis. OTU richness correlation analyses be-                 The communities of detected microbiota were signifi-
tween samples types were performed using Spearman rank              cantly different between sample types (PERMANOVA
correlation analysis. The effect of these factors on the bac-       P < 0.001; Table 1; Figs 2c–d; Fig. 3). EtOH-stored sam-
terial OTU composition was analyzed using PERMANO-                  ples vs. frozen gut samples demonstrated to harbor low
VA+ (Anderson 2005) with 9,999 permutations (Type III               proportions of shared OTUs, 14.1% and 15.6% (Fig. 4) for
SS) in PRIMER v6 (Clarke & Gorley 2006). For the                    EtOH-stored gut vs. frozen and EtOH-stored feces vs. fro-
PERMANOVA analysis and non-metric multidimension-                   zen gut samples, respectively. Accordingly, based on the

Figure 1. Illustration of the study design. Three treatments: ethanol (EtOH) stored feces and gut, and frozen gut samples of Nanorana
parkeri. Note that the frozen samples went through thawing episodes during sample transport from the field to the laboratory.

98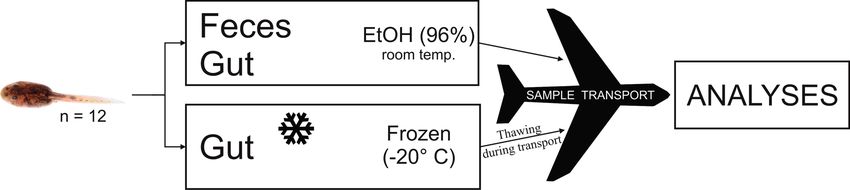
Microbiomes from feces vs. gut in tadpoles

Table 1. PERMANOVA results for Nanorana parkeri samples             0.346 (P = 0.474) and 0.370 (P = 0.370) for EtOH-stored
with factor sample type (EtOH-stored feces, EtOH-stored gut         gut vs. frozen gut and EtOH-stored feces vs. frozen gut
and frozen gut). PW denote pairwise comparison between EtOH-        samples, respectively. The highest similarity, but margin-
stored gut and frozen gut (PW1), EtOH-stored feces and fro-         ally non-significant Procrustes correlation was observed
zen gut (PW2), EtOH-stored feces and EtOH-stored gut (PW3)
samples.
                                                                    between EtOH-stored feces and EtOH-stored gut samples
                                                                    (Procrustes correlation = 0.523, P = 0.072). The proportion
                                                                    of shared OTUs between the latter sample types was 26.2%
OTU matrix       R²adj       P     P, PW1     P, PW2    P, PW3      (Fig. 4).
Bray-Curtis      0.470
Sten Anslan et al.
no OTUs were assigned to be specific for sample combi- Discussion
nations with frozen gut samples (i.e. EtOH-stored feces +
frozen gut, EtOH-stored gut + frozen gut) (Supplementary As the number of DNA sequences of environmental or
Table S4). This further suggests an overall higher similar- host-associated samples in public databases increase and
ity of the two types of EtOH-stored samples, which is also acquiring such data becomes a routine approach in micro-
evident from the NMDS graphs (Figs 2c–d). bial ecology, meta-analyses of comprehensive “big data”
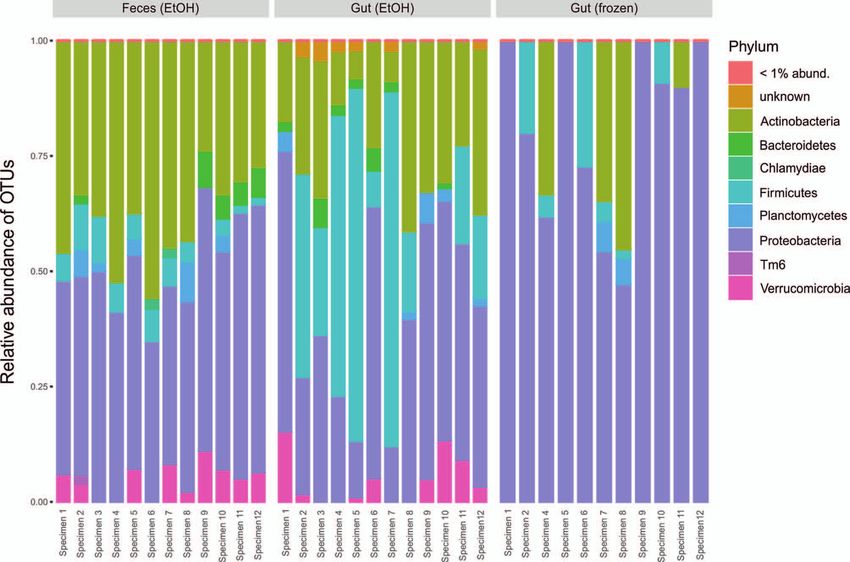
Frozen gut samples showed a consistent increase of sets is becoming a promising research direction, leading
Proteobacteria (sequence abundance; Fig. 2e), which was to important insights into general patterns of bacterial di-
mainly caused by ten of the indicator OTUs, all belong- versity (Adams et al. 2015, Gonzalez et al. 2018, Rocca et
ing to the Gammaproteobacteria: two undetermined al. 2018, Kueneman et al. 2019). However, considering the
Aeromonadaceae, two undetermined Enterobacteriace- many technical factors influencing the outcome of ampli-
ae, two Klebsiella (Enterobacteriaceae), two Pseudomonas con analyses, including sample preservation, DNA extrac-
(Pseudomonadaceae), and two Shewanella (Shewanel- tion, PCR conditions and sequencing methods (Goodrich
laceae). These OTUs represented a very high proportion et al. 2014, Clooney et al. 2016, Anslan et al. 2018), it is of
of reads in the frozen gut samples (90.1%), but most of high importance to ascertain that such meta-analyses in-
them were completely absent from all of the other sample deed recover biological patterns and not methodological
types. EtOH-stored gut samples, however, showed high- differences among studies.
est relative abundance of Firmicutes (sequence abundance; Our study exemplifies that the recovery of host-asso-
Fig. 2e). This pattern was particularly driven by Clostridia ciated microbiota richness and community structure may
of which 25 OTUs were identified as indicators, and thus vary among sampling substrates. The two EtOH-stored
were relatively more abundant in the gut (EtOH) samples substrates, gut content recovered by dissection and fecal
(Supplementary Table S4), forming 26.4% of the reads on samples, overall, revealed rather consistent patterns of
EtOH-stored gut samples. OTU richness and phylogenetic diversity. However, con-
sidering community composition, important differenc-
es between gut and fecal samples were apparent, where
Figure 3. Relative abundance of bacterial OTUs in all samples.
100Microbiomes from feces vs. gut in tadpoles
only about one fourth of the OTUs was shared between lights also the effect of DNA extraction method on the re-
these sample types (Fig. 4). Similarly, Zhou et al. (2020) covered microbial composition, which has been reported
recently reported that the microbial composition from fe- in several other studies (e.g. Chapagain et al. 2019, Fie-
cal samples of adult cane toads (Rhinella marina) were sig- dorova et al. 2019). Althogether, it is obvious that merg-
nificantly different from the intestine (gut) samples. Simi- ing results based on these different types of substrates (gut
lar results were found by Griffin et al. (2020) by studing and feces) for a meta-analyses may introduce biases, and
blue mussels (Mytilus edulis), where they discourage the thus they should be combined with great caution, and only
use of fecal samples to explore the gut microbial commu- when large differences between hosts are expected (which
nities. One factor affecting the community difference be- then would override the influences of methodology and
tween gut and feces could be the exposure to oxygen upon substrate).
leaving the intestinal tract (Rago et al. 2017). Although An even more divergent pattern was found between
we included a pond water control in our study to account commonly used sample preservation methods (EtOH
for external contamination, the exposure to environmen- vs. freezing), with enormous differences both in bacteri-
tal contamination of fecal samples may further have fa- al richness and community structure. Consistently, in al-
cilitated the changes in microbial composition associated most all individual tadpole (frozen) gut samples, Proteo-
with feces samples (Song et al. 2018, Griffin et al. 2020). bacteria had enormously increased relative abundances,
In this study and previous studies by Zhou et al. (2020) whereas relative abundances of Firmicutes and Verruco
and Griffin et al. (2020), a single DNA extraction meth- microbia were much lower (Fig. 2e; Fig. 3) compared to the
od was applied, but by utilizing two different DNA extra- EtOH-preserved samples. As summarized by Kohl (2017),
cion methods to study the gut microbiota of the Asiatic blooming of certain taxa can change the composition of
toad tadpoles (Bufo gargarizans), Song et al. (2018) report- gut or fecal bacterial communities (Choo et al. 2015, Beck-
ed contrasting results. The results from samples subjected ers et al. 2017). We hypothesize this is what happened in
to TIANamp stool DNA kit demonstrated significant dif- our samples upon thawing periods during sample trans-
ferences between gut and feces, but interestingly, samples port. The blooming hypothesis is also supported by the fact
subjected to phenol-chloroform DNA extraction exhibited that the Proteobacteria increase was caused by a limited
consistent microbial community composition patterns be- number of bacterial OTUs, and most strongly influenced
tween these two sample types. Based on these results, the by only seven OTUs. Moreover, these OTUs were totally
authors suggested that feces of amphibian tadpoles may be absent from the EtOH-stored Nanorana gut samples. How-
effectively used to study their gut microbiota. This high- ever, several studies on soil, human- and insect-associated
microbiomes have revealed that differences among preser-
vation methods are smaller than those between taxa and
individuals, thus validating meta-analyses based on differ-
ently stored samples (Lauber et al. 2010, Dominianni et
al. 2014, Hammer et al. 2015, Blekhman et al. 2016, Song
et al. 2016). A study about sample preservation methods of
fecal microbiota of spider monkeys revealed that the mi-
crobial community composition of EtOH-stored and fro-
zen samples were similar to fresh ones (Hale et al. 2015).
Thus, it is expected that the latter sample storing methods
are producing comparable results. Furthermore, a study on
insect-associated microbiomes has suggested that the sam-
ple storage method (freezing, ethanol, dimethyl sulfoxide,
cetrimonium bromide, storage without any preservative)
has no or minor effect on microbiome composition (Ham-
mer et al. 2015). However, under typical field sampling
conditions, such as in this study, continuous deep-freez-
ing of samples cannot be always ensured, which implies the
possibility of radical effects on gut microbiomes. Sampling
ungulate feces in the wild, Menke et al. (2015) observed
only moderate shifts of the microbiome during 2–4 days
but radical changes afterwards, usually following rain. On
Figure 4. Venn diagram of shared OTUs between sample types. the contrary, Beckers et al. (2017) observed an important
Total number of OTUs is 348. The number of OTUs in feces decrease in bacterial diversity in horse feces already after
(EtOH), gut (EtOH) and gut (frozen) samples is 158, 253 and 88,
respectively. The number of shared OTUs between feces (EtOH) approximately 4 hours. A significant decrease of Bacteroi
and gut (EtOH) is 91 (26.2%). The number of shared OTUs be- detes has been reported from fecal samples (of humans and
tween feces (EtOH) and gut (frozen) samples is 54 (15.6%), and monkeys) exposed to room temperature or to natural en-
49 (14.1%) between gut (EtOH) and gut (frozen) samples. Total vironmental conditions (Roesch et al. 2009, Hale et al.
numbers of shared OTUs is 43 (12.4%). 2016), which we also found to be the case for the frozen
101Sten Anslan et al.
samples that were exposed to thawing in current study. Amend, A. S., T. A. Oliver, L. A. Amaral‐Zettler, A. Boe-
Our study confirms that in certain cases, a rise of “bloom” tius, J. A. Fuhrman, M. C. Horner‐Devine, S. M. Huse, D.
bacteria can completely obscure the original microbiome B. M. Welch, A. C. Martiny & A. Ramette (2013): Macro
composition in the samples, and several bacterial families ecological patterns of marine bacteria on a global scale. – Jour-
nal of Biogeography, 40: 800–811.
might be particularly prone to contain such rapid growth
taxa; for instance, Enterobacteriaceae and Pseudomonada Anderson, M. J. (2005): Permutational multivariate analysis of
ceae were associated with microbiome shifts both in this variance. – University of Auckland, Auckland.
study and in that of Beckers et al. (2017). Anslan, S., R. H. Nilsson, C. Wurzbacher, P. Baldrian, L.
Tedersoo & M. Bahram (2018): Great differences in per-
formance and outcome of high-throughput sequencing data
analysis platforms for fungal metabarcoding. – MycoKeys, 39:
Conclusion
29–40.
Our case study confirms that both substrate (gut content Bahram, M., S. Anslan, F. Hildebrand, P. Bork & L. Teder-
soo (2018a): Newly designed 16s rRNA metabarcoding prim-
vs. feces) and preservation method can influence the anal-
ers amplify diverse and novel archaeal taxa from the environ-
ysis of intestinal microbiomes, and provides an example ment. – Environmental Microbiology Reports, 11: 487–494.
from tadpoles. Differences between substrates and preser-
Bahram, M., F. Hildebrand, S. K. Forslund, J. L. Ander-
vation methods are here shown for samples from exactly
son, N. A. Soudzilovskaia, P. M. Bodegom, J. Bengtsson-
the same individuals, sampled at the same time point, thus Palme, S. Anslan, L. P. Coelho & H. Harend (2018b): Struc-
excluding these factors that might influence microbiome ture and function of the global topsoil microbiome. – Nature,
structure. Although non-invasive collection of feces may 560: 233–237.
be preferred over dissection for ethical reasons, it is im- Beckers, K. F., C. J. Schulz & G. W. Childers (2017): Rapid re-
portant to acknowledge the recovery of potentially differ- growth and detection of microbial contaminants in equine fe-
ent microbiome communities between these treatments, cal microbiome samples. – PLoS ONE, 12: e0187044.
as demonstrated in this study. When using fecal samples, Blekhman, R., K. Tang, E. A. Archie, L. B. Barreiro, Z. P.
one must be also aware of environmental contaminations Johnson, M. E. Wilson, J. Kohn, M. L. Yuan, L. Gesquiere
of these samples, which could be minimized by collecting & L. E. Grieneisen (2016): Common methods for fecal sample
control samples in the immediate environment. Although storage in field studies yield consistent signatures of individual
the latter was attempted in our study, significant differ- identity in microbiome sequencing data. – Scientific Reports,
ences between microbial composition of gut and feces 6: 31519.
were still obvious. Emphasizing the thawing cycles of fro- Bletz, M. C., D. J. Goedbloed, E. Sanchez, T. Reinhardt, C.
zen samples, the strongest differences were found between C. Tebbe, S. Bhuju, R. Geffers, M. Jarek, M. Vences & S.
preservation methods and demonstrate that blooming of Steinfartz (2016): Amphibian gut microbiota shifts differ-
contaminant taxa can completely distort the bacterial com- entially in community structure but converges on habitat-
munity in samples of intestinal microbiome of aquatic ver- specific predicted functions. – Nature Communications, 7:
13699.
tebrates, within only a few hours of thawing as it is com-
mon under field conditions. Bletz, M. C., A. H. Loudon, M. H. Becker, S. C. Bell, D. C.
Woodhams, K. P. Minbiole & R. N. Harris (2013): Mitigat-
ing amphibian chytridiomycosis with bioaugmentation: Char-
Acknowledgments acteristics of effective probiotics and strategies for their selec-
tion and use. – Ecology Letters, 16: 807–820.
We are indebted to numerous colleagues, in particular Magnus Caporaso, J. G., J. Kuczynski, J. Stombaugh, K. Bittinger,
Asmussen, Nicole Börner, Andrew Henderson, Wengang F. D. Bushman, E. K. Costello, N. Fierer, A. G. Peña, J.
Kang, Antje Schwalb, and Anja Schwarz for their help during K. Goodrich & J. I. Gordon (2010): Qiime allows analysis
fieldwork; and to the team of the NAMORS station of the Insti- of high-throughput community sequencing data. – Nature
tute of Tibetan Plateau Research of the Chinese Academy of Sci- Methods, 7: 335–336.
ences, in particular Guangjian Wu, for logistic support. SA and Caporaso, J. G., C. L. Lauber, W. A. Walters, D. Berg-Lyons,
MV were funded through the Deutsche Forschungsgemeinschaft C. A. Lozupone, P. J. Turnbaugh, N. Fierer & R. Knight
(DFG; grant 317513741) via the International Research Training (2011): Global patterns of 16s rRNA diversity at a depth of mil-
Group 2309, “Geoecosystems in transition on the Tibetan Pla- lions of sequences per sample. – Proceedings of the National
teau” (TransTiP). The permission for the study was obtained via Academy of Sciences, 108: 4516–4522.
Institute of Tibetan Plateau Research (Chinese Academy of Sci-
ences) from Tibet Autonomous Region Government (issued on Chapagain, P., B. Arivett, B. M. Cleveland, D. M. Walker &
19 June 2018). M. Salem (2019): Analysis of the fecal microbiota of fast-and
slow-growing rainbow trout (Oncorhynchus mykiss). – BMC
Genomics, 20: 788.
References Choo, J. M., L. E. Leong & G. B. Rogers (2015): Sample storage
conditions significantly influence faecal microbiome profiles.
Adams, R. I., A. C. Bateman, H. M. Bik & J. F. Meadow (2015): – Scientific Reports, 5: 16350.
Microbiota of the indoor environment: A meta-analysis. – Clarke, K. & R. Gorley (2006): Primer v6: User manual/tuto-
Microbiome, 3: 49. rial. – Primer-E Ltd. Plymouth, 192 pp.
102Microbiomes from feces vs. gut in tadpoles
Clemente, J. C., L. K. Ursell, L. W. Parfrey & R. Knight Hale, V. L., C. L. Tan, K. Niu, Y. Yang, D. Cui, H. Zhao, R.
(2012): The impact of the gut microbiota on human health: An Knight & K. R. Amato (2016): Effects of field conditions on
integrative view. – Cell, 148: 1258–1270. fecal microbiota. – Journal of Microbiological Methods, 130:
Clooney, A. G., F. Fouhy, R. D. Sleator, A. O’Driscoll, C. 180–188.
Stanton, P. D. Cotter & M. J. Claesson (2016): Compar- Hammer, T. J., J. C. Dickerson & N. Fierer (2015): Evidence-
ing apples and oranges?: Next generation sequencing and its based recommendations on storing and handling specimens
impact on microbiome analysis. – PLoS ONE, 11: e0148028. for analyses of insect microbiota. – PeerJ, 3: e1190.
De Caceres, M., F. Jansen & M. M. De Caceres (2016): Package Huang, B.-H., C.-W. Chang, C.-W. Huang, J. Gao & P.-C. Liao
‘indicspecies’, ver. 1.7.6. – https://cran.r-project.org/web/pack- (2018): Composition and functional specialists of the gut
ages/indicspecies/index.html. microbiota of frogs reflect habitat differences and agricultural
Dominianni, C., J. Wu, R. B. Hayes & J. Ahn (2014): Compari- activity. – Frontiers in Microbiology, 8: 2670.
son of methods for fecal microbiome biospecimen collection. Knutie, S. A., C. L. Wilkinson, K. D. Kohl & J. R. Rohr (2017):
– BMC Microbiology, 14: 103. Early-life disruption of amphibian microbiota decreases later-
Edgar, R. C. (2010): Search and clustering orders of magnitude life resistance to parasites. – Nature Communications, 8: 86.
faster than blast. – Bioinformatics, 26: 2460–2461. Kohl, K. D. (2017): An introductory “how-to” guide for incorpo-
Edgar, R. C., B. J. Haas, J. C. Clemente, C. Quince & R. rating microbiome research into integrative and comparative
Knight (2011): Uchime improves sensitivity and speed of chi- biology. – Integrative and Comparative Biology, 57: 674–681.
mera detection. – Bioinformatics, 27: 2194–2200. Kohl, K. D., J. Amaya, C. A. Passement, M. D. Dearing & M.
Engel, P. & N. A. Moran (2013): The gut microbiota of insects– D. McCue (2014): Unique and shared responses of the gut
diversity in structure and function. – FEMS Microbiology Re- microbiota to prolonged fasting: A comparative study across
views, 37: 699–735. five classes of vertebrate hosts. – FEMS Microbiology Ecology,
90: 883–894.
Ericsson, A. C., J. Gagliardi, D. Bouhan, W. G. Spollen, S.
A. Givan & C. L. Franklin (2018): The influence of caging, Kohl, K. D., T. L. Cary, W. H. Karasov & M. D. Dearing (2013):
bedding, and diet on the composition of the microbiota in dif- Restructuring of the amphibian gut microbiota through met-
ferent regions of the mouse gut. – Scientific Reports, 8: 4065. amorphosis. – Environmental Microbiology Reports, 5: 899–
903.
Falony, G., S. Vieira-Silva & J. Raes (2018): Richness and eco-
system development across faecal snapshots of the gut micro- Kueneman, J. G., M. C. Bletz, V. J. McKenzie, C. G. Becker, M.
biota. – Nature Microbiology, 3: 526–528. B. Joseph, J. G. Abarca, H. Archer, A. L. Arellano, A. Ba-
taille & M. Becker (2019): Community richness of amphi
Fiedorová, K., M. Radvanský, E. Němcová, H. Grombiříková,
bian skin bacteria correlates with bioclimate at the global
J. Bosák, M. Černochová, M. Lexa, D. Šmajs & T. Frei
scale. – Nature Ecology & Evolution, 3: 381–389.
berger (2019): The impact of DNA extraction methods on
stool bacterial and fungal microbiota community recovery. – Lauber, C. L., N. Zhou, J. I. Gordon, R. Knight & N. Fierer
Frontiers in Microbiology, 10: 821. (2010): Effect of storage conditions on the assessment of bacte-
rial community structure in soil and human-associated sam-
Fontaine, S. S., A. J. Novarro & K. D. Kohl (2018): Environ-
ples. – FEMS Microbiology Letters, 307: 80–86.
mental temperature alters the digestive performance and gut
microbiota of a terrestrial amphibian. – Journal of Experimen- Li, H., T. Li, M. Yao, J. Li, S. Zhang, S. Wirth, W. Cao, Q. Lin &
tal Biology, 221: jeb187559. X. Li (2016a): Pika gut may select for rare but diverse environ-
mental bacteria. – Frontiers in Microbiology, 7: 1269.
Fricker, A. M., D. Podlesny & W. F. Fricke (2019): What is new
and relevant for sequencing-based microbiome research? A Li, H., J. Qu, T. Li, J. Li, Q. Lin & X. Li (2016b): Pika population
minireview. – Journal of Advanced Research, 19: 105–112. density is associated with the composition and diversity of gut
microbiota. – Frontiers in Microbiology, 7: 758.
Griffin, T. W., J. G. Baer & J. E. Ward (2020): Direct compari-
son of fecal and gut microbiota in the blue mussel (Mytilus Lyra, M. L., M. C. Bletz, C. F. B. Haddad & M. Vences (2018):
edulis) discourages fecal sampling as a proxy for resident gut The intestinal microbiota of tadpoles differs from those of syn-
community. – Microbial Ecology, in press. topic aquatic invertebrates. – Microbial Ecology, 76: 121–124.
Gonzalez, A., J. A. Navas-Molina, T. Kosciolek, D. McDon- Magoc, T. & S. L. Salzberg (2011): Flash: Fast length adjustment
ald, Y. Vázquez-Baeza, G. Ackermann, J. DeReus, S. Jans- of short reads to improve genome assemblies. – Bioinformat-
sen, A. D. Swafford & S. B. Orchanian (2018): Qiita: Rapid, ics, 27: 2957–2963.
web-enabled microbiome meta-analysis. – Nature Methods, McFall-Ngai, M., M. G. Hadfield, T. C. Bosch, H. V. Carey,
15: 796–798. T. Domazet-Lošo, A. E. Douglas, N. Dubilier, G. Eberl, T.
Goodrich, J. K., S. C. Di Rienzi, A. C. Poole, O. Koren, W. Fukami & S. F. Gilbert (2013): Animals in a bacterial world, a
A. Walters, J. G. Caporaso, R. Knight & R. E. Ley (2014): new imperative for the life sciences. – Proceedings of the Na-
Conducting a microbiome study. – Cell, 158: 250–262. tional Academy of Sciences, 110: 3229–3236.
Gosner, K. L. (1960): A simplified table for staging anuran em- McKenzie, V. J., R. M. Bowers, N. Fierer, R. Knight & C. L.
bryos and larvae with notes on identification. – Herpetologica, Lauber (2012): Co-habiting amphibian species harbor unique
16: 183–190. skin bacterial communities in wild populations. – The ISME
Hale, V. L., C. L. Tan, R. Knight & K. R. Amato (2015): Effect of Journal, 6: 588.
preservation method on spider monkey (Ateles geoffroyi) fecal Menke, S., M. Meier & S. Sommer (2015): Shifts in the gut micro-
microbiota over 8 weeks. – Journal of Microbiological Meth- biome observed in wildlife faecal samples exposed to natural
ods, 113: 16–26. weather conditions: Lessons from time-series analyses using
103Sten Anslan et al.
next-generation sequencing for application in field studies. – induced extinctions in the gut microbiota compound over
Methods in Ecology and Evolution, 6: 1080–1087. generations. – Nature, 529: 212.
Oksanen, J., F. G. Blanchet, R. Kindt, P. Legendre, P. R. Stamatakis, A. (2014): Raxml version 8: A tool for phylogenetic
Minchin, R. O’hara, G. L. Simpson, P. Solymos, M. Ste- analysis and post-analysis of large phylogenies. – Bioinformat-
vens & H. Wagner (2015): Vegan: Community ecology pack- ics, 30: 1312–1313.
age, ver. 2.4-2. – https://cran.r-project.org/web/packages/ve- Tremaroli, V. & F. Bäckhed (2012): Functional interactions be-
gan/index.html tween the gut microbiota and host metabolism. – Nature, 489:
Patzelt, D. J., L. Hodač, T. Friedl, N. Pietrasiak & J. R. Jo- 242.
hansen (2014): Biodiversity of soil cyanobacteria in the hy- Tsirogiannis, C. & B. Sandel (2016): Phylomeasures: A package
per-arid atacama desert, chile. – Journal of Phycology, 50: for computing phylogenetic biodiversity measures and their
698–710. statistical moments. – Ecography, 39: 709–714.
R Core-Team (2020): R: A language and environment for statisti- Tuddenham, S. & C. L. Sears (2015): The intestinal microbiome
cal computing. – The R Foundation for Statistical Computing, and health. – Current Opinion in Infectious Diseases, 28: 464.
Vienna, Austria. http://www.R-project.org/. Vences, M., M. L. Lyra, J. G. Kueneman, M. C. Bletz, H. M.
Rago, L., P. Cristiani, F. Villa, S. Zecchin, A. Colombo, L. Archer, J. Canitz, S. Handreck, R.-D. Randrianiaina, U.
Cavalca & A. Schievano (2017): Influences of dissolved oxy- Struck, S. Bhuju, M. Jarek, R. Geffers, V. J. McKenzie, C.
gen concentration on biocathodic microbial communities in C. Tebbe, C. F. B. Haddad & J. Glos (2016): Gut bacterial
microbial fuel cells. – Bioelectrochemistry, 116: 39–51. communities across tadpole ecomorphs in two diverse tropi-
Raymann, K., A. H. Moeller, A. L. Goodman & H. Ochman cal anuran faunas. – The Science of Nature, 103: 25.
(2017): Unexplored archaeal diversity in the great ape gut Walke, J. B. & L. K. Belden (2016): Harnessing the microbiome
microbiome. – mSphere, 2: e00026-00017. to prevent fungal infections: Lessons from amphibians. – PLoS
Reese, A. T. & R. R. Dunn (2018): Drivers of microbiome bio- PATHOGENS, 12: e1005796.
diversity: A review of general rules, feces, and ignorance. – Wang, Q., G. M. Garrity, J. M. Tiedje & J. R. Cole (2007): Na-
mBio, 9: e01294-01218. ive bayesian classifier for rapid assignment of rRNA sequences
Rocca, J. D., M. Simonin, J. R. Blaszczak, J. G. Ernakovich, into the new bacterial taxonomy. – Applied and Environmen-
S. M. Gibbons, F. S. Midani & A. D. Washburne (2018): The tal Microbiology, 73: 5261–5267.
microbiome stress project: Toward a global meta-analysis of Weng, F. C.-H., Y.-J. Yang & D. Wang (2016): Functional analy-
environmental stressors and their effects on microbial com- sis for gut microbes of the brown tree frog (Polypedates mega-
munities. – Frontiers in Microbiology, 9: 3272. cephalus) in artificial hibernation. – BMC Genomics, 17: 1024.
Roesch, L. F., G. Casella, O. Simell, J. Krischer, C. H. Was Wiebler, J. M., K. D. Kohl, R. E. Lee Jr & J. P. Costanzo (2018):
serfall, D. Schatz, M. A. Atkinson, J. Neu & E. W. Trip Urea hydrolysis by gut bacteria in a hibernating frog: Evidence
lett (2009): Influence of fecal sample storage on bacterial for urea-nitrogen recycling in amphibia. – Proceedings of the
community diversity. – The Open Microbiology Journal, 3: 40. Royal Society B: Biological Sciences, 285: 20180241.
Round, J. L. & S. K. Mazmanian (2009): The gut microbiota Zhou, J., T. M. Nelson, C. Rodriguez Lopez, R. R. Sarma, S.
shapes intestinal immune responses during health and dis- J. Zhou & L. A. Rollins (2020): A comparison of nonlethal
ease. – Nature Reviews Immunology, 9: 313. sampling methods for amphibian gut microbiome analyses. –
Molecular Ecology Resources, 20: 844–855.
Schloss, P. D., S. L. Westcott, T. Ryabin, J. R. Hall, M. Hart-
mann, E. B. Hollister, R. A. Lesniewski, B. B. Oakley, D. Zierer, J., M. A. Jackson, G. Kastenmüller, M. Mangino, T.
H. Parks, C. J. Robinson, J. W. Sahl, B. Stres, G. G. Thal- Long, A. Telenti, R. P. Mohney, K. S. Small, J. T. Bell & C.
linger, D. J. Van Horn & C. F. Weber (2009): Introducing J. Steves (2018): The fecal metabolome as a functional readout
mothur: Open-source, platform-independent, community- of the gut microbiome. – Nature Genetics, 50: 790.
supported software for describing and comparing microbial
communities. – Applied and Environmental Microbiology, 75:
7537–7541. Supplementary materials
Shapira, M. (2016): Gut microbiotas and host evolution: Scaling
up symbiosis. – Trends in Ecology & Evolution, 31: 539–549. The following data are available online:
Sommer, F. & F. Bäckhed (2013): The gut microbiota-masters of Supplementary Figure S1. OTU richness of each replicate sample
host development and physiology. – Nature Reviews Micro per specimen.
biology, 11: 227. Supplementary Figure S2. Correlation scatterplots of OTU rich-
Song, S. J., A. Amir, J. L. Metcalf, K. R. Amato, Z. Z. Xu, G. ness (log transformed) for each sample type.
Humphrey & R. Knight (2016): Preservation methods dif- Supplementary Table S1. Bacterial OTUs that were identified
fer in fecal microbiome stability, affecting suitability for field from pond water control sample.
studies. – mSystems, 1: e00021-00016. Supplementary Table S2. Used primer combinations.
Song, X., J. Song, H. Song, Q. Zeng & K. Shi (2018): A ro- Supplementary Table S3. Table of bacterial OTUs by samples used
bust noninvasive approach to study gut microbiota structure for the analyses.
of amphibian tadpoles by feces. – Asian Herpetological Re-
Supplementary Table S4. Bacterial indicator OTUs per treatment
search, 9: 1–12G.
(or combination of treatments) of Nanorana parkeri samples.
Sonnenburg, E. D., S. A. Smits, M. Tikhonov, S. K. Higgin-
bottom, N. S. Wingreen & J. L. Sonnenburg (2016): Diet-
104You can also read