The impacts of EGCS
washwater discharges
on port water and
sediment
←
→
Page content transcription
If your browser does not render page correctly, please read the page content below

The impacts of EGCS washwater discharges on port water and sediment

The impacts of EGCS washwater
    discharges on port water and
    sediment

    This report was prepared by:
    Jasper Faber, Dagmer Nelissen Thomas Huigen, Hary Shanti (all CE Delft)
    Bert van Hattum and Frank Kleissen (both Deltares)

    Delft, CE Delft, December 2019

    Publication code: 19.4I09.141

    Shipping / Exhaust gases / Substances / Cleaning systems / Ports / Seas / Rivers / Sediment

    Client: Cruise Lines International Association (CLIA) Europe

    Publications of CE Delft are available from www.cedelft.eu

    Further information on this study can be obtained from the contact person Jasper Faber (CE Delft)

    © copyright, CE Delft, Delft

     CE Delft
     Committed to the Environment

     Through its independent research and consultancy work CE Delft is helping build a sustainable world. In the fields
     of energy, transport and resources our expertise is leading-edge. With our wealth of know-how on technologies,
     policies and economic issues we support government agencies, NGOs and industries in pursuit of structural
     change. For 40 years now, the skills and enthusiasm of CE Delft’s staff have been devoted to achieving this
     mission.

1   4.I09 - The impacts of EGCS washwater discharges on port water and sediment - December 2019
Content
Glossary 6
Foreword 7
Executive summary 8
1 Introduction 10
1.1 Outline of the report 12
2 Project methodology 13
2.1 Overall methodology 13
2.2 Define reference scenario for ship loading on the port 14
2.3 Calculation of mean emission factors for substances in the EGCS washwater 16
2.3.1 Sample data 16
2.3.2 Calculation of mean emission factors 18
2.3.3 Substance frequency of detection 21
2.4 Introduction to MAMPEC 22
2.4.1 Background 22
2.4.2 MAMPEC environment types 23
2.4.3 Environmental inputs 23
2.4.4 Predicted Environmental Concentrations (PEC) 24
2.4.5 Hydrodynamic exchange processes in MAMPEC 25
2.4.6 Spatial distribution of emissions in MAMPEC 26
2.4.7 MAMPEC Chemical and biological processes and inputs 27
2.4.8 The MAMPEC sediment compartment 27
2.5 Definition of port models 28
2.5.1 Port dimensions and hydrodynamic exchange 28
2.5.2 Standard OECD-EU Commercial Harbour 30
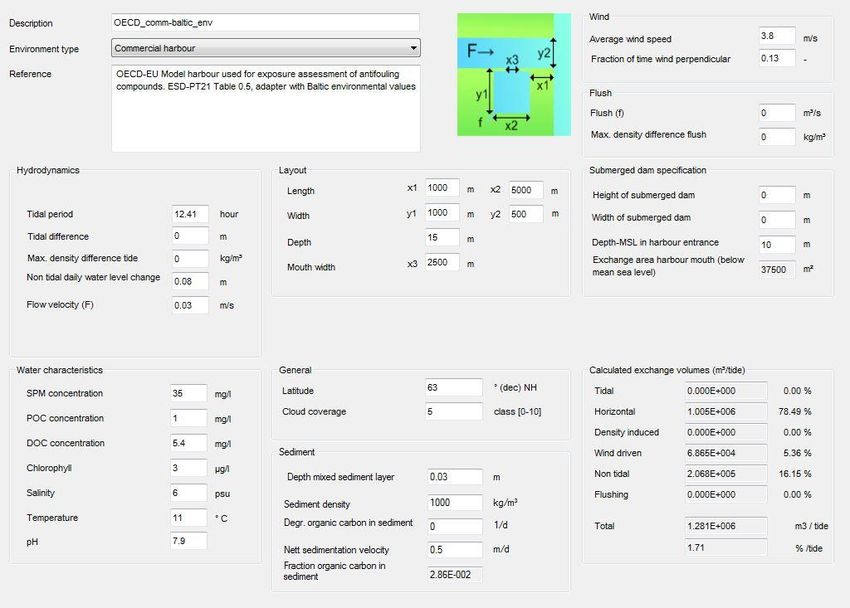
2.5.3 Baltic Commercial Port 31
2.5.4 Ocean Port 32
2.5.5 River Port 32
2.6 Conclusion 33
3 Results and evaluation 34
3.1 Water results and evaluation 34
3.1.1 Assess EGCS washwater samples against IMO washwater discharge criteria 34
3.1.2 Water concentrations absolute values 39
3.1.3 Water concentrations in comparison with EU Environmental Quality
Standards (EQS) 43
3.2 Sediment results and evaluation 46
3.2.1 Sediment concentrations absolute values 46
3.2.2 Compare sediment concentrations with national standards 49
4 Conclusions 53
2 4.I09 - The impacts of EGCS washwater discharges on port water and sediment - December 2019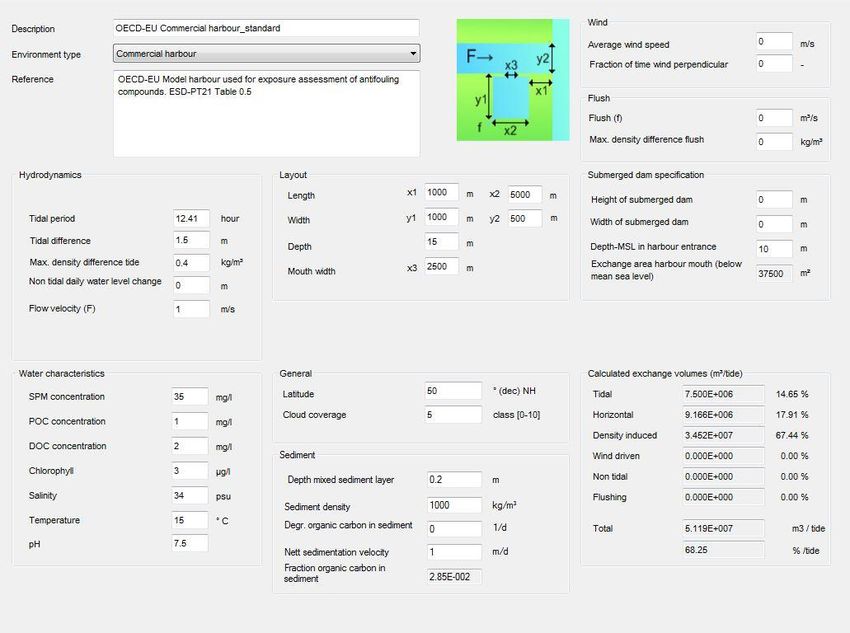
5   References                                                                                    54

A   MAMPEC-BW environment input screens                                                           56

B   MAMPEC chemical and biological processes and inputs                                           59

3   4.I09 - The impacts of EGCS washwater discharges on port water and sediment - December 2019
List of Figures
    Figure 1 - Maximum concentrations as a percentage of 2021 MAC-EQS limits (100% = MAC-EQS limit)    8
    Figure 2 - Methodology for calculation of predicted concentrations                                13
    Figure 3 - Frequency of the detection of metals (100% = all washwater samples)                    21
    Figure 4 - Frequency of the detection of PAHs (100% = all washwater samples)                      22
    Figure 5 - MAMPEC area designations for commercial harbour and marina type environments           24
    Figure 6 - MAMPEC area designations for open harbour type environment                             24
    Figure 7 - Spatial distribution of input substance load – commercial harbour type environment     26
    Figure 8 - Spatial distribution of input substance load – marina type environment                 26
    Figure 9 - Spatial distribution of input substance load – open harbour type environment           26
    Figure 10 - MAMPEC-BW concentrations of substances in the sediment                                28
    Figure 11 - Distribution of pH values of washwater samples                                        35
    Figure 12 - Distribution of Total PAHphe values of the washwater samples                          36
    Figure 13 - Distribution of Turbidity values of the washwater samples                             37
    Figure 14 - Distribution of Total Nitrogen content of the washwater samples                       38
    Figure 15 - Metals concentrations in the Standard OECD-EU Commercial Harbour                      39
    Figure 16 - PAH concentrations in the Standard OECD-EU Commercial Harbour                         40
    Figure 17 - Metals concentrations in the Baltic Commercial Port                                   40
    Figure 18 - PAH concentrations in the Baltic Commercial Port                                      41
    Figure 19 - Metals concentrations in the Ocean Port                                               41
    Figure 20 - PAH concentrations in the Ocean Port                                                  42
    Figure 21 - Metals concentrations in the River Port                                               42
    Figure 22 - PAH concentrations in the River Port                                                  43
    Figure 23 - Maximum concentrations as a percentage of 2021 MAC-EQS limits: All four model ports   44
    Figure 24 - Maximum concentrations as a percentage of 2021 MAC-EQS limits: North Sea model
                ports                                                                                 45
    Figure 25 - Mean concentrations as a percentage of 2021 AA-EQS limits: All four model ports       45
    Figure 26 - Mean concentrations as a percentage of 2021 AA-EQS limits: North Sea model ports      46
    Figure 27 - Maximum metals concentrations in the sediment after five years, all four ports,
                assuming zero background concentrations                                               47
    Figure 28 - Maximum metal concentrations in the sediment after five years, North Sea ports,
                assuming zero background concentrations                                               48
    Figure 29 - Maximum PAH concentrations in the sediment after five years, all four ports,
                assuming zero background concentrations                                               48
    Figure 30 - Maximum PAH concentrations in the sediment after five years, North Sea ports,
                assuming zero background concentrations                                               49
    Figure 31 - Maximum increase in concentration of metals in the sediment in the Standard OECD-EU
                Commercial Harbour as a percentage of three different standards for dredged
                materials                                                                             52
    Figure 32 - Maximum increase in concentration of PAHs in the sediment in the Standard OECD-EU
                Commercial Harbour as a percentage of three different standards for dredged
                materials (100% = criteria limit)                                                     52
    Figure 33 - Environment input screen for the Standard OECD-EU Commercial Harbour                  56
    Figure 34 - Environment input screen for the Baltic Commercial Port                               57
    Figure 35 - Environment input screen for the Ocean Port                                           57
    Figure 36 - Environment input screen for the River Port                                           58

4   4.I09 - The impacts of EGCS washwater discharges on port water and sediment - December 2019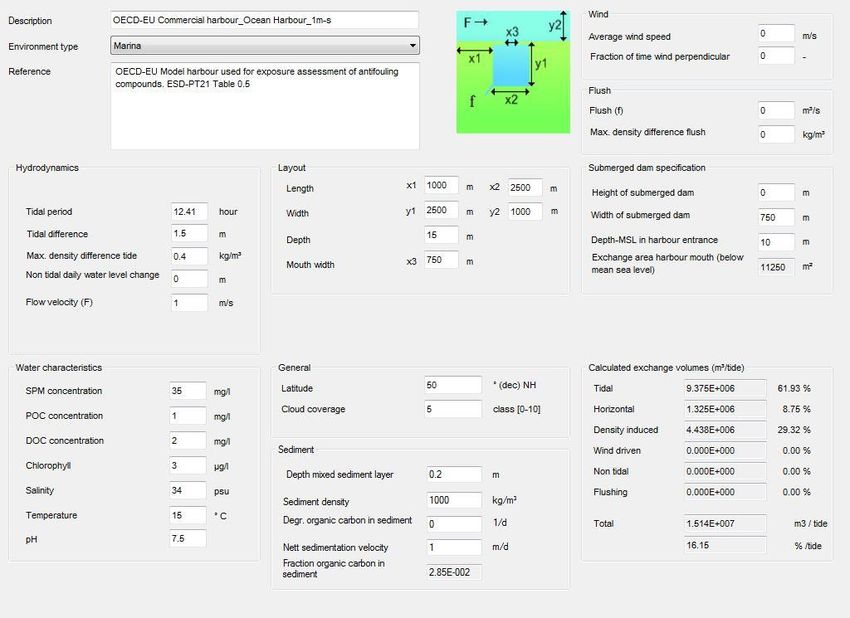
List of Tables
    Table 1 - Auxiliary load at-berth – sponsors information                                      14
    Table 2 - Auxiliary load at-berth – IMO GHG Study 2014                                        14
    Table 3 - Reference ship loading                                                              15
    Table 4 - Analysed Metals                                                                     17
    Table 5 - Analysed PAHs                                                                       17
    Table 6 - IMO Washwater analysis parameters                                                   17
    Table 7 - Logic for non-detects and detects                                                   19
    Table 8 - Average metal concentration increase in washwater samples                           19
    Table 9 - Average PAH concentration increase in washwater samples                             20
    Table 10 - MAMPEC environment types                                                           23
    Table 11 - Summary of four model ports                                                        29
    Table 12 - Port characteristics                                                               30
    Table 13 - IMO washwater criteria                                                             34
    Table 14 - pH of washwater samples                                                            35
    Table 15 - PAHphe of washwater samples                                                        36
    Table 16 - Turbidity of washwater samples                                                     37
    Table 17 - Total Nitrogen of washwater samples                                                38
    Table 18 - EU Water Framework Directive criteria for Inland Surface Waters                    44
    Table 19 - Standards for assessment of dredged materials for disposal (mg/kg dry weight)      50
    Table 20 - Substance CAS numbers                                                              59
    Table 21 - Substance property data                                                            60
    Table 22 - SPM-water distribution constants for trace metals                                  61

5   4.I09 - The impacts of EGCS washwater discharges on port water and sediment - December 2019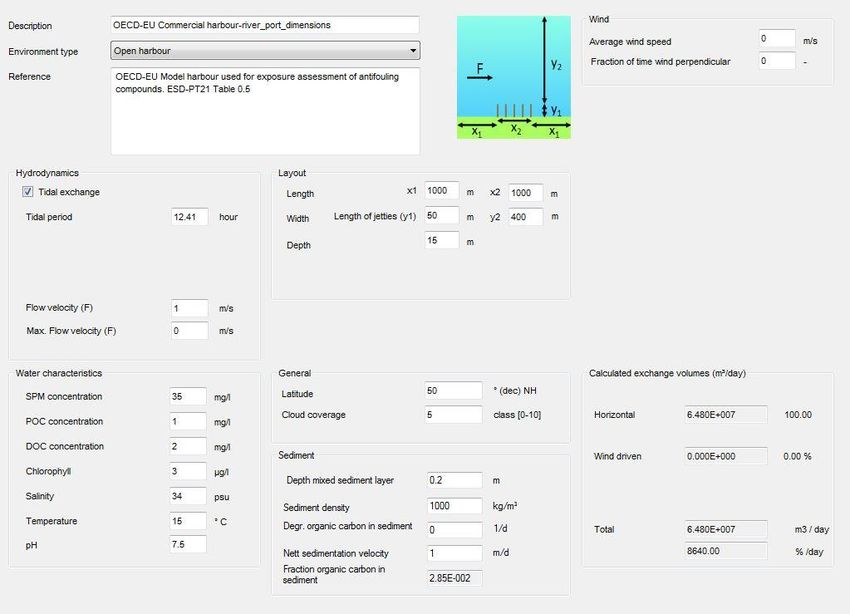
Glossary
     AA              Annual Average
     CAS             Chemical Abstracts Service
     CLIA            Cruise Lines International Association
     BW              Ballast Water
     D               Detect
     DL              Detection Limit
     ECHA            European Chemicals Agency
     AHEE            Ad hoc WG on Environmental Exposure
     EGCS            Exhaust Gas Cleaning System
     EQS             Environmental Quality Standard
     EU              European Union
     FNU             Formazin Nephelometric Units
     GESAMP-         Joint Group of Experts on the Scientific Aspects of Marine Environmental Protection - Ballast
     BWWG            Water Working Group
     Hz              Hertz
     IMO             International Maritime Orgainisation
     ISO             International Orgainization for Standardization
     MAC             Maximum Allowable Concentration
     MAMPEC          Marine Antifoulant Model to Predict Environmental Concentrations
     MARPOL          The International Convention for the Prevention of Pollution from Ships
     MCR             Maximum Continuous Rating
     MEPC            Marine Environmental Protection Committee
     MGPS            Marine Growth Protection System
     NTU             Nephelometric Turbidity Units
     OECD            Organisation for Economic Co-operation and Development
     PAH             Polycyclic Aromatic Hydrocarbon
     PAHphe          phenanthrene equivalence
     PEC             Predicted Environmental Concentration
     pH              pH is a scale used to specify how acidic or basic a water-based solution is
     PM              Particulate Matter
     PNEC            Predicted No Effect Concentration
     PPR             Pollution Prevention and Response
     SOx             Sulphur Oxides
     SPM             Suspended Particulate Matter
     Turbidity       Cloudiness of a fluid due to suspended particles
     U               Non-detect
     USEPA           United States Environmental Protection Agency
     VGP             Vessel General Permit
     WFD             Water Framework Directive

6   4.I09 - The impacts of EGCS washwater discharges on port water and sediment - December 2019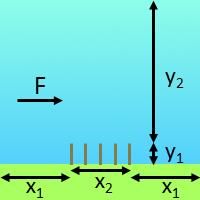
Foreword
    To contribute to the ongoing discussion about the impact of Exhaust Gas Cleaning Systems
    (EGCSs) on the port water and sediment, the Cruise Lines International Association Europe
    (CLIA Europe) and Interferry have collaborated to sponsor a joint research project.

    The aim of the project is to provide further knowledge on the impact of washwater
    discharges from open-loop EGCSs on port water and sediment in the North Sea and Baltic
    Sea regions.

    The scope of the project is limited to the assessment of the impact of Exhaust Gas Cleaning
    Systems on water quality. It does not make comparisons with the impact of other sulphur
    abatement options such as low sulphur fuel.

    CE Delft were selected to conduct the project in partnership with Deltares. Deltares ran a
    series of generic simulations using the integrated hydrodynamic and chemical fate model
    Marine Antifoulant Model to Predict Environmental Concentrations – Ballast Water (MAMPEC-
    BW) to calculate the predicted environmental concentrations (PEC) of target substances
    that open-loop EGCS operations may contribute to the background concentrations of target
    substances in port water and sediment.

    There are considered to be three study areas which lead to the understanding of the
    potential environmental impact of scrubber washwater on the marine environment:

    1. Washwater quality evaluation, comparing washwater sample results to important
       existing water quality standards, both national and international.

    2. Washwater impact on the marine environment, evaluating how the target substances
       for metals and Polycyclic Aromatic Hydrocarbons (PAH) can impact marine organisms,
       including evaluation against established predicted no effect concentrations (PNEC).

    3. Washwater Accumulation in Ports, assessment through computer modelling the
       potential accumulation of the target substances for metals and PAHs in EGCS washwater
       that can be expected in a given port’s water column and sediment.

    While there are a number of studies that address Items 1 and 2, the aim of this study is to
    address Item 3 and consider accumulation of both water and sediment concentrations from
    a scientific standpoint.

    By The Cruise Lines International Association (CLIA) and Interferry

7   4.I09 - The impacts of EGCS washwater discharges on port water and sediment - December 2019
Executive summary
One of the options to comply with the MARPOL Annex VI regulation on the sulphur content
of marine fuels is to use an Exhaust Gas Cleaning System (EGCS) that removes Sulphur
Oxides (SOx) from the exhaust gas. Apart from SOx, an EGCS also removes other harmful air
emissions such as Particulate Matter (PM) and Polycyclic Aromatic Hydrocarbons (PAHs) from
the exhaust. When an EGCS is operated in a so-called open-loop mode, the washwater from
the scrubbers is discharged into the sea, sometimes after filtering and buffering with
seawater.
Concerns have been raised about the environmental impact of washwater discharges,
especially in port areas. This report analyses the long-term impacts of EGCS discharges on
concentrations of eleven metals and sixteen Polycyclic Aromatic Hydrocarbons (PAHs) in the
water and the sediment. It uses empirical data from almost 300 washwater sample analyses
and feeds them into the MAMPEC model, which is widely used by regulators to assess the
environmental risks of various activities which impact port water and sediment. The model
was set up for a variety of ports and with a washwater discharge rate that is much higher
than most ports are expected to experience.
The predicted equilibrium concentrations in the port water have been compared to EU
Environmental Quality Standards (EQS) for priority substances under the Water Framework
Directive. Figure 1 shows the predicted maximum concentrations as a percentage of the
2021 maximum allowable concentration for the four model ports.
Figure 1 - Maximum concentrations as a percentage of 2021 MAC-EQS limits (100% = MAC-EQS limit)
0,70%
0,60%
0,50%
0,40%
0,30%
0,20%
0,10%
0,00%
Baltic Commercial Port Ocean Port
OECD-EU Standard Commercial Harbour River Port
8 4.I09 - The impacts of EGCS washwater discharges on port water and sediment - December 2019In most ports and for most substances, the increase in concentrations caused by continuous
discharge of a relatively high amount of EGCS washwater is less than 0.1% of the limit value.
However, in ports with low hydrodynamic exchange, and especially for a few Polycyclic
Aromatic Hydrocarbons, the increase in concentration can increase to 0.6% of the limit
value.
A comparison of the increase in concentration in the sediment, assuming zero background
concentrations, with different national standards shows that the increase is below 0.5% of
any standard.
9 4.I09 - The impacts of EGCS washwater discharges on port water and sediment - December 20191 Introduction
The International Maritime Organisation (IMO) has regulated emissions of sulphur oxides
(SOx) from ships since updates to The International Convention for the Prevention of
Pollution from Ships (MARPOL) Annex VI entered into force in 2005. It sets limits for the
sulphur content of fuels but also allows ships to use alternative compliance options other
than low-sulphur fuels, as long as the SOx emissions in the exhaust gas meet the
requirements of regulation 14.1 and 14.4 of MARPOL Annex VI when the alternative
compliance option is used.
One of the main alternative compliance options is an Exhaust Gas Cleaning System (EGCS).
An EGCS utilises water to remove SOx and other harmful air emissions such as Particulate
Matter (PM) and Polycyclic Aromatic Hydrocarbons (PAHs)from the exhaust in a chemical-
mechanical process known as scrubbing, the water that has been used to clean the exhaust
is referred to as the washwater.
There are three main types of EGCS, open loop, closed loop and hybrid. An open-loop EGCS
utilises seawater to scrub the exhaust and the resultant washwater is then often mixed with
fresh seawater and in some instances further filtered before discharge into the sea,
particularly in ports. A closed-loop EGCS utilises fresh or seawater and an alkaline chemical
to scrub the exhaust. Closed-loop systems can operate for limited periods with zero
discharges to the sea; however, they produce small volumes of residual process water
(washwater) that must be discharged ashore or treated and discharged overboard. A hybrid
system is an EGCS that can operate in either open or closed-loop configurations.
Washwater discharges may contain some suspended matter and dissolved substances.
Although current EGCS designs and installations have been proven capable of consistently
meeting the IMO washwater criteria for acidity (pH), turbidity and phenanthrene
equivalence (PAHphe) concentrations, which were adopted to safeguard water quality,
discussions continue about the possible impact of EGCS washwater on port water and
sediment, and the subsequent environmental impacts of changes in the port water and
sediment.
When a limit of 0.10% m/m for fuel oil sulphur content came into force for Emission Control
Areas in 2015, the number of ships equipped with EGCSs increased. In anticipation of a
worldwide sulphur limit of 0.50%, entering into force in 2020, the number of EGCS
installations has been increasing steadily in preparation for the 2020 deadline. As the
2020 deadline approaches, shipowners and operators are making investments to ensure
compliance with international emission regulations and to mitigate the risks associated
with uncertainty on the availability and price of low-sulphur fuels. Mid-2019, there were
between 3,000 and 4,000 ships equipped with EGCSs and the numbers are projected to
increase further by 2020 (Clarksons, 2019; DNVGL, 2019). This represents a significant
investment in EGCS technology.
This increase in the number of ships using EGCSs has prompted discussion about the need to
study possible environmental impacts of potential changes in the background concentrations
of substances in port water and sediment as a result of EGCS operations. This study focuses
on open-loop EGCS operations as the washwater samples provided by the sponsors were
collected from open-loop EGCSs or hydrid systems operating in open-loop mode.
10 4.I09 - The impacts of EGCS washwater discharges on port water and sediment - December 2019In order to contribute to the scientific basis for ongoing discussions about the operation of
open-loop EGCSs in ports, the Cruise Lines International Association (CLIA) and Interferry
have commissioned this study from CE Delft which assesses the impact of open-loop EGCS
washwater discharges, from ships at berth, on the port water and sediment. The study has a
specific focus on the North Sea and Baltic Sea regions.
This study reports on the substances that are present in open-loop EGCS washwater
discharges, the volumes of the substances, and the resultant contribution that open-loop
EGCS operations make to the background concentrations of substances in the port water
and sediment. A specific ecological assessment of any changes in background substance
concentrations is not directly included as part of this study, however the water and
sediment criteria used for evaluation of the resultant concentrations are set at levels
which are considered protective of marine organisms and their ecosystem.
A number of studies have previously been published which relate to the potential
environmental impacts of open-loop EGCS operations in ports. However, as it is only since
2017 that global EGCS installations and operating hours have increased dramatically, most
of these published studies did not have access to large numbers of EGCS washwater
samples. In contrast this study has benefited from the global growth in EGCS installations
and operating hours as nearly 300 washwater samples have been made available for
analysis.
Another differentiating factor of this study compared to the majority of earlier published
studies is that this study has applied the MAMPEC-BW modelling tool to predict long-term
variations in substance concentrations in the water and sediment.
Laboratory analysis results for 291 EGCS washwater samples were provided for this study,
and 38 of these were discarded as they were not supplied with the necessary supporting
technical information required for the adopted analysis method, and therefore 253 samples
have been used. The laboratory analysis was conducted by ISO-certified laboratories
utilizing, in the vast majority of cases, approved USEPA and/or ISO methods.
The samples have been analysed for concentrations of 27 substances: 16 different Polycyclic
Aromatic Hydrocarbons (PAHs) and 11 metals. The 27 substances meet and in some cases
exceed the requirements for washwater data collection as specified by the IMO in MEPC
259(68), and by the United States Environmental Protection Agency Vessel General Permit
(US EPA; OW; OWM; Water Permits Division, 2013).
The impacts of open-loop EGCS discharges on port water and sediment were modelled for
four model ports using the industry and IMO recognised mathematical exposure assessment
model MAMPEC-BW and a reference ship loading. The MAMPEC model was originally
developed for the exposure assessment of antifouling substances, and at a later stage the
model was adapted to be used for ballast water; this version is referred to as MAMPEC-BW,
and was used for this study.
The MAMPEC models are validated steady-state 2D integrated hydrodynamic and chemical
fate models commonly used for environmental risk assessments of antifouling susbtances
and substances in ballast water. The models are currently recognized and used by
regulatory authorities in the EU, USA, Japan, and other OECD countries and are publicly
available. The EU, in a submission to MEPC 74, specifically referenced the MAMPEC model as
the model for assessing the marine environmental risk of the discharge of EGCS effluents
(MEPC 74/14/1).
11 4.I09 - The impacts of EGCS washwater discharges on port water and sediment - December 2019During the development of MAMPEC for the study of antifouling substances, a worst-case
approach was adopted. The effect of a worst-case approach is that concentrations are
generally over-predicted (Hattum, et al., 2016).The reason for adopting this worst-case
approach was to prevent under-prediction that may have resulted in the approval of
antifouling substances that at a later date were shown to have exceeded allowable
concentrations. In a Tiered Assessment, MAMPEC is suitable as a First Tier screening model,
which means its main purpose is to identify areas that are of no concern and areas that may
need further investigation.
One of the key aims of study is to provide a method which can be used by others for
assessment of the impact that open-loop EGCSs may have on port water and sediment.
Whilst this study is focused on the North Sea and Baltic Sea, the methodology that has been
developed can be applied to any port anywhere in the world as long as the port geometry,
water characteristic and hydrodynamic water exchanges used in the modelling are
representative of the location being assessed.
1.1 Outline of the report
Chapter 2 presents a description of the methodology of the study. Chapter 3 presents the
results. Conclusions are drawn in Chapter 4.
12 4.I09 - The impacts of EGCS washwater discharges on port water and sediment - December 20192 Project methodology
2.1 Overall methodology
The project consisted of a number of defined tasks/steps which can be separated into two
main areas: first, the calculation of predicted equilibrium water and five year sediment
concentrations; and second, the evaluation of these concentrations against water and
sediment environmental standards and other contributors.
1. Calculation of predicted concentrations:
• define reference scenario for ship loading in the port (Section 2.2);
• calculation of mean emission factors for substances in the EGCS washwater
(Section 2.3);
• define substance loads in EGCS washwater for reference scenario (Section 2.3);
• define model ports (Section 2.4);
• calculate in-port water and sediment substance concentrations (Chapter 3).
2. Evaluation of projected increases in concentrations (Chapter 3):
• assess EGCS washwater samples against IMO washwater discharge criteria;
• compare increases in concentrations in ports with Environmental Quality Standards
(EQS) under the European Union (EU) Water Framework Directive (WFD);
• compare water substance loads from ships with loads from other contributors;
• compare sediment concentrations with national standards.
A graphical representation of the methodology to calculate the predicted concentrations is
provided in Figure 2.
Figure 2 - Methodology for calculation of predicted concentrations
13 4.I09 - The impacts of EGCS washwater discharges on port water and sediment - December 20192.2 Define reference scenario for ship loading on the port
The reference scenario for the ship loading on the port was required in order to provide
reference inputs to the MAMPEC-BW model that would facilitate the prediction of changes
in the concentrations of both PAHs and metals as a result of a ship loading on the port.
A conservative approach was taken to use a ship loading that represents a number of EGCS
ships and systems which is beyond what can be projected for the foreseeable future in the
specified regions.
This study only considers ships at berth and therefore the reference ship loading is the
total power consumed by hotel services or during port operations such as cargo handling
operations for all the ships using EGCSs in the port each day. In reality, the daily ship
loading will vary all the time as the combination of ship types and sizes in port changes all
the time and regularly several times a day. However, MAMPEC-BW only accepts an averaged
daily input so an approximation of the daily ship load has been made.
The project sponsors provided information on the estimated port load for the ships types
that were releveant to them and the Third IMO Greenhouse Gas Study 2014 provided
reference information on the estimated port load for a selection of other ship types.
The auxiliary loading at berth varies significantly between ship type and size.
The information from the sponsors is presented in Table 1, and Table 2 presents the
information taken from the Third IMO Greenhouse Gas Study 2014.
Table 1 - Auxiliary load at-berth – sponsors information
Ship type Auxiliary load at berth (kW)
Generic Ferry – ro-pax 1,500
Cruise ships 20,000–59,999 GT 3,400
Cruise ships 60,000–99,999 GT 5,900
Cruise ships 100,000–140,000 GT 8,650
Cruise ships 140,000+ GT 9,400
Table 2 - Auxiliary load at-berth – IMO GHG Study 2014
Ship type Auxiliary loadat berth (kW)
General cargo 0–4,999 dwt 120
General cargo 5,000–9,999 dwt 330
General cargo 10,000+dwt 970
Bulk carrier 0-9,999 dwt 280
Bulk carrier 10,000-34,999 dwt 280
Bulk carrier 35,000-59,999 dwt 370
Bulk carrier 60,000-99,999 dwt 600
Bulk carrier 100,000-199,999 dwt 600
Bulk carrier 200,000+dwt 600
Container 0-999 TEU 340
Container 1,000-1,999 TEU 600
Container 2,000-2,999 TEU 700
Container 3,000-4,999 TEU 940
Container 5,000-7,999 TEU 970
Container 8,000-11,999 TEU 1,000
Container 12,000-14,499 TEU 1,200
Container 14,500+TEU 1,320
Source: Third IMO Greenhouse Gas Study 2014.
14 4.I09 - The impacts of EGCS washwater discharges on port water and sediment - December 2019It was decided that the calculation of the reference scenario and subsequent daily (24 hrs)
total fuel consumption in the port by ships using open loop EGCSs would be based on a
continuous (24 hrs per day) 8 MW port load. This 8 MW continuous loading takes
consideration of the port sizes, shipping operations in the North Sea and Baltic Sea
regions combined with the information in Table 1 and Table 2.
The MAMPEC-BW model is a steady-state modelling tool with regard to the water
concentrations. The model calculates the equilibrium state for the substance
concentrations in the water, suspended particulate matter (SPM), and sediment based on a
continuous inflow of the substances and continuous hydrodynamic water exchanges. So the
defined ship loading represents 40.32 tonnes of fuel being consumed every day for 365 days
per year; year after year indefinitely for the calculation of the substances concentrations in
the port water.
Table 3 summarises how the reference ship loading on the port is derived and the total daily
fuel consumption calculated.
Table 3 - Reference ship loading
Reference Value Unit
Combined hotel/auxiliary load from ship(s) in port 8 MW
Time ship(s) in port per day 24 Hours
SFOC 210 g/kWh
Total power/day 192,000 kWh/day
Fuel consumed/day 40.32 Tonnes/day
The reference ship loading of 40.32 tonnes/per day used in the study is considered high for a
North Sea or Baltic Sea port, some theoretical combinations or combinations thereof of what
this loading could represent are included here:
— 10 Ferry – ro-pax (generic) at berth for 12 hrs/day 365 days/yr; or
— 7 Cruise ships (20,000–59,999 GT) at berth for 8 hrs/day 365 days/yr; or
— 4 Cruise ships (60,000–99,999 GT) at berth for 8 hrs/day 365 days/yr, or
— 24 General cargo ships (5,000–9,999 dwt) at berth for 24 hrs/day 365 days/yr; or
— 28 Bulk carriers (10,000-34,999 dwt) at berth for 24 hrs/day 365 days/yr; or
— 16 Container ships (8,000-11,999 TEU) at berth for 12 hrs/day 365 days/yr.
For this study, MAMPEC was configured to calculate the sediment concentrations after five
years as this is considered a common time period between dredging activities in North Sea
and Baltic Sea ports. The defined ship loading represents 40.32 tonnes of fuel being
consumed every day for 365 days per year for five years, for the calculation of the
substances concentrations in the port sediment.
It is noted that MAMPEC-BW can calculate sediment concentrations for given time periods
between one and 20 years (1, 2, 5, 10 and 20 years), and that due to the underlying logic
within the MAMPEC model, the sediment concentrations do not scale linearly between zero
and 20 years, sediment modelling is explained in more detail in Section 2.4.8.
15 4.I09 - The impacts of EGCS washwater discharges on port water and sediment - December 20192.3 Calculation of mean emission factors for substances in the EGCS
washwater
The aim of this task was to define the mean emission factors for each of the substances in
the EGCS washwater. The mean emission factors are defined as grams per tonne of fuel
consumed for each substance and are derived from washwater sample data provided by the
project sponsors.
2.3.1 Sample data
CE Delft was provided with chemical water analysis reports for 291 washwater samples from
53 different ships; the samples were collected from cruise ships, bulk carriers and ferries.
Samples were taken when ships were in service in different locations in the Caribbean, the
eastern Pacific, the Tasman Sea, the Strait of Malacca, the Atlantic Ocean, the North Sea
and the Baltic. Often, ships will have bunkered near these locations and as a result, the
samples likely reflect a wide range of fuel origins and qualities.
The majority of the samples were collected by the respective ships’ engineers in
accordance with the US Environmental Protection Agency (EPA) or ISO test procedures for
the parameters analysed as per the requirements of IMO MEPC 259(68) Annex 3 ‘Washwater
Data Collection’. The chemical analysis was undertaken by industry-recognized ISO-certified
laboratories.
Sample Reference Points: In line with the IMO’s request to shipowners on the collection of
washwater discharge samples for periodical analysis, for each EGCS the water samples were
collected at three different reference points, namely: the inlet water (for background);
EGCS tower outlet (before any treatment system(s)); and at the overboard discharge.
Sample Technical Information: Along with the sample laboratory results, CE Delft was also
provided with relevant technical information that provides more insight into the EGCS
operation at the time of sampling. The EGCSs sampled were manufactured by various
vendors and represent both multi- and single-stream units depending on the EGCS maker
and ship’s configuration.
The technical information that was taken into account during the collection of the samples
included: the total number of diesel engines connected to an EGCS (both single- and multi-
stream systems); the number of diesel engines operating during the collection of samples;
the load of the particular diesel engine (or combination of diesel engines) during the time
of the sample; the type of fuel and its corresponding sulphur content and the pH, Turbidity,
PAHphe at the seawater inlet, EGCS tower outlet and the overboard discharge; and the
SO2/CO2 ratio of the exhaust.
For 38 of the 291 samples, some information was missing that was essential for the study’s
methodology, e.g. data on the washwater flow rate or fuel consumption. Subsequently, these
38 samples were discarded and the remaining 253 samples were used for the study.
The substances which have been considered for this study are presented in Table 4 and
Table 5; all of these substances are included in the laboratory analysis of each sample.
16 4.I09 - The impacts of EGCS washwater discharges on port water and sediment - December 2019Table 4 - Analysed Metals
Metal CAS No. Metal CAS No.
Arsenic (As) 7440-38-2 Nickel (Ni) 7440-02-0
Cadmium (Cd) 7440-43-9 Selenium (Se) 7782-49-2
Chromium (Cr) 7440-47-3 Thallium (TI) 7440-28-0
Copper (Cu) 7440-50-8 Vanadium (V) 7440-62-2
Lead (Pb) 7439-92-1 Zinc (Zn) 7440-66-6
Mercury (Hg) 7439-97-6
Table 5 - Analysed PAHs
PAH CAS No. PAH CAS No.
Acenaphthene 83-32-9 Chrysene 218-01-9
Acenaphthylene 208-96-8 Dibenz(a,h)anthracene 53-70-3
Anthracene 120-12-7 Fluoranthene 206-44-0
Benzo(a)anthracene 56-55-3 Fluorene 86-73-7
Benzo(a)pyrene 50-32-8 Indeno(1,2,3-cd) pyrene 193-39-5
Benzo(b)fluoranthene 205-99-2 Naphthalene 91-20-3
Benzo(g,h,i)perylene 191-24-2 Phenanthrene 85-01-8
Benzo(k)fluoranthene 207-08-9 Pyrene 129-00-0
The substances considered for this study include the substances set out in the IMO guidelines
for washwater data collection as detailed in Annex 3 of MEPC 259(68) and listed in Table 6.
Table 6 - IMO Washwater analysis parameters
Annex 3 MEPC 259(68) – Washwater Analysis Parameters
pH Nickel (Ni)
PAH and oil (detailed GC-MS analysis) Lead (Pb)
Nitrate Zinc (Zn)
Nitrite Arsenic (As)
Cadmium (Cd) Chromium (Cr)
Copper (Cu) Vanadium (V)
With respect to PAH and oil, the IMO through MEPC 259(68) specifies criteria for just one
PAH — phenanthrene — which is prevalent in the exhaust from diesel internal combustion
engines and is an indicator for the possible presence of others. This study considers
phenanthrene as well as a further 15 PAHs and makes an assessment of the samples set
against the IMO washwater criteria for PAHphe.
MEPC 259(68) does not contain any criteria for the concentrations of metals in EGCS
washwater discharges since turbidity is monitored as a surrogate for suspended solids such
as metals. This study includes an assessment of the sample set against the IMO washwater
criteria for turbidity.
The sample set is also assessed against the IMO washwater criteria for pH and Nitrates.
Selenium and Thallium are not specified by the IMO but are required under US EPA Vessel
General Permit (VGP) for EGCS periodic monitoring, hence their inclusion in this study.
17 4.I09 - The impacts of EGCS washwater discharges on port water and sediment - December 20192.3.2 Calculation of mean emission factors
This section explains how the sample data is processed and the steps taken to calculate the
mean emission factors.
Net concentrations: The aim of this study is to identify the impact of open-loop EGCSs on
port water and sediment. Therefore, in the analysis of the sample data we isolate what is
being added by the scrubbing process from what is already in the port water. This approach
calculates the net change in substance concentrations between the EGCS tower outlet and
inlet water, i.e. before any treatment of the washwater or buffering.
The ‘net concentration’ approach deducts the inlet water concentrations for each
substance from the EGCS tower outlet values; we do not consider the overboard discharge
as we wish to avoid the effects of any post-scrubbing washwater treatment systems in the
analysis.
Washwater treatment: EGC Systems vary between different manufacturers and are often
tailored to ship-specific requirements; however, fundamentally, when we consider open-
loop EGCSs today most of these systems include washwater filtration to reduce substances
added to the washwater by the scrubbing process, and many also have the ability to buffer
the washwater pH in order to meet IMO or US regulations. For this study, the effects of
washwater treatment systems are not included and the study can therefore be considered
to represent a worst case with regard to the calculation of the mean emission factors,
although it is recognized that the capability of washwater treatment systems to remove
substances has improved in recent years and these systems are increasingly commonplace.
It is noted that the PAHs and turbidity criteria set out by IMO are also designed in a way
that requires the washwater to be measured downstream of the scrubbing equipment but
upstream of any washwater treatment prior to discharge.
Sample detects and non-detects: In the laboratory analysis results, each substance in each
sample is reported as being either a ‘detect’, in which case it has a value or a ‘non-detect’
in which case it is not assigned a value. The detection limit (DL) of the equipment used for
analysis is also reported. In the data set a detect is assigned a “D” and a non-detect is
assigned a ‘U’.
A non-detection does not imply that the substance is absent from the sample, rather that
its concentration is below the limit that the analysis equipment can detect.
How the non-detects are treated is a key part of the calculation process for the net
concentration, and the logic used for calculation of the net concentration is as follows:
a If a substance is detected (‘D’) at both the seawater inlet and the EGCS tower outlet,
the net concentration is the concentration at the EGCS tower outlet minus the
concentration at the seawater inlet.
b If a substance is a non-detect (‘U’) at the seawater inlet and a detect (‘D’) at the EGCS
tower outlet, the net concentration is the concentration at the EGCS tower outlet minus
a proxy for the non-detect of 50% of the detection limit for the equipment used to
analyse the sample at the seawater inlet. This approach is in line with common practice
(Hites, 2019).
c If a substance is a detect (‘D’) at the seawater inlet and a non-detect (‘U’) at the EGCS
tower outlet, the net concentration is 50% of the detection limit for the equipment used
to analysis the sample at the EGCS tower outlet minus the concentration at the
seawater inlet.
18 4.I09 - The impacts of EGCS washwater discharges on port water and sediment - December 2019d If a substance is not detected (‘U’) at both the seawater inlet and the EGCS tower
outlet, we have set the value to zero. This does not necessarily mean that the value of
the particular substance is zero, but as the values are below the detectable limit this is
consider a practical approach.
Table 7 - Logic for non-detects and detects
Scenario Seawater inlet EGCS tower outlet Net concentration
A D D EGCS tower outlet – Seawater inlet
B U D EGCS tower outlet – 50% DL
C D U 50% DL – Seawater inlet
D U U Zero
In some cases, the calculation of the net concentration produced a negative value which
could give the indication that the scrubbing process is actually removing substances from
the incoming seawater; as this is not considered probable and poses a threat to the
authenticity of the calculations, any negative net concentration values were removed from
the data set.
The above assumptions allowed us to recognize the non-detects and negative net
concentrations and treat them in a consistent manner. In total, the data validation process
(i.e. discarding the 38 samples that were missing key technical information and the
elimination of negative values) resulted in the elimination of 1,348 possible values,
representing approximately 17% of the maximum possible number of values (291 samples X
27 substances).
The average net concentrations for metals in the post EGCS tower washwater are presented
in Table 8 and the average net concentrations for PAHs in the post EGCS tower washwater
are presented in Table 9. The concentrations in Table 8 and Table 9 are before any
post-scrubber washwater filtration or addition of buffering water (washwater treatment).
Table 8 - Average metal concentration increase in washwater samples
Substance Mean net concentration increase Minimum – maximum net
(mg/l) concentration increase (mg/l)
Arsenic 0.0064 0-0.044
Cadmium 0.0019 0-0.020
Chromium 0.018 0-0.57
Copper 0.25 0–11
Lead 0.00020 0-0.00050
Mercury 0.00010 0-0.00023
Nickel 0.12 0-7.3
Selenium 0.015 0-0.23
Thallium 0.0053 0-0.054
Vanadium 0.14 0-3.5
Zinc 0.32 0-23
19 4.I09 - The impacts of EGCS washwater discharges on port water and sediment - December 2019Table 9 - Average PAH concentration increase in washwater samples
Mean net concentration increase Minimum – maximum net
Substance
(µg/l) concentration increase (µg/l)
Acenaphthene 0.20 0-0.93
Acenaphthylene 0.12 0-2.1
Anthracene 1.8 0-15
Benzo(a)anthracene 0.3 0-12
Benzo(a)pyrene 0.042 0-0.12
Benzo(b)fluoranthene 0.048 0-0.32
Benzo(g,h,i)perylene 0.047 0-0.19
Benzo(k)fluoranthene 0.01 0-0.02
Chrysene 0.25 0-1.6
Dibenz(a,h)anthracene 0.019 0-0.06
Fluoranthene 0.21 0-6
Fluorene 0.57 0-7
Indeno(1,2,3-cd)pyrene 0.049 0-0.31
Naphthalene 3.5 0-140
Phenanthrene 2.0 0-11
Pyrene 0.36 0-5
Mean emission factors: The method used to calculate the mean emission factors for each
substance is based on a mass balance and can be broken down into eight steps. The steps are:
1. Calculate the net concentration of the particular metal (mg/l) or PAH (μg/l) as
described above.
2. Calculate a daily EGCS flow rate for each sample (litres of water per 24 hrs) on the basis
of the flow rate during sampling.
3. Calculate the emissions per day (mg/day) or (μg/day) based on the daily EGCS flow rate
and the net concentration increase.
4. Using the total power of the diesel engine(s) that is/are connected to the EGCS and the
engine percentage load at the time of sampling, calculate the Specific Fuel Oil
Consumption (SFOC) (g/kWh)1 and the power produced per day (kWh/day). Combine the
SFOC and power produced per day to calculate the tonnes of fuel consumed per day.
5. Use the emissions per day and fuel consumption per day to calculate the emission factor
(g/tonne of fuel) for each substance in each sample.
6. Discard the negative values which were created due to our adopted net concentration
logic.
7. Discard the outliers. The exclusion of statistical outliers has been performed by
identifying three standard deviations from the mean emission factor value for each
substance. This methodology is consistent with generally accepted practice, e.g. the
United States Geological Survey’s statistical method for water resources.
8. Recalculate the mean emission factors (g/tonne fuel) for each substance with the
outliers removed.
The mean emission factors (g/tonne of fuel consumed) are combined with the total ship
load in the port for the reference scenario (192 MWh/day = 40.32 tonnes of fuel/day) to
derive the substance load in the EGCS washwater. The resultant substance loads are input
________________________________
1
The engine load data was used to calculate the SFOC at the relevant engine load by using equation (3) from the
third IMO GHG study. The formula is SFOC (load) = SFOCbase × (0.455 × load 2 - 0.71 × load + 1.28) (IMO, 2014),
SFOCbase is taken as 210 g/kWh.
20 4.I09 - The impacts of EGCS washwater discharges on port water and sediment - December 2019into the MAMPEC-BW model which calculates the equilibrium water and five-year sediment
concentrations for each substance and each model port.
2.3.3 Substance frequency of detection
Presented in this section are the frequencies at which each substance is detected in the
washwater samples. Figure 3 shows that metals are detected frequently both in the
seawater inlet and post-EGCS. For nickel and vanadium the difference is larger than for
other metals, indicating that these metals are more often present in fuel than in seawater,
while arsenic, cadmium, lead and mercury appear to be coming predominantly from the
seawater. Figure 4 presents the frequency for the detection of PAH, in the seawater, these
substances are in most cases below the detection limit, while they are present in the
washwater at the EGCS tower outlet.
It is noted that the substances present in the discharged washwater could come from
sources other than the fuel, for example substances can also be introduced to the
washwater from pipework or marine growth protection systems (MGPS).
Figure 3 - Frequency of the detection of metals (100% = all washwater samples)
70%
60%
50%
40%
30%
20%
10%
0%
Detected seawater inlet Detected post EGCS
21 4.I09 - The impacts of EGCS washwater discharges on port water and sediment - December 2019Figure 4 - Frequency of the detection of PAHs (100% = all washwater samples)
100%
90%
80%
70%
60%
50%
40%
30%
20%
10%
0%
Detected seawater inlet Detected post EGCS
2.4 Introduction to MAMPEC
2.4.1 Background
MAMPEC is a validated steady-state 2D integrated hydrodynamic and chemical fate model
commonly used for environmental risk assessment of biocides from antifouling paints and
also for contaminants from ballast water treatment installations. The model and software
have been developed and maintained by Deltares since 1999, in cooperation with the
Institute for Environmental Studies of the VU University in Amsterdam. It was originally
developed for the exposure assessment of antifouling substances. In 2011, on request of
The Joint Group of Experts on the Scientific Aspects of Marine Environmental Protection -
Ballast Water Working Group (GESAMP-BWWG) and IMO, a special standardised version of
MAMPEC (MAMPEC BW v3.0) was created for the exposure assessment of compounds emitted
with discharges from ballast water treatment installations. MAMPEC-BW 3.1.0.5 is used for
this study. The software and technical documentation is freely available and can be
obtained from the support site: Deltares MAMPEC.
The most important difference between MAMPEC and MAMPEC-BW is that a default GESAMP-
BWWG Model Harbour has been included together with a database, reviewed by GESAMP-
BWWG, of environmental properties of ballast water specific chemicals. The GESAMP-BWWG
model harbour was derived from the OECD-EU Commercial Harbour, which is one of the
standard environmental emission scenarios used for evaluation of biocides under the
Biocidal Products Directive (BPD, Directive 98/8/EC) and the more recent Biocidal
Production Regulation (BPR, Regulation (EU) 528/2012). The standard OECD-EU Commercial
Harbour is one of the model ports evaluated in this study.
MAMPEC is currently recognized and used by regulatory authorities in the EU, USA, Japan,
and other OECD countries for exposure assessment of antifoulant substances.
It is also noted that MAMPEC was not originally designed to model specific, real-life ports,
but was developed to represent generic ports that can be seen as typical for a specific
geographical region; it was only later that work was conducted to develop the capability of
the model to model specific ports in specific locations. The validation of MAMPEC for use on
specific port locations as opposed to generic geographical regions is ongoing.
22 4.I09 - The impacts of EGCS washwater discharges on port water and sediment - December 20192.4.2 MAMPEC environment types
In MAMPEC, four different types of environments can be specified. These environments are
illustrated in Table 10 along with details the hydrodynamic exchange mechanisms that are
applicable to each environment.
Table 10 - MAMPEC environment types
Commercial Harbour Marina Open Sea Shipping Lane Open Harbour
Hydrodynamic Exchanges
Tidal Tidal Current Current
Horizontal Horizontal Wind
Density Density Tidal
Flushing Flushing
Wind Wind
Other non-tidal Other non-tidal
The Commercial Harbour, Marina and Open Harbour environments are used in this study as
detailed in Section 2.5.
For each environment, inputs are required for the port geometry and environmental
conditions; these inputs reflect the type of port being modelled e.g. river port, ocean port,
as well as the geographical region or location. For this study, the ports modelled are
representative of the North Sea and Baltic Sea regions rather than specific locations or
ports.
2.4.3 Environmental inputs
A limited set of agreed standard scenarios for environmental inputs, substance properties
and emission characteristics are included in MAMPEC and usually these are applied in
approval procedures, together with regional scenarios as agreed in ECHA-AHEE (European
Chemicals Agency – Ad hoc WG on Environmental Exposure) meetings (Cheng, et al., 2013;
ECHA, 2016; 2017) or specific national scenarios (e.g. (Koivisto, 2003)).
In this study, the ECHA derived data for the Baltic Sea region was used to define the
environmental inputs for the model port located in the Baltic Sea region. For the North Sea
based model ports, the environmental inputs were taken from the Standard OECD-EU
Commercial Harbour as this standard MAMPEC port is based on the Port of Rotterdam, and
therefore the environmental inputs are applicable to the North Sea region.
23 4.I09 - The impacts of EGCS washwater discharges on port water and sediment - December 20192.4.4 Predicted Environmental Concentrations (PEC)
MAMPEC solves mass balance equations to calculate Predicted Environmental
Concentrations (PEC) for two areas, one inside the port which is referred to as ‘harbour’
and the other outside the port which is referred to as ‘surrounding’; these are illustrated in
Figure 5 and Figure 6. The calculated concentrations are a function of the hydrodynamic
exchanges between the harbour area and the surrounding area in combination with
additional physical and chemical processes, such as adsorption and desorption to sediments,
degradation, and volatisation.
Figure 5 - MAMPEC area designations for commercial harbour and marina type environments
Figure 6 - MAMPEC area designations for open harbour type environment
MAMPEC calculates dissolved and total (including the SPM bound fraction) equilibrium
concentrations in the water for both the harbour area and the surrounding area.
MAMPEC also calculates the concentration in the sediments in the harbour area which are
due to the settling of suspended particulate matter (SPM) in which substances may be
adsorbed and other processes such as biodegradation.
It was reported by ECHA (2016; 2017) that for the assessment of emissions during the
service life of products used in commercial shipping at sea, the OECD Commercial Harbour
scenario should be used as the single core scenario. Risk assessments should be based on
average dissolved Predicted Environment Concentrations (PECs) derived for the wider
environment simulated by MAMPEC as concentrations in the ‘surrounding’ area (i.e. for the
24 4.I09 - The impacts of EGCS washwater discharges on port water and sediment - December 2019area immediately outside the ‘harbour’ area). This study reports and evaluates the
substance concentrations for both the ‘surrounding’ and ‘harbour’ areas.
2.4.5 Hydrodynamic exchange processes in MAMPEC
The total exchange volume (m3/tide) is often a very important driving force in the
magnitude of the resultant predicted environmental concentrations, as it relates to the
volume of water that is exchanged between the harbour area and the surrounding area
during each tidal period (12.41 hrs); in general, the higher the exchange volume the lower
the resultant predicted concentrations. In MAMPEC, the total exchange volume is a function
of the following hydrodynamic exchange mechanisms (Hattum, et al., 2016):
1. Tidal - Tidal exchange and daily water level variation.
2. Horizontal or Current - Exchange due to horizontal current in front of the port entrance.
3. Density – Density-driven exchange.
4. Other non-tidal - Non-tidal daily water level variations.
5. Flushing – External inflows e.g. small stream or outflows e.g. cooling water.
6. Wind - Wind-driven exchange.
The environment type that the model port is based upon dictates which of these exchange
mechanisms are used to calculate the total exchange volume and their dominance, as
illustrated in Table 10.
Items 1-3 are generally considered the main exchange mechanisms (Hattum, et al., 2016).
Under low tidal conditions, small currents and small or no density differences, Items 4, 5
and 6 can become important. It is possible to include additional flushing, Item 5, due to
external inflows (e.g. rain, small streams), but though common flushing has not been
included in any of the model ports in this study as part of the conservative approach
(flushing would lower the equilibrium concentrations).
Small flows outside the port can have a significant effect on the residence time of the
substances inside the port (harbour area), in particular when the port is relatively small.
A flow velocity of 0.01 to 0.05 m/s can reduce residence times in such ports by a factor of
ten compared to no flow. The residence time does not only depend on the flow, but also on
other characteristics of the port such as the volume of the port and the width of the port
entrance. Depending on the magnitudes of the other exchange mechanisms the residence
times may vary significantly with small variations in the flow outside the port.
Whilst MAMPEC includes all the major hydrodynamic exchange volumes, there are
‘additional factors’ such as ship movements that also have an impact on the total exchange
volumes but are not considered by MAMPEC. In most cases, when the total exchange
volumes are high these ‘additional factors’ are not dominant, therefore excluding them is
not significant in regard to the predicted concentrations. However, when the MAMPEC total
exchange volume is very low, ‘additional factors’ become more significant and therefore
the exchange volume is actually likely to be higher for a given scenario than MAMPEC uses.
Subsequently, whilst all predicted concentrations from MAMPEC are generally considered as
over-predictions, due to the worst-case nature of the model, the concentrations at low
exchange volumes will be even more over-predicted than those at higher exchange
volumes.
25 4.I09 - The impacts of EGCS washwater discharges on port water and sediment - December 20192.4.6 Spatial distribution of emissions in MAMPEC
In MAMPEC-BW, the spatial distribution of the emissions within the port is dependent
upon on the environment type. For the commercial harbour type environment, the input
substance load is evenly distributed along the far end of the harbour, opposite the
entrance. For the open harbour and the marina type environments the input substance
load is evenly distributed across the entire harbour. The spatial distribution of the input
substance load is illustrated in Figure 7, Figure 8 and Figure 9.
Figure 7 - Spatial distribution of input substance load – commercial harbour type environment
Figure 8 - Spatial distribution of input substance load – marina type environment
Figure 9 - Spatial distribution of input substance load – open harbour type environment
26 4.I09 - The impacts of EGCS washwater discharges on port water and sediment - December 20192.4.7 MAMPEC Chemical and biological processes and inputs
A detailed description of the chemical and biological processes and the required MAMPEC
inputs is presented in Annex B. For most of the EGCS-specific compounds (metals and PAHs)
the basic substance parameters (e.g. Kow, Koc, S, Vp, H, DT50 degradation, and Kd for
metals) are not present in the existing MAMPEC databases for antifouling and ballastwater.
Therefore, these parameters were derived from reviewed literature or the reviewed
regulatory database. Reliable data for the biodegration of PAHs in the marine environment
is not readily available in open literature, which is usually confined to well defined
laboratory or experimental studies with micro-organisms that cannot easily be
extrapolated. Therefore, in the MAMPEC-BW runs the worst case assumption of negligible
biodegration was used and rate constants for the degradation terms were set to zero.
The sediment-water distribution coefficient (Kd) is one of the main parameters determining
the partitioning of metals. As Kd values vary largely between metals and environmental
conditions a detailed and comprehensive review study of US-EPA (Allison & Allison, 2005)
was used to derive representative parameter estimates. Further detailed information is
provided in Annex B.
2.4.8 The MAMPEC sediment compartment
MAMPEC-BW can calculate the accumulation of a substance in the sediment for a specified
time between one year and 20 years and a given background concentration. Sediment
substances are of interest as dredged materials are subject to regulation when considering
their disposal and, additionally, any disturbance of the sediment can release substances
into the water. For this study, the sediment substance concentrations have been calculated
after five years of continuous open-loop EGCS operations assuming zero sediment
background concentrations and zero contributions from other sources. Five years was
chosen as this is considered to be in general representative of the frequency of dredging
activities in North Sea and Baltic Sea ports.
In MAMPEC-BW, the concentrations of substances in the sediment will, after a period of
time approach a maximum plateau value, as the substance concentrations in the sediment
will reach an equilibrium condition. The time it takes to reach the equilibrium condition
and the magnitude of the concentrations in the equilibrium condition depend on many
different parameters, e.g. the thickness/depth of the sediment layer, the sedimentation
velocity, characteristics of the suspended particulate matter, substance parameters
(e.g. biodegradation rate) and the substance concentrations in the water. In general, the
thicker the sediment layer, the longer it takes to reach the equilibrium condition and the
higher the substance concentration in the water and suspended particulate matter (SPM),
the higher the substance concentration in the sediment. It is noted that the substance
concentrations and SPM used to calculate the sediment concentrations are as calculated by
the MAMPEC for the model port in question. Therefore, different substance concentrations
in the water and SPM are used for each of the four model ports in calculation of the
sediment concentrations.
For more detailed information on the treatment of sedimentation in MAMPEC, we refer to
the technical documentation of MAMPEC (Section 6.5 in Van Hattum et al. (2016)).
The concentrations of substances in the sediment in MAMPEC-BW follow a curve which
plateaus as the substance concentrations in the sediment reach an equilibrium condition.
Figure 10 shows two theoretical curves for two possible scenarios which illustrate how the
concentrations in MAMPEC-BW changes over time.
27 4.I09 - The impacts of EGCS washwater discharges on port water and sediment - December 2019You can also read