West Coast Trade Report - Pacific Merchant Shipping ...
←
→
Page content transcription
If your browser does not render page correctly, please read the page content below
West Coast Trade Report
                                                                                                         September 2021

August’s Early Returns: TEU Numbers from the Ports

Note: The ports we survey take from a few days to a few         Outbound empties, though, soared by 21.5% year-over-
weeks to report their container trade statistics. Because       year and by 28.4% over August 2019.
West Coast ports are generally much more agile in compiling
                                                                Next door, the Port of Los Angeles posted some
and releasing their monthly TEU counts than are ports
                                                                seemingly counter-intuitive numbers for August. Given
elsewhere in the country, these “First Glimpse” numbers
                                                                universal lamentations about port congestion, the laden
are necessarily incomplete and may give a misleading
                                                                import volume at LA was actually down 5.9% from a year
indication of the latest trends. Only ports which had posted
                                                                earlier, when the summer spasm of pandemic importing
their August TEU tallies by September 21 are included in this
                                                                was rising up to test supply chains. On the other hand,
segment.
                                                                LA’s import volumes compared more favorable with pre-
Perhaps because it doesn’t have many containers                 pandemic August 2019, with laden TEUs up 11.0%. On the
to count, the Port of Boston, presumably the Official           other hand, exports of cargo-bearing boxes continued to
Seaport of the Boston Red Sox, is generally the first North     drift lower at the port, with outbound loads down 22.9%
American port to check in with the latest numbers. Its          from a year ago and by 30.8% from August 2019, when
August wasn’t good, with import loads down 17.1% from           48,059 more loaded TEUs left the port than during this
a year earlier and 40.0% from August 2019. Export loads         August. Empty outbound container traffic was up by
were also down, 15.5% year-over-year and 27.7% from             16.2% year-over-year and by 30.8% over August 2019,
two years earlier. Like the Red Sox, the port presumably        when 44,992 fewer empty TEUs sailed from the port.
aspires to do better next year.
                                                                In Northern California, inbound loads (97,850 TEUs) at the
The Port of Long Beach was the first major seaport to
                                                                Port of Oakland were up 1.6% over last August’s spurt in
report its August container trade numbers. For the month,
                                                                imports from the Far East. Its August 2021 import traffic
the San Pedro Bay port handled 807,704 total TEUs, its
                                                                was 10.8% higher than in the same month two years ago.
busiest August ever and fourth busiest month since
                                                                Export loads (71,753 TEUs) were down 5.8% from a year
global maritime trade began recovering last summer.
                                                                earlier and by 4.4% from August 2019.
Long Beach posted an 11.7% year-over-year gain in
inbound loads, to 407,426 TEUs this August from 364,792         The numbers from the Northwest Seaport Alliance Ports
TEUs a year ago. Inbound loads were also up 26.2% over          of Seattle and Tacoma showed a 1.6% year-over-year gain
August 2019. On the export side, Long Beach tallied             in import loads, which also represented a 14.7% increase
119,485 loaded outbound TEUs in August, down 5.3%               over August 2019. Still, August saw the lowest number
from a year earlier and off by 4.4% from August 2019.           of loaded import containers (111,447 TEUs) at the two

Pacific Merchant Shipping Association
70 Washington Street, Suite 305, Oakland, CA 94607
                                                                                                  pmsaship.com
510-987-5000 info@pmsaship.com
West Coast Trade Report

August’s Early Returns Continued

ports since February. Outbound loads, meanwhile, were          Outbound loads from the South Carolina port totaled
down 11.5% from a year earlier and 18.3% from two years        65,207 TEUs, down 2.4% year-over-year and by 11.8% from
earlier.                                                       August 2019. Meanwhile, the Port of Virginia also posted
                                                               a strong year-over-year gain in laden inbound traffic, with
In the far Northwest, the Port of Prince Rupert continues
                                                               144,226 TEUs, up 19.3% from a year earlier and up 18.7%
to struggle. Import loads in August were down 35.5%
                                                               from August 2019. Virginia’s outbound laden TEU count
from a year earlier and 38.5% from August 2019. Similarly,
                                                               in August (85,256 TEUs) showed a 13.2% jump year-over-
export loads were off 22.8% year-over-year and 15.2%
                                                               year and a 5.7% gain over August 2019.
from two years earlier. The port’s total TEU count was
down 24.2% and 26.9%, respectively, from the previous          On the Gulf Coast, Houston, with 159,791 inbound laden
two Augusts. Even its exports of empty TEUs were down          TEUs in August, posted a substantial 36.9% year-over-year
from a year earlier by 2.5%.                                   rise in import loads and an even bigger 44.8% increase
                                                               over August 2019. Outbound loads (71,753 TEUs) were
Elsewhere around the country, Charleston reported
                                                               down, however, by 13.1% from a year earlier and by 21.7%
114,671 inbound loads in August, an 18.3% bump over
                                                               from two years earlier.
a year earlier and an 11.1% increase over August 2019.

Detailing the July 2021 TEU Numbers
Please note: The TEU tallies cited here are not derived from   historical context to the issue. For example, shortly after
forecasting algorithms or the partial information available    last month’s newsletter hit the streets, a concerned reader
from U.S. Customs and Border Protection but instead            wrote to admonish us for allegedly minimizing the burden
represent the actual TEU counts reported by the major          that the Port of Los Angeles had been carrying when we
North American seaports we survey each month. The U.S.         observed that the port’s import loads in July were up “a
mainland ports we monitor collectively handle over 90% of      slender 2.9%” from a year earlier. July 2020, the reader
the container movements at continental U.S. ports.             pointed out was a particularly busy month at the port
                                                               as the shipping industry rebounded from the COVID-
Due to the COVID-19 pandemic’s ongoing impact on global
                                                               induced collapse of maritime trade in the preceding
trade, we will continue to offer Exhibits 1-3 with columns
                                                               quarter. The inbound trades at ports elsewhere in the
comparing the container numbers for the latest month
                                                               country, especially along the East Coast, were much less
for which complete statistics are available with the same
                                                               vigorous last July, and so those ports were able to post
month in the two preceding calendar years. We also
                                                               comparatively most robust, double-digit year-over-year
compare the numbers on a YTD basis.
                                                               increases this July.
It is not unusual for small discrepancies in TEU tallies to
                                                               Normally, we’d consider that to be a fair critique. But we’re
emerge. Sources and methodologies differ. A September 9
                                                               a bit curious why our correspondent never got around
press release from the National Retail Federation reported
                                                               to explaining why we should be especially agog by the
that its Global Port Tracker showed that the thirteen U.S.
                                                               volume of inbound loads LA handled this July, when in
ports it monitors handled 2.19 million inbound loaded
                                                               fact it had handled 7,077 more inbound laden TEUs way
TEUs in July, up 14.2% over July 2020. Our container
                                                               back in July 2019. That, of course, was well before the
statistics, obtained directly from the eighteen U.S. ports
                                                               plague arrived to rearrange the shipping industry’s deck
that we track, showed 2.26 million inbound loaded TEUs
                                                               chairs or eventually lead American consumers to go on an
arrived in July, an increase of 13.1% from a year earlier
                                                               unprecedented import buying spree. As it was, in that pre-
and a gain of 10.5% over July 2019.
                                                               pandemic July the Port of Los Angeles managed to cope
For all the talk about an unprecedented and unrelenting        with 912,154 total TEUs (loads + empties), 2.4% or 21,354
surge of containerized imports, it’s useful to bring some      more TEUs than it wrestled with this July.

                                                                                              September 2021        Page 2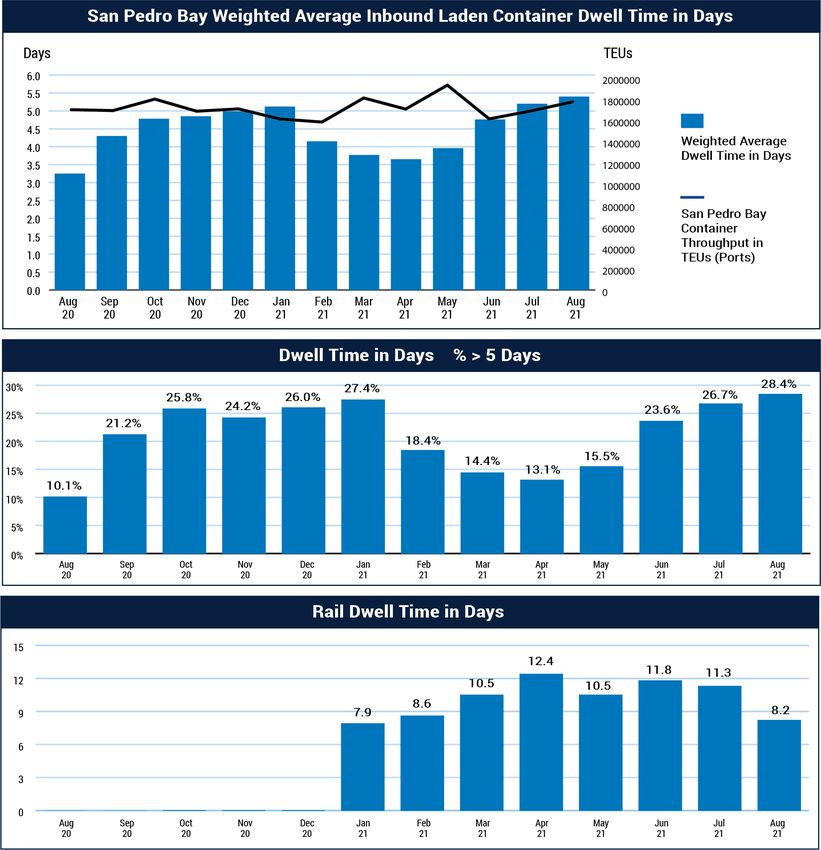
West Coast Trade Report

 Exhibit 1        July 2021 - Inbound Loaded TEUs at Selected Ports

                     Jul 2021     Jul 2020       %      Jul 2019       %       Jul 2021     Jul 2020       %         Jul 2019        %
                                               Change                Change      YTD          YTD        Change        YTD         Change

Los Angeles            469,361      456,029      2.9%     476,438     -1.5%     3,303,574    2,406,663    37.3%        2,736,705    20.7%

Long Beach             382,940      376,807      1.6%     313,350     22.2%     2,698,110    2,036,774    32.5%        2,127,160    26.8%

San Pedro Bay
                       852,301      832,836      2.3%     789,788      7.9%    6,001,684    4,443,437     35.1%        4,863,865    23.4%
Totals

Oakland                 94,745       96,420     -1.7%      90,598      4.6%      639,386      550,782     16.1%         564,749     13.2%

NWSA                   125,632      103,389     21.5%     122,946      2.2%      867,483      669,198     29.6%         815,264      6.4%

Port of Hueneme          8,970        5,482     63.6%       4,378 104.9%          53,612       28,607     87.4%           36,854    45.5%

San Diego                6,636        5,656     17.3%       5,195     27.7%       46,972       44,205      6.3%           41,461    13.3%

USWC Totals          1,088,284    1,043,783      4.3%   1,012,905      7.4%    7,609,137    5,736,229     32.7%       6,322,193     20.4%

Boston                   6,758       12,242    -44.8%      12,714    -46.8%       61,517       79,500     -22.6%          85,912   -28.4%

NYNJ                   393,945      326,079     20.8%     336,972     16.9%     2,635,125    2,034,810    29.5%        2,183,034    20.7%

Maryland                37,626       46,471    -19.0%      48,806    -22.9%      295,574      289,066      2.3%         309,827     -4.6%

Virginia               142,963      105,692     35.3%     125,260     14.1%      935,687      694,745     34.7%         798,936     17.1%

South Carolina         119,445       81,530     46.5%      92,707 128.8%         728,459      562,138     29.6%         613,116     18.8%

Georgia                227,876      185,548     22.8%     197,341     15.5%     1,591,599    1,174,123    35.6%        1,272,703    25.1%

Jaxport                 21,813       28,867    -24.4%      32,505    -32.9%      192,517      175,999      9.4%         209,307     -8.0%

Port Everglades         30,831       22,108     39.5%      25,801     19.5%      209,250      167,979     24.6%         189,789     10.3%

Miami                   44,345       33,029     34.3%      38,229     16.0%      323,459      227,907     41.9%         253,330     27.7%

USEC Totals          1,025,602      841,566     21.9%     910,335     12.7%    6,973,187    5,406,267     29.0%       5,915,954     17.9%

New Orleans              9,720       11,210    -13.3%      12,315      -21.1      74,468       80,874      -7.9%          80,932    -8.0%

Houston                137,197      102,339     34.1%     111,062     23.5%      886,643      672,057     31.9%         715,849     23.9%

USGC Totals            146,917      113,549     29.4%     123,377     19.1%      961,111      752,931     27.6%         796,781     20.6%

Vancouver              138,538      160,875    -13.9%     162,908    -15.0%     1,121,798     951,179     17.9%        1,006,676    11.4%

Prince Rupert           57,743       64,640    -10.7%      66,277    -12.9%      307,829      336,890      -8.6%        365,656    -15.8%

BC Totals              196,281      225,515    -13.0%     229,185    -14.4%    1,429,627    1,288,069     12.3%       1,372,332      5.4%

US/BC Totals          2,457,084    2,224,413    10.5%    2,275,802     8.0%    16,973,062   13,183,496    28.7%      14,407,260     17.8%

US Total              2,260,803    1,998,898    13.1%    2,046,617    10.5%    15,543,435   11,895,427    30.7%      13,034,928     19.2%

USWC/BC               1,284,565    1,269,298     1.2%    1,242,090     3.4%     9,038,764    7,024,298    28.7%        7,694,525    17.5%

                                                                                                                   Source Individual Ports

                                                                                                         September 2021            Page 3
West Coast Trade Report

 Exhibit 2       July 2021 - Outbound Loaded TEUs at Selected Ports

                    Jul 2021     Jul 2020    % Change   Jul 2019      %      Jul 2021     Jul 2020    % Change     Jul 2019       %
                                                                    Change     YTD          YTD                      YTD        Change

Los Angeles            91,440      126,354    -27.6%      161,340   -43.3%     755,275      874,464    -13.6%       1,070,020    -29.4%

Long Beach            109,951      138,602    -20.7%      111,654    -1.5%     861,691      872,821     -1.3%        843,879      2.1%

San Pedro Bay
                      201,391     264,956     -24.0%     272,994    -26.2%   1,616,966    1,747,285     -7.5%      1,913,899     -15.5%
Totals

Oakland                68,153       71,527     -4.7%       76,414   -10.8%     527,202      533,953     -1.3%        564,749      -6.6%

NWSA                   48,833       56,547    -13.6%       73,828   -33.9%     414,111      467,886    -11.5%        527,558      -4.2%

Port of Hueneme         2,242        1,370     63.6%        1,094   104.9%      13,400        7,149     87.4%           9,210    45.5%

San Diego                 370         202      83.2%         308     20.1%       3,377        1,874     80.2%           1,845    83.0%

USWC Totals           320,989     394,602     -18.7%     424,638    -24.4%   2,575,056    2,758,147     -6.6%      3,017,261     -14.7%

Boston                  5,420        8,692    -37.6%        5,664    -1.3%      43,237       42,237      2.4%          46,617     -7.3%

NYNJ                  111,159      102,740      8.2%      118,015    -5.8%     810,410      762,352      6.3%        859,533      -5.7%

Maryland               19,304       17,528     10.1%       19,175     0.7%     147,860      124,030     19.2%        134,468     10.0%

Virginia               81,068       68,594     18.2%       80,955     0.1%     622,256      534,426     16.4%        574,805      8.3%

South Carolina         65,655       57,628     13.9%       72,126    -9.0%     495,683      446,963     10.9%        486,856      1.8%

Georgia               119,072      112,464      5.9%      117,790     1.1%     859,049      857,695      0.2%        878,422      -2.1%

Jaxport                51,598       48,254      6.9%       41,165    25.3%     343,113      282,547     21.4%        289,444     18.5%

Port Everglades        32,390       25,867     25.2%       34,328    -5.6%     223,797      189,856     17.9%        244,599      -8.5%

Miami                  28,003       28,930     -3.2%       34,304   -18.4%     203,793      207,188     -1.6%        241,207     -15.5%

USEC Totals           513,669     470,697       9.1%     523,522     -1.9%   3,749,198    3,447,294      8.8%      3,755,951      -0.2%

New Orleans            18,148       21,458    -15.4%       25,021   -27.5%     156,549      165,174     -5.2%        174,178

Houston                75,457       98,509    -23.4%      104,470   -27.8%     633,555      733,098    -13.6%        726,962     -12.8%

USGC Totals            93,605     119,967     -22.0%     129,491    -27.7%    790,104      898,272     -12.0%        901,140      -4.0%

Vancouver              60,272       87,432    -31.1%       91,521   -34.1%     559,222      616,088     -9.2%        673,589     -17.0%

Prince Rupert          12,142       15,740    -22.9%       15,397   -21.1%      94,076      116,296    -19.1%        117,045     -19.6%

BC Totals              72,414     103,172     -29.8%     106,918    -32.3%    653,298      732,384     -10.8%        790,634     -17.4%

US/Canada
                     1,000,677   1,088,438     -8.1%    1,184,569   -15.5%   7,767,656    7,836,097     -0.9%       8,464,986     -8.2%
Total

US Total              928,263      985,266     -4.8%    1,077,651   -13.9%   7,114,358    7,103,713      0.1%       7,674,352     -7.3%

USWC/BC               393,403      497,774    -21.0%      531,556   -26.0%   3,228,354    3,490,531     -7.5%       3,807,895    -15.2%

                                                                                                                Source Individual Ports

                                                                                                     September 2021             Page 4
West Coast Trade Report
Detailing the July 2021 TEU Numbers Continued
Getting back to July 2021, Exhibit 1 shows Exhibit 3 July 2021 Total TEUs (Loaded and Empty) Handled at
that inbound loads at the two San Pedro Selected Ports
Bay ports rose by 2.3% (+19,465 TEUs)
from a year earlier and by 7.9% (+62,513
TEUs) from July 2019. What’s worth Jul 2021 Jul 2020 % Change Jul 2019 % Change
noting, though, is that Long Beach posted Los Angeles 6,318,675 4,618,277 36.8% 5,450,793 15.9%
a 22.2% bump in import loads over July
2019, while LA saw a 1.5% fall-off. Long Beach 5,538,673 4,186,116 32.3% 4,307,415 28.6%
Imports, meanwhile, dipped lower at the LA/LB 11,857,348 8,804,393 34.7% 9,758,208 21.5%
Port of Oakland, where the number of NYNJ 5,153,882 3,973,088 29.7% 4,315,835 19.4%
inbound loads slipped by 1.7% (-1,675
Georgia 3,190,459 2,452,098 30.1% 2,639,252 20.9%
TEUs) from July 2020. Altogether, the
three major California ports saw their Vancouver 2,237,042 1,868,038 19.8% 1,996,551 12.0%
loaded inbound TEU numbers increase by
NWSA 2,167,766 1,834,653 18.2% 2,241,765 -3.3%
1.9% (+17,790 TEUs) over last July. That
was also 7.6% (+66,660 TEUs) more than Virginia 1,974,825 1,495,143 32.1% 1,720,012 14.8%
they had handled in that more typical
Manzanillo 1,957,292 1,643,369 19.1% 1,778,029 10.1%
July two years ago.
Houston 1,905,414 1,662,546 14.6% 1,712,402 11.3%
Moving up the coast, the import trade
through the Northwest Seaport Alliance South Carolina 1,579,914 1,273,190 24.1% 1,417,959 11.4%
Ports of Seattle and Tacoma showed a Oakland 1,513,176 1,287,179 17.6% 1,473,177 2.7%
strong rebound from a sluggish July of
last year, with import loads up 22,243 Montreal 1,001,874 949,482 5.5% 1,010,536 -0.9%
TEUs (+21.5%). However, this July’s Lazaro Cardenas 866,044 606,501 42.8% 784,142 10.4%
loaded import traffic was up just 2.2%
(+2,686 TEUs) from July 2019. JaxPort 827,735 707,121 17.1% 785,789 5.3%
Miami 738,474 580,123 27.3% 659,380 12.0%
Further north, though, the import
numbers were not positive. The Port of Port Everglades 617,262 533,415 15.7% 603,061 2.4%
Vancouver recorded a 13.9% (-22,337
Maryland 600,060 585,965 2.4% 635,058 -5.5%
TEUs) decline in inbound loads from
last July, while Prince Rupert reported Prince Rupert 599,658 585,531 0.5% 659,398 -9.1%
its containerized import traffic was
Philadelphia 417,716 357,300 16.9% 355,375 17.5%
down 10.7% (-6,897 TEUs) from July
2020. Vancouver’s import traffic this New Orleans 357,886 341,944 4.7% 372,820 -4.0%
July was 15.0% below the level of July Boston 172,523 155,507 10.9% 125,646 37.3%
2019, while Prince Rupert was down
12.9%. (Since we’re in the neighborhood, Port of Hueneme 123,812 104,372 18.6% 74,226 66.8%
we should note that Vancouver was San Diego 91,669 88,101 4.0% 82,958 10.5%
obliged to recalibrate its June container
numbers after evidence surfaced of Portland, Oregon 49,051 28,882 69.8% 20
some inadvertent double-counting. US/Canada Total 37,177,546 29,668,071 25.3% 32,639,428 13.9%
Apparently, the port in June handled
8,470 fewer inbound loaded TEUs but US Mainland Only 33,338,972 26,265,020 26.9% 28,972,942 15.1%
544 more outbound loaded TEUs than it
Source Individual Ports
had initially reported.)
September 2021 Page 5West Coast Trade Report
Detailing the July 2021 TEU Numbers Continued
Exhibit 4 Major USWC Ports Shares of U.S. Exhibit 5 Major USWC Ports Shares of U.S.
Mainland Ports Worldwide Container Mainland Ports Containerized Trade with
Trade, July 2021 East Asia, July 2021
Jul 2021 Jun 2021 Jul 2020 Jul 2021 Jun 2021 Jul 2020
Shares of U.S. Mainland Ports Containerized Import Tonnage Shares of U.S. Mainland Ports’ East Asian Container Import Tonnage
LA/LB 27.2% 27.0% 30.3% LA/LB 46.3% 45.1% 48.0%
Oakland 4.0% 3.4% 4.4% Oakland 3.9% 3.9% 4.7%
NWSA 4.8% 5.4% 4.8% NWSA 7.5% 7.8% 6.9%
Shares of U.S. Mainland Ports Containerized Import Value Shares of U.S. Mainland Ports’ East Asian Container Import Value
LA/LB 33.0% 32.5% 37.6% LA/LB 51.2% 49.8% 54.3%
Oakland 3.1% 2.9% 4.1% Oakland 3.4% 3.4% 4.8%
NWSA 5.8% 6.4% 6.3% NWSA 8.8% 9.6% 8.7%
Shares of U.S. Mainland Containerized Export Tonnage Shares of U.S. Mainland Ports’ East Asian Container Export Tonnage
LA/LB 18.1% 18.0% 22.3% LA/LB 31.4% 31.2% 35.3%
Oakland 6.8% 6.3% 6.5% Oakland 9.8% 9.3% 8.7%
NWSA 6.6% 6.7% 7.0% NWSA 11.0% 11.5% 10.1%
Shares of U.S. Mainland Conatainerized Export Value Shares of U.S. Mainland Ports’ East Asian Container Export Value
LA/LB 17.3% 16.5% 22.6% LA/LB 34.9% 34.0% 42.9%
Oakland 7.2% 6.4% 7.5% Oakland 12.8% 11.5% 12.2%
NWSA 4.0% 4.0% 4.3% NWSA 8.2% 8.0% 7.7%
Source: U.S. Commerce Department. Source: U.S. Commerce Department.
Year-over-year gains along the East Coast were continued to be disappointing in July. Outbound loads
impressive testaments both to their enhanced in San Pedro Bay were down 24.0% (-63,565 TEUs) from
competitiveness and to the fact it takes weeks longer a year earlier and down 26.2% (-71,603 TEUs) from two
for a ship to sail from East Asia to the East Coast. While Julys ago. Outbound loads at Oakland (-3,374 TEUs), the
import numbers were down at three of the Atlantic Coast NWSA ports (-7,714 TEUs), Vancouver (-27,160 TEUs), and
ports we monitor, overall, the nine USEC ports we track Prince Rupert (-3,598 TEUs) all fell from a year earlier.
handled 184,036 more inbound loaded TEUs than in July
On the USEC, loaded export containers were by contrast
of last year, an increase of 21.9%. The same nine ports
up 9.1% (+42,972 TEUs) over last July but off by 1.9%
also saw a 12.7% (+115,267 TEUs) gain in inbound loads
(-9,853 TEUs) from July 2019. At the two Gulf Coast ports
over July 2019.
we track, export loads were down 22.0% (-26,362 TEUs)
YTD, the USWC ports we track have taken in 1,088,284 from last July and by 27.7% (-35,886 TEUs) from the July
loaded TEUs in July, 62,682 more than the USEC ports we before that.
monitor handled.
East Coast ports shipped 513,989 loaded export TEUs in
As for the containerized export trade, Exhibit 2 testifies July as opposed to 320,989 laden TEUs that sailed from
that outbound shipments all along the Pacific Coast USWC ports.
September 2021 Page 6West Coast Trade Report
Detailing the July 2021 TEU Numbers Continued
Exhibit 3 shows that the U.S. mainland ports we monitor Exhibit 5 displays the shares of U.S. container trade
handled 33,338,972 total TEUs (loaded + empty) through involving the Far East handled by the five major USWC
July of 2021. That was up 26.9% (+7,073,952 TEUs) over ports. Collectively, these five ports handled 57.7% of all
this point last year and up 15.1% (+4,366,030 TEUs) from containerized import tonnage that entered U.S. mainland
the first seven months of 2019. For the record, 35.6% of ports from the Far East in July. That was down from
those TEUs passed through the Ports of Los Angeles and last July, when the same five ports received 59.6% of
Long Beach, a share that was up from 33.5% in 2020 and all containerized import tonnage but it was up from the
from 33.7% in 2019. 57.0% share in the pre-pandemic month of July 2019.
Adding in the containerized import tonnage handled by
Weights and Values the smaller ports of California, Oregon, and Washington,
Yes, we realize that the maritime industry likes its the overall USWC share in July 2021 was boosted to
statistics delivered in TEUs. But here, we provide two 58.6%. On the export side, the role of the smaller USWC
alternative measures – the declared weight and value of ports has been edging up. This July, they added 1.6%
the goods housed in those TEUs. The percentages in the to the Big Five’s 52.2% share of containerized export
following exhibits are derived from data compiled by the tonnage headed from U.S. mainland ports to markets in
U.S. Commerce Department that are normally published the Far East. Two Julys ago, the smaller ports added just
with a five-week time-lag. 0.1% to the Big Five share.
Exhibit 4 shows how the three major USWC gateways Who’s #1?
have been faring with respect to their respective shares The Port of Los Angeles was the nation’s busiest
of containerized imports discharged at mainland U.S. container port in July 2021, having handled 890,800 total
seaports in June. We again remind readers that, although TEUs (loads and empties) that month. The neighboring
it may appear that the five major USWC maritime Port of Long Beach ran a competitive second with
gateways monopolize the movement of containers 784,845 total TEUs. Together, the San Pedro Bay gateway
through ports in the states of California, Oregon, and managed to move 1,675,645 TEUs, a 4.1% increase over
Washington, that’s not really the case. In recent years, last July’s 1,609,470 TEUs but also up 9.2% from the
smaller ports have boosted the major ports’ combined 1,533,934 total TEUs they had handled in July 2019. In
share of containerized import tonnage through mainland third came the Port of New York/New Jersey (PNYNJ)
U.S. ports by 1.5-2.0%. with 758,810 TEUs. Fourth place went to Savannah with
449,916 total TEUs. The Northwest Seaport Alliance Ports
San Diego and the Port of Hueneme are both important
of Tacoma and Seattle ranked fifth among the U.S. ports
ports-of-entry for refrigerated containers laden with
we track with a total of 307,592 total TEUs in July.
fresh fruit imports from Central and South America.
And Portland (the riverport in Oregon, not the seaport in Not surprisingly, the Port of Los Angeles was also
Maine) is gradually re-establishing itself as a significant the nation’s busiest port year-to-date, with 6,318,675
player in the international container trade, with the total TEUs through July. Second was Long Beach with
number of total TEUs handled in July (5,820 TEUs) up 5,538,673 TEUs, while PNYNJ placed third with 5,153,882
from precisely zero two years ago. In Washington state, TEUs. Savannah handled 3,190,459 total TEUs through
the Port of Everett handles several thousand TEUs a year, July of this year, while the NWSA ports processed
many on behalf of a nearby manufacturer of civilian and 2,167,766 TEUs. (Vancouver reports it handled 2,237,042
military aircraft. total TEUs through the first seven months of 2021, but
we’ll wait to see if their numbers change.)
The role of the smaller ports is not trivial. Through this
year’s first seven months, the Big Five USWC ports For nitpickers who don’t believe empty boxes should
accounted for a 36.2% share of all containerized import count, Los Angeles remained in the lead with 560,800
tonnage that entered U.S. mainland ports. Adding in the loaded TEUs in the month of July, down 3.7% from last
containerized imports at the smaller West Coast ports July and 12.1% from July 2019. In fact, July’s tally of
bumped the overall USWC share up to 38.0%. loaded TEUs at LA was the smallest since July 2016.
September 2021 Page 7West Coast Trade Report
Detailing the July 2021 TEU Numbers Continued
However, PNYNJ ran second place with 505,104 loads, two years earlier. By contrast, the Northwest Seaport
ahead of the 492,891 loads handled at third place Long Alliance ports moved just 2.8% of the mainland ports’
Beach, which was 4.4% below last July traffic in loaded scrap paper exports in July, down from a 5.3% share in
TEUs. Savannah was well behind with 346,949 loaded July 2019.
TEUs followed by Virginia with 224,030 loads.
The other big scrapper was, not surprisingly, the home of
In the category of inbound loads discharged in July, ticker-tape parades. The Port of New York/New Jersey
Los Angeles (469,361 TEUs) topped PNYNJ (393,945 accounted for 26.8% of scrap paper export tonnage this
TEUs) and Long Beach (382,940 TEUs). Inbound loads at July, up from 23.5% two years ago. But then, containerized
Savannah meanwhile totaled 227,876 TEUs, while fifth scrap paper tonnage leaving PNYNJ in July did increase
place Virginia handled 142,963 inbound loaded TEUs. 3.1% from July 2019, presumably as city dwellers who had
Once again, export loads were again a different story. been ordering-in over the past year-and-a-half disposed of
Savannah led all ports in July with 119,072 loaded export all that packaging.
TEUs. PNYNJ came next with 111,159 TEUs, edging out Soybeans in Boxes Puzzle
Long Beach (109,951 TEUs). That left the Port of Los We continue to be impressed -- to the point of terminal
Angeles (91,440 TEUs) in fourth place, ahead of fifth
dismay -- by the persistence of some trade journalists
place Virginia (81,068 TEUs). Compared with July of pre-
to obsess about containerized exports of soybeans. To
pandemic 2019, loaded export TEUs from LA plummeted
read their reports, especially the ones salted with quotes
by 43.3% but were off by just 1.5% next door at Long
from the soybean trade lobby, one might reasonably get
Beach. PNYNJ’s loaded export traffic was down by 33.9%
the impression that the entire U.S. soybean export trade
from July 2019. Both Savannah and Virginia recorded
hinges on the availability of TEUs and FEUs.
small gains of 1.1% and 0.1%, respectively.
Well, the latest soybean crop year (which runs from
Scraping for Scrap
September 1 through August 31) has just ended, and
It is perhaps heartening, at least momentarily, to see
we are blessed to have U.S. government export data for
Scrap Paper (HS 4707) accounting for 18.1% of all
11/12ths of that period. Here, without further aspersions,
containerized export tonnage from the two San Pedro Bay
are the numbers:
ports in July. That’s scrap paper’s highest share of the
outbound business at the two ports since the summer of Between last September 1 and July 31 of this year,
2019. Of course, none of this is really a cause to cheer. 55,552,756 metric tons of U.S. soybeans were shipped
U.S. trade statistics show that overall containerized abroad by sea. Of that, 9.2% or 5,100,268 metric tons
export tonnage this July from the Ports of LA and Long traveled in containers. That’s it: 9.2%, a share that has
Beach was down 20.7% from the same month in the persistently danced below one-tenth of all soybeans
halcyon days two years ago, when the most everyone shipped overseas in recent years.
had to worry about was a presidential conviction that
foreigners pay for the tariffs he had been imposing. The If writers are interested, there are a few other commodity
only reason scrap paper’s share of the export business groups whose containerized heft might be at least equally
at the two ports rose was because scrap paper exports worthy of their consideration. Waste and Scrap Paper
through the ports shrank by only 9.9% in that period. Still, over the past eleven months totaled 12,044,813 metric
the two ports did account for 30.6% of all containerized tons, while exports of Polymers of Ethylene amounted
scrap paper shipped from U.S. mainland ports in July, the to 6,665,780 metric tons. And let’s not overlook the
same share they held in July 2019. 5,178,854 metric tons of Ferrous Waste and Scrap
exports.
The Port of Oakland continues to fight above its weight by
handling 15.0% of the nation’s containerized scrap export But maybe scraps and polymers lack the sheer editorial
tonnage in July, roughly consistent with its 15.2% share drama of soybeans.
September 2021 Page 8West Coast Trade Report
Detailing the July 2021 TEU Numbers Continued
The Twilight of California’s Tree Nuts?
Exhibit 6 California Almond and Walnut Exports in
There are definite signs that the cultivation of tree nuts
Recent Crop Years
in Northern California, which had expanded dramatically Sources: California Almond Board, California Walnut
in recent years, may have reached its high-water mark. Board
Seasons of parlous snowfalls and scant rains, much In U.S. Tons
discussed lately in the national news, represent an 1200000
visceral challenge to growers. An NPR report last month 1000000
warned that the “historic drought across the U.S. West
is taking a heavy toll on California’s $6 billion almond 800000
industry, which produces roughly 80% of the world’s 600000
almonds. More growers are expected to abandon their
orchards as water becomes scarce and expensive.” 400000
In May, the U.S. Department of Agriculture forecast that 200000
California’s almond crop would hit a record 3.2 billion 0
pounds this year. By July, though, conditions in the field 2015-16 2016-17 2017-18 2018-19 2019-20 2020-21
had worsed enough for USDA to dial back that estimate to Almonds Walnuts
2.8 billion pounds.
Allocations of irrigation water are now being curtailed by
But how is this happening? Aren’t walnuts and almonds
state water regulators, and years of pumping groundwater
normally shipped abroad in containers that are reportedly
have literally undermined portions of the Central Valley.
in short supply? What about the stories of ocean
Reports abound of growers ripping out hundreds of acres
carriers stiff-arming American farm exports in favor of
of healthy trees to conserve water for those trees that
hastily returning empty containers to be refilled with
remain. Not surprisingly, there is a very strong likelihood
Asian manufactures? Aren’t farm exports dropping
that California will be producing fewer almonds and
precipitously?
walnuts in the years to come.
The numbers, however, paint a different picture, and
Absent a dramatic change in the climate that would bring
in this case the numbers are those of the federal
more rain and snow to the state, the situation will only
government. Meanwhile, in tonnage terms, containerized
worsen, and the competition for scarce water supplies
exports of agricultural goods through the Port of Oakland
will increasingly pit growers against urban interests.
in the first seven months of this year were not only ahead
Ultimately, residents of the state’s cities will ask why they
of last year but represented a 14.7% gain over the same
should take fewer showers so that farmers in Merced
period in the pre-pandemic year of 2019.
County can grow more almonds to sell to foreigners.
(About two-thirds of the state’s almonds and walnuts are So why are so many people up in arms about the plight of
exported.) farm exporters?
But for now, it’s a more upbeat story about burgeoning Beats us.
exports. As Exhibit 6 shows, global markets have been
more than generous to California’s tree nut growers.
September 2021 Page 9West Coast Trade Report
Jock O’Connell’s Commentary:
When the Righteous Squabble Intramurally
Depending on where you sit (which, of course, often would appear to give a path to near-zero technologies.
determines where you stand), there are few things more Meanwhile, the state legislature, in a nod to organized
disheartening or amusing than when groups that normally labor, has blocked state resources from being tapped to
read enthusiastically from the same page have a falling deploy zero-emission automated equipment at California’s
out, usually over which is the more fervent in espousing ports.
their common goals.
What’s especially entertaining about the dispute that
That’s precisely what’s been happening lately within the evolved this summer is how SCAQMD has taken to
clean air division of Southern California’s environmental defending itself against the region’s air quality zealots
community. As far as anyone can untangle internecine by using many of the same arguments long made by
tiffs, the central issue here is apparently over whether the the Pacific Merchant Shipping Association (PMSA) in
South Coast Air Quality Management District (SCAQMD) contesting the efforts of SCAQMD and CARB to depict the
should focus exclusively on mandating zero-emission San Pedro Bay ports as the heedless, uncaring villains of
trucks and other goods movement conveyances and Southern California’s decades-old air quality drama.
not be distracted by what are seen as environmental
The current quarrel was precipitated by a letter to
half-measures, namely an interim reliance on near zero-
SCAQMD from some two-dozen clean-air advocacy
emission vehicles to meet federal air quality standards.
groups, including the Sierra Club, the Union of Concerned
Zero-emission (ZE) is nearly everyone’s cherished goal, Scientists, and the Natural Resources Defense Council,
but the quest for perfection again seems to thwart as well as such other stalwarts of the environment as
progress in cleansing the air of diesel pollutants. the International Brotherhood of Teamsters. The letter
California officials are themselves conflicted on how expressed the signatories’ disappointment with the pace
best to attain a ZE goods movement state. Although with which the SCAQMD was pushing for the adoption
SCAQMD rebukes a zero-emission only approach to of a true ZE transportation system. More specifically, the
emission reductions, the California Air Resources Board regulators were condemned for approving NZE engine
(CARB) publicly and privately opposes any strategy that technologies as interim measures to reduce noxious
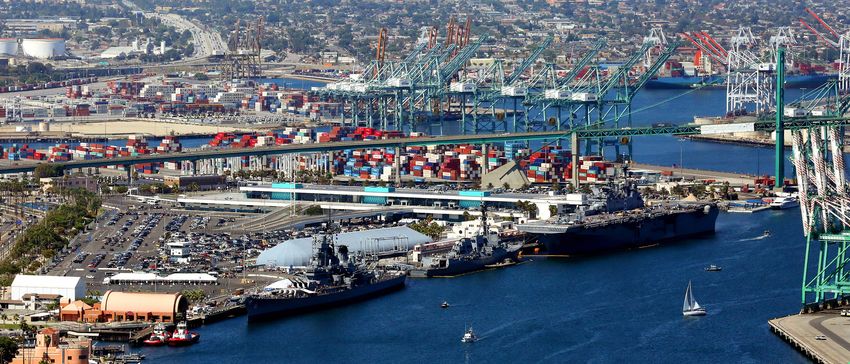
Photo courtesy of the Port of Los Angeles
September 2021 Page 10West Coast Trade Report
Commentary Continued
emissions. Actually, the letter went beyond expressing ZE trucks, affordability remains a significant barrier to
disappointment by suggesting that SCAQMD was large-scale adoption. Finally, even if all these barriers were
somehow in cahoots with “oil and gas interests.” Playing addressed, the charging/fueling infrastructure (plugs and
the customary Environmental Justice Card, the agency’s hydrogen dispensing stations), the electrical distribution
critics charged that SCAQMD policies would only continue system (neighborhood transformers, substations,
to expose the predominantly low-income, predominantly etc.) and the power/fuel supply to support widespread
minority group residents of communities adjacent deployment will take many years to develop.”
to the streets and highways serving the Ports of Los
So there. SCAQMD evidently does not believe in the same
Angeles and Long Beach to debilitating if not lethal toxic
magic-thinking that seems to inform its critics. While the
emissions.
amount of emission reductions needed to attain federal
Wayne Nastri, the SCAQMD Executive Officer, was having clean air standards is daunting, Nastri wrote, “it would be
none of this. irresponsible for our agency to effectively throw up our
hands and not explore all options for reducing emissions
As he fired back at his organization’s erstwhile allies:
now.”
“As a public health agency charged with protecting our
residents from harmful air quality, we are dismayed In one of his more caustic rebukes, Nastri claimed
to find ourselves at odds with organizations that also that the letter’s authors “strongly suggest that NZE
advocate for clean air and, are further troubled that you trucks threaten public health because 1) they are only
falsely accuse us of representing oil and gas interests. “incrementally cleaner”, 2) natural gas is a toxic fuel,
Even more disturbing is that the position you espouse and 3) NZE trucks produce more ultrafine particles. You
– investment solely in ZE technology – will necessarily further infer that NZE trucks may be more toxic than
delay attaining federal air quality standards, prolonging diesel trucks because of their ultrafine emissions. Neither
community exposure to unhealthy levels of smog, of these statements is supported by science and belie a
particulate matter, and toxic diesel exhaust.” zealous belief that any technology associated with natural
gas is inherently polluting over a more fact-based and
He then went on to detail his agency’s considerable and
objective view.” [Emphasis added.]
commendable role in advancing ZE technology through
investments in research and by creating a regulatory Far from it, he went on to say: “Near-zero emission (NZE)
environment that put the region “on the cusp of a future technology has been commercially demonstrated and is
where widespread deployment of ZE technology is a available today, has sufficient fueling infrastructure that
reality.” is largely funded by the private sector, and is at least 90%
cleaner than new diesel trucks on NOx and 100% cleaner
But, in doing a fine impersonation of PMSA President
on cancer-causing diesel particulate matter. When fueled
John McLaurin, Nastri then wrote: “…we also know that
by renewable natural gas, these vehicles can also provide
reality simply isn’t here yet -- at least not for heavy-
substantial greenhouse gas emission reductions. Further,
duty Class 8 trucks. Manufacturers make promises, the
these vehicles are far more cost-effective than ZE trucks,
vehicles can be ordered, but cannot be delivered and put
allowing limited incentive funds to stretch further. Given
into service on anything other than a small-scale pilot
these benefits, it is disturbing that you advocate for
basis. And even if they were ready to be manufactured
investments only in technologies that are not yet ready for
at large scale today, there are substantial challenges
prime time, a position that would leave our residents no
regarding whether the duty cycles for ZE Class 8 vehicles
option but to continue to suffer the ill effects from diesel
can meet business needs, and whether a service network
exhaust for years to come.”
is available for businesses that acquire these vehicles.
In addition, the cost of ZE technologies is substantially He concluded that the letter’s assertion that any
higher than non-ZE technologies, and while eventually investment in NZE technology would be funds not spent
we expect the total cost of ownership to be lower for on ZE technology involved a false dichotomy. “Today we
September 2021 Page 11West Coast Trade Report
Commentary Continued
need both – a pathway to get emission reductions now as equipment at the Port of Los Angeles have actually
well as plans for a ZE future. The choice in trucks today is dropped by 91% between 2005 and 2017, the most recent
not between ZE and NZE trucks, but between NZE trucks year data is available. Similarly, nitrous oxide (NOx)
and diesel.” emissions from terminal equipment at the port fell by 74%
between 2005 and 2019.
Consider the remarkable similarities between what Nastri
told his agency’s critics to the points made by PMSA’s McLaurin went on to insist that “the cleanest heavy-
McLaurin in replying to an August 16 editorial in the duty trucks operating in North America, if not the world,
Los Angeles Times entitled “Port Pollution Is Choking operate at the ports of Los Angeles and Long Beach. No
Southern California”. one has stricter truck emission requirements [courtesy
of SCAQMD and the California Air Resources Board]
In a tart response to the head of the Times editorial
than those imposed on trucks doing business at the two
board, McLaurin wrote: “While the editorial might have
ports. And the trucking industry is testing both battery
been valid in the early 2000’s, its findings with respect to
electric and hydrogen powered trucks – neither of which
current technology advancements and actual emission
are currently commercially proven nor available.” [Emphasis
reductions were incorrect.”
added.]
He went on to say that no one is “…dragging their feet
It’s as if, in countering the complaints voiced by the
on cutting emissions. The ports have adopted several
versions of their Clean Air Action Plan (CAAP) which have professional environmentalists, Wayne Nastri agreed with
addressed emissions from marine terminal equipment, John McLaurin on the basic points of what is realistically
ships and trucks. The current plan is seeking to have achievable.
zero emission marine terminals by 2030 (not 2035 per Before letting you go, I have two final points to offer.
your editorial) and zero emission trucks by 2035 – years
ahead of any other industrial sectors in California. Total First, editorial boards are typically obliged to produce
port related emissions over the past decades have been two or three editorials a day. How do they do it? How
significantly reduced. NOx has been reduced by 60%, SOx well-informed are they about the topics on which they
by 98% and DPM emissions by 87%. And more reductions have chosen to comment? How hasty, in other words, is
will occur under the CAAP, CARB regulations and incentive their pudding? An editorial board member at a leading
programs. We are not aware of any similar requirements California newspaper (not the Times) recently told me
at East Coast (or any ports in North America) and that for him “it’s like writing two or three college term
European ports.” papers every week”. You pick topics that are of public
policy interest. You do some research, maybe call one
McLaurin also informed the Times editorial board of two experts or aggrieved parties. Then you craft what
that terminal operators are already using the lowest purports to be the paper’s position. And, since you’re in
emission equipment currently commercially available; the news business, you’ve got to finish before what you’re
one marine terminal is completely zero emission using writing about is no longer news.
battery technology and two other terminals are using
a combination of battery/diesel and grid-connected It’s also worth remembering that not every college term
technology for some of their equipment. paper gets an A+.
The idea, he wrote, that emissions have not dropped My other final point involves the imperative of
over the past decade as purported by the editorial is not occasionally getting out of the office or away from a
supported by fact. Contrary to what a group of journalists computer screen and refreshing one’s perspective. The
penning a dozen or more editorials each week on a emotional component of the clean-air lobby’s push for
disparate menu of topics might think they know about ZE transportation systems routinely summons up the
what’s been going on down on the waterfront, emissions deplorable condition of the low-income, heavily minority
of diesel particulate matter from marine terminal neighborhoods clustered along the highways serving the
September 2021 Page 12West Coast Trade Report
Commentary Continued
state’s ports. It is a compelling argument of how the least the sounds of engines and tires on concrete, the Bay
affluent seem to be bearing a disproportionate share of Area Air Quality Management District tells us that the
the environmental burden of an efficient goods movement air on Rincon Hill contains some of the highest levels of
system because these are among the few California harmful vehicle emissions in town. The people who opt to
neighborhoods in which they can afford to live. live here are doubtless among the most highly educated
and scientifically savvy Californians. They surely know
But I am wondering how many environmental activists
all of this before moving in. After all, the Bay Bridge
who have been so agile in turning over the Environmental
and its freeway ramps have been there for nearly ninety
Justice Card have been noticing the growing number of
years and are not easily overlooked. Neither is the traffic
apartment buildings springing up literally within feet of
congesting them. Yet, that all these folks still opted to live
busy freeways around the state. Take, for example, the
in such an environment certainly adds a novel twist to the
cluster of modern buildings on San Francisco’s Rincon
concept of environmental justice.
Hill, a neighborhood adjacent to where the Bay Bridge
lands in the city of San Francisco. These private housing
developments, often high-rise and invariably high-end,
Disclaimer: The views expressed in Jock’s commentaries
occupy some of the choicest urban real estate available.
are his own and may not reflect the positions of the Pacific
As much as architects and engineers can dampen the
Merchant Shipping Association.
vibrations of freeway traffic just yards away and muffle
Why the Port of Seattle Commission Election is Important
By Jordan Royer, PMSA Vice President, External Affairs
If those of us in the logistics and port industry were The Port of Seattle Commission races have, for
hoping to avoid participating in the political fight within the first time, attracted the attention of Congress.
the Democratic Party, well, better luck next time. What Congresswoman Pramila Jayapal, the leader of the
once were sleepy port commission elections in the Progressive Caucus in Congress, has taken a personal
Pacific Northwest are now proxy wars for who controls interest in two races in Seattle – those currently
the Democratic Party – Moderate Democrats or Far Left held by Stephanie Bowman and Peter Steinbrueck.
Progressives. And while the energy is so far focused on Bowman’s challenger is former Jayapal staffer Hamdi
the Port of Seattle, the Port of Tacoma may not be far Mohamed. Steinbrueck’s challenger is Toshiko Grace
behind. Hasegawa, daughter of State Senator and Progressive,
Bob Hasegawa. And Bernie Sanders has endorsed both
And perhaps most worrisome is the impact a new Seattle challengers as well as Seattle Mayoral candidate Lorena
Commission could have on the sustainability of the Gonzalez, running as a Progressive against the Moderate
Northwest Seaport Alliance – a partnership between the Democrat, Bruce Harrell. It is hard to believe that Senator
two ports. Sanders would make these endorsements without the
encouragement of Jayapal. It is also hard to believe he
For now, if one wants proof of the difference between port
would even know port commissioners are elected in
commission races in Seattle and Tacoma, just follow the
Washington State.
money. Both commissions have three seats up for grabs.
The total campaign cash raised in Seattle is $607,000, The unusual nationalizing of these races has assisted the
while the total in Tacoma is only $22,000. In fact, it’s hard challengers in raising campaign cash as well as bringing
to find much evidence of campaign activity in Tacoma at in endorsements that would normally go to well-known
all, with incumbents likely to win in November. elected leaders like Bowman and Steinbrueck.
September 2021 Page 13West Coast Trade Report
Port of Seattle Commission Election Continued
Besides the unusual national interest in these races, are best for the port and the region but terrible for them
there is also a problem we have seen before: candidates politically. And predictably, they become angry at staff
talking about a desire for the port to do more on issues for bringing these decisions to them. But at the core, the
that they have no jurisdiction over or responsibility for. ports build infrastructure, lease it out, and create good
Whether it is building affordable housing, high-speed rail, family wage jobs. Many of these companies that create
or other social issues, there is always a desire for elected the jobs are connected internationally with all number of
commissioners to be part of the story on the on the front businesses and countries. There is always something for
page of the newspaper. Commissioners may also see activists to complain about.
involvement in these issues as the only way to create
And coming from an activist background and becoming a
opportunities for the next elective office.
Port Commissioner can be a painful experience when you
But the Seattle Port Commission has rarely been a have to take positions your friends don’t like. And when
launching pad for successful political careers. A former you layer the ideological battle for the Democratic Party
commissioner, Pat Davis, may have said it best: “the and nationalized port races onto that conundrum, how
job has not been a springboard but a gang plank.” In can dysfunction and disappointment not follow?
recent memory, there have been two commissioners
Most observers believe the partnership between the Ports
who have gone on to elective office: Paul Schell, who
of Tacoma and Seattle in the Northwest Seaport Alliance
became Mayor of Seattle, and Gael Tarleton, who became
is a good thing. It is hard to know how this year’s port
an influential State Representative. But Schell ran for
commission elections will turn out and even harder to
Mayor unsuccessfully in 1977, became a fixture in city
know the impact on that alliance. But it is something that
government and then became a commissioner before
should warrant careful consideration by everyone in the
becoming Mayor in 1998.
maritime and port logistics industry.
There is really one major reason this dynamic is in place:
Commissioners must sometimes make decisions that
Interested in membership in PMSA?
Contact Laura Germany for details at: lgermany@pmsaship.com or 510-987-5000.
PMSA Copyright © 2021
It is prohibited by law to forward this publication to any other person or persons. This material may not be re-published, broadcast,
rewritten or distributed without written permission from PMSA. Follow PMSA on Twitter @PMSAShip and Facebook.
September 2021 Page 14West Coast Trade Report
Import Dwell Time Is Up For August; Rail Dwell Time Is Down
September 2021 Page 15You can also read