Station and train surface microbiomes of Mexico City's metro (subway/underground) - bioRxiv
←
→
Page content transcription
If your browser does not render page correctly, please read the page content below
bioRxiv preprint first posted online Aug. 14, 2019; doi: http://dx.doi.org/10.1101/735027. The copyright holder for this preprint
 (which was not peer-reviewed) is the author/funder, who has granted bioRxiv a license to display the preprint in perpetuity.
 It is made available under a CC-BY-ND 4.0 International license.

 Station and train surface microbiomes of
 Mexico City's metro
 (subway/underground)
 Running title: Mexico City’s metro surface microbiome

 Apolinar Misael Hernándeza, Daniela Vargas-Roblesa,b, Luis D. Alcarazc, Mariana Peimberta#

 a
 Universidad Autónoma de Metropolitana, Unidad Cuajimalpa, México City, México
 b
 Servicio Autónomo Centro Amazónico de Investigación y Control de Enfermedades Tropicales
 Simón Bolívar, MPPS, Puerto Ayacucho, Venezuela
 c
 Departamento de Biología Celular, Facultad de Ciencias, Universidad Nacional Autónoma de
 México, México City, México

 #
 Universidad Autónoma de Metropolitana, Unidad Cuajimalpa (UAM-C)
 Avenida Vasco de Quiroga 4871, Santa Fe Cuajimalpa, 05370 Cuajimalpa, CDMX.
 +52 55581-46500,3806 marianapeimbert@gmail.com
bioRxiv preprint first posted online Aug. 14, 2019; doi: http://dx.doi.org/10.1101/735027. The copyright holder for this preprint
 (which was not peer-reviewed) is the author/funder, who has granted bioRxiv a license to display the preprint in perpetuity.
 It is made available under a CC-BY-ND 4.0 International license.

 Abstract
 The metro is one of the more representative urban systems of Mexico City, and it transports
 approximately 4.5 million commuters every day. Large crowds promote the constant exchange of
 human and environmental microbes. In this study, we determined the bacterial diversity profile of
 the Mexico City subway by massive sequencing of the 16S rRNA gene. We identified a total of
 50,197 operative taxonomic units (OTUs) and 1058 genera. The metro microbiome was
 dominated by the phylum Actinobacteria and by the genera Propionibacterium (15%) (P. acnes
 13%), Corynebacterium (13%), Streptococcus (9%), and Staphylococcus (5%) (S. epidermidis;
 4%), reflecting the microbe composition of normal human skin. The metro microbial sources were
 skin, dust, saliva, and vaginal, with no fecal contribution detected. A total of 420 bacterial genera
 were universal to the twelve metro lines tested, and they contributed to 99.10% of the abundance.
 The large OTUs number are probably reflecting the vast human influx, while selection from hosts
 and environments are constraining the genera diversity, shown by the OTUs to genus ratio.
 Finally, this study shows that the microbial composition of the Mexico City subway comes from a
 mixture of environmental and human sources and that commuters are exposed to normal human
 microbiota.

 Introduction
 Public transport systems provide the ideal environment for the transmission of microorganisms,
 as they carry a multitude of people, and their microbiomes, on a daily basis. The metro can
 assemble an extensive repository of beneficial bacteria, such as commensals and symbionts, or
 harmful bacteria, becoming a vehicle for the transmission of infectious diseases. The Mexico City
 metropolitan area has a population of 21.3 million people, which makes it the largest city in the
 Western Hemisphere. Mexico City’s metro has more than 4 million users every day, totaling
 1,647,475,013 users annually (https://metro.cdmx.gob.mx/) and is the second busiest subway of
 the American continent, after New York city's, and the ninth busiest in the world1. It has been in
 use since 1969 and today has 12 lines and 196 stations; it travels through a network of 226.5 km
 and operates 365 days of the year, covering a radius of around 10 km around the urban sprawl
 of Mexico City. The various lines were individually constructed at different points in history, which
 has led to differences in the infrastructure and the wagon type between lines; although all lines
 have pneumatic wheels, some of also have iron wheels. Most of the lines go through different
 sections, including underground, superficial, and elevated above ground level, and are ventilated
 by extractors, fans, or open windows. The size of passenger influx differs by line and by station,
 with higher influx terminal stations and transfer stations. Terminal stations connect the inner city
 to the suburban areas, where most of the population live. This mass movement of people breathe
 the same air and touch the same surfaces, promoting a large-scale interchange of human and
 environmental microbiota. Several factors differentiate the subways of each city. In Mexico City,
 there are three rush hours per day: the commute to and from work and another peak at noon that
 seems to correspond to the schools schedule. The number of trips/person/day is 2.37, similar to
 London and Seville (2.31 and 2.33, respectively), but much lower than the New York or Paris
 average (3.79 and 3.70, respectively)2.
bioRxiv preprint first posted online Aug. 14, 2019; doi: http://dx.doi.org/10.1101/735027. The copyright holder for this preprint
 (which was not peer-reviewed) is the author/funder, who has granted bioRxiv a license to display the preprint in perpetuity.
 It is made available under a CC-BY-ND 4.0 International license.

 Previous studies have indicated that a significant proportion of subway surface bacteria come
 from the skin of passengers, so the lifestyle of these passengers is also important. Among the
 chemical and physical factors directly influencing the microbiome, the most obvious are
 temperature and humidity, but there are many other important factors such as differences in the
 ventilation systems, whether or not the trains are pneumatic, and pollution. Therefore, studies
 from other networks can be used for reference, but the local diversity will only be understood by
 directly studying the subways of Mexico City. Multiple studies have characterized the subway
 microbiomes of various densely populated areas, such as New York City, Boston, Hong Kong,
 and Barcelona3-8. Mexico City is one of the most densely populated areas in the world (6,000
 people/km2 in Mexico City; 9,800 people/km2 in the Greater Mexico City area). However, Mexico
 City’s subway microbiome has been scarcely explored. Only one previous study has
 characterized the colony-forming units (CFU; N = 175 isolates) in the air of the subway transport
 system, identifying three Fungi genera and concluding that the majority of bacteria were Gram-
 positive bacilli9.

 It has been estimated that humans are capable of emanating 106 particles per hour10-12. As a
 rough estimation, the 4 x 10⁶ Mexico City metro users per day, with an average commuting time
 of 2.3 hours13, release a total of 9.2 x 10¹² particles in the metro every day. Additionally, the metro
 architecture favors the presence of multiple aerosol particles from other sources, so the metro
 can be thought of as a vast shared pool for the horizontal exchange of human-derived, soil, plant,
 and microbes and their DNA. In previous work, the built environment has been shown to be
 biologically different when inhabited by people, compared to empty spaces, and even human
 “cloud” microbiomes can be used to distinguish the microbiota signatures of individuals four hours
 after they have departed10,14. In this study, we revealed the bacterial diversity profile of the Mexico
 City metro with massive sequencing of the 16S rRNA gene. We took 47 samples from station
 turnstiles and train handrails, covering all 12 metro lines of Mexico City. This work is the first
 culture-independent investigation of subway microbiome in Latin America.

 Results
 We studied the twelve Mexico City metro lines and collected 47 samples for this study (Fig. 1).
 The samples were taken from station turnstiles (N = 24) and train handrails (N = 23). We
 sequenced a total of 16.6 x 10⁶ V3-V4 16S rRNA gene reads, spanning 4.98 Gb of coverage. The
 reads were merged into 5,788,162 sequences (avg = 460 bp); with a mean of 106,057
 sequences/sample. This represents the largest published record of Mexico City’s metro
 microbiological diversity. The sequences were clustered into operational taxonomic units (OTUs;
 97% identity 16S rRNA gene) recovering 50,174 OTUs. The OTUs were then homology-matched
 and summarized as 1,058 distinct bacteria genera (Table S1).
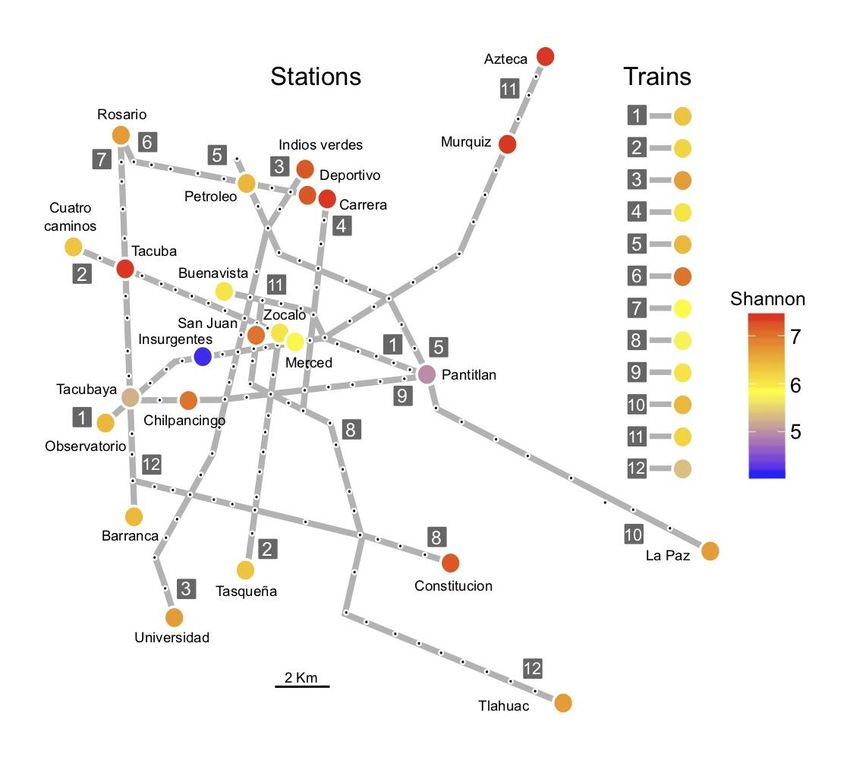
bioRxiv preprint first posted online Aug. 14, 2019; doi: http://dx.doi.org/10.1101/735027. The copyright holder for this preprint
 (which was not peer-reviewed) is the author/funder, who has granted bioRxiv a license to display the preprint in perpetuity.
 It is made available under a CC-BY-ND 4.0 International license.

 Fig 1. Sampling diversity and location. The metro network, with each black dot representing a
 station and colored circles showing the sampling locations. The circles are colored according to
 the Shannon diversity index. Train diversity is also shown in colored circles.

 The most diverse station was Carrera, with a Shannon diversity index of H' = 7.36, followed by
 Azteca station (H' = 7.35), Muzquiz (H' = 7.31), Tacuba station (H' = 7.30), and Indios Verdes (H'
 = 7.16); the lowest diversity was found on metro Line 1 (Insurgentes station; H' = 4.10) (Fig. 1).
 The train with the highest diversity was found on Line 6 (H' = 7.38), followed by Line 3 (H' = 6.96),
 and line 5 (H' = 6.63). The lowest diversity train was found on Line 8 (H' = 5.54). The average
 Shannon diversity (H'(average) = 6.51) from the stations (turnstiles) was higher than the average train
 (handrails) diversity (H’(average) = 6.24) (Fig. 2; Suppl. Table S2). We performed a comprehensive
 sampling of the metro’s diversity, as we did not find differences between the observed and
 expected (Chao1) richness (Fig. 2) when comparing genera, and the observed and expected
 were in the same magnitude order when comparing OTUs. The Simpson diversity index showed
 a slightly increased dominance for the turnstile when compared to handrails (Suppl. Table S2).

 We tested multiple factors regarding the microbial richness, diversity, and composition, looking
 for significant relationships among metro line numbers, station connectivity (regular, transfer, and
 terminal stations), station surroundings (bus terminals, work-related buildings, schools, hospitals),
 architectural structure (above ground, below ground stations), train wheels (metallic and
 pneumatics), train design (individual wagons or connected), and physical variables like
 temperature, relative humidity, geographical zones, and people influx. However, there were only
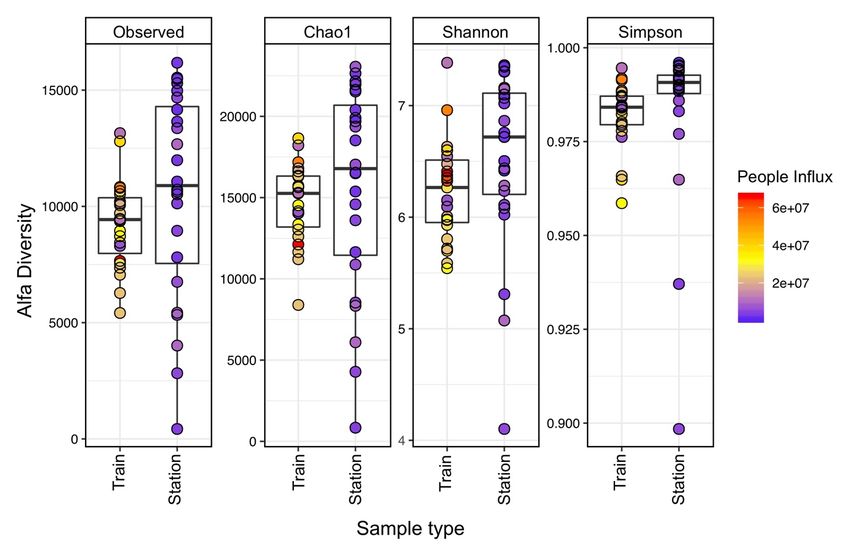
bioRxiv preprint first posted online Aug. 14, 2019; doi: http://dx.doi.org/10.1101/735027. The copyright holder for this preprint
 (which was not peer-reviewed) is the author/funder, who has granted bioRxiv a license to display the preprint in perpetuity.
 It is made available under a CC-BY-ND 4.0 International license.

 statistically significant differences when we compared the surfaces of station turnstiles with train
 handrails (Fig. S1). Turnstiles showed higher OTU diversity than handrails (OTU level, Simpson,
 KW p = 0.004) and had higher diversity dispersions (Observed OTUs and Chao1, p < 0.001,
 Fligner-Killeen test, Fig. 2). Similar results were observed at the genus level (for all metrics, p <
 0.003, KW, Fig. S2), which had similar dispersions (p > 0.094, Fligner-Killeen test, Fig. S2).

 Fig. 2. Richness and diversity of Mexico City’s metro. The surface microbiome diversity on
 the station entrance/exit turnstiles and the metro wagon handrails. A total of 50,174 OTUs were
 observed, across 47 samples.
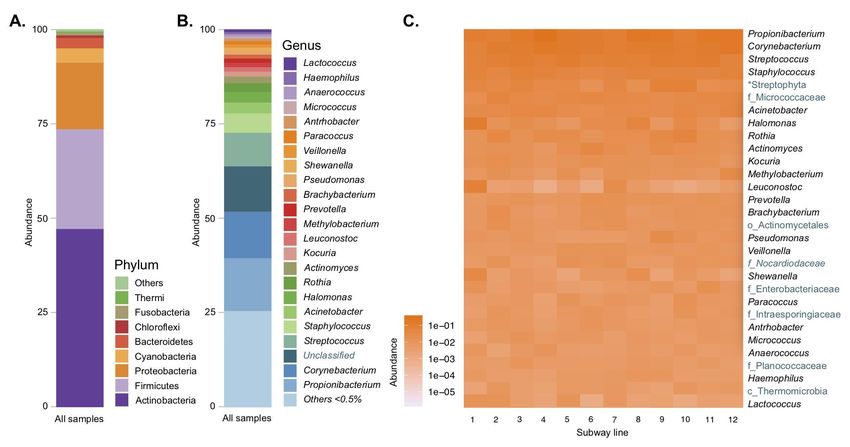
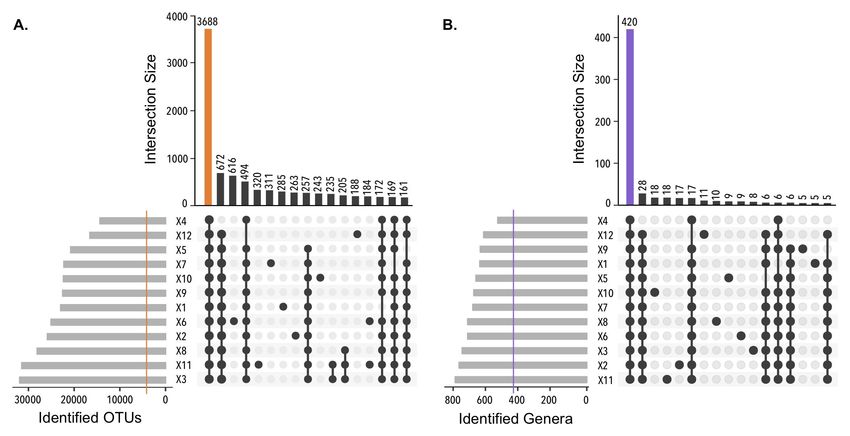
bioRxiv preprint first posted online Aug. 14, 2019; doi: http://dx.doi.org/10.1101/735027. The copyright holder for this preprint
 (which was not peer-reviewed) is the author/funder, who has granted bioRxiv a license to display the preprint in perpetuity.
 It is made available under a CC-BY-ND 4.0 International license.

 Fig. 3. Shared taxa between subway lines, train, and station samples. A. Shared OTUs: of
 the 50,174 OTUs, 3,688 were found in all lines. B. Shared genera: of 1,058 genera, 420 were
 found in all lines. The 420 genera represented 99.10% of the entire dataset. The colored line in
 cardinalities of sets indicates the number of shared elements. Sets smaller than 150 elements for
 OTUs, and sets smaller than 5 elements for genera, were excluded from the diagrams.

 Mexico City’s metro is highly diverse at the OTU level (50,174 OTUs). By merging the OTU
 diversity with the bacterial genera diversity by line, we found that 420/1,058 genera were
 ubiquitous throughout the metro system (Fig. 3). Moreover, these 420 genera, representing 3,688
 OTUs, constituted 99.10% of the whole dataset, expressed in sequence abundance. The other
 638/1,058 genera contributed to just 0.9% of the overall richness. We are confident this work has
 comprehensively described the Mexico City metro bacterial genera diversity, and that the diversity
 has a fairly homogeneous distribution across the metro system. We concluded the main phyla
 detected were Actinobacteria, Firmicutes, Proteobacteria, Cyanobacteria, Bacteroidetes,
 Chloroflexi, Fusobacteria, and Thermi (Fig. 4A).

 There are multiple genera with low abundance (1,034 genera < 0.5%) in our study, and the most
 abundant known genera were Propionibacterium (15%), Corynebacterium (13%), Streptococcus
 (9%), and Staphylococcus (5%) (Fig. 4B). Interestingly, some of the most abundant genera were
 unclassified, but we were able to assign them to upper taxonomic hierarchies (29.43%). The
 ubiquity and prevalence of the core genera are exemplified in a heatmap showing the 30 most
 abundant genera in the system, which are also dominant in each metro line (Fig. 4C); the
 complete 420 genera heatmap and table are also available (Suppl. Fig. S3, Suppl. Table S3).
 The heatmap also shows the upper taxonomic level classifications for unknown genera and points
 out some candidates for examination, such as members of the families Micrococcaceae,
 Nocardiaceae, Enterobacteriaceae, Intraesporingiaceae, and Planococcaceae; along with
 members from the order Actinomycetales and the class Thermomicrobia (Fig. 4C). The fifth most
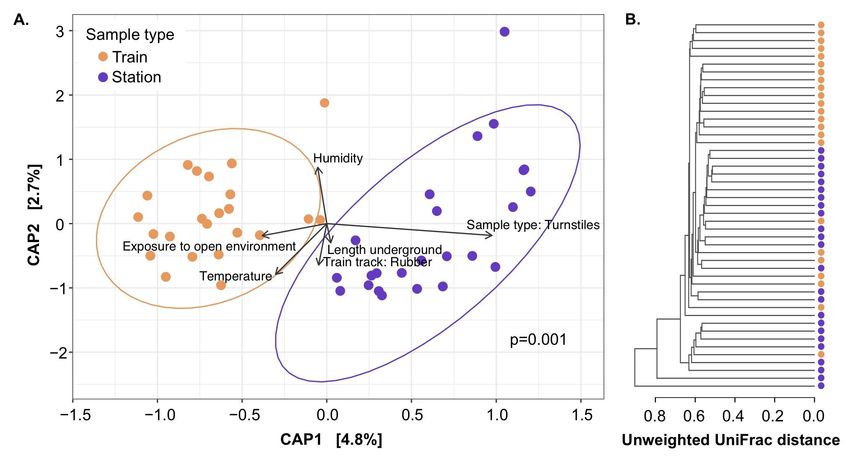
bioRxiv preprint first posted online Aug. 14, 2019; doi: http://dx.doi.org/10.1101/735027. The copyright holder for this preprint
 (which was not peer-reviewed) is the author/funder, who has granted bioRxiv a license to display the preprint in perpetuity.
 It is made available under a CC-BY-ND 4.0 International license.

 abundant phylotype was classified as chloroplast (Streptophyta). Archaea were also marginally
 detected with a relative abundance of 0.001%, and the most represented genus was
 Methanobrevibacter (0.0004%).

 Fig. 4. Phylogenetic profile of Mexico City’s metro surfaces. A. Phylum abundance in all
 samples: Actinobacteria is the most abundant phylum followed by Firmicutes and Proteobacteria.
 B. Genus abundance: Propionibacterium was the most abundant genus. C. Heatmap of the 30
 most abundant genera and their abundance in each sampled metro line. The unknown genera
 were classified to the upper known taxonomic rank, shown in different text color.

 The metro environment seems to be quite constant; however, there are subtle differences at the
 OTU level that suggest the possibility of biomarkers to discriminate between the environments.
 The higher diversity and OTU richness of station turnstiles, compared to wagon handrails,
 seemed to split our study into two distinct groups when we performed -diversity analysis.
 Constrained analysis of principal coordinates (CAP) ordinations based on unweighted (Fig. 5)
 and weighted (Fig S4) UniFrac distances at the OTU level clearly segregated trains from stations
 (unweighted and weighted, p ≤ 0.001, PERMANOVA). Sample dispersion remained similar
 between groups (unweighted, p = 0.182, weighted, p = 0.242, BETADISPER). Similar results
 were observed at the genus level using Bray Curtis dissimilarities. Although, a total of only 7.5%
 variance was explained in both CAP axes (Fig. 5a). The CAP-tested variables showed that
 exposure to open environments and the turnstile samples were associated with CAP1 dispersion,
 while humidity and temperature were the best options for explaining CAP2 dispersion (Fig. 5a).
 Seven train communities were clustered closer to stations when we analyzed the same data as a
 clustering dendrogram, plotting the unweighted Unifrac distances, and two clades were exclusive
 to handrails (Fig. 5b).
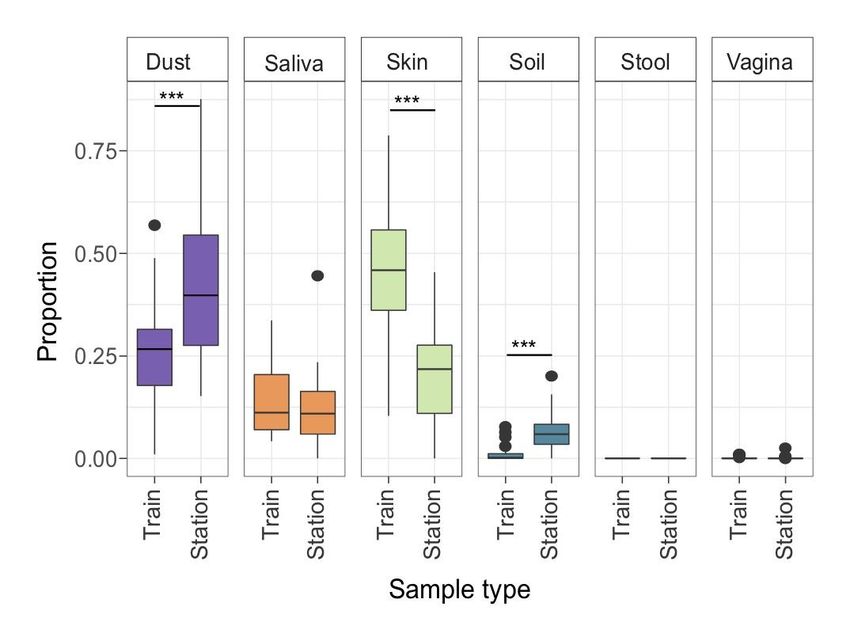
bioRxiv preprint first posted online Aug. 14, 2019; doi: http://dx.doi.org/10.1101/735027. The copyright holder for this preprint
 (which was not peer-reviewed) is the author/funder, who has granted bioRxiv a license to display the preprint in perpetuity.
 It is made available under a CC-BY-ND 4.0 International license.

 Fig 5. Metro bacterial communities grouped into the sample types collected in this study:
 for train and station. A. Constrained analysis of principal coordinates (CAP) ordinations based
 on unweighted UniFrac distances for turnstiles and handrails at the OTU level, significantly
 segregated (p = 0.001, Adonis) ellipses denote the 95% confidence interval of the points
 distribution by sample type. B. Community distances dendrogram using unweighted UniFrac
 distances.

 In the taxa discriminant analysis, turnstiles were inhabited by multiple taxa, mostly from
 Actinobacteria phylum. The most enriched turnstile OTU was classified at the family level as
 Micrococcaceae (OTU 411738), and the most common significantly enriched genus was Kocuria,
 followed by Blastococcus and Arthrobacter, along with 34 other known genera. The handrail
 microbiomes were inhabited by the multi-environment distributed Rothia, Streptomyces, and
 Veillonella and the human bacteria Propionibacterium and Gardnerella (G. vaginalis) (Fig S5).

 We performed a source-tracking analysis to determine the possible environmental sources of the
 metro microbial communities. The tracked microbial environments were dust, skin, saliva, vaginal,
 stool, and soil. The primary environmental source of our data was determined to be dust (mean
 of 34% of the contribution), skin (32%), saliva (13%), soil (4%), and only 14 samples from the
 vagina (0.1%). No stool profiles were detected. Train handrails showed a higher level of skin
 microbiota than turnstiles (p = 1e-06, Student's t-test), while station turnstiles had a higher level
 of dust and soil than handrails (p = 5e-4 and p = 3e-05, respectively, Student's t-test). Saliva and
 vaginal contributions were not distributed differentially on handrails than turnstiles. We did not
 detect significant differences in environmental sources between samples exposed to the external
 environment or completely subterraneous. In multiple samples, the primary environmental source
 remains unknown (Fig. 6y and Fig S6).
bioRxiv preprint first posted online Aug. 14, 2019; doi: http://dx.doi.org/10.1101/735027. The copyright holder for this preprint
 (which was not peer-reviewed) is the author/funder, who has granted bioRxiv a license to display the preprint in perpetuity.
 It is made available under a CC-BY-ND 4.0 International license.

 Fig. 6. Source tracking comparison between turnstile and handrail microbiota. A source
 tracker algorithm was used to identify microbes to the genus level, using dust, soil, saliva, skin,
 feces, and vaginal samples as potential sources (***p < 0.001, Student's t-test).

 Discussion
 The microbiome diversity richness of the Mexico City metro was 50,174 OTUs (16S rRNA gene
 V3-V4), which is comparable to reports from other cities. For example, in a study of the Hong
 Kong subway system, using quite similar methodological procedures (16S rRNA gene V4), there
 were reported to be a total of 55,703 OTUs6. However, Shannon's diversity index (H') is two
 magnitude orders larger in Mexico City's metro (H'(average) = 6.38 ± 0.661) than the Hong Kong
 subway (H'(average) = 4.13 ± 0.30715) or the Barcelona subway airborne bacteria (H' ~ 1.58).
 Additionally, the Simpson index of diversity (1-D(average) = 0.98 ± 0.004) is also higher than the
 Boston surface microbial diversity (1-D ~ 0.75, as estimated from a previous study4). The Shannon
 diversity is higher than some human microbiome systems16. Overall bacterial diversity found in
 Mexico City’s metro is similar to subways in other countries, being overrepresented by human
 skin and oral taxa3,5-8. However, each city metro has its dominant taxa. Pseudomonas stutzeri,
 Stenotrophomonas maltophila, Enterobacter cloacae, and Acinetobacter are the most abundant
 species in New York City. Methylobacterium is the dominant genus in Barcelona subway. Boston
 and Hong Kong subways have similar bacterial composition to Mexico City's metro with a
bioRxiv preprint first posted online Aug. 14, 2019; doi: http://dx.doi.org/10.1101/735027. The copyright holder for this preprint
 (which was not peer-reviewed) is the author/funder, who has granted bioRxiv a license to display the preprint in perpetuity.
 It is made available under a CC-BY-ND 4.0 International license.

 dominance of Propionibacterium, Corynebacterium, Streptococcus, and Staphylococcus4,6,15.
 Neither Pseudomonas nor Methylobacterium, prevalent in NYC and Barcelona subways, are
 among the most abundant genera found in this study (Fig. 4). The metagenomic study of subways
 and urban biomes (MetaSUB) is a consortium working to develop sample collection, DNA/RNA
 isolation, and sequencing standard operating procedures to study global microbial diversity in
 mass transport systems17. This work began before the MetaSUB consortium, but the sampling,
 DNA isolation, PCR programs, sequencing technologies, and data processing are in line with the
 MetaSUB requirements.

 In Mexico’s subway microbiome, the four most abundant genera were Propionibacterium spp.
 (15%) (P. acnes 13%), Corynebacterium spp. (13%), Streptococcus spp. (9%), and
 Staphylococcus spp. (5%) (S. epidermidis, 4%). We detected a large proportion of dust bacteria
 (compared against taxa profiles of mattress dust, which was mostly human skin debris). P. acnes
 on handrails reached a similar relative abundance to that reported for passengers’ hands after a
 subway trip (~29%15). Despite the similarities with Boston and Hong Kong bacterial diversity, our
 study has a larger OTU diversity. It is possible that Mexico City metro’s high OTU diversity and
 heterogeneity is related to the millions of users, while the homogeneous distribution at the genus
 level is the outcome of host-microbe interactions and their mutual selection10,14.

 Multiple factors affect the subway microbiome composition, such as the number of users,
 microenvironmental and climatic conditions, architecture, and even rush hours, and some studies
 have identified antibiotic resistance genes as morning or afternoon signatures15. In this work, no
 architectonic designs (subterranean, street level, or elevated trains, or rubber or ferrous wheels)
 affected microbial diversity or composition. The high frequency of surface interaction by users
 probably promotes the rapid exchange of microbes, preventing them from establishing and
 growing. Environmental variables (temperature and humidity) appear to be similar among
 sampled sites; additionally, the type of environment outside the train station (work-related or bus
 station environment) did not modify the microbial diversity, suggesting the samples were
 independent of the station context.

 The higher diversity we found on the turnstiles compared to handrails may be explained in a
 number of ways. The station turnstiles are exposed to the outside, which may explain the greater
 diversity and also why soil bacteria are more highly represented in these samples. Another
 relevant dissimilarity is the number of people who touch the bars: we observed that the rate of
 direct contact with one of the turnstiles bars is significantly higher (median, 122 people/hour, N =
 8) than with one of the train vertical bars (median 22.9 people/hour, p = 0.001, Kruskal Wallis, N
 = 9, Fig. S7). Differences in usage may also explain the microbial diversity and composition4.
 While handrails are touched almost exclusively with the hands, turnstiles are also touched by
 clothes, which favors the arrival of dust-associated taxa. Additionally, the material differs between
 the surfaces, i.e., turnstiles are aluminum, while handrails are made of stainless steel.

 The Actinobacteria phylum is highly represented in Mexico City’s metro, and we were able to
 identify 160 known genera and 3,959 undescribed genus-level OTUs. The leading players were
 found to be Propionibacterium and Corynebacterium. Interestingly Propionibacterium has been
 described in multiple environments, including soil, freshwater, marine, and host-associated, and
bioRxiv preprint first posted online Aug. 14, 2019; doi: http://dx.doi.org/10.1101/735027. The copyright holder for this preprint
 (which was not peer-reviewed) is the author/funder, who has granted bioRxiv a license to display the preprint in perpetuity.
 It is made available under a CC-BY-ND 4.0 International license.

 while Corynebacterium has been described in these same environments, it has been more
 frequently found in marine environments18. Propionibacterium is divided into cutaneous and
 environmental strains, and some consider the cutaneous strain to be a primary human pathogen;
 it also has multiple biotechnological uses as a source of valuable metabolites like vitamin B12,
 trehalose, propionic acid, and bacteriocins, and some even propose its use as a probiotic19. We
 found a total of 2,341 OTUs classified as Propionibacterium, with 1,358 OTUs best matching P.
 acnes and P. granulosum (105 OTUs), as well as 878 unknown Propionibacterium species. The
 large number of Propionibacterium OTUs is probably reflecting an ongoing evolutionary process
 between bacteria and humans. Further work is needed to understand the human microbe
 partnership in healthy skin.

 Corynebacterium had more OTUs (4,238), albeit in lower abundances than Propionibacterium. It
 was possible to identify two potential pathogens to the species level: C. mastitidis (15 OTUs) and
 C. pilosum (1 OTU), which cause subclinical mastitis and cystitis, respectively (Oliveira et al.
 2017). We also found multiple Corynebacterium species: C. simulans (3 OTUs), C. lubricantis (5
 OTUs), C. stationis (25 OTUs), C. durum (53 OTUs), and C. variabile (70 OTUs). Although there
 are no reports of pathogenesis-related to those species, C. variable has been found in ripened
 cheeses20. However, most OTUs (4,066) were only classified to the genus level. The vast
 abundance of Propionibacterium and Corynebacterium is due to the prolific host
 microenvironments of the sebaceous glands, with their secreted fatty acids and a low pH (~5) and
 O2 concentration21. The biotechnological potential for further study in the Mexico City’s metro
 Actinobacteria is astounding: with 160 known genera detected, follow up projects could use this
 diversity to mine for new antibiotics and natural products, explore the potential for biomass
 decomposition from dust (which is mainly human skin debris in the subway), explore their possible
 role in bioenergy production, and further investigate Actinobacteria species, which are known to
 be active members of microcommunities and act as symbionts to eukaryotes18. It is also
 interesting that, together, Actinobacteria and Firmicutes comprise almost ~75% of the total
 described diversity (Fig. 4). Firmicutes is represented by 154 known genera, with a higher
 abundance of Streptococcus, Staphylococcus, Leuconostoc, Lactobacillus, Veillonella,
 Anaerococcus, and Bacillus.

 The fifth most abundant biological group in Mexico city’s subway was classified into “chloroplast
 sequences”, which are 1,129 OTUs identified only as Streptophyta (land plants). We were also
 able to identify unicellular algae (Stramenopiles and Chlorophyta). A second search matching
 those OTUs to RDP matcher allowed a detailed classification of the plants in the metro system
 using the mitochondrial ribosomal genes (Suppl. Table S4), allowing us to identify plants rooted
 in the Mexican cultural identity, like maize and its wild relative teosintes (Zea), common bean
 (Phaseolus vulgaris), some edible plants like cucumber (Cucumis sativus), papaya (Carica
 papaya), lettuce (Lactuca sativa), sunflower (Helianthus annuus), and pea (Pisum sativum); in
 addition, recreative plants like coffee (Coffea arabica) and tobacco (Nicotiana tabacum) were
 found in our dataset. Other species included the most notorious introduced plant of Mexico City’s
 roadsides, Eucalyptus globulus, firs (Abies), abele (Populus alba), pine (Pinus), red cedar
 (Juniperus virginiana), ornamental plants like cycads (Cycas taitungensis), and all common plants
 growing in the city or its surroundings. Some of these plant genera have local centers of diversity
 or are being regularly consumed by Mexico's population. It was unexpected to find a plant signal
bioRxiv preprint first posted online Aug. 14, 2019; doi: http://dx.doi.org/10.1101/735027. The copyright holder for this preprint
 (which was not peer-reviewed) is the author/funder, who has granted bioRxiv a license to display the preprint in perpetuity.
 It is made available under a CC-BY-ND 4.0 International license.

 in our study, but we used vigorous DNA extraction and physical bead-beating (MoBio’s PowerSoil)
 to extract DNA from the surfaces and the deposited bioaerosols. The plant debris, pollen, and
 plant-derived products we discovered in this study give us a glimpse of the biodiversity of Mexico
 City. Studying macro species with metagenomic environmental DNA has allowed to track rare
 species of vertebrates22, invading plant species23, and lotic communities24. Further work on
 metagenomic DNA degradation in the subway will be useful to determine the spatiotemporal
 dynamics of microbe transmission and DNA resilience of other taxa, such as the plants species
 we detected in the metro.

 In this paper, we do not intend to identify pathogenic bacteria, because we believe the sequencing
 of amplicons of the 16S rRNA gene is insufficient for this purpose. In multiple microbiome studies,
 it is common to define pathogenic groups, and there is even a dysbiosis index that is Bray-Curtis
 dissimilarity applied to microbiomes25. There is a tendency for studies to attempt to distinguish
 between good and bad or normal and abnormal microbial diversity, and the microbiome is termed
 “dysbiotic” when it is divergent from supposedly “normal” conditions26. When multiple microbiome
 papers refer to pathogenic bacteria, this is based in reductionistic assumptions that a given
 bacteria name is unequivocally causing a disease. However, determining pathogenesis is not a
 linear process. There are reports of typically “non-pathogenic” microbes leading to emerging
 opportunistic diseases, and of microbes that can be either commensal, innocuous, or pathogenic,
 e.g., Escherichia coli or Candida albicans. Categorizing host-microbe interactions into vague
 definitions like “pathogen” is a shortcoming of current microbiome research27. So, we are cautious
 to define pathogens and invite our readers to be aware of the limitations of microbiome studies
 involving disease agent identification.

 Mexico City's species pool has the metro as its playground. The species pool is defined as the
 microbes residing independently of their hosts, capable of colonizing and interacting with other
 inhabitants and hosts28. Species pools can be a part of any given community, and their success
 is measured by the similarity of species within a community, their frequency, dispersal abilities,
 and dormancy capabilities29. It has been stated that developed countries are reducing their
 microbiota diversity, compared to non-urban or Occidental lifestyles30. There is evidence that the
 microbiota diversity is convergent and reduced in migrant populations31, and changes in the
 microbiome may be used to track historical migrations32. The species pool is involved in the
 dispersal of microbes between their hosts and the environment, and it is shaped by the host and
 environmental feedback (i.e., immune system responses, host population density, continuous
 dispersal) that can actively shape the microbial community28. We propose that the large OTU
 number reported in this study (50,174) reflects both the species pool, host diversity, and the
 diversity (regional). However, it shows a homogeneous distribution at the genus level, reflecting
 the outcome of selective feedback between microbes, the environment, and hosts.

 Further work could explore the diversity of Mexico City’s microbial pool and its impact on human
 health. The pool could be used to introduce microbiota to humans during the first years of life, to
 train and mature the immune system – a process that has been observed with newborn babies
 who have extensive variation in their skin microbiomes during the first years that subsequently
 stabilizes33.
bioRxiv preprint first posted online Aug. 14, 2019; doi: http://dx.doi.org/10.1101/735027. The copyright holder for this preprint
 (which was not peer-reviewed) is the author/funder, who has granted bioRxiv a license to display the preprint in perpetuity.
 It is made available under a CC-BY-ND 4.0 International license.

 Conclusions
 Mexico City's metro provides a fantastic opportunity to test microbiome theories from multiple
 perspectives, from public health and epidemiology to metacommunity ecology and environment-
 host interactions that structure the collective microbiome. We did not observe significant
 differences in the microbiomes regarding people influx, environmental variables, nor architectural
 design. Actinobacteria dominated the metro surface diversity, and out of the 1,058 bacterial
 genera found in this study, 420 genera were ubiquitous in all lines and accounted for 99.10% of
 the total abundance, indicating a homogeneous system at the genus level and higher diversity at
 OTU level. The most abundant bacterial genus found in Mexico City's metro surfaces were
 derived from normal human skin microbiota, with a dominance of Actinobacteria phylum (i.e.,
 Propionibacterium, Corynebacterium, Streptococcus, Staphylococcus). The wide diversity of
 Mexico City's metro microbiome is a delicate balance between environmental and host selection,
 and it is a major forum for bacterial species to be shared among the residents of the city. This is
 reflected in the homogeneous genus diversity but the wide heterogeneous diversity at the OTU
 level.

 Materials and Methods
 Sampling
 Station turnstiles from the entrance and vertical handrails inside the train were sampled, each
 swab collected samples from 3 different bars, covering approximately 300 cm2 (100 cm2 from
 each bar). We sampled turnstiles from 24 stations, covering most of the of the subway stations.
 A total of 23 samples were collected from handrails, at chest level, from two trains on the same
 line. Sampling was performed with sterile cotton swabs, moistened with transport media (Tris
 20mM, EDTA 10mM pH 7.5). Sampling permits were granted by the metro “User Support
 Manager” (Gerencia de Atención al Usuario, del Sistema de Transporte Colectivo).

 Metadata
 Temperature and relative humidity were recorded for the sampled site. Information about the train
 building architectural design (underground, elevated, superficial trains or trains in tunnels), train
 wheel type (rubber tyre or steel wheels), and station information, such as climate zone, type of
 station (way, transfer, or terminal station), train environmental exposure level (open or
 subterraneous space) was recorded. Additionally, the environmental context of the exterior of the
 subway stations (work-related, bus stop, or park area) was also collected. People influx statistical
 data were obtained from the subway office reports, "Sistema de Transporte Colectivo: Cifras de
 Operación” (https://www.metro.cdmx.gob.mx/operacion/cifras-de-operacion).

 People behavior observations
 Frequency of contact with handrail and turnstile bars was determined by counting the number of
 users touching a specific bar within 20 minutes (N = 8 for turnstiles, N = 9 for handrails). This
 procedure was performed for six different subway lines and seven different stations, respectively,
 during rush hour. Additionally, the type of contact that people had with turnstile bars was
bioRxiv preprint first posted online Aug. 14, 2019; doi: http://dx.doi.org/10.1101/735027. The copyright holder for this preprint
 (which was not peer-reviewed) is the author/funder, who has granted bioRxiv a license to display the preprint in perpetuity.
 It is made available under a CC-BY-ND 4.0 International license.

 determined by counting the occurrence of two events: when the turnstile bar was pushed directly
 with the hand and pushed without hands (N = 730 people in 5 different stations), in rush hours.

 Amplicon generation and massive sequencing
 Metagenomic DNA was obtained using the MoBio PowerSoil Kit (MoBio Laboratories, Solana
 Beach, CA), with the small modifications suggested by MoBio for low biomass samples. Briefly,
 125 μL of the sample, 30 μL of C1 solution, and 50 μL phenol: chloroform 1:1 were mixed in the
 beat tube. The following steps followed the fabricant instructions. We used PCR primers for the
 V3-V4 region of the 16S rRNA gene, following MiSeq™ Illumina® protocol with 5' overhangs for
 sequencing library preparation (341F and 805R) with an expected amplicon size of 464 bp. Each
 PCR was done in triplicate with a mix reaction of 25 μL including 0.2 μL Phusion DNA
 polymerase™, 5 μL Buffer 5x, 2.5 μL dNTP (3 mM), 1 μL forward primer (5 pmol/μL), 1 μL reverse
 primer at (5 pmol/μL), 2 μL DNA, and 13.3 μL water. The PCR reaction was initiated at 98°C, 30s,
 followed by 35 cycles of 92°C for 10s; 53°C for 30s, 72°C for 40s, and the reaction finished at
 72°C for 5 min. Blank samples were used for negative controls. PCR amplicons were purified
 using the High Pure PCR Product Purification Kit of ROCHE™ (Roche Diagnostics Gmb,
 Mannheim, Germany). Sequencing was performed using MiSeq™ Illumina® (2 x 300 bp) platform
 at the Biotechnology Institute of the Universidad Nacional Autónoma de México (UNAM).

 Sequence processing
 We used a previously reported protocol for 16S rRNA gene amplicons analysis34, which is detailed
 at GitHub (https://genomica-fciencias-unam.github.io/SOP/). Briefly, sequencing pair-ended
 reads were merged, using a minimum of 470 bp, a 15 bp of minimum overlapping, and with a
 quality threshold of 0.95 using PANDASEQ35. Sequence clustering into OTUs was performed at
 97% identity with cd-hit-est36, cd-hit-est is an included OTU picking software in the popular QIIME
 scripts37, which we have previously tested as a reasonable option when picking de novo OTUs34.
 Representative sequences and OTU table were built with QIIME (v 1.9) 37. Taxonomy assignment
 was completed with parallel BLAST38 against the Greengenes database39. Plant-derived
 sequences were re-classified using the ribosomal database project40.

 Diversity metrics and statistical analysis
 Diversity calculation and statistical inferences were performed with the R packages “phyloseq2”
 and “ggplot2” 41,42 or using R default functions43. Beta diversity ordination analyzes were evaluated
 with Canonical Analysis of Principal coordinates (CAP) for weighted and unweighted UniFrac
 distances at the OTU level, exploring the correlation with the following variables: sample_type +
 temperature_C + Humidity + length_underground + train_track + exposed_open_environment.
 PERMANOVA were performed per variable using the ANOVA function with 999 permutations.
 Sample dispersion was also evaluated with betadisper R function. The source tracker algorithm44
 was used at the genus level, using 16S rRNA sequences (V4 region) from mattress dust, soil,
 saliva, skin, and fecal samples45 and vaginal samples46 as reference sources. Discriminant taxa
 analyzes were performed with R’s package “DESeq2” 47.
bioRxiv preprint first posted online Aug. 14, 2019; doi: http://dx.doi.org/10.1101/735027. The copyright holder for this preprint
 (which was not peer-reviewed) is the author/funder, who has granted bioRxiv a license to display the preprint in perpetuity.
 It is made available under a CC-BY-ND 4.0 International license.

 References
 1. UITP, I. A. of P. T. World Metro Figures 2018. (2018). at
 https://www.uitp.org/sites/default/files/cck-focus-papers-files/Statistics Brief - World metro
 figures 2018V4_WEB.pdf
 2. Casado Izquierdo, J. M. Patrones horarios de la movilidad cotidiana en la Zona
 Metropolitana del Valle de México. Scr. Nova. Rev. Electrónica Geogr. y Ciencias Soc. 18,
 e487 (2014).
 3. Walker, A. R., Grimes, T. L., Datta, S. & Datta, S. Unraveling bacterial fingerprints of city
 subways from microbiome 16S gene profiles. Biol. Direct 13, 1–16 (2018).
 4. Hsu, T. et al. Urban Transit System Microbial Communities Differ by Surface Type and
 Interaction with Humans and the. mSystems 1, 1–18 (2016).
 5. Afshinnekoo, E. et al. Geospatial Resolution of Human and Bacterial Diversity with City-
 Scale Metagenomics. Cell Syst. 1, 72–87 (2015).
 6. Leung, M. H. Y., Wilkins, D., Li, E. K. T., Kong, F. K. F. & Lee, P. K. H. Indoor-Air
 Microbiome in an Urban Subway Network: Diversity and Dynamics. Appl. Environ.
 Microbiol. 80, 6760–6770 (2014).
 7. Robertson, C. E. et al. Culture-Independent Analysis of Aerosol Microbiology in a
 Metropolitan Subway System. Appl. Environ. Microbiol. 79, 3485–3493 (2013).
 8. Triadó-Margarit, X. et al. Bioaerosols in the Barcelona subway system. Indoor Air 27, 564–
 575 (2017).
 9. Hernández-Castillo, O. et al. Aerobiological study in the Mexico City subway system.
 Aerobiologia (Bologna). 30, 357–367 (2014).
 10. Meadow, J. F. et al. Humans differ in their personal microbial cloud. PeerJ 3, e1258 (2015).
 11. You, R., Cui, W., Chen, C. & Zhao, B. Measuring the Short-Term Emission Rates of
 Particles in the “Personal Cloud” with Different Clothes and Activity Intensities in a Sealed
 Chamber. Aerosol Air Qual. Res. 13, 911–921 (2013).
 12. Bhangar, S. et al. Chamber bioaerosol study: human emissions of size-resolved fluorescent
 biological aerosol particles. Indoor Air 26, 193–206 (2016).
 13. Guerra, E. The geography of car ownership in Mexico City: a joint model of households’
 residential location and car ownership decisions. J. Transp. Geogr. 43, 171–180 (2015).
 14. Hospodsky, D. et al. Human occupancy as a source of indoor airborne bacteria. PLoS One
 7, e34867 (2012).
 15. Kang, K. et al. The Environmental Exposures and Inner- and Intercity Traffic Flows of the
 Metro System May Contribute to the Skin Microbiome and Resistome. Cell Rep. 24, 1190–
 1202.e5 (2018).
 16. Li, K., Bihan, M., Yooseph, S. & Methé, B. A. Analyses of the Microbial Diversity across the
 Human Microbiome. PLoS One 7, e32118 (2012).
 17. MetaSUB International Consortium. The Metagenomics and Metadesign of the Subways
 and Urban Biomes (MetaSUB) International Consortium inaugural meeting report.
 Microbiome 4, 24 (2016).
 18. Lewin, G. R. et al. Evolution and Ecology of Actinobacteria and Their Bioenergy
 Applications. Annu. Rev. Microbiol. 70, 235–254 (2016).
 19. Piwowarek, K., Lipińska, E., Hać-Szymańczuk, E., Kieliszek, M. & Ścibisz, I.
 Propionibacterium spp.—source of propionic acid, vitamin B12, and other metabolites
 important for the industry. Appl. Microbiol. Biotechnol. 102, 515–538 (2018).
 20. Schröder, J., Maus, I., Trost, E. & Tauch, A. Complete genome sequence of
 Corynebacterium variabile DSM 44702 isolated from the surface of smear-ripened cheeses
 and insights into cheese ripening and flavor generation. BMC Genomics 12, 545 (2011).
 21. Grice, E. A. & Segre, J. A. The skin microbiome. Nat. Rev. Microbiol. 9, 244–253 (2011).
 22. Franklin, T. W. et al. Using environmental DNA methods to improve winter surveys for rare
bioRxiv preprint first posted online Aug. 14, 2019; doi: http://dx.doi.org/10.1101/735027. The copyright holder for this preprint
 (which was not peer-reviewed) is the author/funder, who has granted bioRxiv a license to display the preprint in perpetuity.
 It is made available under a CC-BY-ND 4.0 International license.

 carnivores: DNA from snow and improved noninvasive techniques. Biol. Conserv. 229, 50–
 58 (2019).
 23. Gantz, C. A., Renshaw, M. A., Erickson, D., Lodge, D. M. & Egan, S. P. Environmental
 DNA detection of aquatic invasive plants in lab mesocosm and natural field conditions. Biol.
 Invasions 20, 2535–2552 (2018).
 24. Seymour, M. et al. Acidity promotes degradation of multi-species environmental DNA in
 lotic mesocosms. Commun. Biol. 1, 4 (2018).
 25. Lloyd-Price, J. et al. Multi-omics of the gut microbial ecosystem in inflammatory bowel
 diseases. Nature 569, 655–662 (2019).
 26. Hooks, K. B. & O’Malley, M. A. Dysbiosis and Its Discontents. MBio 8, 1–11 (2017).
 27. Casadevall, A. & Pirofski, L. Microbiology: Ditch the term pathogen. Nature 516, 165–166
 (2014).
 28. Miller, E. T., Svanbäck, R. & Bohannan, B. J. M. Microbiomes as Metacommunities:
 Understanding Host-Associated Microbes through Metacommunity Ecology. Trends Ecol.
 Evol. 33, 926–935 (2018).
 29. Zobel, M., van der Maarel, E. & Dupré, C. Species pool: the concept, its determination and
 significance for community restoration. Appl. Veg. Sci. 1, 55–66 (1998).
 30. Shen, N. et al. The microbiome of uncontacted Amerindians. Sci. Adv. 1, e1500183 (2015).
 31. Vangay, P. et al. US Immigration Westernizes the Human Gut Microbiome. Cell 175, 962–
 972.e10 (2018).
 32. Dominguez-Bello, M. G. & Blaser, M. J. The Human Microbiota as a Marker for Migrations
 of Individuals and Populations. Ssrn (2011). doi:10.1146/annurev-anthro-081309-145711
 33. Palmer, C., Bik, E. M., DiGiulio, D. B., Relman, D. A. & Brown, P. O. Development of the
 human infant intestinal microbiota. PLoS Biol. 5, 1556–1573 (2007).
 34. Alcaraz, L. D. et al. Marchantia liverworts as a proxy to plants’ basal microbiomes. Sci. Rep.
 8, 7–8 (2018).
 35. Masella, A. P., Bartram, A. K., Truszkowski, J. M., Brown, D. G. & Neufeld, J. D.
 PANDAseq: paired-end assembler for illumina sequences. BMC Bioinformatics 13, 31
 (2012).
 36. Huang, Y., Niu, B., Gao, Y., Fu, L. & Li, W. CD-HIT Suite: a web server for clustering and
 comparing biological sequences. Bioinformatics 26, 680–2 (2010).
 37. Caporaso, J. G. et al. QIIME allows analysis of high-throughput community sequencing
 data. Nat. Methods 7, 335–6 (2010).
 38. Camacho, C. et al. BLAST+: Architecture and applications. BMC Bioinformatics 10, 421
 (2009).
 39. DeSantis, T. Z. et al. Greengenes, a chimera-checked 16S rRNA gene database and
 workbench compatible with ARB. Appl. Environ. Microbiol. 72, 5069–72 (2006).
 40. Cole, J. R. et al. Ribosomal Database Project: Data and tools for high throughput rRNA
 analysis. Nucleic Acids Res. 42, D633–D642 (2014).
 41. McMurdie, P. J. & Holmes, S. phyloseq: an R package for reproducible interactive analysis
 and graphics of microbiome census data. PLoS One 8, e61217 (2013).
 42. Wickham, H. Ggplot2 Elegant Graphics for Data Analysis. Applied Spatial Data Analysis
 with R (2009). doi:10.1007/978-0-387-98141-3
 43. R Core Team. R: A language and environment for statistical computing. (2014). at

 44. Knights, D. et al. Bayesian community-wide culture-independent microbial source tracking.
 Nat. Methods (2011). doi:10.1038/nmeth.1650
 45. Marotz, C. et al. DNA extraction for streamlined metagenomics of diverse environmental
 samples. Biotechniques 62, 290–293 (2017).
 46. Dominguez-Bello, M. G. et al. Partial restoration of the microbiota of cesarean-born infants
 via vaginal microbial transfer. Nat. Med. 22, 250–3 (2016).
bioRxiv preprint first posted online Aug. 14, 2019; doi: http://dx.doi.org/10.1101/735027. The copyright holder for this preprint
 (which was not peer-reviewed) is the author/funder, who has granted bioRxiv a license to display the preprint in perpetuity.
 It is made available under a CC-BY-ND 4.0 International license.

 47. Love, M. I., Huber, W. & Anders, S. Moderated estimation of fold change and dispersion for
 RNA-seq data with DESeq2. Genome Biol. 15, 550 (2014).

 Acknowledgments
 This work was supported by the Secretary of Science, Technology, and Innovation of Mexico City
 SECITI 102/2017, Autonomous Metropolitan University, and National Council of Science and
 Technology Graduate fellowship (AMH).
You can also read