Ville de Québec Québec Amphitheatre - Naming Rights Assessment
←
→
Page content transcription
If your browser does not render page correctly, please read the page content below
Ville de Québec
       Québec Amphitheatre - Naming
       Rights Assessment

November 25, 2010

  Ville de Québec – Québec Amphitheatre Naming Rights Assessment   © Deloitte & Touche LLP and affiliated entities
Contents Background 2 Naming rights 3 Naming rights landscape in Canada 9 Building sponsorships 15 Comparative market assessment 17 Summary and conclusions 23 Appendix 28 1 Ville de Québec – Québec Amphitheatre Naming Rights Assessment © Deloitte & Touche LLP and affiliated entities
Background
•       The Ville de Québec (the “City”) has completed significant background research and business case planning relating to a
        proposed 18,000-seat arena / amphitheatre (the “Amphitheatre”). This Amphitheatre is to serve as the home venue for a
        new or relocated National Hockey League (“NHL”) franchise as well as serve as a key venue for a future Winter Olympics
        Games bid.
•       As part of the background analysis completed to date, the Quebec Government commissioned Ernst & Young to prepare a
        business case profiling the opportunity which such a venue presents within the broader Quebec City region and how this
        region could derive lasting social and economic benefit. In addition, we understand that the City has completed an
        assessment of the Amphitheatre’s naming rights potential.
•       While having completed such a review, the City retained Samson Bélair / Deloitte & Touche to prepare an independent
        assessment of the naming rights and sponsorship potential of the Amphitheatre.
•       In completing this assessment, Deloitte completed the following:
           •   Reviewed the July 2010 report prepared by Ernst & Young;
           •   Reviewed the stadium sponsorship and naming rights landscape in Canada and reviewed sponsorship trends in the
               broader North American market;
           •   Identified the range of sponsorship opportunities that may exist within the new Amphitheatre (including, for example,
               concourses, lounges, etc.);
           •   Completed a comparative review of the Quebec City marketplace against other Canadian NHL cities with respect to
               businesses, incomes, growth prospects, etc.;
           •   Identified, at a high level, the range of local / broader regional and other corporations who could potentially become
               sponsors within the venue (including the venue’s naming sponsor);
           •   Based on the foregoing, identified the approximate range of building and naming sponsorships; and
           •   Prepared this Summary Report, in PowerPoint format, summarizing our review and providing our opinion on the
               naming rights and other sponsorship potential of the new Amphitheatre.

    2   Ville de Québec – Québec Amphitheatre Naming Rights Assessment                                   © Deloitte & Touche LLP and affiliated entities
Naming rights
Background
• Most sports venues in Canada, including most venues housing professional teams, semi-professional and minor league
teams have sold naming rights.
• According to industry publications and information provided to Deloitte, the annual value of these sponsorships are highest
among buildings which house NHL teams. Buildings which primarily house AHL or other lower-level professional hockey
teams generally rank second in terms of annual sponsorship value.
• Open air stadiums, whether for football, soccer or baseball, generally rank below AHL facilities, but significantly above
arenas housing Canadian Hockey League teams (i.e., teams playing in the WHL, OHL or QMJHL).
Determinants of value
• According to industry publications and other literature, the amount a venue can secure from building sponsorships will be
dependent upon a number of factors, including but not limited to:
• the size and nature of the market the venue is located within;
• the building’s physical location within that market;
• the venue’s visibility (i.e., its external “signage value”);
• the number and range of events and spectators it attracts;
• national / international TV exposure;
• on-site and in-arena exposure to attendees (i.e., its internal “signage value”);
• the success and longevity of the team;
• media coverage (ad campaigns, local TV / radio), editorial coverage (print and online); and
• the venue’s positioning and image, including from a social media perspective.
• Additional factors which serve to impact sponsorship viability and pricing include:
• the presence of a professional sports franchise;
• the type of events that take place in the building;
• the nature of corporate entities in the city / region where the venue is located;
• the nature of the sponsorship package purchased by the entity; and
• the “newness” of the venue.
3 Ville de Québec – Québec Amphitheatre Naming Rights Assessment © Deloitte & Touche LLP and affiliated entitiesNaming rights
Why corporations purchase naming rights
• While a common reason explaining why an entity would sponsor a facility is for pure “advertising” purposes, the reality is a
variety of corporations, representing a myriad of industries will sponsor a facility for multitude of reasons.
• Increasingly, corporations are looking at the strategic value of being associated with a building / team, and how that
relationship can help further the overall corporate direction of the company, particularly with respect to growing its
business.
• By way of example, in early 2010 Sun Life Financial Inc., Canada's third-largest insurer, entered into a five-year, $20.0
million agreement to purchase the naming rights of the stadium used by the National Football League's Miami Dolphins
and Major League Baseball’s Florida Marlins (formerly known as Joe Robbie Stadium, Pro Player Park, Pro Player
Stadium, Dolphins Stadium, and most recently, Land Shark Stadium). In addition, the stadium is used by the University of
Miami and is the home of U.S. College Football’s Orange Bowl.
As we understand it, Sun Life agreed to this sponsorship in order to heighten its presence in the U.S., determining that
naming a prominent sports facility will help build brand awareness and enhance its business (where it already generates
one-third of its business). The physical naming of this facility happened immediately and allowed the stadium to be called
“Sun Life Stadium” in time for the NFL Pro Bowl (held on January 31, 2010) and Super Bowl XLIV (held on February 7,
2010).
From an advertising perspective, the name “Sun Life Stadium” was mentioned on multiple occasions during both the Pro
Bowl and Super Bowl telecasts, and was mentioned in numerous newspaper and sports journal articles and on sport
highlight shows across North America. In comparison, the cost of one 30-second ad during the Super Bowl ranged
between $2.5 million and $3.0 million, whereas for $4.0 million (per year) Sun Life’s name and logo were seen or
mentioned countless times throughout two separate telecasts; in addition, Sun Life’s name and logo will be seen and
heard during an additional 100 events (minimum) annually (covering the Major League Baseball, NFL and U.S. college
football seasons).
Sun Life joins other Canadian financial-services companies that have purchased the naming rights to U.S. sports venues,
including the Royal Bank of Canada (naming rights for the Raleigh, North Carolina, RBC Center, home arena of the NHL’s
Carolina Hurricanes) and Toronto-Dominion Bank (Boston’s TD Garden, home arena of the NHL’s Boston Bruins and the
Boston Celtics of that National Basketball League). As we understand it, the business rationale for each entity’s
sponsorship was similar to that reported for Sun Life (i.e., to enhance name and brand recognition in the United States).
4 Ville de Québec – Québec Amphitheatre Naming Rights Assessment © Deloitte & Touche LLP and affiliated entitiesNaming rights
Why corporations purchase naming rights
The Sun Life example is similar to a recent naming rights transaction where Toronto- based telecommunications company
Rogers Communications entered into a multi-year, multi-million dollar naming rights deal to rename the NHL’s Vancouver
Canuck’s home arena “Rogers Arena” (formerly GM Place). While originally agreeing to a 20-year title sponsorship,
General Motors opted out of its agreement after 15 years; the title sponsorship arrangement now provides Rogers with a
significant presence in the Vancouver / British Columbia / Western Canada marketplace, a market which has traditionally
been dominated by Telus. According to press reports, the deal also provides Rogers with category exclusivity in both the
arena and with the Canucks; previously Telus held the telecommunications sponsorship rights with both the team and
building.
• In more limited cases, naming rights can also (in conjunction with a more traditional advertising rationale) be a function of
an entity’s philanthropic / sense of belonging / linkage with the local community. Examples include Mosaic Stadium at
Taylor Field (Regina, Saskatchewan), MTS Centre (Winnipeg), John Labatt Centre (London), Saputo Stadium (Montreal),
Tim Hortons Event Centre (Cochrane, Ontario), and the Strathcona Paper Centre (Napanee, Ontario). The value
associated with these latter two examples were almost exclusively a function of the sponsor’s linkage to the community
and its desire to financially contribute to the realization of the sports facility.
• Factors including the type and number of events that occur within a venue, the number of spectators the venue attracts,
the marketing value / exposure of the venue and the teams that play therein on a local, regional and national scale, and
the size and nature of the local market will most greatly influence the value an entity would be willing to commit.
Depending on the entity, the relative importance of each factor, amongst others, will differ. For example:
• Entities with a more regional focus would likely pay more for a location with high visibility to passing traffic, than they
would to a lesser profile location (i.e., their sponsorship will be highly dependent upon the local advertising
component / “number of eyes” that will see the company logo on the building).
• Similarly, entities with a strong local / regional presence may pay an equivalent or greater amount for a “lesser profile
location” in order to seen as achieving broader community development objectives.
• Finally, a sponsor may be willing to commit to a broader sponsorship, involving multiple properties, in order to secure
cross-promotion opportunities (examples of which include the Bank of Montreal’s sponsorship of Toronto FC and its
stadium, along with the Air Canada Centre, Toronto Maple Leafs and Toronto Raptors, and Bell Canada Enterprises’
sponsorship of the Ottawa Senators, ScotiaBank Place and the “Sensplex” community sports facility).
5 Ville de Québec – Québec Amphitheatre Naming Rights Assessment © Deloitte & Touche LLP and affiliated entitiesNaming rights
Why corporations purchase naming rights
• In some cases, the “newness” of a venue can affect its naming rights value, as teams and venues generally realize a
“honeymoon” period when the venue is first opened, generating higher than average attendance and attracting an
increased number of events compared to their previous venue / home. In such instances, prospective sponsors may be
willing commit higher amounts to sponsor the facility.
Deal terms / structure
• Naming rights agreements are generally comprised of a number of contractual provisions including ownership rights,
amount, payment timing and escalation, term and renewal options, exclusive rights and non-compete covenants, first
options and rights of first refusal, intellectual property related clauses, etc.
• Payment Terms. In most instances, payment terms consist of an initial up-front payment, followed by a series of annual
payments. Such payments can and have been structured in a number of ways. For example,
• The full amount of the sponsorship could be paid upfront (and used by the stadium owner to support a portion of the
building’s capital cost). Examples including BMO Field (Toronto), Saputo Stadium (Montreal) and numerous other
smaller facilities (Cochrane, Sault Ste. Marie, etc.);
• The full amount of the sponsorship could be paid in equal annual installments over the term of the agreement.
Examples include the majority of professional sports NHL venues in North America, including most NHL venues in
Canada; or
• Payment could also be structured as increasing annual amounts over the term of the agreement. Examples include
Ricoh Coliseum (Toronto), whose first three annual payments were fixed, while payment in subsequent three year
periods were subject to a predefined inflation rate increase. Two U.S. NHL arena deals we are aware of call for
annual “bumps” in value equal to 5.00%, while a U.S. NFL stadium deal calls for predefined fixed rates with bumps
every year.
• Deal Length. In terms of deal length, when naming rights deals were first negotiated, arrangements were generally for a
term covering 10 to 30 years. More recently, naming rights transactions have tended to become shorter in length, typically
covering a 10-year team or less (deals as short as five years, similar to the above discussed Sun Life deal, have also
occurred).
6 Ville de Québec – Québec Amphitheatre Naming Rights Assessment © Deloitte & Touche LLP and affiliated entitiesNaming rights
Deal terms / structure
• Signage Costs. In a number of cases, the cost associated with making and installing / affixing signage with the corporate
logo of the building sponsor is the responsibility of the stadium (and paid for out of initial / Year 1 sponsorship advance(s)).
In other cases, such costs comprise an additional payment / obligation of the building sponsor (as was the case in one
NHL venue, and as occurred in two Ontario Hockey League facilities). In other cases, there are shared costs.
• Inclusions. In most instances, the building sponsor is provided with a number of amenities / extras, the value of which is
factored into the overall valuation of the deal. In addition to corporate signage on the exterior and interior of the building
(including, for example, on the ice surface), the naming rights holder is also provided with a corporate suite and the free
use of the facility (generally for a fixed number of times) for corporate events. Depending on the sponsor’s industry, they
may also be provided with category exclusivity / product rights (for example, if naming rights are sold to a beverage or food
company, the would also be provided with “pouring” / “food” rights within that building).
Additional inclusions could include the following:
• tickets to all stadium events • corporate logo on all event tickets
• corporate logo on all facility communications • corporate logo on stadium concession cups, serviettes, etc.
• reserved parking spaces • exclusive use of sponsor products
• corporate logo of stadium employee uniforms • in-stadium product display areas
• category exclusivity • contact and photo opportunities with visiting teams /
celebrities
• In-Kind Services. In a limited number of cases, the building sponsor may also agree to provide various in-kind services to
the facility. As we understand it, K-Rock FM, a local Kingston radio station, agreed to a $1.9 million, 10-year building
sponsorship deal that included approximately $200,000 of in-kind services for advertising and event promotion. Similarly,
Sleeman Breweries’ building sponsorship agreement in Guelph includes an additional amount for event marketing and
advertising.
• Additional Teams. In some cases, a building will reserve the right to increase the annual naming rights fee should an
additional tenant take up residence in the facility. In one example, the additional amount was predefined in the agreement
at a fixed amount, while in another, we understand that the value was dependent upon the number of games the new team
would play in the venue and the team’s expected average attendance in relation to the main lead tenant.
7 Ville de Québec – Québec Amphitheatre Naming Rights Assessment © Deloitte & Touche LLP and affiliated entitiesNaming rights
Summary
• While the reasons an entity would agree to sponsor a stadium are many and diverse (and the relative importance of those
reason similarly vary among corporations), we conclude that the factors that most greatly influence value are:
• the type and number of events that occur within a venue;
• the newness of the venue and the popularity of the main sports team tenant;
• the number of spectators the venue attracts;
• the marketing value / exposure of the venue (and the teams that play therein) on a local, regional and national scale;
and
• the size and nature of the local market.
• Naming rights deal terms and payment structures vary considerably, but appear to be most dependent upon the scope and
range of the sponsorship and the nature of “inclusions” brought into the deal.
8 Ville de Québec – Québec Amphitheatre Naming Rights Assessment © Deloitte & Touche LLP and affiliated entitiesNaming rights landscape in Canada
Overview
• The vast majority of stadiums and arenas housing professional sports teams in Canada have secured naming
sponsorships. In addition to these “professional” sports facilities, a number of stadiums and arenas housing semi-
professional, minor league and amateur teams and leagues have also sold naming rights.
National Hockey League buildings
• 28 of the 30 arenas housing NHL teams, including all six buildings in Canada, have secured multi-year naming
sponsorships (only Madison Square Garden in New York City, home of the New York Rangers, and Nassau Veterans
Memorial Coliseum, home of the New York Islanders) have not sold naming rights.
• Annual sponsorship values vary directly with the size of the market the team / building is located within, the date when the
sponsorship was secured, and with the number of professional sport teams that play within that building. For examples,
• Buildings that have more recently secured naming sponsorships will generate a higher average annual value
compared to venues who secured their naming sponsorship in years past;
• Buildings located in larger markets will generate a higher average annual value compared to venues located in
smaller markets; and
• Venues with multiple sport teams tenants (particularly in different sports) will generate higher average annual values
compared to venues with only one sport team tenant.
• In general, NHL venues located in the United States have generated higher average annual values compared to NHL
venues located in Canada – prior to the recent arena naming deals announced in Vancouver and Calgary, peak annual
values in Canada average approximately 57% of peak values of single-tenant US buildings, and approximately 46% of
peak values of multi-tenant US buildings.
• Canadian NHL buildings which have secured naming sponsors include the following:
• Vancouver: sold the naming rights to their arena to General Motors in 1995. This 20-year, $18.5 million agreement
($925,000 per year) was to have expired in 2015; in 2010, GM elected to opt out of the agreement and in June
2010, the Vancouver Canucks announced that it had given naming rights to Rogers Communications as part of a
multi-year, multi-million dollar agreement (terms of the deal including length and total dollar amount have not been
publicly released). The arrangement also includes Rogers becoming the exclusive telecommunications partner of
the Vancouver Canucks.
9 Ville de Québec – Québec Amphitheatre Naming Rights Assessment © Deloitte & Touche LLP and affiliated entitiesNaming rights landscape in Canada
NHL Venues – Average Annual Naming Sponsorship Value (by date of origination)
$7,000,000
$6,000,000
$5,000,000
∆ = 54%
∆ = 43%
$4,000,000
$3,000,000
$2,000,000
$1,000,000
$0
1992 1993 1994 1995 1996 1997 1998 1999 2000 2001 2002 2003 2004 2005 2006 2007 2008 2009 2010
Canadian NHL Venues US NHL Venues (single team buildings) US NHL Venues (multi-team buildings)
Excludes Rogers Arena and ScotiaBank Saddledome deals
10 Ville de Québec – Québec Amphitheatre Naming Rights Assessment © Deloitte & Touche LLP and affiliated entitiesNaming rights landscape in Canada
NHL Venue Naming Rights (Canadian and single-tenant U.S. venues)
Total Naming
City Sport Team Tenant(s) Naming Sponsor Term Expiry Annual Value Year Signed
Rights
Canada
Vancouver Vancouver Canucks General Motors $18,500,000 20 years 2015 $925,000 1995
Ottawa Ottawa Senators Corel Corporation $26,000,000 20 years 2016 $1,300,000 1996
Toronto Maple Leafs (NHL)
Toronto Air Canada $40,000,000 20 years 2017 $2,000,000 1997
Toronto Raptors (NBA)
Calgary Calgary Flames Pengrowth Enterprises Lrd. $20,000,000 20 years 2020 $1,000,000 2000
Montreal Montreal Canadiens Bell Canada $60,000,000 20 years 2022 $3,000,000 2002
Edmonton Edmonton Oilers Rexall n/a 10 years 2013 n/a 2003
Ottawa Ottawa Senators Bank of Nova Scotia $20,000,000 15 years 2021 $1,333,333 2006
Calgary Calgary Flames Bank of Nova Scotia n/a 10 years 2020 n/a 2010
Vancouver Vancouver Canucks Rogers Communications n/a n/a n/a n/a 2010
U.S. (Single Tenant Building)
Buffalo Buffalo Sabres Marine Midland Bank (HSBC Corp.) $24,000,000 30 years 2023 $800,000 1993
Pittsburgh Pittsburgh Penguins Mellon Financial Corp. $18,000,000 10 years 2009 $1,800,000 1999
Minnesota Minnesota Wild Xcel Energy Co $75,000,000 25 years 2025 $3,000,000 2000
San Jose San Jose Sharks Compaq Computer $72,000,000 18 years 2018 $4,000,000 2000
St. Louis St. Louis Blues Scottrade Inc. $52,500,000 15 years 2020 $3,500,000 2005
Carolina Carolina Hurricanes Royal Bank of Canada $80,000,000 20 years 2022 $4,000,000 2002
Tampa Bay Tampa Bay Lightning St. Petersburg Times $33,000,000 12 years 2014 $2,750,000 2002
Florida Florida Panthers BankAtlantic $27,000,000 10 years 2014 $2,700,000 2004
Phoenix Phoenix Coyotes Jobing.com $25,000,000 10 years 2016 $2,500,000 2006
New Jersey New Jersey Devils Prudential Financial $105,000,000 20 years 2027 $5,250,000 2007
Anaheim Mighty Ducks of Anaheim Honda $60,000,000 15 years 2023 $4,000,000 2008
Pittsburgh Pittsburgh Penguins Consol Energy Inc. $94,500,000 21 years 2030 $4,500,000 2009
Columbus Columbus Blue Jackets Nationwide Insurance n/a n/a n/a n/a n/a
Detroit Detroit Red Wings n/a n/a n/a n/a n/a n/a
Nashville Nashville Predators Bridgestone Tire n/a n/a n/a n/a n/a
New York New York Islanders n/a n/a n/a n/a n/a n/a
11 Ville de Québec – Québec Amphitheatre Naming Rights Assessment © Deloitte & Touche LLP and affiliated entitiesNaming rights landscape in Canada
NHL Venue Naming Rights (multi-tenant U.S. venues)
Total Naming
City Sport Team Tenant(s) Naming Sponsor Term Expiry Annual Value Year Signed
Rights
U.S. (Multiple Tenant Building)
Philadelphia Flyers (NHL)
Philadelphia Wells Fargo $40,000,000 31 years 2023 $2,000,000 1992
Philadelphia 76ers (NBA)
Chicago Blackhawks (NHL)
Chicago United Airlines $25,000,000 20 years 2014 $1,250,000 1994
Chicago Bulls (NBA)
Atlanta Trashers (NHL)
Atlanta Royal Philips Electronics $168,000,000 20 years 2019 $8,400,000 1999
Atlantra Hawks (NBA)
Colorado Avalanche (NHL)
Colorado Pepsi $68,000,000 20 years 2019 $3,400,000 1999
Colorado Nuggets (NBA)
Los Angeles Kings (NHL)
Los Angeles Clippers (NBA)
Los Angeles Staples, Inc. $100,000,000 20 years 2019 $5,000,000 1999
Los Angeles Sparks (WNBA)
Los Angeles Lakers (NBA)
Washington Capitals (NHL)
Washington Washington Wizards (NBA) MCI $44,000,000 13 years 2013 $3,384,615 2000
Washington Mystics (WNBA)
Dallas Stars (NHL)
Dallas American Airlines $195,000,000 30 years 2031 $6,500,000 2001
Dallas Mavericks (NBA)
Boston Bruins
Boston TD Banknorth Inc. $120,000,000 20 years 2025 $6,000,000 2005
Boston Celtics
New York Rangers (NHL)
New York New York Knicks (NBA) n/a n/a n/a n/a n/a n/a
New York Liberty (WNBA)
12 Ville de Québec – Québec Amphitheatre Naming Rights Assessment © Deloitte & Touche LLP and affiliated entitiesNaming rights landscape in Canada
National Hockey League buildings
• Calgary: sold the naming rights to their arena to Pengrowth Enterprises Ltd. in 2000 when the former naming
sponsor, Canadian Airlines was acquired by Air Canada. At the time, the deal was widely reported as a 20-year,
$20.0 million agreement ($1.0 million per year) expiring in 2020. In October 2010, upon expiry of the arrangement
with Pengrowth, the Calgary Flames announced that it had signed a sponsorship agreement with the Bank of Nova
Scotia to rename their venue the ScotiaBank Saddledome. Similar to the new sponsorship agreement in Vancouver,
terms of the multi-million, multi-year agreement (length and total dollar amount) have not been publicly released.
• Edmonton: sold the naming rights to Rexall Pharmacies in 2003 upon expiry of a five-year, $6.0 million naming
rights deal with Skyreach Equipment Ltd. ($1.2 million per year). Rexall is part of Katz Group Inc., owner of the
Edmonton Oilers. Rexall’s naming rights deal is to expire in 2013; financial terms have not been publicly disclosed.
• Toronto: sold naming rights to their new venue to Air Canada Enterprises in 1997. This 20-year arrangement is
valued at $40.0 million ($2.0 million per year) and will expire in 2017.
• Ottawa: sold naming rights to the Bank of Nova Scotia in 2006 upon expiry of the building’s original sponsorship
with Corel Corporation. Published reports indicate the original arrangement with Corel was a 20-year, $26.0 million
deal ($1.3 million per year), with Corel opting out of the arrangement after year 10. The current arrangement with
the Bank of Nova Scotia is reported at $20.0 million for 15 years (expiring in 2015) and paying the Ottawa Senators
approximately $1.33 million per year.
• Montreal: naming rights to the Montreal Canadien’s new building were sold to Bell Canada Enterprises in 2002.
This 20-year arrangement is valued at $60.0 million ($3.0 million per year) and is to expire in 2022.
• Based on historic trending in naming rights values in both the United States and Canada (and factoring in values of the
most recently completed transactions not yet made public), average market values have grown by average annual rates
approximating 5%, with longer-term historic growth rates slightly higher for single-tenant NHL buildings in the United States
and slightly lower for multi-tenant NHL buildings in the United States.
• Based on a linear extrapolation of these trends, current average values are estimated to approximate:
• $4.0 million per year for Canadian NHL venues;
• $5.0 million per year for single-tenant NHL venues in the United States; and
• $8.5 million per year for multi-tenant NHL venues in the United States.
13 Ville de Québec – Québec Amphitheatre Naming Rights Assessment © Deloitte & Touche LLP and affiliated entitiesNaming rights landscape in Canada
NHL Venues – Trends in Average Annual Naming Sponsorship Value
$9,000,000
$8,000,000
$7,000,000
$6,000,000
$5,000,000
$4,000,000
$3,000,000
$2,000,000
$1,000,000
$0
1992 1993 1994 1995 1996 1997 1998 1999 2000 2001 2002 2003 2004 2005 2006 2007 2008 2009 2010
Canadian NHL Venues Trend
US NHL Venues (single team buildings) Trend
US NHL Venues (multi-team buildings) Trend
Acknowledges Rogers Arena naming rights sponsorship
14 Ville de Québec – Québec Amphitheatre Naming Rights Assessment © Deloitte & Touche LLP and affiliated entitiesBuilding sponsorships
Corporate Support
• In additional to naming / building title sponsorships, sports venues also regularly secure sponsorships associated with
building components and features, including concourses, lounges / restaurants, food & beverage / concession operations,
pouring rights, digital media / telecommunications, etc. In the vast majority of instances, these sponsorships are secured
in associated with or by the sport team tenant and the revenue derived there from accrue to the benefit of the team.
Among the corporations who are most commonly associated with professional sport franchises and, by extension their
arena, include the following (corporate partners of the Vancouver Canucks and, previously, GM Place are also illustrated
below):
• Beer: Molson Breweries, Labatt Breweries, Sleeman
Breweries, etc.
• Telecommunications: Bell, Telus, Rogers, etc.
• Technology: Cisco, IBM, Nortel Networks, Sony, etc.
• Financial Institutions: RBC, TD Bank, Bank of
Montreal, ScotiaBank, HSBC, Desjardins,
MasterCard, VISA, etc.
• Automotive: General Motors, Ford, Honda, Toyota,
etc.
• Soft Drinks: Coca-Cola, Pepsi, etc.
• Spirits: Daigeo, Smirnoff, etc.
• Insurance: Sun Life Financial, State Farm, etc.
• Restaurants / Fast Food: McDonalds, Subway, Tim
Hortons, Boston Pizza, Prime Restaurants, etc.
• Sports Equipment and Apparel: Nike, RBK, etc.
• Airlines: Air Canada, WestJet, etc.
• Couriers: Purolator, Federal Express, UPS, etc.
• Energy: Petro Canada, Imperial Oil, Direct Energy,
etc.
• Gaming: individual casinos, provincial lottery and
gaming corporations, etc.
• Consumer Products: Best Buy, Home Depot, Home
Hardware, Canadian Tire, etc.
15 Ville de Québec – Québec Amphitheatre Naming Rights Assessment © Deloitte & Touche LLP and affiliated entitiesBuilding sponsorships
Corporate Support
• Like other Canadian NHL franchises and buildings, it is expected that some of these companies, in addition to other local /
Quebec-based entities, would agree to become formally associated with, and become a corporate sponsor of both the new
Amphitheatre and an NHL franchise should one locate / relocate to Quebec City. As stated above, the majority of revenue
derived from such sponsorships would normally accrue to the benefit of the NHL team unless the team and building
specifically negotiate an acceptable revenue sharing arrangement.
• Sponsorship categories would likely include the following, with sponsors in each category offered exclusivity (i.e., the team
/ building would grant only one beer, soft drink, water, insurance, telecommunications, etc. company sponsorships rights).
Such sponsorships could be linked to a physical feature of the building (i.e., an individual concourse or suite level, the
media room, club lounge, in-arena restaurant, etc.) or as an “official” supplier / professional services firm / company of the
team / building. Such arrangements would also provide the sponsor with advertising within the building (whether on the ice
surface, the rink boards, on halo video boards, back-lits, other in-arena advertising positions, etc.).
• Beer • Soft Drinks
• Spirits • Wine
• Financial Institutions / Banks • Insurance
• Telecommunications • Technology
• Automotive • Airlines
• Restaurants / Fast Food • Sports Equipment and Apparel
• Consumer Products • Couriers
• Freight Forwarding • Energy
• Gaming • Professional services / Real Estate
• Pharmaceuticals • Local newspapers / media
• Our understanding, gleaned from prior assignments is that such level of sponsorship, including naming rights, will total
several millions of dollars per year for the average NHL team; as stated previously, most NHL teams retain 100% of
building and team sponsorship revenue (including in some cases naming rights sponsorship revenues) unless other
arrangements are specifically negotiated.
16 Ville de Québec – Québec Amphitheatre Naming Rights Assessment © Deloitte & Touche LLP and affiliated entitiesComparative market assessment
Socio-economic profile
• Quebec City is the tenth largest city and seventh largest urban area in Canada. With an estimated 2010 regional
population of almost 760,000 people, Quebec City is the largest urban area in eastern Quebec, commanding a large
regional trade area and supporting significant visitation by tourists.
• Although economic growth was relatively flat in 2009, it outperformed all but one other Canadian metropolitan area
(Halifax). The Conference Board of Canada reports that with the recession over, local economic activity is projected to
have accelerated sharply in 2010, and growth in the manufacturing sector coupled with stronger growth in the construction
and service sectors are projected to allow the regional economy to expand by 3.4% in 2010 and by a further 2.4% in 2011.
• Similar to the overall state of the economy in Quebec City, total employment in the region grew by 0.5% in 2009 (in
comparison with most other markets where total employment declined) and is expected to further expand by between
1.1% and 1.4% per year through 2012. This level of economic expansion and employment growth has fueled retail
spending in the region at rates some 5% to 13% above the national average, despite average household incomes being
approximately 15% below the national average.
• As the provincial capital, Quebec City enjoys greater economic stability because of the presence of Québec government
ministries and corporations. Quebec City’s regional economy is broad and encompasses:
• applied technologies (including optics, photonics, electronics, software, computer services, geomatics, video games,
defense, security, etc.);
• life sciences, health and nutrition (including biotechnologies, biomedicine, pharmaceuticals, nutraceuticals, functional
foods, agri-food processing, etc.); and
• processed materials (plastics, composite materials, secondary wood processing, etc.).
• Major public and private sector employers include the following:
Public Sector Private Sector
Centre Hospitalier de l'Université Laval (CHUL) Beenox
Centre Hospitalier Robert Giffard BPR
Centre Hospitalier Universitaire de Québec CGI
Commission scolaire des Premières-Seigneuries Exfo
Gouvernement du Québec Fairmont Château Frontenac
Hydro-Québec Frima Studio
Hôtel-Dieu de Québec GlaxoSmithKline
Institut de réadaptation en déficience physique de Québec (IRDPQ) Industrielle Alliance
Université Laval La Maison Simons
Ville de Québec Papier White Birch
17 Ville de Québec – Québec Amphitheatre Naming Rights Assessment © Deloitte & Touche LLP and affiliated entitiesComparative market assessment
Socio-economic profile
• In addition to the above noted companies, the Quebec City region is home to a number of smaller established companies
and emerging entities. Generally, such entities can also be the source of building and team sponsorships. Such entities
include:
Sector Companies
ABB Process Analytics EXFO Telops
Applied Technology
EO Gentec
Defence & Security DAP Technologies DMR Consulting Thales
Comlab Telecommunications Labcal Technologies Multitel
Electronics
Gecko
BMR Frima Studio Ubisoft
Information Technology
Beenox
Groupe ALTA Korem XEOS Imaging
Geomatics
Innovision Plus
Life Sciences Medicago SFBC Anapharm
Insurance / Financial Services Industrial Alliance LaCapitale SSQ Financial Group
• In summary, while global economic growth is expected to be moderate, real GDP in the Quebec City region is projected to
accelerate sharply before moderating through 2014. General economic growth is forecast to stimulate employment growth
and in turn generate strong retail sales growth.
Comparison with other Canadian NHL markets
• The following slide profiles Quebec City (city and region) against the six Canadian NHL centres (city and region), noting:
• 2006 population and population rank;
• 2010 population and population rank;
• median population age and proportion over the age of 20 and between 20 and 54;
• average household income;
• retail sales growth; and
• various economic indicators, including GDP growth, employment growth and business composition.
18 Ville de Québec – Québec Amphitheatre Naming Rights Assessment © Deloitte & Touche LLP and affiliated entitiesComparative Market Assessment
Socio-economic indicators – Canadian NHL cities and Quebec City
Vancouver Edmonton Calgary Toronto Ottawa Montréal Québec
City CMA City CMA City CMA City CMA City CMA City CMA City CMA
2006 Population1 578,041 2,116,581 730,372 1,034,945 988,193 1,079,310 2,503,281 5,113,149 812,129 1,130,761 1,620,693 3,635,571 491,142 715,515
2006 Population Rank 8 3 5 6 3 5 1 1 4 4 2 2 10 7
Estimated July 1, 2010 Population2 632,495 2,329,999 805,915 1,149,611 1,110,181 1,219,747 2,670,359 5,667,093 878,040 1,220,609 1,661,005 3,850,472 512,350 756,305
2010 Population Rank 8 3 5 6 3 5 1 1 4 4 2 2 10 7
2006-2010 Growth Rate (CAGR) 2.3% 2.4% 2.5% 2.7% 3.0% 3.1% 1.6% 2.6% 2.0% 1.9% 0.6% 1.4% 1.1% 1.4%
Median Age (2006) 1
38.6 39.1 36.1 36.4 35.7 35.7 38.4 37.5 38.4 38.4 38.8 39.3 42.7 41.7
% over 20 82.1% 77.2% 76.3% 74.7% 75.3% 74.8% 77.8% 74.8% 75.7% 75.3% 79.7% 76.7% 80.8% 79.1%
% 20 to 54 years 58.3% 53.1% 54.9% 53.5% 56.5% 56.1% 53.4% 52.7% 52.2% 52.5% 53.7% 51.6% 50.9% 51.1%
Average Household Income (2010)2 $80,544 $86,071 $90,870 $98,857 $118,654 $122,459 $89,519 $99,268 $95,462 $91,159 $59,016 $72,155 $65,208 $69,323
% over / (under) Canadian Average ($80,750) -0.3% 6.6% 12.5% 22.4% 46.9% 51.7% 10.9% 22.9% 18.2% 12.9% -26.9% -10.6% -19.2% -14.2%
Retail Sales (% above / below Canadian Average) 2 -5.0% -8.0% 34.0% 29.0% 25.0% 20.0% -19.0% -17.0% -10.0% -13.0% -8.0% -6.0% 5.0% 13.0%
Real GDP (2010) 3 $83,551 $50,412 $63,064 $227,863 $47,295 $126,205 $25,743
Economic Outlook 3
GDP Growth 2009 -1.7% -5.1% -4.5% -2.3% -0.7% -0.9% 0.1%
GDP Growth 2010 4.3% 3.8% 3.5% 4.7% 3.7% 3.2% 3.4%
GDP Growth 2011 3.3% 3.5% 3.8% 3.6% 2.5% 2.3% 2.4%
GDP Growth 2012 3.6% 4.3% 4.4% 3.9% 2.3% 2.7% 2.4%
Employment Growth3
2009 -0.2% -0.6% -0.9% -1.0% -1.5% -1.0% 0.5%
2010 1.1% 10.0% -0.6% 2.0% 2.8% 3.3% 1.4%
2011 2.7% 2.0% 3.7% 3.2% 0.4% 1.1% 1.3%
2012 2.2% 2.5% 2.4% 3.1% 1.1% 1.7% 1.1%
Business Composition4
> $50 million in sales 543 287 402 868 109 746 146
> $100 million in sales 195 106 169 340 40 296 52
> $500 million in sales 15 9 34 49 6 39 6
> $1.0 billion in sales 2 1 17 27 2 16 2
Source: 1. Statistics Canada (2006 Census)
2. FP Markets – Canadian Demographics 2010
3. Conference Board of Canada (Metropolitan Outlook – August 2010). Gross Domestic Product (“GDP”) is expressed in $ millions (2002 base year)
4. InfoCanada.com
19 Ville de Québec – Québec Amphitheatre Naming Rights Assessment © Deloitte & Touche LLP and affiliated entitiesComparative market assessment
Comparison with other Canadian NHL markets
• Based on this review, we note the following:
• The Quebec City region is the largest region in Canada currently without an NHL franchise. Its regional population
ranks approximately 35% below that of the sixth largest region (Edmonton), and its regional population has grown
proportionally as fast as Montreal’s. Quebec City’s demographic composition is similar to other Canadian NHL
cities.
• While average family incomes are lower than those in Vancouver, Edmonton, Calgary, Toronto and Ottawa, they
approximate those in Montreal; retail spending per capita in Quebec City is, however, significantly higher than in
some of these centres, including Montreal, Ottawa, Toronto and Vancouver.
• From an economic perspective, Quebec City appears to be more stable having recently emerged from the recent
economic downtown with positive (albeit slight) GDP and employment growth, a situation in direct contrast to each of
the Canada’s other NHL cities. The overall size and depth of the regional economy of these six markets is, however,
greater, with the total size of the Quebec City economy being approximately 50% to 55% of the size of the two
smallest NHL city economies (Ottawa and Edmonton).
• With respect to overall business composition, the Quebec City region would appear to be similar in size to Ottawa,
with each metropolitan region having a reported six entities headquartered in the area with annual sales in excess of
$500 million and two entities with annual sales in excess of $1.0 billion; Quebec City has more reported firms with
sales in excess of $50 million than does Ottawa.
• Not reported in these figures is, however, the myriad of corporations not headquartered in Quebec City but are
nonetheless heavily entrenched in the Quebec spirit. Much like local entities that have agreed to sponsor buildings
“in their own community’s backyard”, these entities, among them Banque Laurentienne du Canada, Banque
Nationale, Bombardier, Caisse de dépôt et placement du Québec (“SITQ”), Caisses Desjardins du Québec, Couche-
Tard, Quebecor and SNC-Lavalin, also need to be considered for both naming and other building sponsorships.
Venue activity
• The Figure on the following slide summarizes various Canadian NHL venue vital statistics, including building size (total
capacity), number of suites, date opened, number and type of sport team tenant, and number of events, by type, which
have occurred in the building in both 2009 and 2010.
20 Ville de Québec – Québec Amphitheatre Naming Rights Assessment © Deloitte & Touche LLP and affiliated entitiesComparative market assessment
Venue activity
• Based on this review, we note the following:
• NHL venues in Canada generally attract between 100 and 150 events per year, with buildings located in Edmonton,
Calgary Toronto and Montreal generally securing a minimum of 135 events annually, whereas GM Place / Rogers
Arena generally secures 105 to 110 events annually. Only ScotiaBank Place in Ottawa appears to secure less than
80 events annually (the reader should note, however, that this brief survey was based on calendar references taken
from each facility’s web site; if event dates were erased there from, they would be excluded from these event
counts).
• Based on Ernst & Young’s assessment, the proposed 18,000 Amphitheatre is envisioned to secure slightly more
events than Vancouver secured in 2009 and 2010, but slightly less than the Bell Centre over this same period.
• Despite the small sample size, it would appear that event potential and timing are positively correlated with
sponsorship values. In this regard, older naming rights deals generally have lower “sponsorship values per event”,
while more recent deals have higher values.
Vancouver Edmonton Calgary Toronto Ottawa Montreal
Quebec City
2009 2010 2009 2010 2009 2010 2009 2010 2009 2010 2009 2010
Building Size 18,630 17,100 19,289 18,819 19,153 21,273 18,000
Year Opened 1995 1974 1983 1999 1996 1996 t.b.d.
Number of Suites 75 55 72 153 148 135 t.b.d.
Sport Teams Vancouver Canucks NHL) Edmonton Oilers (NHL) Calgary Flames (NHL) Toronto Maple Leafs (NHL) Ottawa Senators (NHL) Montreal Canadiens (NHL) t.b.d.
Edmonton Oil Kings (WHL) Calgary Roughnecks (NLL) Toronto Raptors (NBA)
Edmonton Rush (NLL) Calgary Hitmen (WHL) Toronto Rock (NLL)
Number of Events
NHL 55 47 58 43 51 38 49 47 47 43 49 49 48
Other Sports 8 3 60 64 54 50 61 58 0 18 12 12 10
Concerts 40 36 28 30 36 34 35 33 26 0 46 53 45
Other Events 4 24 11 14 29 19 9 13 1 2 34 20 18
Total 107 110 157 151 170 141 154 151 74 63 141 134 121
Annual Naming Rights Value $925,000 n/a $1,000,000 $2,000,000 $1,333,333 $3,000,000 n/a
Value per event (2010) $8,400 n/a $7,100 $13,200 $21,200 $22,400 n/a
Date of Sponsorship 1995 2003 2000 1997 2006 2002 n/a
21 Ville de Québec – Québec Amphitheatre Naming Rights Assessment © Deloitte & Touche LLP and affiliated entitiesComparative market assessment
Summary
• As Canada’s seventh largest region, Quebec City enjoys greater economic stability because of the presence of Québec
government ministries and corporations. While the overall size of the economy pales in comparison to other NHL markets
in Canada, the presence of a number of businesses in the local market and in the broader provincial economy suggest a
possible ready market for naming and sponsorship opportunities.
• The proposed 18,000-seat Amphitheatre is projected to secure 121 events annually if an NHL teams were to play in the
building. At this level, the Amphitheatre’s event profile would approximate those of other major arena venues in Canada.
22 Ville de Québec – Québec Amphitheatre Naming Rights Assessment © Deloitte & Touche LLP and affiliated entitiesSummary and Conclusions
Estimated Value
• Based on our review of the Quebec City market vis-à-vis other Canadian NHL markets, we note the following:
• As Canada’s seventh largest region, Quebec City enjoys greater economic stability because of the presence of
Québec government ministries and corporations. While the overall size of the economy pales in comparison to other
Canadian NHL markets, the presence of a number of businesses in the local and broader provincial economy
suggest a possible ready market for naming and sponsorship opportunities.
• The proposed 18,000-seat Amphitheatre is projected to secure 121 events annually if an NHL team were to play in
the building. At this level, the Amphitheatre’s event profile would approximate that of other major arena venues in
Canada.
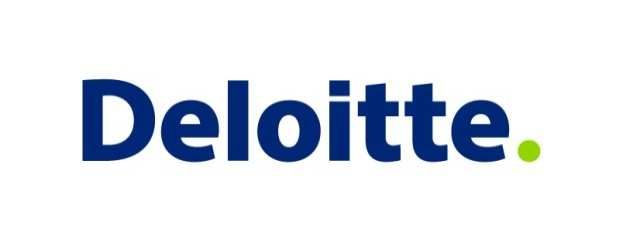
• Naming right values for NHL arenas in Canada have escalated significantly over the past 15 years; extrapolating
these trends to estimate current values (and acknowledging values of recent sponsorship transactions), current
average annual values are estimated to approximate $4.0 million per year ($2010) and grow to almost $4.5 million
per year by 2012.
Canadian NHL Venues – Forecasted Growth in Annual Naming Sponsorship Values
$6,000,000
$5,000,000
$4,000,000
$3,000,000
$2,000,000
$1,000,000
$0
1992 1993 1994 1995 1996 1997 1998 1999 2000 2001 2002 2003 2004 2005 2006 2007 2008 2009 2010 2011f 2012f
Canadian NHL Venues Trend Forecast
23 Ville de Québec – Québec Amphitheatre Naming Rights Assessment © Deloitte & Touche LLP and affiliated entitiesSummary and Conclusions
Estimated Value
• Acknowledging that this figure reflects the extrapolated 2010 average annual naming sponsorship value across six
different Canadian markets and involving nine separate transactions between 1005 and 2010, our opinion is that this
average represents an appropriate starting point from which to assess the naming rights potential of the new 18,000-seat
Amphitheatre. Adjustments to this figure would then be made based on the following factors previously identified as
comprising some of the key determinants of sponsorship value.
Sponsorship Factor Impact on Value Comments
Size and nature of local market negative 7th largest market in Canada
Physical location of the Amphitheatre t.b .d. to be determined / finalized
to be determined / finalized; can be maximized through the location decision and
Venue visibility and "signage value" t.b .d.
design process
Internal "signage value" potential t.b .d. to be determined / finalized; can be maximized through the design process
Number and type of events taking place neutral 120+ events - similar to the event profile of other major Canadian venues
National / international media exposure positive new facility with a new NHL team will create positive brand awareness and notoriety
Venue's positioning and image positive venue will be seen as catalyst to NHL returning to Quebec City
renewal of NHL hockey in Quebec will maximize marketing value of any potential
Nature of venue tenant positive
building sponsorship
multiple potential sponsors ranging from beer, telecommunications, media, soft
Nature / number of potential corporate sponsors positive
drinks, financial institutions to advanced manufacturing
Newness of the venue positive new state-of-the-art facility
Nature of sponsorship package offered t.b .d. to be determined
24 Ville de Québec – Québec Amphitheatre Naming Rights Assessment © Deloitte & Touche LLP and affiliated entitiesSummary and Conclusions
Estimated Value
• In our opinion is that a new 18,000-seat Amphitheatre built in Quebec City and housing a new or relocated NHL franchise
should therefore be able to generate a minimum of $4.0 million in annual naming right value. We base this opinion on the
following:
• The Amphitheatre would comprise a new, state-of-the-art sports and entertainment facility which, combined with the
cache of a new or relocated NHL franchise, would increase the attractiveness and marketing value of the
Amphitheatre and therefore the marketing appeal of the building for its naming sponsor (positive);
• Moreover, a new or relocated franchise would mark the return of NHL hockey to Quebec City, a situation which has
been eagerly anticipated and which could not occur without a new venue. As such, the return of the NHL would
constitute a situation that would receive significant fanfare and notoriety locally, provincially and nationally and
across North America (positive).
• The Amphitheatre would attract some 120 events annually, a level of activity consistent with other major arenas in
Canada (neutral).
• While the number of major corporations with headquarters in Quebec City is below that of other Canadian NHL
markets (negative) and the size of the local market is less than that of other Canadian NHL cities (negative), there
does exist a myriad of Quebec-based corporations that are heavily entrenched in the Quebec spirit and which could
potentially agree to sponsor the facility for philanthropic as well as corporate marketing / branding reasons (positive).
Such entities could include, among others, Banque Laurentienne du Canada, Banque Nationale, Bombardier,
Caisse de dépôt et placement du Québec (“SITQ”), Caisses Desjardins du Québec, Couche-Tard, Quebecor and
SNC-Lavalin.
• Finally, in addition to these Quebec-based firms, there may also be opportunities for the Amphitheatre to secure a
naming sponsorship from a company wanting to establish a presence in Quebec City / the province of Quebec while
at the same time usurping a prominent Quebec-based firm (similar to Rogers Communications sponsorship of the
Vancouver Canucks Arena). Examples of such entities could include Labatt’s Breweries (vis-à-vis Molson Breweries
and their historic relationship in Quebec and with the Montreal Canadiens) and Coke (vis-à-vis Pepsi’s existing
sponsorship of Le Colisee), among others (positive).
25 Ville de Québec – Québec Amphitheatre Naming Rights Assessment © Deloitte & Touche LLP and affiliated entitiesSummary and Conclusions
Estimated Value
• Based on the above factors, we believe that a 10-year deal, averaging $4.0 million per year ($40 million in total) would
constitute an appropriate minimum threshold. For a 20-year term, our opinion is that the average value should be
somewhat higher, reflecting the fact that naming rights sponsorships have historically increased significantly over time.
• Prepaid upfront, such an agreement would be valued at a minimum of $32.5 million for 10 years (discounted at 5.00% per
annum and assuming $4.0 million is paid up-front and $4.0 million is paid annually on the anniversary of the agreement).
Over a 20-year term, the prepaid upfront value would approximate $65.0 million.
Minimum Annual Minimum Amount if
Term
Rights Fee Prepaid Upfront
10 years $4.0 million $32.5 million
20 years $5.0 million $65.0 million
• In our opinion, a Quebec-based corporation may be willing to secure the naming sponsorship rights to the Amphitheatre for
an amount in excess of this estimate, given that this entity would be viewed locally, provincially and nationally as a key
facilitator in the NHL’s return to Quebec City, thereby generating heightened positive goodwill and hence marketing value
from their sponsorship affiliation.
• If, however, an NHL franchise is not awarded or relocated to Quebec City, our opinion is that naming sponsorship rights for
the Amphitheatre would be significantly less.
26 Ville de Québec – Québec Amphitheatre Naming Rights Assessment © Deloitte & Touche LLP and affiliated entitiesSummary and Conclusions
Enhancing Value
• While we believe $4.0 million per year (over a 10-year term) is an achievable threshold for the proposed Amphitheatre, we
also believe there may also be opportunities to enhance the sponsorship arrangement to extract additional value. Such
opportunities could include:
• Obtaining additional marquees / pylon signage along area highways;
• Increasing the number of sports teams and entertainment events playing in the venue, in particular the QMJHL
Québec Remparts (in a number of cases, a building will reserve the right to increase the annual naming rights fee
should an additional tenant take up residence in the facility; in one example we are aware of, the additional amount
was predefined in the agreement at a fixed amount, while in another, we understand that the value was dependent
upon the number of games the new team would play in the venue and the team’s expected average attendance in
relation to the main lead tenant);
• Broadening the sponsorship opportunity to include food / drink / concession rights (applicable to food and beverage
companies), telecommunications and media rights, etc. (similar to Rogers Communications which, in addition to
securing the naming rights of the Vancouver Canucks arena, also obtained the exclusive telecommunications
sponsorship of the team and arena); and
• Structuring the deal to include periodic or regularly scheduled increases in the annual building sponsorship rights
fee.
27 Ville de Québec – Québec Amphitheatre Naming Rights Assessment © Deloitte & Touche LLP and affiliated entitiesAppendix 28 Ville de Québec – Québec Amphitheatre Naming Rights Assessment © Deloitte & Touche LLP and affiliated entities
General Assumptions and Limiting Conditions
1. The use of any Projections made in conjunction with this Report may not be appropriate for use outside of their intended purpose. These Projections, which will
   not reflect actual financial results, may reflect a possible scenario for the Project for the Projection Period, given Deloitte’s judgment as to a probable set of
   economic conditions, together with the hypotheses which are consistent with the purpose of the Projections. Each of the financial scenarios produced in
   conjunction with our analysis may contain hypotheses and assumptions which are based on a set of economic conditions or anticipated courses of action that
   are reasonable and appropriate in Deloitte’s judgment, are consistent with the purpose of the projections, but which may not materialize as set out therein. The
   hypotheses represent plausible circumstances, but need not be, and may not have been fully supported.
    Since future events are not subject to precise projections, some assumptions will not materialize in the exact form presented by our analysis. In addition, other
    unanticipated events and circumstances may occur which could influence the future outcome and performance of the Project. Therefore, the results achieved in
    future operating periods will vary from the analysis of prospective market and financial conditions set out therein. While there is no recourse to predicting these
    matters with certainty apart from informed and reasoned judgments, it must be stated that future events may lead to variations in Project performance which may
    materially alter Project results. Deloitte does not warrant that actual results achieved during the Projection Period will be the same, in whole or in part, as those
    shown in the Projection. The Projection is based on hypotheses and there is a significant risk that actual results will vary, perhaps materially, from the results
    projected.
2. Responsible ownership and competent property management are assumed.
3. Information furnished by others upon which all or portions of this report are based, is believed to be reliable, but has not been verified in all cases. No warranty is
   given as to the accuracy of such information.
4. Our report and work product cannot be included, or referred to, in any prospectus, securities and exchange commission filing or other public or investment
   document.
5. The intended use of this report is as a high level examination of the potential naming sponsorship value of a proposed 18,000-seat Amphitheatre in Quebec City.
   A detailed feasibility review / business plan analysis has not been undertaken, nor should one infer that such a study has been undertaken.
6. It is assumed that all required licenses, certificates of occupancy, consents, or other legislative or administrative authority from any local, provincial, or national
   government or private entity or organization have been, or can readily be obtained, or renewed for any use on which the estimates provided in this report are
   based.
7. No investigation has been made of, and no responsibility is assumed for, the legal description or for legal matters including title or encumbrances. The property
   is assumed to be free and clear of liens, easements, encroachments and other encumbrances unless otherwise stated.
8. Full compliance with all applicable federal, provincial and local zoning, use, occupancy, environmental, and similar laws and regulations is assumed, unless
   otherwise stated.
9. No responsibility is taken for changes in market conditions and no obligation is assumed to revise this report to reflect events or conditions which occur
   subsequent to the effective date of this report.
10. Any financial structure cities within this report is predicated on the market conditions prevailing as of the date of this report.
11. Areas and dimensions of the property were obtained from sources believed to be reliable. Maps or sketches, if included in this report, are only to assist the
    reader in visualizing the property and no responsibility is assumed for their accuracy. No independent surveys were conducted.
12. It is assumed that there are no hidden or unapparent conditions of the property, subsoil, or structures that affect value. No responsibility is assumed for such
    conditions or for arranging for engineering studies that may be required to discover them.

 29 Ville de Québec – Québec Amphitheatre Naming Rights Assessment                                                                       © Deloitte & Touche LLP and affiliated entities
You can also read