EXPERIENCE WELLINGTON 2019-20 STATEMENT OF INTENT - Presented to Wellington City Council pursuant to Section 64 of the Local Government Act 2002
←
→
Page content transcription
If your browser does not render page correctly, please read the page content below
EXPERIENCE WELLINGTON
2019-20 STATEMENT OF INTENT
Presented to Wellington City Council pursuant to
    Section 64 of the Local Government Act 2002

             Experience Wellington – Statement of Intent 2019-20 1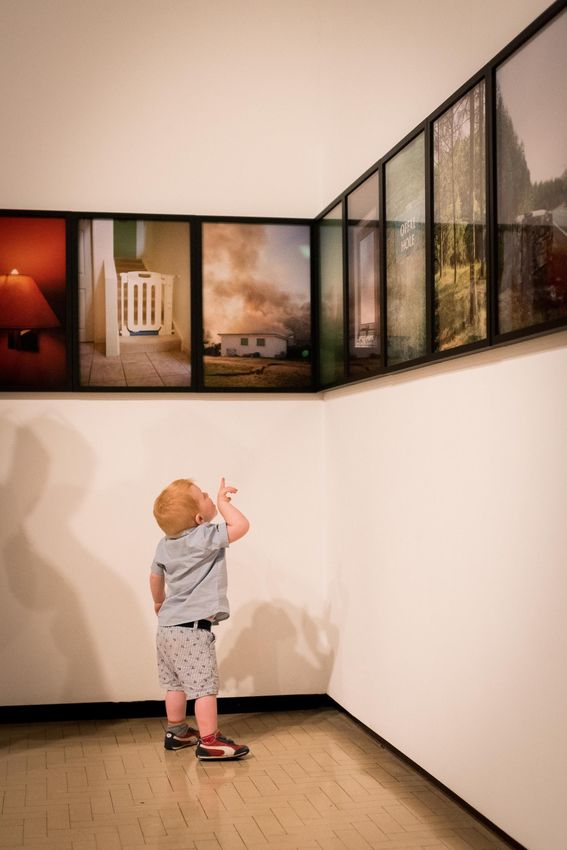
CONTENTS
CONTENTS ..................................................................................................................................... 2
OUR INTENT IN 2019-20................................................................................................................ 4
COUNCIL’S EXPECTATIONS ............................................................................................................ 5
OPERATING ENVIRONMENT UPDATE ........................................................................................... 9
NATURE AND SCOPE OF EXPERIENCE WELLINGTON’S ACTIVITIES ............................................. 10
PERFORMANCE MEASUREMENT ................................................................................................ 11
BOARD’S APPROACH TO GOVERNANCE ..................................................................................... 16
COUNCIL RELATIONSHIP PRINCIPLES .......................................................................................... 17
MANAGEMENT, ORGANISATIONAL HEALTH, CAPABILITY AND RISK ASSESSMENT ................... 18
APPENDIX 1: FORECAST FINANCIAL STATEMENTS ..................................................................... 20
APPENDIX 2: ACCOUNTING POLICIES.......................................................................................... 26
DIRECTORY .................................................................................................................................. 31

  This Statement of Intent (SOI) reflects the relationship and interest that the Wellington City Council (Council) has
  in Experience Wellington as a Council Controlled Organisation and our contribution to Council’s vision for the
  future of Wellington. Specifically, it responds to Council’s expectations as set out in its Letter of Expectations of 19
  December 2018 (see pages 5-8), and outlines our strategic plans (page 4) and performance targets (pages 11-15)
  for the next three years with detailed focus on the financial period 1 July 2019 to 30 June 2020.
  To achieve the best results for Wellington we will continue to work with Council and other Council Controlled
  Organisations WellingtonNZ, Wellington Zoo, ZEALANDIA, and the Wellington Cable Car Company), other local
  visitor experiences, the Museum of New Zealand Te Papa Tongarewa, tertiary education partners and relevant
  national organisations.
  Wellington City Council is our principal funder. They own the buildings that we operate our visitor experiences in,
  with the exception of Capital E which Council provides a rental subsidy for. Council will provide around 66% of our
  operational budget in 2019-20 with the other 34% coming from fundraising and trading revenues.
  We have a contract with Creative New Zealand that supports the delivery of the Capital E National Theatre for
  Children and the biennial Capital E National Arts Festival for Children. The learning experiences we offer are
  supported through Ministry of Education Learning Experiences Outside the Classroom (LEOTC) contracts. We also
  regularly receive support from the City Gallery Wellington Foundation for City Gallery’s programme. The Carter
  Observatory Trust supports our fundraising activities for Space Place.

Cover Image: A young Gavin Hipkins fan at ‘This Is New Zealand’ opening, March 2018, City Gallery Wellington.

2 Experience Wellington – Statement of Intent 2019-20
Engaged Curious Communities

                                  We are:
Working with and for Wellington to create remarkable
 art, culture and science experiences that generate
          vitality: enriching the city we love.

                             Our Values are:
     Connected: We work                           Quality First: We set
     together to deepen our                       ourselves high standards
     engagement with, and relevance               prioritising what will make a real
     to, the communities we serve.                difference to Wellington.

     Boldness: We are agile,                      Leading: We commit to
     proactive and use innovation and             providing an environment in
     creativity to achieve the best               which a high performing
     outcomes for our city.                       organisation culture will flourish.

                                            Experience Wellington – Statement of Intent 2019-20 3
OUR INTENT IN 2019-20
OUR FOCUS is to continue to enrich the city we love by telling Wellington’s stories through the city’s amazing cultural
assets and through every exhibition, public event, and children’s live or film production that we produce and present.
We welcome Council’s focus on arts and culture and we will work closely with Council and other arts and culture
organisations to make Wellington the undisputed cultural capital of New Zealand.
Our reach, organisation effectiveness and commitment to Te Tiriti o Waitangi priorities will be advanced in 2019-20 by:

                                                        ▪ Securing a permanent home for Capital E Nōku Te Ao.
                                                        ▪ Confirming the master plan for Wellington Museum Te Waka
                                                          Huia o Ngā Taonga Tuku Iho and being ready for building works
                                                          in 2020-21.
                                                        ▪ Securing the rights for City Gallery Wellington Te Whare Toi to
                                                          present our third high profile exhibition in 2020-21.
                                                        ▪ Encouraging all staff to have basic competency in Te Reo and
                                                          Tikanga Māori.
                                                        ▪ Developing an organisation culture based on whanaungatanga.
                                                        ▪ Continuing to improve business systems that support our
                                                          business activities.
                                                        ▪ Increasing revenue from fundraising.
                                                        ▪ Achieving a break-even budget or better.
                                                        ▪ Demonstrating our commitment to reducing our carbon
                                                          footprint.

OUR PERFORMANCE is measured by our Key Result Indicators (KRI). In 2019-20 we expect to:

       Attract over 660,000 on-site
    visitors to our experiences, 6%                                                     Expand our reach via our
      of which will be children and                                                     websites and social media
         young people visiting for a                                                    channels to engage with a
                learning experience.                                                    further 280,000 visitors.

                                                                                        Be highly rated by our visitors
          Raise $3.9m (34%) of our
                                                                                        for the quality of their visitor
      operating costs from trading
                                                                                        experience at our institutions,
        initiatives and fundraising.
                                                                                        with a 90% approval rating.

OUR FINANCIAL PERFORMANCE forecasts a break-even budget after fully-funding depreciation. The 2019-20 Budget is
based on the following key assumptions:

▪ We will receive $7,482,835 from Council (exclusive of cash underwrites) for the operation of Experience Wellington
  inclusive of Space Place Te Ara a Whānui Ki Te Rangi, representing a 2% increase on our base-line funding received
  in 2018-19.

▪ Our 2019-20 non-Council revenue target of just under $3.9 million represents an increase on our 2018-19 forecast.
▪ We remain committed to achieving a break-even budget after fully-funding depreciation.

The Forecast Financial Statements are provided in Appendix 1 (pages 20-25). Accounting policies are provided in
Appendix 2 (pages 26-30).
OUR CHALLENGES during 2019-20 are to achieve our budget and to resolve our accommodation uncertainties.

4 Experience Wellington – Statement of Intent 2019-20
COUNCIL’S EXPECTATIONS
Outlined in the left-hand column below are Council’s expectations for Experience Wellington during 2019-20, as stated
in the Letter of Expectations. The right-hand column below is drawn from our 2019-29 Strategic Plan, showing the
alignment of our 2019-20 focus areas with Council’s expectations.

 Council’s Expectations                Experience Wellington’s Response

 Support Council’s Te Tauihu Te        Our Priority Project, ensuring a Māori dimension in all Experience Wellington
 Reo Māori Policy                      plans and activities and in what visitors see, feel and experience, contributes to
                                       Council’s aspiration to be a Te Reo Māori city by 2040.
                                       In 2019-20 we will continue to build the Te Reo Māori capabilities of our staff
                                       through training and will progressively introduce Te Reo Māori signage and
                                       communication.

 Continue working closely with         We will continue to share information on future plans and to work closely with
 WellingtonNZ1 to promote              the team at WellingtonNZ to promote visitor experiences and to increase out-
 Experience Wellington’s               of-region visitation and reach.
 activities.

 Make a strong contribution            Our purpose is to work with and for Wellington to create remarkable art, culture
 towards the achievement of            and science experiences that generate vitality, enriching the city we love. See
 Council’s aims as per the 2018-28     page 10 for highlights from our 2019-20 visitor experience programme.
 Long-Term Plan, the Capital of
                                       In 2019-20 we will confirm plans for the Wellington Museum development, a
 Culture, and relevant Council
                                       project which has Council’s support through a $10m commitment in the Long-
 Strategies.
                                       Term Plan. The project will complete earthquake strengthening and the
                                       redevelopment of the visitor experience which started in 2015 with the opening
                                       of The Attic. This project will build Wellington Museum’s role within the region
                                       as the teller of Wellington’s stories, including an authentic Māori dimension.

                                       A third exhibition in City Gallery’s high value international contemporary art
                                       programme will be staged in 2020-21; the first two exhibitions in the
                                       programme were Cindy Sherman, presented in 2016-17; and Eva Rothschild:
                                       Kosmos and Semiconductor: The Technological Sublime, presented in 2018-19.
                                       Both were made possible with the assistance of Council and WellingtonNZ
                                       through the City Growth Fund/Major Events Fund.

                                       This programme enhances Wellington’s and City Gallery’s reputation as a
                                       destination for contemporary art lovers.

                                       Space Place will mark its 10th anniversary as a dedicated visitor experience in
                                       April 2020. The 2017-18 review of Space Place has highlighted the need for
                                       visitor experience refreshment and we will work with Council to establish a
                                       programme of exhibition and asset renewal.

                                       Through our programme of activity at Capital E we are committed to working
                                       with Council to achieve a Child Friendly City.

                                       Our Children and Young People Strategy and our Access and Inclusion Strategy
                                       are integral to our organisation effectiveness.

                                       We will continue to progress our Environmental Sustainability goals as well.

1 Previously known as WREDA – the Wellington Regional Economic Development Agency. Rebranded in 2019 to WellingtonNZ.

                                                                       Experience Wellington – Statement of Intent 2019-20 5
Increase the visibility of the        We will complete an audit of building signage and all external communication
 relationship with Council.            channels to ensure Council is credited appropriately as owner and principal
                                       funder. We will expect also to incorporate Council’s Te Tauihu Te Reo Māori
                                       Policy as changes are implemented.

 Performance Measures align with       Performance measures for the reporting period are provided on pages 11-15.
 Council’s own reporting
                                       By 30 June 2019 we will have completed a review of the way we monitor
 framework.
                                       audience profile and developed new tools to help us programme and
                                       communicate more responsively with those who already engage with us and to
                                       enable us to build new audiences. This is part of our strategy to improve the
                                       effectiveness of our engagement with communities and to help assess the
                                       contribution we are making to Wellington’s value proposition.

 Participate in Council’s review of    We welcome the opportunity to contribute to the review of the Leisure Card
 the Leisure Card programme            programme.
 during 2019-20.

 Consider expanding school             We remain committed to our Children and Young People Strategy and our
 holiday offerings to Wellington       purpose is to make growing up in the capital city full of opportunities to play,
 children and caregivers, subject      create and interact, with access to facilities and experiences that are for, by,
 to demand and commercial              with and between children and young people. Our vision is that the children and
 considerations.                       young people who encounter us feel safe, welcomed, included and important.

                                       Our experiences are open during the school holidays, and in 2019-20 we will run
                                       engaging holiday programmes for children and young people at Capital E and
                                       Space Place as part of our wider offering of activities and experiences for this
                                       audience group. At Wellington Museum and City Gallery we will work closely
                                       with independently-organised holiday programmes.

 Articulate the plans for delivering   During 2019-20 we will prepare the communications and secure the funding for
 a programme of international art      the next high profile exhibition, which will be presented 2020-21.
 exhibitions, noting that these
                                       We will work closely with Council and WellingtonNZ to present a long-term
 would likely require funding
                                       programme of exhibitions and secure a long-term funding commitment from
 support from the City Growth or
                                       the City Growth and/or Major Event Funds to support this programme.
 Major Event Funds.

 Seek to mitigate the impacts from     We have an exciting programme of exhibitions and events planned for City
 the Te Ngākau Civic Square            Gallery during 2019-20 with the aim of attracting visitation in spite of the
 earthquake strengthening works        construction activity happening on Te Ngākau Civic Square.
 to ensure that City Gallery
                                       We will continue to consult with Council about the Te Ngākau Civic Square works
 maintains a strong programme
                                       and our strategies for mitigating their impact on visitation to City Gallery.
 and contribution to Wellington.

 Seek to mitigate the impacts from     The closure of the Central Library building presents challenges and opportunities
 Council’s decision to close the       for Experience Wellington and we will work closely with Council and the Library
 Central Library.                      Services Team to support efforts to continue Central Library services whilst the
                                       building is closed.

 Seek opportunities to proactively     We are committed to working with cultural sector colleagues to coordinate and
 contribute to the Decade of           leverage cultural celebrations including the annual Matariki festival and other
 Culture including the cornerstone     cultural events that have helped to define Wellington’s standing as the arts
 Matariki event.                       capital of New Zealand.
                                       The Wellington Museum development, City Gallery’s international exhibition
                                       programme and the opening of a permanent home for Capital E will provide
                                       further opportunities to celebrate Wellington’s love for the arts.

6 Experience Wellington – Statement of Intent 2019-20
Discuss the key strategic findings   Following the recommendations of the Space Place Review, we will work with
of the review of Space Place and     Council to establish a programme of exhibition and asset renewal, to ensure that
how these are being addressed.       Space Place’s business model continues to grow visitation and revenue, with a
                                     renewed visitor experience that widens the offer to more visitors.

Maintain alignment with              We are committed to the Living Wage Policy and we implemented the 2018-19
Council’s Living Wage                Living Wage adjustment with Council’s assistance. We also aligned relativity
remuneration policy.                 adjustments with Council’s Remuneration Policy as it applied to the
                                     implementation of the Living Wage. We have assumed a 2% increase in
                                     personnel cost for the planning period.

Collaborate with the Wellington      We will continue to liaise with all our Council Controlled Organisation (CCO)
Cable Car Company and                colleagues, and especially with ZEALANDIA and the Wellington Cable Car
ZEALANDIA to continue to             Company to contribute where possible to further improving the overall
improve the overall visitor          experience in the Kelburn precinct at the top of the cable car.
experience in the Kelburn
                                     Our priority project, The Look Out! Pukehinau (Cable Car Precinct and
Precinct at the top of the Cable
                                     Surrounds), is a collaboration/partnership vehicle to engage with the other
Car.
                                     organisations operating in the Cable Car Precinct. So far through this initiative
                                     we have celebrated the 115th anniversary of the Cable Car’s first journey with
                                     Cable Car Hoopla; with Council’s Property Team, we refurbished the Thomas
                                     King Observatory for public use, including trialling an artist in residence
                                     programme; and contributed to the Botanic Garden’s 150th Birthday
                                     celebrations.

Update Council on its progress       A process has been agreed with Council regarding the development and
toward developing its business       presentation of the business case which we expect will confirm timing of
case for the proposed seismic        Council’s funding for the project.
strengthening and exhibition
                                     In 2019-20 we will confirm the master plan describing building fit-out, complete
upgrades of Wellington Museum
                                     the building consent process, and award contracts to commence the building
as signalled in the 2018-28 Long-
                                     works in 2020-21.
Term Plan.
                                     Fundraising for the development project will be a major focus of 2019-20.

Contribute to the Regional Waste     We are putting measures in place to reduce our waste output and we look
Management and Minimisation          forward to working with Council to develop and implement a waste
Plan goal of reducing waste to       management plan for Experience Wellington which contributes to the goal of
landfill by one third.               reducing waste to landfill by one third.

Contribute to the goals outlined     We are committed to becoming a Carbon Zero certified organisation within the
in Te Atakura, the First to Zero     next ten years. During 2019-20 we will begin the process of attaining CEMARS
plan once it has been finalised.     accreditation and we will ensure we work with Council to contribute to the goals
                                     outlined in Te Atakura, the First to Zero once it has been finalised.

Work with Council to develop         We will work with Council to develop further strategies to manage resilience
further strategies to manage         challenges during 2019-20. The completion of earthquake strengthening at
resilience challenges.               Wellington Museum will be completed in early 2022.

                                                                    Experience Wellington – Statement of Intent 2019-20 7
Governance

The Board aspires to be a leading governance group with the safety and wellbeing of our people of the upmost
importance. The Board is confident that it will comply with Council's expectations regarding legislative compliance and
in particular the Health and Safety at Work Act 2015.

Our legislative compliance schedule is reviewed annually by the Board and our compliance is closely monitored through
a rolling audit programme.

Our health and safety goal is a zero harm culture and our Key Result Indicator is no notifiable incidents. We have adopted
systems and processes to ensure our Health and Safety compliance and we work closely with Council to ensure that our
approach is consistent with its expectations. This is particularly relevant in the context of building management where
our Health and Safety obligations overlap.

The Sections on the Board’s Approach to Governance (page 16) and Management, Organisational Health, Capability and
Risk Assessment (pages 18-19) cover these expectations in more detail.

8 Experience Wellington – Statement of Intent 2019-20
OPERATING ENVIRONMENT UPDATE

Access to our Visitor Experiences

▪   We will work closely with Council to mitigate access issues to Te Ngākau Civic Square and to City Gallery Wellington
    Te Whare Toi as the earthquake strengthening of the Town Hall and other construction projects get underway.

▪   We will work closely with Council and the Library Services Team to mitigate the impacts from the closure of the
    Central Library building.

▪   We will plan to keep disruption to access to a minimum as we plan the redevelopment of Wellington Museum Te
    Waka Huia o Ngā Taonga Tuku Iho.

▪   We will work with Council on the inclusion of Capital E in a reimagined Te Ngākau Civic Square.

Funding Sources

▪   We expect to continue to diversify our revenue base and a key aspect of this is fundraising. While grant funding
    continues to be a significant funding source to meet programming costs we are committed to building our capability
    in personal giving through loyalty programmes including our legacy giving programme.

▪   The use of new technology, online fundraising options and ensuring that our business systems are fit for purpose
    are important aspects of our fundraising approach.

▪   We will continue to explore corporate sponsorship opportunities particularly in the context of high profile
    programming and major capital developments.

Stakeholders and Partners

▪   We continue to develop relationships with stakeholders and organisations particularly in the development of visitor
    experiences. The partnerships which result contribute to our organisation’s success and bring new experiences to
    Wellington. The Wellington Museum development has provided further opportunity to work closely with Mana
    Whenua which will help us build organisation capability and result in a richer Māori dimension within the visitor
    experience.

Sector Activity

▪   We monitor trends and activities within the arts and culture sector in New Zealand and overseas, looking for
    opportunities to increase our reach and revenue.

Technology

▪   We continue to strive to be in a position to take advantage of the growth in new technologies in order to improve
    organisation effectiveness including to enhance our reach and relevance to the communities we serve.

                                                                     Experience Wellington – Statement of Intent 2019-20 9
NATURE AND SCOPE OF EXPERIENCE WELLINGTON’S ACTIVITIES
Experience Wellington’s purpose is working with and for Wellington to create remarkable art, culture and science
experiences that generate vitality: enriching the city we love and with our vision, Engaged Curious Communities
defines our value proposition and how we contribute to Wellington's liveability and prosperity.
responds to the need for Wellington and New
Zealand to foster confident, creative, capable citizens who can be architects of
their own future.
leads the conversation
about contemporary art in New Zealand.
shares the stories and objects of Wellington.
transports visitors
from Wellington to outer space.
encourages visitors to explore and share the
technology, history and experience of Wellington’s Cable Car.
illustrates the story of Wellington through the
Wallis family.
We will present a full visitor experience programme in 2019-20 which will include:
▪ City Gallery Wellington presenting the much awaited survey exhibition of the work of Theo Schoon; a
partnership with the Ian Potter Gallery in Melbourne for an exhibition called Eavesdropping; and a new
commissioned solo project with one of New Zealand’s rising stars Fiona Connor.
▪ Commemorating Tuia – Encounters 250 with a series of small exhibitions at City Gallery Wellington; and a
national tour of a specially developed Capital E National Theatre for Children show featuring children’s own
stories of their first cultural encounters.
▪ Taking our Te Reo Māori Capital E/Taki Rua Theatre Company co-production of Te Kuia me te Pungawerewere
on tour in the South Island.
▪ Building on the success of Capital E’s inaugural Maker Faire with an increased focus on young makers’ creativity,
bringing their ideas to life.
▪ Joining with other city attractions in the celebration of Matariki which will include: Capital E presenting child-
focussed programmes as part of Council’s Matariki celebration; Matariki Dawn and star gazing at Space Place;
the continuation of our partnership with Chamber Music New Zealand at Wellington Museum and other events
aimed at showcasing Wellington during Matariki in June 2020.
▪ Four new planetarium shows at Space Place including: one focussed on the Moon – part of the 50th Anniversary
of the first person to walk on the Moon in July 2019; and one comparing and contrasting traditional Māori and
Pacific voyaging knowledge and practice with Western knowledge.
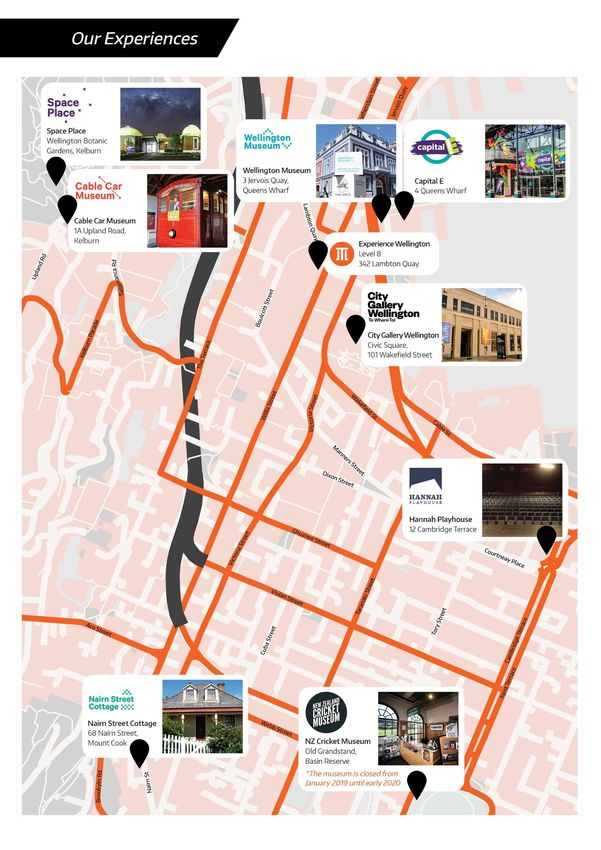
Experience Wellington cares for the recovered Plimmer’s Ark timbers and Wellington city’s heritage collections in storage.
We also have a management agreement with the New Zealand Cricket Museum Trust to provide in-kind support, including financial
management, for the New Zealand Cricket Museum; and a management agreement with the Hannah Playhouse Trust and Wellington City
Council to operate the Hannah Playhouse.
*Including the Plimmer’s Ark display in the Old Bank Arcade.
10 Experience Wellington – Statement of Intent 2019-20PERFORMANCE MEASUREMENT
We will continue to refine performance measurement over the planning period to better reflect the needs of
stakeholders for information that helps to assess the contribution or impact Experience Wellington makes to
Wellington’s prosperity and liveability. Any changes will be made in consultation with Council.
All financial statements and targets assume that the earthquake strengthening work on the Town Hall, and the closure
of the Central Library building will continue to have a negative effect on visitation over the planning period.
The planned closure of Wellington Museum for earthquake strengthening and development over an 18-month period
between 2020 and 2022 has also been taken into consideration in projecting visitation and revenue generation.
Our City
Key Result Indicators
City Residents’ Awareness: The number of Wellingtonians who know about our institutions as assessed through the
Annual Residents’ Survey conducted by Council.
2017-18 2018-19 2019-20 2020-21 2021-22
Residents’ Awareness
Actual SOI
City Gallery Wellington 91% 95% 95% 95% 95%
Wellington Museum 93% 97% 95% 95% 95%
Capital E 81% 90% 90% 90% 90%
Cable Car Museum 95% 97% 95% 95% 95%
Space Place 90% 97% 92% 92% 92%
Nairn Street Cottage 50% 60% 54% 54% 54%
Our Visitors
Key Result Indicators
Physical Visitation: The total number of on-site visits to institutions including general public, education and function
attendees. The annual target is reviewed each year and benchmarked against the average visitation for the institution
during the previous three years.
2017-18 2018-19 2019-20 Q1 Q2 Q3 Q4 2020-21 2021-22
Visitor Numbers
Actual SOI Jul-Sep Oct-Dec Jan-Mar Apr-Jun
City Gallery Wellington 153,194 170,000 150,000 40,000 36,500 36,500 37,000 150,000 140,000
Wellington Museum 127,413 132,000 130,000 25,300 35,900 41,800 27,000 50,000 50,000
Capital E 113,414 157,500 70,500 21,638 19,120 12,013 17,729 115,500 80,000
Cable Car Museum 269,028 237,000 256,000 36,300 77,700 93,300 48,700 260,000 264,000
Space Place 60,441 55,000 57,000 12,800 12,700 13,800 17,700 59,000 61,000
Nairn Street Cottage 1,724 2,000 2,000 400 400 800 400 2,000 2,000
Experience Wellington Total 725,214 753,500 665,500 136,438 182,320 198,213 148,529 636,500 597,000
Capital E will host the National Arts Festival for Children in 2018-19 and again 2020-21.
Capital E visitation figures from 2019-20 onwards exclude the Hannah Playhouse.
City Gallery visitation is effected by earthquake strengthening on the Town Hall and the closure of the Central Library. In 2020-21 we plan to present
a high-value art exhibition which we expect will boost in visitation numbers.
It is proposed that Wellington Museum Building will be closed for a period of 18 months for earthquake strengthening from 1 July 2020.
Experience Wellington – Statement of Intent 2019-20 11Virtual Visitation: The total number of unique user visits to institutional web/mobile sites.
2017-18 2018-19 2019-20 2020-21 2021-22
Virtual Visitor Numbers
Actual SOI
City Gallery Wellington 76,515 120,000 75,000 80,500 75,000
Museums Wellington 115,101 88,000 96,000 100,000 104,000
Capital E 40,719 45,000 45,500 46,000 47,000
Experience Wellington Total 232,335 253,000 216,500 226,500 226,000
Social Media Profile: A snapshot of Facebook friends, Instagram and Twitter followers.
2017-18 2018-19 2019-20 2020-21 2021-22
Social Media Numbers
Actual SOI
City Gallery Wellington 34,724 26,000 35,000 36,000 36,000
Museums Wellington 10,401 10,000 12,000 12,250 12,500
Capital E 6,905 6,250 8,000 8,500 8,250
Space Place 9,224 11,500 10,000 10,500 11,000
Experience Wellington Total 61,254 53,750 65,000 67,250 66,750
First Time Wellington City Visitors: The number of visitors who are residents of Wellington visiting for the first time.
We are currently developing the tools to accurately measure this indicator and will have targets set for the 2020-21
Statement of Intent.
Quality of Visit: Visitor feedback based on comfort, access, experience, knowledge gained, the friendliness of staff, the
length of visit and overall enjoyment.
2017-18 2018-19 2019-20 2020-21 2021-22
Quality of the Visitor Experience
Actual SOI
City Gallery Wellington 88% 90% 90% 90% 90%
Wellington Museum 92% 90% 90% 90% 90%
Capital E 93% 90% 90% 90% 90%
Cable Car Museum 85% 90% 90% 90% 90%
Space Place 87% 90% 90% 90% 90%
Nairn Street Cottage - 90% 90% 90% 90%
There was no Visitor Satisfaction Survey completed at Nairn Street Cottage during 2017-18.
Capital E’s Quality of Visit figures from 2019-20 onwards exclude the Hannah Playhouse.
12 Experience Wellington – Statement of Intent 2019-20Children & Young People Visiting for a Learning Experience: The number of students (aged 0-18 years) participating in
a learning experience organised by their education provider.
2017-18 2018-19 2019-20 2020-21 2021-22
Learning experience visitors
Actual SOI
City Gallery Wellington 3,355 4,500 4,500 4,500 4,500
Museums Wellington 7,819 7,000 7,000 7,000 4,000
Capital E 39,429 50,000 20,500 50,000 20,900
Space Place 8,192 8,250 8,250 8,250 8,250
Experience Wellington Total 58,795 69,750 40,250 69,750 37,650
Figures include LEOTC funded learning experiences as well as self-directed and outreach learning experiences.
Museums Wellington includes the Wellington Museum, Cable Car Museum and Nairn Street Cottage.
Wellington Museum will be under construction during 2021-22 so Learning Experience opportunities will be reduced.
Capital E hosted the National Arts Festival for Children in 2018-19 and will do so again in and 2020-21.
Capital E Learning Experience figures from 2019-20 onwards exclude the Hannah Playhouse.
Our Sustainability
Key Result Indicators
Financial Performance: A break-even budget and fully-funded depreciation.
Non-Council Revenue: The total amount of revenue (net of costs) generated from non-Council sources:
▪ Trading includes admissions, retail, venue hire, sub-letting and interest.
▪ Fundraising includes donations, sponsorships, other grants and cultural grants (CNZ and MOE for LEOTC).
2017-18 2018-19 2019-20 2020-21 2021-22
Trading ($’000) Actual SOI
$000 $000 $000 $000 $000
City Gallery Wellington 310 307 296 300 300
Museums Wellington 909 845 837 152 250
Capital E 562 509 252 529 255
Space Place 531 542 566 578 590
Sub Total 2,312 2,203 1,951 1,539 1,395
Sub-letting, Interest & Other 236 275 206 230 230
Experience Wellington Total 2,548 2,478 2,157 1,789 1,625
2017-18 2018-19 2019-20 2020-21 2021-22
Fundraising ($’000) Actual SOI
$000 $000 $000 $000 $000
City Gallery Wellington 299 274 574 474 555
Museums Wellington 178 173 158 130 130
Capital E 756 1,051 858 1,058 865
Space Place 53 103 111 127 132
Experience Wellington Total 1,286 1,601 1,701 1,789 1,682
Museums Wellington includes the Wellington Museum, Cable Car Museum and Nairn Street Cottage.
Capital E will host the National Arts Festival for Children in 2020-21. Capital E Non-Council Revenue figures from 2019-20 onwards exclude the Hannah
Playhouse.
The trading figures from 2020 are shown net of cost of sales.
Experience Wellington – Statement of Intent 2019-20 13Spend per Visitor: Visitor related revenue.
2017-18 2018-19 2019-20 2020-21 2021-22
Spend per Visit ($) Actual SOI
$ $ $ $ $
City Gallery Wellington 2.02 1.90 1.87 1.88 2.07
Museums Wellington 2.28 2.28 2.16 3.04 5.00
Capital E 4.58 3.12 3.29 3.19 3.19
Space Place 8.74 9.85 9.93 9.60 9.36
Museums Wellington includes Wellington Museum, Cable Car Museum and Nairn Street Cottage.
Capital E will host the National Arts Festival for Children in 2018-19 and will do so again in 2020-21.
Capital E Non-Council Revenue figures from 2019-20 onwards exclude the Hannah Playhouse.
Our People
Key Result Indicators
Health and Safety: No notifiable incidents involving workers or visitors as defined by the Health and Safety at Work Act
2015.
2017-18 2018-19 2019-20 2020-21 2021-22
Number of Notifiable Incidents
Actual SOI
Experience Wellington Total 1 0 0 0 0
Staff Satisfaction: At least 75% of staff are engaged with the organisation as indicated through the annual Staff
Engagement Survey.
2017-18 2018-19 2019-20 2020-21 2021-22
Staff Satisfaction
Actual SOI
Experience Wellington Total 71% 75% 75% 77% 80%
Our Heritage
Key Result Indicators
Collection Development: Our Heritage Collections contribute to our understanding of Wellington’s identity; its history,
art and creativity which include visitors to some of Wellington’s most important heritage sites (see Visitor Number KRI).
2018-19 2019-20 2020-21 2021-22
Collection Development
SOI
New to the Collection 45 100 200 100
Collection Assessment 1,875 1,000 800 200
Collection Accessibility 7.5% 10% 10% 2%
New to the Collection: Commissions, acquisitions or donations of an item or a collection of items that have been accessioned into the collection.
Collection Assessment: The number of items (individual or type e.g. lifebuoys) that are reviewed for retention or disposal.
Collection Accessibility: The % of the Collection that is on display, on loan, used for research purposes or accessed through other mediums such as
online.
Wellington Museum will be under construction during 2021-22 so there will be less of the collection on public display during this time.
14 Experience Wellington – Statement of Intent 2019-20Council’s Subsidy per Visit
The Council subsidy per physical visitor is calculated first by dividing the number of forecast visits into the operating
grant received from Council (Table 1). Council’s ownership costs such as insurance, maintenance and depreciation are
then added (Table 2) to provide an estimate of the full subsidy per visit. The information regarding ownership costs is
supplied by Council.
Table 1: Operating subsidy per visit
2017-18 2018-19 2019-20 2020-21 2021-22
Subsidy per Visit ($) Actual SOI
$ $ $ $ $
City Gallery Wellington 15.10 12.65 14.96 13.46 14.41
Museums Wellington 4.67 5.00 5.01 6.36 6.41
Capital E 12.22 10.76 23.35 14.54 21.40
Space Place 8.05 9.72 9.48 9.50 9.52
Experience Wellington Total - - 11.24 11.99 13.04
Subsidy per Visit forecast is based on the probable percentage of the operating grant received from Council as follows:
City Gallery Wellington – 30%
Museums Wellington (Wellington Museum, Cable Car Museum and Nairn Street Cottage) – 26%
Capital E – 22%
Space Place – 4.9% plus the cash underwrite
Experience Wellington Executive Office – 17.1%
It is proposed that Wellington Museum Building will be closed for a period of 18 months for earthquake strengthening from 1 July 2020.
Capital E will host the National Arts Festival for Children in 2018-19 and again 2020-21.
Capital E visitation figures from 2019-20 onwards exclude the Hannah Playhouse.
The Experience Wellington Total is a new reporting measure for 2019-20 onwards.
Table 2: Full subsidy per visit inclusive of Council’s ownership costs
2017-18 2018-19 2019-20 2020-21 2021-22
Full Subsidy per Visit ($) Actual SOI
$ $ $ $ $
City Gallery Wellington 15.10 16.05 16.06 16.10 17.05
Museums Wellington 6.91 7.42 7.41 8.78 8.83
Capital E 12.22 14.91 27.50 19.04 25.90
Space Place 14.94 14.22 10.93 10.84 10.75
Experience Wellington Total - - 19.64 20.39 21.44
Council’s estimated ownership costs are supplied by Council.
Capital E will host the National Arts Festival for Children in 2018-19 and again 2020-21.
Capital E visitation figures from 2019-20 onwards exclude the Hannah Playhouse.
The Experience Wellington Total is a new reporting measure for 2019-20 onwards.
Experience Wellington – Statement of Intent 2019-20 15BOARD’S APPROACH TO GOVERNANCE
Governance
Trustees are appointed by Council and are standard-bearers for our vision. They are responsible for setting the strategic
direction and approving the Statement of Intent and the Strategic Plan. The Board monitors organisational performance,
the organisation’s on-going viability and the maintenance of its competitiveness. It delegates the day-to-day operation
to the Chief Executive, who reports to the Board.
The Board meets no fewer than nine times per year and operates three committees which review relevant matters prior
to consideration by the full Board. These are the Audit and Risk (A&R) Committee, the Chief Executive Performance and
Remuneration (CEP&R) Committee, and the People Performance and Safety (PPS) Committee. In addition, the Board
will convene ad hoc working groups to consider specific issues. Guidance in specialist areas is also provided as
appropriate.
Board Committees
Audit and Risk (A&R) Committee assists the Board in carrying out its duties in regard to financial reporting, risk
management and legislative compliance.
Chief Executive Performance and Remuneration (CEP&R) Committee to advise the Chair in connection with the
performance and remuneration of Experience Wellington’s Chief Executive.
People, Performance and Safety (PPS) Committee provides guidance and support to the Chief Executive in a Human
Resources context and assists the Board to meet its due diligence responsibilities regarding Experience Wellington’s
compliance with Health and Safety legislation.
Board Membership
Trustee Term Expires Committees
Jackie Lloyd, Chair 30 June 2020 Chair CEP&R and ex officio of PPS and A&R
A&R and PPS
Diane Calvert 31 October 2019 A&R
Rachel Farrant 30 June 2021 Chair A&R and member of CEP&R
CEP&R
Peter Jackson 31 May 2022 TBC
Peter Johnston 31 May 2022 TBC
Jane Wrightson 31 December 2021 Chair PPS and member of CEP&R
CEP&R
Board Performance
The Board strives to meet best practice governance standards and will undertake an annual review of the overall Board,
individual Trustees and the Chair’s performance and report to the Chief Executive of Council by 30 September 2019.
The Board may appoint a Future Director if the opportunity arises.
16 Experience Wellington – Statement of Intent 2019-20COUNCIL RELATIONSHIP PRINCIPLES
The principles governing the relationship with Council as our primary stakeholder include:
▪ Operating on a “no surprises” basis so that any significant event that may impact on either party is brought to their
attention as soon as it can be reasonably done.
▪ Open and frank communication will occur between Experience Wellington and Council.
▪ Provide advice to Council on the management and development of museums, art galleries, space science and other
relevant services within Wellington.
▪ Full disclosure of information will be provided to Council from Experience Wellington as deemed necessary by
Council to ensure its interests are upheld.
▪ Disclosing within the Experience Wellington’s Strategic Plan any significant transactions that are planned.
Experience Wellington – Statement of Intent 2019-20 17MANAGEMENT, ORGANISATIONAL HEALTH, CAPABILITY AND RISK ASSESSMENT
Management
Experience Wellington provides strategic leadership and centralised management and accountability for visitor
experiences delivered through institutions. Our corporate values: Connected, Quality First, Boldness and Leading are
the quadrants of our balanced scorecard and describe the strategies, performance monitoring and reporting that
together describe how we wish to go about our business and how we measure performance and success. Central to this
is the ability to create and sustain an operating environment that supports the achievement of a high performing
organisation that encourages staff to strive for excellence.
Reporting to the Chief Executive are three Directors who have responsibility for our visitor experience outputs, the
Finance Manager, the Manager People and Capability, the Strategic Fundraising Manager, the Executive Support
Manager and the Buildings Manager/Health and Safety Coordinator. The organisation chart follows:
Director Museums Wellington
Brett Mason
Director City Gallery Wellington
Elizabeth Caldwell
Director Children & Young People
Dr Sarah Rusholme
Finance Manager
James Unwin
Chief Executive
Pat Stuart
Executive Support Manager
Zofia Miliszewska
Manager People & Capability
Michelle Cheriton
Buildings Manager/Health & Safety Coordinator
Simon Jones
Strategic Fundraising Manager
VACANT
Organisational Health and Wellbeing
Critical to achieving our vision and supporting Council’s vision is the talent and experience of our staff.
Staff induction, training, regular communication and celebrations of success reinforce our team spirit. We seek feedback
annually on key factors relating to organisation performance including vision and values, sense of community,
leadership, communication, learning and development, performance and rewards, working relationships and health
and safety. We also have an active Health and Safety Committee.
18 Experience Wellington – Statement of Intent 2019-20Capability
Our commitment to presenting thought-provoking and entertaining visitor experiences relies on our staff who bring to
their work: leadership; strategic thinking; knowledge of heritage collections, art, science and creativity; commitment to
audiences; networks and contacts; and professional standards.
We are a highly motivated organisation and rely on our workforce to be flexible and to go the extra mile. Our Executive
Team is highly experienced in their respective fields.
Training and professional development is a priority and an annual resource is set aside for this purpose.
We are committed to the principle of collaboration and shared services and we are committed to working with Council,
its associated organisations, and sector partners.
Risk Management and Business Continuity
Our Risk Profile is reviewed regularly and identifies events and or circumstances and the impact that these have on our
operation using a system that ranks the probability and level of impact of the event. It includes risk management
strategies such as recovery plans for specific events which carry high risk values.
Our ability to continue to operate following a major event will depend on factors outside of our control such as the
extent of material damage to buildings and the continuation of Council funding.
We acknowledge that under the Health and Safety at Work Act 2015 we share Person Conducting a Business or
Undertaking (PCBU) responsibilities with Council with regard to Council buildings we manage and occupy.
Assessed risks which carry a lower risk value tend to be within our operational purview with the exception of risks
associated with buildings maintenance and plant performance issues which are Council’s responsibility. Building and
plant issues that are likely to impact on business continuity or present a risk to health and safety of workers and visitors
are immediately brought to Council’s attention.
A business continuity plan is in development.
Insurance
We have adequate insurance cover to meet specific business needs and deductibles are in line with generally accepted
risk management principles and affordability.
Experience Wellington – Statement of Intent 2019-20 19APPENDIX 1: FORECAST FINANCIAL STATEMENTS
STATEMENT OF FINANCIAL
PERFORMANCE Budget Budget Budget Budget
Forecast Experience Wellington Total Qtr to Qtr to Qtr to Qtr to Total YE Total YE Total YE
30-Jun-19 ($’000) 30-Sep-19 31-Dec-19 31-Mar-20 30-Jun-20 30-Jun-20 30-Jun-21 30-Jun-22
Revenue
1,905 Trading Income (Net) 284 356 410 367 1,417 1,669 1,332
7,336 Council Operating Grant 1,870 1,871 1,871 1,870 7,482 7,631 7,784
1,769 Council Rental Grant 442 442 442 443 1,769 1,769 1,769
1397 Grants 335 310 277 390 1,312 1,407 1,397
239 Sponsorships and Donations 33 67 62 227 389 382 286
42 Investment Income 15 6 15 6 42 50 55
468 Other Income 41 41 41 215 338 489 499
13,156 Total Revenue 3,020 3,093 3,118 3,518 12,749 13,396 13,122
Expenditure
6,237 Employee Costs 1,560 1,558 1,557 1,558 6,233 6,261 6,379
1,339 Council Rent 335 335 334 335 1,339 1,399 1,399
2,538 Exhibitions & Programmes 667 447 406 695 2,215 2,682 2,337
633 Marketing & Promotions 187 126 123 153 589 635 576
1,255 Occupancy Costs (excluding Council Rent) 297 295 296 299 1,187 1,220 1,225
119 Communication Costs 31 31 31 31 124 112 113
85 Trustee Fees & Expenses 22 21 21 22 86 88 90
159 Technology Costs 37 38 40 43 158 172 164
85 Professional Fees 19 19 20 19 77 80 90
202 Administration Expenses 47 54 50 51 202 208 210
548 Depreciation 138 138 138 136 550 550 550
0 Interest 0 0 0 0 0 0 0
13,200 Total Expenditure 3,340 3,062 3,016 3,342 12,760 13,407 13,133
(44) Net Surplus/(Deficit) before Taxation (320) 31 102 176 (11) (11) (11)
Taxation Expense
(44) Net Surplus/(Deficit) (320) 31 102 176 (11) (11) (11)
(0.33%) Operating Margin (10.60%) 1.00% 3.27% 5.00% (0.09%) (0.08%) (0.09%)
20 Experience Wellington – Statement of Intent 2019-20STATEMENT OF FINANCIAL
PERFORMANCE Budget Budget Budget Budget
Forecast Experience Wellington excl. Space Place Qtr to Qtr to Qtr to Qtr to Total YE Total YE Total YE
30-Jun-19 ($‘000) 30-Sep-19 31-Dec-19 31-Mar-20 30-Jun-20 30-Jun-20 30-Jun-21 30-Jun-22
Revenue
1,409 Trading Income 157 228 282 240 907 1,149 802
6,975 Council Operating Grant 1,778 1,779 1,779 1,778 7,114 7,256 7,401
1,769 Council Rental Grant 442 442 442 443 1,769 1,769 1,769
1,295 Other Grants 308 282 250 362 1,202 1,295 1,283
238 Sponsorships and Donations 33 66 62 227 388 367 267
42 Investment Income 15 6 15 6 42 50 55
294 Other Income 41 41 41 41 164 315 325
12,022 Total Revenue 2,774 2,844 2,871 3,097 11,586 12,200 11,902
Expenditure
5,395 Employee Costs 1,346 1,344 1,343 1,344 5,377 5,388 5,488
1,339 Council Rent 335 335 334 335 1,339 1,399 1,399
2,442 Exhibitions & Programmes 643 422 381 671 2,117 2,568 2,220
541 Marketing & Promotions 164 102 100 129 495 540 480
1,182 Occupancy Costs (excluding Council Rent) 276 274 275 278 1,103 1,146 1,149
109 Communication Costs 28 28 29 29 114 101 101
85 Trustee Fees & Expenses 22 21 21 22 86 88 90
157 Technology Costs 36 38 39 43 156 165 159
85 Professional Fees 19 19 20 19 77 80 90
183 Administration Expenses 42 49 45 47 183 186 187
537 Depreciation 135 135 135 134 539 539 539
0 Interest 0 0 0 0 0 0 0
12,055 Total Expenditure 3,046 2,767 2,722 3,051 11,586 12,200 11,902
(33) Net Surplus/(Deficit) before Taxation (272) 77 149 46 0 0 0
Taxation Expense
(33) Net Surplus/(Deficit) (272) 77 149 46 0 0 0
(0.27%) Operating Margin (9.81%) 2.71% 5.19% 1.49% 0.00% 0.00% 0.00%
Experience Wellington – Statement of Intent 2019-20 21STATEMENT OF FINANCIAL
PERFORMANCE Budget Budget Budget Budget
Forecast Space Place Qtr to Qtr to Qtr to Qtr to Total YE Total YE Total YE
30-Jun-19 ($’000) 30-Sep-19 31-Dec-19 31-Mar-20 30-Jun-20 30-Jun-20 30-Jun-21 30-Jun-22
Revenue
496 Trading Income (Net) 127 128 128 127 510 520 530
361 Council Operating Grant 92 92 92 92 368 375 383
0 Council Rental Grant 0 0 0 0 0 0 0
102 Other Grants 27 28 27 28 110 112 114
1 Sponsorships and Donations 0 1 0 0 1 15 19
0 Investment Income 0 0 0 0 0 0 0
174 Other Income 0 0 0 174 174 174 174
1,134 Total Revenue 246 249 247 421 1,163 1,197 1,220
Expenditure
842 Employee Costs 214 214 214 214 856 873 891
0 Council Rent 0 0 0 0 0 0 0
96 Exhibitions & Programmes 24 25 25 24 98 114 117
92 Marketing & Promotions 23 24 23 24 94 95 96
73 Occupancy Costs (excluding Council Rent) 21 21 21 21 84 74 76
10 Communication Costs 3 3 2 2 10 11 12
0 Trustee Fees & Expenses 0 0 0 0 0 0 0
2 Technology Costs 1 0 1 0 2 7 5
0 Professional Fees 0 0 0 0 0 0 0
19 Administration Expenses 5 5 5 4 19 22 23
11 Depreciation 3 3 3 2 11 11 11
0 Interest 0 0 0 0 0 0 0
1,145 Total Expenditure 294 295 294 291 1,174 1,208 1,231
(11) Net Surplus/(Deficit) before Taxation (48) (46) (47) 130 (11) (11) (11)
Taxation Expense
(11) Net Surplus/(Deficit) (48) (46) (47) 130 (11) (11) (11)
(0.97%) Operating Margin (19.51%) (18.47%) (19.03%) 30.88% (0.95%) (0.93%) (0.94%)
22 Experience Wellington – Statement of Intent 2019-20STATEMENT OF FINANCIAL POSITION Budget Budget Budget Budget
Forecast ($‘000) Qtr to Qtr to Qtr to Qtr to Total YE Total YE Total YE
30-Jun-19 30-Sep-19 31-Dec-19 31-Mar-20 30-Jun-20 30-Jun-20 30-Jun-21 30-Jun-22
Shareholder/Trust Funds
2,123 Share Capital/Settled Funds 2,123 2,123 2,123 2,123 2,123 2,123 2,123
0 Revaluation Reserves 0 0 0 0 0 0 0
478 Restricted Funds 478 478 478 478 478 478 478
1,869 Retained Earnings 1,549 1,580 1,682 1,858 1,858 1,847 1,836
4,470 Total Shareholder/Trust Funds 4,150 4,181 4,283 4,459 4,459 4,448 4,437
Current Assets
40 Cash and Bank 40 40 40 40 40 40 40
600 Accounts Receivable 600 600 600 600 600 600 600
150 Other Current Assets 150 150 150 150 150 150 150
790 Total Current Assets 790 790 790 790 790 790 790
Investments
790 Deposits on Call 3,080 475 2,805 790 790 790 790
0 Other Investments 0 0 0 0 0 0 0
790 Total Investments 3,080 475 2,805 790 790 790 790
Non-Current Assets
4,500 Fixed Assets 4,500 4,500 4,500 4,500 4,500 4,500 4,500
0 Other Non-current Assets 0 0 0 0 0 0 0
4,500 Total Non-current Assets 4,500 4,500 4,500 4,500 4,500 4,500 4,500
6,080 Total Assets 8,370 5,765 8,095 6,080 6,080 6,080 6,080
Current Liabilities
1310 Accounts Payable and Accruals 2320 1254 1912 1321 1321 1,332 1,343
300 Other Current Liabilities 1900 330 1900 300 300 300 300
1,610 Total Current Liabilities 4,220 1,584 3,812 1,621 1,621 1,632 1,643
Non-Current Liabilities
0 Loans - WCC 0 0 0 0 0 0 0
0 Loans - Other 0 0 0 0 0 0 0
0 Other Non-Current Liabilities 0 0 0 0 0 0 0
0 Total Non-Current Liabilities 0 0 0 0 0 0 0
4,470 Net Assets 4,150 4,181 4,283 4,459 4,459 4,448 4,437
0.98 Current Ratio 0.92 0.80 0.94 0.97 0.97 0.98 0.98
0.73 Equity Ratio 0.50 0.73 0.53 0.73 0.73 0.73 0.73
Experience Wellington – Statement of Intent 2019-20 23STATEMENT OF CASH FLOWS Budget Budget Budget Budget
Forecast ($‘000) Qtr to Qtr to Qtr to Qtr to Total YE Total YE Total YE
30-Jun-19 30-Sep-19 31-Dec-19 31-Mar-20 30-Jun-20 30-Jun-20 30-Jun-21 30-Jun-22
Cash provided from:
1,905 Trading Receipts 284 356 410 367 1,417 1,990 1,483
9,105 WCC Grants 4,625 0 4,626 0 9,251 9,400 9,553
1397 Other Grants 335 310 277 390 1,312 1,407 1,397
239 Sponsorships and Donations 33 67 62 227 389 260 285
42 Investment Income 15 6 15 6 42 50 55
468 Other Income 41 41 41 215 338 489 499
13,156 5,333 780 5,431 1,205 12,749 13,597 13,272
Cash applied to:
6,237 Payments to Employees 1,560 1,558 1,557 1,558 6,233 6,361 6,488
6,203 Payments to Suppliers 945 1,779 1,006 1,586 5,316 6,034 5,579
140 Net GST Cash Flow 400 (90) 400 (60) 650 652 655
0 Interest Paid 0 0 0 0 0 0 0
12,580 2,905 3,247 2,963 3,084 12,199 13,047 12,722
576 Total Operating Cash Flow 2,428 (2,467) 2,468 (1,879) 550 550 550
Investing Cash Flow
Cash provided from:
0 Sale of Fixed Assets 0 0 0 0 0 0 0
0 Other 0 0 0 0 0 0 0
Cash applied to: 0
626 Purchase of Fixed Assets 138 138 138 136 550 550 550
0 Other 0 0 0 0 0 0 0
626 138 138 138 136 550 550 550
(626) Total Investing Cash Flow (138) (138) (138) (136) (550) (550) (550)
Financing Cash Flow
Cash provided from:
0 Drawdown of Loans 0 0 0 0 0 0 0
0 Other 0 0 0 0 0 0 0
Cash applied to:
0 Repayment of Loans 0 0 0 0 0 0 0
0 Other 0 0 0
0 0 0 0 0 0 0 0
0 Total Financing Cash Flow 0 0 0 0 0 0 0
(50) Net Increase/(Decrease) in Cash Held 2,290 (2,605) 2,330 (2,015) 0 0 0
880 Opening Cash Equivalents 830 3,120 515 2,845 830 830 830
830 Closing Cash Equivalents 3,120 515 2,845 830 830 830 830
24 Experience Wellington – Statement of Intent 2019-20CASH FLOW RECONCILIATION Budget Budget Budget Budget
Forecast ($’000) Qtr to Qtr to Qtr to Qtr to Total YE Total YE Total YE
30-Jun-19 30-Sep-19 31-Dec-19 31-Mar-20 30-Jun-20 30-Jun-20 30-Jun-21 30-Jun-22
(44) Operating Surplus/(Deficit) for the Year (320) 31 102 176 (11) (11) (12)
Add Non-Cash Items:
548 Depreciation 138 138 138 136 550 550 550
0 Other 0 0 0 0 0 0 0
504 (182) 169 240 312 539 539 538
Movements in Working Capital
41 (Increase)/Decrease in Receivables 0 0 0 0 0 0 0
(Increase)/Decrease in Other Current
(9) 0 0 0 0 0 0 0
Assets
10 Increase/(Decrease) in Accounts Payable 1,010 (1,066) 658 (591) 11 11 12
Increase/(Decrease) in Other Current
30 1,600 (1,570) 1,570 (1,600) 0 0 0
Liabilities
72 2,610 (2,636) 2,228 (2,191) 11 11 12
Net Gain/(Loss) on Sale:
0 Fixed Assets 0 0 0 0 0 0 0
0 Investments 0 0 0 0 0 0 0
576 Net Cash Flow from Operations 2,428 (2,467) 2,468 (1,879) 550 550 550
Experience Wellington – Statement of Intent 2019-20 25APPENDIX 2: ACCOUNTING POLICIES
Significant Accounting Policies
The following accounting policies which have a material effect on the measurement of results have been adopted by
Experience Wellington.
1. Reporting entity
The Wellington Museums Trust Incorporated, trading as Experience Wellington, is registered as a charitable entity under
the Charities Act 2005. It is a Council Controlled Organisation (CCO) in terms of the Local Government Act 2002.
The financial statements of Experience Wellington includes the activities of the following business units - the Wellington
Museums Trust Incorporated, Wellington Museum, City Gallery Wellington, Capital E including Hannah Playhouse, Nairn
Street Cottage, the Wellington Cable Car Museum, and Space Place at Carter Observatory. In the projected period from
2019-20 onwards.
The principal activity of Experience Wellington is to develop and manage Institutions and to operate them for the benefit
of the residents of Wellington and the public generally. For the purposes of financial reporting, Experience Wellington
is a public benefit entity (public sector).
Experience Wellington has no intention of subscribing for, purchasing or otherwise acquiring shares in any other
company or other organisation.
2. Basis of preparation
a) Statement of compliance and basis of preparation
The financial statements have been prepared in accordance with New Zealand Generally Accepted Accounting Practice
(NZGAAP). They comply with Tier 2 PBE Accounting Standards (Public Sector) and disclosure concessions have been
applied.
Experience Wellington has elected to report in accordance with Tier 2 PBE Accounting Standards (Public Sector) on the
basis that it does not have public accountability and has total annual expenses of equal to or less than $30 million.
b) Basis of measurement
The financial statements are prepared on the historical cost basis.
c) Presentation currency
These financial statements are presented in New Zealand dollars ($).
3. Significant accounting policies
The accounting policies set out below will be applied consistently to all periods presented in the financial statements.
a) Property, plant and equipment
Items of property, plant and equipment are stated at cost, less accumulated depreciation and impairment losses.
(i) Subsequent costs
Subsequent costs are added to the carrying amount of an item of property, plant and equipment when that cost is
incurred if it is probable that the future economic benefits embodied with the item will flow to Experience Wellington
and the cost of the item can be measured reliably. All other costs are recognised in surplus/ (deficit) as an expense as
incurred.
26 Experience Wellington – Statement of Intent 2019-20(ii) Depreciation
Depreciation is charged to surplus/ (deficit) using the straight line method. Depreciation is set at rates that will write off
the cost or fair value of the assets, less their estimated residual values, over their useful lives. The estimated useful lives
of major classes of assets and resulting rates are as follows:
▪ Computer equipment 33% SL
▪ Office and equipment 25% SL
▪ Motor vehicles 20% SL
▪ Building Fittings 5%-25% SL
▪ Collections & artefacts Not depreciated
The residual value of assets is reassessed annually.
b) Collections and artefacts
Collections are artefacts that are of cultural or historical importance. A substantial amount of Experience Wellington’s
Collections were acquired on 29 February 1996 from the Wellington Maritime Museum Trust (WMMT) with others
added either as gifts or purchases since 1996. Collections are carried at historic cost as assessed at the time of transfer
from the WMMT. All subsequent acquisitions to the collections are recorded at cost if purchased. Where an asset is
acquired through a non-exchange transaction, its cost is measured at its fair value as at the date of acquisition. Where
the fair value of the assets is not able to be reliably measured, they are recorded at nil. Because the useful life of the
collections is indeterminate they are not depreciated.
An external valuation of the Collections from an independent valuer is obtained on a periodic basis to ensure that the
carrying value of the Collections that are held at cost does not exceed their fair value.
The Trustees obtained a valuation at 30 June 2014 and have confirmed that the carrying value at 30 June 2016 is
appropriate and that no impairment has occurred.
c) Intangible assets
Computer software
Software applications that are acquired by Experience Wellington are stated at cost less accumulated amortisation and
impairment losses.
Amortisation is recognised in surplus/ (deficit) on a straight-line basis over the estimated useful lives of intangible assets,
from the date that they are available for use. The estimated useful lives for the current and comparative periods are as
follows:
▪ Computer software 33% SL
d) Trade and other receivables
Trade and other receivables are measured at their cost less impairment losses.
e) Inventories
Inventories (merchandise) are stated at the lower of cost and net realisable value. Net realisable value is the estimated
selling price in the ordinary course of business, less the estimated costs of completion and selling expenses.
Cost is based on the first-in first-out principle and includes expenditure incurred in acquiring the inventories and bringing
them to their existing location and condition.
f) Cash and cash equivalents
Cash and cash equivalents comprise cash balances and call deposits.
Experience Wellington – Statement of Intent 2019-20 27You can also read