EXPERIENCE WELLINGTON 2018-19 STATEMENT OF INTENT
←
→
Page content transcription
If your browser does not render page correctly, please read the page content below
EXPERIENCE WELLINGTON
    2018-19 STATEMENT OF INTENT
Presented to Wellington City Council pursuant to
    Section 64 of the Local Government Act 2002

Experience Wellington – Statement of Intent 2018-19 1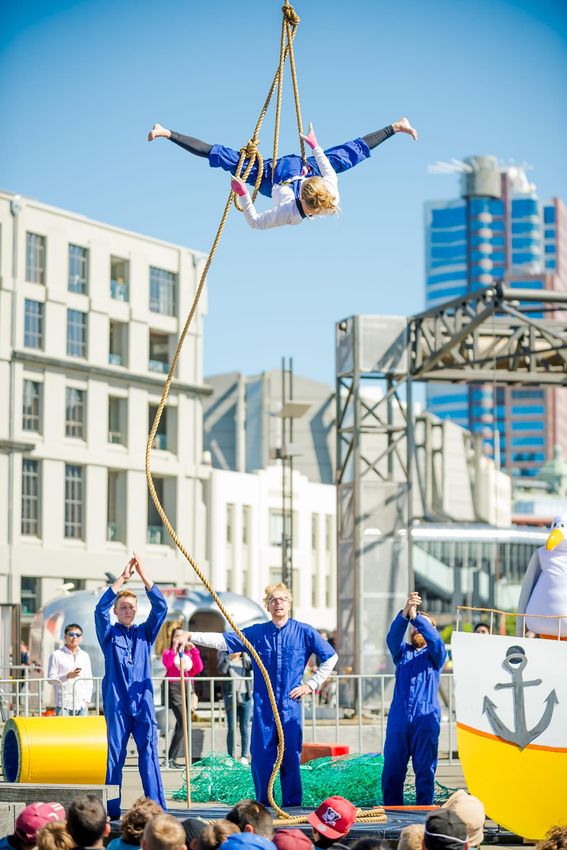
CONTENTS_Toc513732652
EXPERIENCE WELLINGTON’S PURPOSE, VISION AND VALUES ................................................... 2
INTRODUCTION ........................................................................................................................ 3
OVERVIEW ............................................................................................................................... 4
FINANCIAL OVERVIEW .............................................................................................................. 5
PRIORITY PROJECTS AND COUNCIL’S EXPECTATIONS ................................................................ 6
OPERATING ENVIRONMENT UPDATE ....................................................................................... 8
NATURE AND SCOPE OF EXPERIENCE WELLINGTON’S ACTIVITIES ............................................. 9
PERFORMANCE MEASUREMENT ............................................................................................ 10
BOARD’S APPROACH TO GOVERNANCE.................................................................................. 15
COUNCIL RELATIONSHIP PRINCIPLES ...................................................................................... 16
MANAGEMENT, ORGANISATIONAL HEALTH, CAPABILITY AND RISK ASSESSMENT .................. 17
APPENDIX 1: FORECAST FINANCIAL STATEMENTS .................................................................. 19
APPENDIX 2: ACCOUNTING POLICIES...................................................................................... 25
DIRECTORY ............................................................................................................................. 30
EXPERIENCE WELLINGTON’S PURPOSE, VISION AND VALUES
Purpose: Working with and for Wellington to create remarkable art, culture and science experiences that generate
vitality: enriching the city we love.
Vision: Engaged Curious Communities.
Values:
Connected: We work together to deepen our engagement with, and relevance to, the communities we serve.
Quality First: We set ourselves high standards prioritising what will make a real difference to Wellington.
Boldness: We are agile, proactive and use innovation and creativity to achieve the best outcomes for our city.
Leading: We commit to providing an environment in which a high performing organisation culture will flourish.
Cover Image: Makers of Entertainment performing for schools in the 2017 Capital E National Arts Festival. Photo by Stephen A'Court.
2 Experience Wellington – Statement of Intent 2018-19
INTRODUCTION
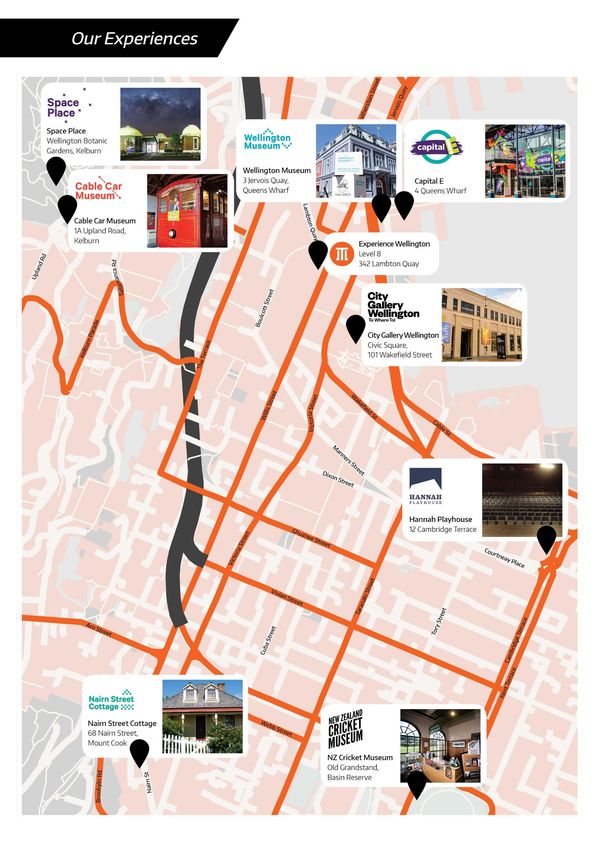
Experience Wellington is made up of Capital E, City Gallery Wellington, Cable Car Museum, Nairn Street Cottage,
Wellington Museum including the Plimmer’s Ark display in the Old Bank Arcade, Space Place at Carter Observatory, the
recovered Plimmer’s Ark timbers in storage and Wellington city’s heritage collections in storage. We also operate the
Hannah Playhouse as part of the Capital E operation on behalf of the Hannah Playhouse Trust (HPT) and Wellington City
Council (Council), and we have a management agreement with the New Zealand Cricket Museum Trust to provide in-
kind support including financial management.
This Statement of Intent (SOI) reflects the relationship and interest that Council has in Experience Wellington as a
Council Controlled Organisation and our contribution to Council’s vision for the future of Wellington. Specifically, it
responds to Council’s expectations as set out in its Letter of Expectations of 15 December 2017 and outlines our strategic
plans and performance targets for the next three years with detailed focus on the financial period to 30 June 2019.
In 2018-19 Council will provide around 64% of our operational budget with the other 36% coming from fundraising and
trading revenues. We have a contract with Creative New Zealand (CNZ) that supports the delivery of the Capital E
National Theatre for Children and the biennial National Arts Festival for Children; the learning experiences we offer are
supported through Ministry of Education (MOE) Learning Experiences Outside the Classroom (LEOTC) contracts and we
regularly receive support from the City Gallery Wellington Foundation for City Gallery’s programme. The HPT supports
the operation of the Hannah Playhouse and the Carter Observatory Trust supports our fundraising activities for Space
Place.
To achieve the best results for Wellington we will continue to work with Council and other Council Controlled
Organisations (Wellington Regional Economic Development Agency (WREDA), Wellington Zoo and Zealandia) other local
visitor experiences, Te Papa, tertiary education partners and relevant national organisations.
Experience Wellington – Statement of Intent 2018-19 3
OVERVIEW
OUR FOCUS IN 2018-19 is to continue to enrich the city we love by telling Wellington’s stories through the city’s amazing
cultural assets and through every exhibition, public event, or children’s live or film production that we produce and
present. We want to play our part in Council’s Decade of Culture strategy and we welcome Council’s commitment to
consider further investment in its cultural assets through the 2018-28 Long-term Plan.
Our contribution to the Decade of Culture will include:
The planning and delivery of a high profile international contemporary art exhibition programme at City Gallery;
Leveraging Capital E’s strong brand through the development of a new creative city hub for children and young
people;
Completing the development of Wellington Museum;
Extending the Cable Car Museum; and
Working with Council on a plan to update the visitor experience at Space Place.
In addition, we will present a full programme of activity which in 2018-19 will include:
Capital E presenting the ninth Capital E National Arts Festival for children and the third Roxy5 Short Film
Competition which is now supported by the Ministry for Youth Development. Capital E will also bring Maker
Faire to Wellington which is an entirely new science fair experience providing hands-on engagement for all
ages.
Wellington Museum and City Gallery will contribute to the Suffragettes anniversary programme marking 125
years since women were first entitled to vote in New Zealand.
We will open the new ground floor experience at the Nairn Street Cottage, and the Space Place programme
will include a new artist-led planetarium project on climate change and Antarctica.
City Gallery’s programme includes the exhibition Palindrome exploring the work of Patrick Pound, an exhibition
entitled The Iconography of Revolt which considers what happens when revolutionary politics and fashion
meet; and a major exhibition of the work of Theo Schoon who plays a key role in contemporary cultural
discourse.
We will continue our commitment to the celebration of Matariki which will include Matariki Dawn and star
gazing at Space Place, the continuation of our partnership with Chamber Music New Zealand at Wellington
Museum and other events aimed at showcasing Wellington during Matariki in June 2019.
OUR PERFORMANCE in the Key Result Indicators (KRI) of visitation and revenue generation will continue to improve
during this planning period which will include many opportunities for Wellington’s curious communities to engage with
our visitor experiences. In 2018-19 we expect to:
Attract over 750,000 (13% increase on our 2017-18 forecast) visitors to our experiences, one-third of which will be
international tourists. In addition, over 300,000 people will connect via our online communities;
Raise over $4 million (Net of costs) (10% increase on our 2017-18 forecast) towards our operating costs from
trading initiatives as well as fundraising. We are forecasting that we will fund at least 36% of our operating revenue
this year; and
Be highly rated by visitors for the quality of their visitor experience at our institutions with a 90% approval rating.
OUR FINANCIAL PERFORMANCE and in particular achieving a break-even budget after fully funding depreciation has
not been possible in the face of significant and on-going cost increases associated with delivering City Gallery's
programme and the 2019 Capital E National Arts Festival for Children. As a result we are projecting a small deficit of
$44,130 in 2018-19 but are forecasting a break-even budget in 2019-20 and 2020-21.
The Financial Overview on page 5 provides more information on our forecast financial position.
4 Experience Wellington – Statement of Intent 2018-19
FINANCIAL OVERVIEW
The main assumptions for the planning period are that:
We will receive $7,336,115 from Council (exclusive of cash underwrites) for the operation of Experience Wellington
inclusive of Space Place representing a 2.759% increase on our base-line funding for 2017-18. The increase is
inclusive of funding decisions in 2015-16 and 2016-17 to enable Experience Wellington to align with Council’s Living
Wage policy.
Our 2018-19 revenue target of just over $4 million net represents an increase of 8.8% on our 2017-18 forecast
revenue reflecting the impact of the 2019 Capital E National Arts Festival and a small increase over the base achieved
in 2016.
We remain committed to achieving a break-even budget after fully funding depreciation. However, we are projecting
a deficit of $44,130 in 2018-19 but returning to break-even in 2019-20 and 2020-21.
We continue to rely on the Council’s cash underwrite for Space Place.
We need to ensure our liquidity and maintain sufficient deposits to cover current obligations over adequately
maintaining our asset base.
Visitor experience projects outside the scope of the current financial forecast such as the proposed City Gallery
Wellington high value international contemporary art exhibition programme will be subject to City Growth Fund
investment and fundraising.
Sponsorships and grants from grant giving agencies are tagged to specific projects (exhibitions, public programmes
or capital developments) and are not available to support fixed costs such as personnel, occupancy and energy
expenses.
The 2019 Capital E National Arts Festival is heavily dependent on fundraising including from the Wellington Regional
Amenities Fund (WRAF) ($100K). Not realising the WRAF funding may result in the cancellation of the Festival.
Over the forecast period it is expected that personnel costs will increase by 2% per annum and other costs by an
average of 2%.
Applying a Living Wage increase that exceeds 2% during the planning period would be subject to additional Council
funding.
Making relativity adjustments to salaries and wages required as a consequence of applying the Living Wage to
eligible salaries and wages would be subject to additional Council funding.
Taking into consideration our typical operating cycle which includes the biennial Capital E National Arts Festival
which will boost revenue in 2018-19, trading revenue is forecast to increase by 4% over the base achieved in 2016-
17.
Creative New Zealand (CNZ) funds for distribution continue to be under pressure; and Ministry of Education (MOE)
contracts are secure but the funding levels continue to be static and increases are not expected.
We will continue to operate Hannah Playhouse on behalf of the HPT and the Council until 30 June 2019. The terms
and conditions of our agreement includes the continuation of the existing lease with HPT with all covenants
continuing to apply except rent and the benefit of a $60,000 per annum Council underwrite of the operating budget.
The Forecast Financial Statements are provided in Appendix 1. Accounting policies are provided in Appendix 2.
Experience Wellington – Statement of Intent 2018-19 5
PRIORITY PROJECTS AND COUNCIL’S EXPECTATIONS
Our year-round delivery of exhibitions, public programmes and events contributes to Wellington’s status as the Culture
Capital of New Zealand and ensures that there is always an art, cultural, science or creative experience to enjoy in
Wellington on every day of the year. This availability also makes them an important part of Wellington’s tourism offering
providing great visitor experiences to people visiting Wellington, many for the first time.
Our 2017-20 Strategic Plan outlines our priorities and why we are focusing on these. Our success will be measured in
terms of the increasing numbers of engaged visitors, who have their curiosity heightened through their encounters with
us on-site or online; our reputation for world leading visitor experiences; the revenue we generate through fundraising
and trading activities; and the social and economic impact we have on Wellington.
The following Priority Projects build on our success and are aligned with Council’s strategic direction as set out in
Wellington Towards 2040: Smart Capital and the 2018-28 LTP consultation document Our 10-Year Plan Tō mātou
mahere ngahuru tau in which it states that “We want Wellington to be the undisputed cultural capital of New Zealand”.
The LTP is prioritising: Resilience and environment, Housing, Transport, Sustainable growth and Arts and culture. We
consider that the priority projects described below are closely aligned with one or more of: Arts and culture; Resilience
and environment; and Sustainable growth.

 Priority Project                           Alignment with Council

 To present high profile, large scale       An important cornerstone for Council’s Decade of Culture which will
 international contemporary art             create economic value for the city and region. It will enhance City
 exhibitions at City Gallery Wellington.    Gallery’s national and international reputation and make Wellington a
                                            destination for contemporary art lovers.
                                            A bid to Council’s City Growth Fund will be made to support this
                                            programme.

 To complete the development of             Cements Wellington Museum’s role within the region as the teller of
 Wellington Museum.                         Wellington’s stories and includes an authentic Māori dimension. It
                                            completes earthquake strengthening making the building safer for staff
                                            and visitors and it will increase the likelihood that this category 1 heritage
                                            building will survive a major earthquake.
                                            Council has proposed a budget of $10 million in the draft LTP to start this
                                            work in 2021-22.

 To increase the size of the Cable Car      More space within the museum, often at capacity during cruise ship
 Museum visitor experience including        season, for retail and exhibitions. It will give greater focus to the science
 an increase in the space for retail.       and technology story of the cable car and the wider Cable Car Precinct
                                            supporting our collaborative precinct project The Look out! Pukehinau.
                                            A business case will be developed for further consideration of this project
                                            by stakeholders and funders. Extending the Cable Car Museum is not a
                                            priority for Council.

 Capital E’s core offerings, how these      It will supercharge Capital E ensuring that it has a fresh, relevant take on
 are delivered and from where within        the challenge of equipping children with creative and critical thinking
 Wellington city.                           skills. It will secure accommodation ideally as part of a wider
                                            development that brings together other cultural assets.
                                            Capital E’s permanent home is subject to agreement on location. In the
                                            meantime the current accommodation will be modified to better meet
                                            Capital E’s operating requirements.

 To ensure that Space Place’s business      Space Place’s operating model review met a 2017-18 SOI commitment.
 model continues to grow visitation         The recommendations include some that will require further investment
 and revenue with a renewed visitor         as well as others which will be relatively straightforward to adopt at no or
 experience that widens the offer to        little additional cost.
 more visitors.                             We will work closely with Council to align visitor experience and financial
                                            expectations.

6 Experience Wellington – Statement of Intent 2018-19
School-age Educational Offerings

We remain committed to our children and young people strategy and our purpose is to make growing up in the Capital
city full of opportunities to play, create and interact, with access to facilities and experiences that are for, by, with and
between children and young people. Our vision is that the children and young people who encounter us feel welcomed,
included and important.

This is extended to our core business of developing and delivering learning programmes which are curriculum linked.
This part of our business is supported by the Ministry of Education’s contestable fund for Learning Experiences Outside
the Classroom (LEOTC). However, the greatest barrier to participation is the cost of travel and having enough adult
volunteers to accompany school groups to Wellington. Our focus on improving access for children from low decile
schools will continue but it is dependent on successful fundraising to fund transport costs for these children.

City Gallery Wellington and the Town Hall Development

The operating challenges that will face City Gallery Wellington as the earthquake strengthening and development of the
Wellington Town Hall gets underway have been scoped and strategies to mitigate the risks to City Gallery’s operation
will be developed in consultation with Council and the Town Hall project team as the timings and nature of the building
programme are finalised. In the meantime it is important that Civic Square continues to be open-for-business and that
Wellingtonians and visitors to the city are kept informed about the project and that signage makes access to City Gallery
clear.

Aligning with Council’s Living Wage Policy

We are committed to aligning with Council’s Living Wage Policy and we implemented the 2017-18 Living Wage
adjustment with the assistance of additional Council funding. We also aligned relativity adjustments with Council’s
Remuneration Policy as it applied to the implementation of the Living Wage. We have assumed a 2% increase in
personnel cost for the planning period.

We will continue to monitor the impact of the Living Wage policy on our overall salaries and wages budget and will keep
Council advised of any financial pressures created as a consequence of our on-going alignment with its Living Wage
Policy.

Governance

The Board aspires to be a leading governance group and is confident that it will comply with Council's expectations
regarding legislative compliance and in particular the Health and Safety at Work Act 2015.

Our legislative compliance schedule is reviewed annually by the Board and our compliance is closely monitored through
a rolling audit programme.

Our health and safety goal is a zero harm culture and our Key Result Indicator is no notifiable incidents, which we
achieved in 2015-16 and 2016-17. We have adopted systems and processes to ensure our Health and Safety compliance
and we work closely with Council to ensure that our approach is consistent with its expectations. This is particularly
relevant in the context of building management where our Health and Safety obligations overlap.

The Sections on the Board’s Approach to Governance (page 14) and Management, Organisational Health, Capability and
Risk Assessment (page 19) cover these expectations in more detail.

                                                                        Experience Wellington – Statement of Intent 2018-19 7
OPERATING ENVIRONMENT UPDATE
We have experienced moderate growth in trading revenue over the past two years largely due to the success of
retail and venue hire and we continue to forecast modest growth.
Changes in the way grant-giving agencies operate and the competition for this source of funding means it cannot
be relied upon to fully support our programming costs.
Corporate sponsorship continues to be difficult to attract and retain.
We have continued our endeavours to increase personal giving with the introduction of online donations and pay-
wave donations as an alternative to cash.
We support the City Gallery Wellington Foundation in its efforts to attract and retain patrons and we will launch a
legacy giving programme this year for supporters interested in making a long-term commitment to our activities.
It is probable that visitation to City Gallery Wellington will be negatively affected by the earthquake strengthening
of the Town Hall and other developments in Civic Square.
With Council's resilience programme in full swing the pressure on performance venues is increasing and is reflected
in increased hire charges for the 2019 Capital E National Arts Festival.
We face increased compliance costs associated with the Health and Safety at Work Act 2015 and the Child
Protection Act 2016.
We continue to strive to be in a position to take advantage of the growth in new technologies in order to optimise
our reach and relevance to the communities we serve.
The opening of Victoria University of Wellington’s new film campus in Miramar and the opening of Te Auaha in the
heart of Wellington boosts Wellington’s attractiveness as a centre of excellence for students wanting to pursue
careers in the creative industries. They also add substance to the city’s creative industries growth agenda, provide
opportunities for partnerships in the development of visitor experiences and audience development and
underscore the value of opportunities we provide through our hands-on creative learning programmes as genuine
pathways to careers in the creativity industries. Capital E, with its connections to the capital’s creative ecosystems,
is particularly well-placed to take advantage of this growth.
The reopening of City Gallery in March 2018 with refurbished entrance and foyer, and the opening of Te Papa’s new
art gallery space have provided a welcome boost to the city’s art lovers again reinforcing Wellington as an important
arts and culture destination.
We are excited by the opportunity that a reconceptualised Civic Square as a cultural hub presents to City Gallery
and potentially Capital E.
We continue to be committed to working with Council to achieve as a child friendly City.
8 Experience Wellington – Statement of Intent 2018-19NATURE AND SCOPE OF EXPERIENCE WELLINGTON’S ACTIVITIES
Experience Wellington’s purpose is working with and for Wellington to create remarkable art, culture and science
experiences that generate vitality: enriching the city we love and with our vision, Engaged Curious Communities
defines our value proposition and how we contribute to Wellington's liveability and prosperity.
C a p i t a l E responds to the need for Wellington and New Zealand to foster confident, creative, capable
citizens who can be architects of their own future.
C i t y G a l l e r y W e l l i n g t o n T e W h a r e T o i leads the conversation about contemporary art in New
Zealand.
W e l l i n g t o n M u s e u m shares the stories and objects of Wellington.
S p a c e P l a c e a t C a r t e r O b s e r v a t o r y T e A r a a W h a n u i K i T e R a n g i transports visitors
from Wellington to outer space.
C a b l e C a r M u s e u m encourages visitors to explore and share the technology, history and experience of
Wellington’s Cable Car.
N a i r n S t r e e t C o t t a g e illustrates the story of Wellington through the Wallis family.
Experience Wellington – Statement of Intent 2018-19 9PERFORMANCE MEASUREMENT
We will continue to refine performance measurement over the planning period to better reflect the needs of
stakeholders for information that helps to assess the contribution or impact Experience Wellington makes to
Wellington’s prosperity and liveability. Any changes will be made in consultation with Council.
Our City
Key Result Indicators
City Residents’ Awareness: The number of Wellingtonians who know about our institutions as assessed through the
Annual Residents’ Survey conducted by Council.
2016-17 2017-18 2018-19 2019-20 2020-21
Residents’ Awareness
Actual SOI
City Gallery Wellington 90% 95% 95% 95% 95%
Wellington Museum 97% 97% 97% 97% 97%
Capital E 87% 90% 90% 90% 90%
Cable Car Museum 94% 97% 97% 97% 97%
Space Place 95% 97% 97% 97% 97%
Nairn Street Cottage 60% 60% 60% 60% 60%
Our Visitors
Key Result Indicators
Physical Visitation: The total number of visits to institutions including general public, education and function attendees.
The annual target is reviewed each year and benchmarked against the average visitation for the institution during the
previous three years.
2016-17 2017-18 2018-19 Q1 Q2 Q3 Q4 2019-20 2020-21
Visitor Numbers
Actual SOI
City Gallery Wellington 180,616 143,000 170,000 45,000 40,000 40,000 45,000 175,000 178,000
Wellington Museum 138,956 137,000 132,000 27,000 35,000 40,000 30,000 135,000 138,000
Capital E 161,869 90,000 157,500 21,600 21,150 56,800 57,950 110,000 160,000
Cable Car Museum 242,250 237,000 237,000 30,500 65,500 90,500 50,500 237,000 237,000
Space Place 54,109 52,000 55,000 12,000 12,000 15,500 15,500 57,000 59,000
Nairn Street Cottage 2,614 2,500 2,000 300 500 750 450 2,000 2,000
Experience Wellington Total 780,414 661,500 753,500 136,400 174,150 243,550 199,400 716,700 774,000
Capital E will host the National Arts Festival for Children in 2018-19 and again 2020-21.
Capital E visitation for 2018-19 includes the Hannah Playhouse.
City Gallery visitation may be affected by earthquake strengthening of the Town Hall.
10 Experience Wellington – Statement of Intent 2018-19Virtual Visitation: The total number of unique user visits to institutional web/mobile sites.
2016-17 2017-18 2018-19 2019-20 2020-21
Virtual Visitor Numbers
Actual SOI
City Gallery Wellington 110,381 112,000 120,000 125,000 127,500
Museums Wellington 99,826 84,000 88,000 96,000 100,000
Capital E 45,619 64,000 45,000 48,000 50,000
Experience Wellington Total 255,826 260,000 253,000 269,000 277,000
Social Media Profile: A snapshot of Facebook friends, Instagram and Twitter followers.
2016-17 2017-18 2018-19 2019-20 2020-21
Social Media Numbers
Actual SOI
City Gallery Wellington 29,825 23,000 26,000 27,000 30,000
Museums Wellington 7,675 14,500 10,000 10,500 11,000
Capital E 5,169 5,000 6,250 6,750 7,250
Space Place 8,603 16,000 11,500 12,000 12,500
Experience Wellington Total 51,271 58,500 53,750 56,250 60,750
First Time Wellington City Visitors (New KRI): The number of visitors who are residents of Wellington visiting for the
first time.
First-time Visitors 2018-19 2019-20 2020-21
City Gallery Wellington 33% 35% 37%
Wellington Museum 80% 80% 80%
Capital E 35% 37% 39%
Cable Car Museum 85% 85% 85%
Space Place 90% 90% 90%
Nain Street Cottage 90% 90% 90%
Quality of Visit: Visitor feedback based on comfort, access, experience, knowledge gained, the friendliness of staff, the
length of visit and overall enjoyment.
2016-17 2017-18 2018-19 2019-20 2020-21
Quality of the Visitor Experience
Actual SOI
City Gallery Wellington 92% 90% 90% 90% 90%
Wellington Museum 92% 90% 90% 90% 90%
Capital E 97% 90% 90% 90% 90%
Cable Car Museum 82% 90% 90% 90% 90%
Space Place 89% 90% 90% 90% 90%
Nairn Street Cottage 97% 90% 90% 90% 90%
Capital E’s Quality of Visit figures includes the Hannah Playhouse in 2018-19.
Experience Wellington – Statement of Intent 2018-19 11Children & Young People Visiting for a Learning Experience: The number of students as part of a booked group visiting
institutions for learning experiences. The delivery of LEOTC is part-funded by the Ministry of Education.
2016-17 2017-18 2018-19 2019-20 2020-21
Learning experience visitors
Actual SOI
City Gallery Wellington 6,106 4,500 4,500 4,500 4,500
Museums Wellington 6,604 7,000 7,000 7,000 7,000
Capital E 64,613 20,500 50,000 20,500 50,000
Space Place 6,040 8,250 8,250 8,250 8,250
Experience Wellington Total 83,365 40,250 69,750 40,250 69,750
Museums Wellington includes the Wellington Museum, Cable Car Museum and Nairn Street Cottage.
Capital E hosted the National Arts Festival for Children in 2016-17 and will do so again in 2018-19 and 2020-21.
Capital E Learning Experience figures includes the Hannah Playhouse in 2018-19.
Our Sustainability
Key Result Indicators
Financial Performance: A break-even budget and fully-funded depreciation.
Non-Council Revenue: The total amount of revenue (net of costs) generated from non-Council sources:
Trading includes admissions, retail, venue hire, sub-letting and interest.
Fundraising includes donations, sponsorships, other grants and cultural grants (CNZ and MOE for LEOTC).
2016-17 2017-18 2018-19 2019-20 2020-21
Trading ($’000) Actual SOI
$000 $000 $000 $000 $000
City Gallery Wellington 492 187 307 320 340
Museums Wellington 866 761 845 885 905
Capital E 483 366 509 380 529
Space Place 524 542 542 570 590
Sub Total 2,365 1,856 2,203 2,155 2,364
Sub-letting, Interest & Other 354 397 275 295 305
Experience Wellington Total 2,719 2,253 2,478 2,450 2,669
2016-17 2017-18 2018-19 2019-20 2020-21
Fundraising ($’000) Actual SOI
$000 $000 $000 $000 $000
City Gallery Wellington 608 387 274 309 359
Museums Wellington 162 138 173 173 180
Capital E 895 763 1,051 780 1,167
Space Place 128 103 103 115 120
Experience Wellington Total 1,793 1,391 1,601 1,377 1,826
City Gallery presented Cindy Sherman in 2016-17 which affected both trading revenue and fundraising.
Museums Wellington includes the Wellington Museum, Cable Car Museum and Nairn Street Cottage.
Capital E will host the National Arts Festival for Children in 2018-19 and will do so again in 2020-21.
Capital E Non-Council Revenue figures in 2018-19 includes the Hannah Playhouse.
12 Experience Wellington – Statement of Intent 2018-19Spend per Visitor: Visitor related revenue (admissions and sales).
2016-17 2017-18 2018-19 2019-20 2020-21
Spend per Visit ($) Actual SOI
$ $ $ $ $
City Gallery Wellington 2.00 1.57 1.80 1.83 1.91
Museums Wellington 2.25 1.41 2.28 3.37 2.40
Capital E 4.03 3.84 3.12 3.29 3.19
Space Place 9.56 10.12 9.85 10.00 10.00
Museums Wellington includes Wellington Museum, Cable Car Museum and Nairn Street Cottage.
Capital E will host the National Arts Festival for Children in 2018-19 and will do so again in 2020-21.
Capital E Non-Council Revenue figures in 2018-19 includes the Hannah Playhouse.
Our People
Key Result Indicators
Health and Safety: No notifiable incidents involving workers or visitors as defined by the Health and Safety at Work
Act 2015.
Staff Satisfaction: At least 75% of staff are engaged with the organisation as indicated through the annual Staff
Engagement Survey.
Our Heritage
Key Result Indicators
Collection Development: Our Heritage Collections contribute to our understanding of Wellington’s identity; its history,
art and creativity which include visitors to some of Wellington’s most important heritage sites (see Visitor Number KRI).
Collection Development 2017-18 2018-19 2019-20 2020-21
New to the Collection 30 45 60 75
Collection Assessment 1,250 1,875 3,650 3,650
Collection Accessibility 5% 7.5% 10% 25%
New to the Collection: Commissions, acquisitions or donations of an item or a collection of items that have been accessioned into the collection.
Collection Assessment: The number of items (individual or type e.g. lifebuoys) that are reviewed for retention or disposal.
Collection Accessibility: The % of the Collection that is on display, on loan, used for research purposes or accessed through other mediums such as
online.
Experience Wellington – Statement of Intent 2018-19 13Council’s Subsidy per Visit
The Council subsidy per physical visitor is calculated first by dividing the number of forecast visits into the operating
grant received from Council (Table 1). Council’s ownership costs such as insurance, maintenance and depreciation are
then added (Table 2) to provide an estimate of the full subsidy per visit. The information regarding ownership costs is
supplied by Council.
Table 1: Operating subsidy per visit
2016-17 2017-18 2018-19 2019-20 2020-21
Subsidy per Visit ($) Actual SOI
$ $ $ $ $
City Gallery Wellington 12.36 12.50 12.65 12.80 13.00
Museums Wellington 4.55 5.18 5.00 4.95 5.32
Capital E 9.32 14.53 10.76 14.61 10.61
Space Place 9.33 9.89 9.72 9.50 9.32
Subsidy per Visit forecast is based on the probable percentage of the operating grant received from Council as follows:
City Gallery Wellington – 30%
Museums Wellington (Wellington Museum, Cable Car Museum and Nairn Street Cottage) – 26%
Capital E (including the Hannah Playhouse) – 22%
Space Place – 4.9% plus the cash underwrite
Experience Wellington Executive Office – 17.1%
Table 2: Full subsidy per visit inclusive of Council’s ownership costs
2017-18 2018-19 2019-20 2020-21
Full Subsidy per Visit ($)
$ $ $ $
City Gallery Wellington 18.01 16.05 16.06 16.10
Museums Wellington 6.97 7.42 7.41 7.84
Capital E 14.53 14.91 14.61 10.61
Space Place 14.30 14.22 13.78 13.61
Council’s estimated ownership costs are supplied by Council.
14 Experience Wellington – Statement of Intent 2018-19BOARD’S APPROACH TO GOVERNANCE
Governance
Trustees are appointed by Council and are standard-bearers for our vision. They are responsible for setting the strategic
direction and approving the Statement of Intent and the Strategic Plan. The Board monitors organisational performance,
the organisation’s on-going viability and the maintenance of its competitiveness. It delegates the day-to-day operation
to the Chief Executive, who reports to the Board.
The Board meets no fewer than nine times per year and operates three committees which review relevant matters prior
to consideration by the full Board. These are the Audit and Risk (A&R) Committee, the Chief Executive Performance and
Remuneration (CEP&R) Committee, and the People Performance and Safety (PPS) Committee. In addition, the Board
will convene ad hoc working groups to consider specific issues. Guidance in specialist areas is also provided as
appropriate.
Board Committees
Audit and Risk (A&R) Committee assists the Board in carrying out its duties in regard to financial reporting, risk
management and legislative compliance.
Chief Executive Performance and Remuneration (CEP&R) Committee to advise the Chair in connection with the
performance and remuneration of Experience Wellington’s Chief Executive.
People, Performance and Safety (PPS) Committee provides guidance and support to the Chief Executive in a Human
Resources context and assists the Board to meet its due diligence responsibilities regarding Experience Wellington’s
compliance with Health and Safety legislation.
Board Membership
Trustee Term Expires Committees
Jackie Lloyd, Chair 30 June 2020 Chair CEP&R and ex officio of PPS and A&R
A&R and PPS
Diane Calvert 31 October 2019 A&R
Rachel Farrant 30 June 2019 Chair A&R and member of CEP&R
CEP&R
Jill Wilson 30 June 2018 PPS
Jane Wrightson 31 December 2018 Chair PPS and member of CEP&R
CEP&R
Board Performance
The Board strives to meet best practice governance standards and will undertake an annual review of the overall Board,
individual Trustees and the Chair’s performance and report to the Chief Executive of Council by 30 September 2018.
Future Director
In consultation with Council the Board appointed a Future Director, John Paul Tocker, for one calendar year commencing
1 January 2018. This position is not a member of the Board and has no voting rights but will observe and participate in
Board discussions.
Experience Wellington – Statement of Intent 2018-19 15COUNCIL RELATIONSHIP PRINCIPLES The principles governing the relationship with Council as our primary stakeholder include: Operating on a “no surprises” basis so that any significant event that may impact on either party is brought to their attention as soon as it can be reasonably done. Open and frank communication will occur between Experience Wellington and Council. Provide advice to Council on the management and development of museums, art galleries, space science and other relevant services within Wellington. Full disclosure of information will be provided to Council from Experience Wellington as deemed necessary by Council to ensure its interests are upheld. Early advice to Council in the event of any situation that may be potentially contentious in nature. Disclosing within the Experience Wellington’s Strategic Plan any significant transactions that are planned. 16 Experience Wellington – Statement of Intent 2018-19
MANAGEMENT, ORGANISATIONAL HEALTH, CAPABILITY AND RISK ASSESSMENT

Management

Experience Wellington provides strategic leadership and centralised management and accountability for visitor
experiences delivered through institutions. Our corporate values: Connected, Quality First, Boldness and Leading are
the quadrants of our balanced scorecard and describe the strategies, performance monitoring and reporting that
together describe how we wish to go about our business and how we measure performance and success. Central to this
is the ability to create and sustain an operating environment that supports the achievement of a high performing
organisation that encourages staff to strive for excellence.

Reporting to the Chief Executive are three Directors who have responsibility for our visitor experience outputs, the
Finance Manager, the Manager People and Capability, the Executive Support Manager and the Buildings
Manager/Health and Safety Coordinator. The organisation chart follows:

                                             Chief Executive
                                                Pat Stuart

                                                                    Director Museums Wellington
                                                                             Brett Mason

                                                                   Director City Gallery Wellington
                                                                          Elizabeth Caldwell

                                                                 Director Children & Young People
                                                                        Dr Sarah Rusholme

                                                                           Finance Manager
                                                                             James Unwin

                                                                   Manager People and Capability
                                                                         Michelle Cheriton

                                                                     Executive Support Manager
                                                                          Zofia Miliszewska

                                                                 Buildings Manager/Health & Safety
                                                                            Coordinator
                                                                            Simon Jones

Organisational Health and Wellbeing

Critical to achieving our vision and supporting Council’s vision is the talent and experience of our staff.

Staff induction, training, regular communication and celebrations of success reinforce our team spirit. We seek feedback
annually on key factors relating to organisation performance including vision and values, sense of community,
leadership, communication, learning and development, performance and rewards, working relationships and health
and safety.

                                                                       Experience Wellington – Statement of Intent 2018-19 17
Capability Our commitment to presenting thought-provoking and entertaining visitor experiences relies on our staff who bring to their work: leadership; strategic thinking; knowledge of heritage collections, art, science and creativity; commitment to audiences; networks and contacts; and professional standards. We are a highly motivated organisation and rely on our workforce to be flexible and to go the extra mile. Our Executive Team is highly experienced in their respective fields. Training and professional development is a priority and a small annual resource is set aside for this purpose. We are committed to the principle of collaboration and shared services and we are committed to working with Council, its associated organisations, and sector partners. Risk Management and Business Continuity Our Risk Profile is reviewed regularly and identifies events and or circumstances and the impact that these have on our operation using a system that ranks the probability and level of impact of the event. It includes risk management strategies such as recovery plans for specific events which carry high risk values. Our ability to continue to operate following a major event will depend on factors outside of our control such as the extent of material damage to buildings and the continuation of Council funding. We acknowledge that under the Health and Safety at Work Act 2015 we share Person Conducting a Business or Undertaking (PCBU) responsibilities with Council with regard to Council buildings we manage and occupy. Assessed risks which carry a lower risk value tend to be within our operational purview with the exception of risks associated with buildings maintenance and plant performance issues which are Council’s responsibility. Building and plant issues that are likely to impact on business continuity or present a risk to health and safety of workers and visitors are immediately brought to Council’s attention. A business continuity plan is in development. Insurance We have adequate insurance cover to meet specific business needs and deductibles are in line with generally accepted risk management principles and affordability. 18 Experience Wellington – Statement of Intent 2018-19
APPENDIX 1: FORECAST FINANCIAL STATEMENTS

                   STATEMENT OF FINANCIAL
 Forecast               PERFORMANCE                     Budget      Budget      Budget      Budget      Total YE     Total YE     Total YE
30-Jun-18             ($‘000) Space Place              30-Sep-18   31-Dec-18   31-Mar-19   30-Jun-19   30-Jun-19    30-Jun-20    30-Jun-21

            Revenue
     496    Trading Income (Net)                            124         124         124          124         496          511          521
     354    Council Operating Grant                           90          90         90           91         361          368          376
        0   Council Rental Grant                               0           0          0            0            0            0              0
     102    Other Grants                                      25          26         25           26         102          104          106
        1   Sponsorships and Donations                         0           1          0            0            1          15           18
        0   Investment Income                                  0           0          0            0            0            0              0
     130    Other Income                                       0           0          0          174         174          174          174
    1083    Total Revenue                                   239         241         239          415        1,134        1,172       1,195

            Expenditure
     776    Employee Costs                                  210         211         210          211         842          859          876
        0   Council Rent                                       0           0          0            0            0            0              0
      96    Exhibitions & Programmes                          24          24         24           24           96          98          100
      93    Marketing & Promotions                            23          23         23           23           92          95           96
      73    Occupancy Costs (excluding Council Rent)          18          18         18           19           73          74           76
      10    Communication Costs                                3           3          2            2           10          10           10
        0   Trustee Fees & Expenses                            0           0          0            0            0            0              0
        5   Technology Costs                                   1           0          1            0            2            5              5
        0   Professional Fees                                  0           0          0            0            0            0              0
      19    Administration Expenses                            5           5          5            4           19          19           20
      11    Depreciation                                       3           3          3            2           11          11           11
        0   Interest                                           0           0          0            0            0            0              0
    1,083   Total Expenditure                               287         287         286          285        1145         1,172       1,195

        0   Net Surplus/(Deficit) before Taxation            -48         -46         -47         130          -11            0              0
            Taxation Expense
        0   Net Surplus/(Deficit)                            -48         -46         -47         130          -11            0              0

   0.00%    Operating Margin                             -20.08%     -19.09%     -19.67%     31.33%       -0.97%        0.02%        0.02%

                                                                                   Experience Wellington – Statement of Intent 2018-19 19
STATEMENT OF FINANCIAL
PERFORMANCE
Forecast ($‘000) Experience Wellington excluding Budget Budget Budget Budget Total YE Total YE Total YE
30-Jun-18 Space Place 30-Sep-18 31-Dec-18 31-Mar-19 30-Jun-19 30-Jun-19 30-Jun-20 30-Jun-21
Revenue
1,250 Trading Income 346 280 484 299 1,409 1,305 1,460
6,768 Council Operating Grant 1,744 1,744 1,744 1,743 6,975 7,153 7,340
1,769 Council Rental Grant 442 442 442 443 1,769 1,769 1,769
943 Other Grants 274 220 361 440 1,295 995 1,291
346 Sponsorships and Donations 31 75 38 94 238 245 267
65 Investment Income 15 6 15 6 42 50 55
391 Other Income 52 49 78 115 294 315 325
11,532 Total Revenue 2,904 2,816 3,162 3,140 12,022 11,832 12,507
Expenditure
5,269 Employee Costs 1,285 1,318 1,371 1,421 5,395 5,503 5,613
1,339 Council Rent 335 335 335 334 1,339 1,399 1,399
1,928 Exhibitions & Programmes 813 459 518 652 2,442 2,027 2,488
538 Marketing & Promotions 145 92 132 172 541 515 575
1,095 Occupancy Costs (excluding Council Rent) 311 289 279 303 1,182 1,206 1,230
113 Communication Costs 27 27 28 27 109 112 114
84 Trustee Fees & Expenses 21 21 21 22 85 88 90
200 Technology Costs 39 40 39 39 157 157 160
214 Professional Fees 21 22 21 21 85 100 110
197 Administration Expenses 46 45 45 47 183 187 190
555 Depreciation 134 135 134 134 537 539 539
0 Interest 0 0 0 0 0 0 0
11,532 Total Expenditure 3,177 2,783 2,923 3,172 12,055 11,832 12,508
0 Net Surplus/(Deficit) before Taxation -273 33 239 -32 -33 0 0
Taxation Expense
0 Net Surplus/(Deficit) -273 33 239 -32 -33 0 0
0.00% Operating Margin -9.40% 1.17% 7.56% -1.02% -0.27% 0.00% 0.00%
20 Experience Wellington – Statement of Intent 2018-19STATEMENT OF FINANCIAL
Forecast PERFORMANCE Budget Budget Budget Budget Total YE Total YE Total YE
30-Jun-18 Total 30-Sep-18 31-Dec-18 31-Mar-19 30-Jun-19 30-Jun-19 30-Jun-20 30-Jun-21
Revenue
1,746 Trading Income (Net) 470 404 608 423 1,905 1,816 1,981
7,122 Council Operating Grant 1,834 1,834 1,834 1,834 7,336 7,521 7,716
1,769 Council Rental Grant 442 442 442 443 1,769 1,769 1,769
1045 Grants 299 246 386 466 1,397 1,099 1,397
347 Sponsorships and Donations 31 76 38 94 239 260 285
65 Investment Income 15 6 15 6 42 50 55
521 Other Income 52 49 78 289 468 489 499
12,615 Total Revenue 3,143 3,057 3,401 3,555 13,156 13,004 13,702
Expenditure
6,045 Employee Costs 1,495 1,529 1,581 1,632 6,237 6,362 6,489
1,339 Council Rent 335 335 335 334 1,339 1,399 1,399
2,024 Exhibitions & Programmes 837 483 542 676 2,538 2,125 2,588
631 Marketing & Promotions 168 115 155 195 633 610 671
1,168 Occupancy Costs (excluding Council Rent) 329 307 297 322 1,255 1,280 1,306
123 Communication Costs 30 30 30 29 119 122 124
84 Trustee Fees & Expenses 21 21 21 22 85 88 90
205 Technology Costs 40 40 40 39 159 162 165
214 Professional Fees 21 22 21 21 85 100 110
216 Administration Expenses 51 50 50 51 202 206 210
566 Depreciation 137 138 137 136 548 550 550
0 Interest 0 0 0 0 0 0 0
12,615 Total Expenditure 3,464 3,070 3,209 3,457 13,200 13,004 13,702
0 Net Surplus/(Deficit) before Taxation -321 -13 192 98 -44 0 0
Taxation Expense
0 Net Surplus/(Deficit) -321 -13 192 98 -44 0 0
0.00% Operating Margin -10.21% -0.43% 5.65% 2.76% -0.33% 0.00% 0.00%
Experience Wellington – Statement of Intent 2018-19 21Forecast STATEMENT OF FINANCIAL POSITION Budget Budget Budget Budget Total YE Total YE Total YE
30-Jun-18 ($‘000) 30-Sep-18 31-Dec-18 31-Mar-19 30-Jun-19 30-Jun-19 30-Jun-20 30-Jun-21
Shareholder/Trust Funds
2,123 Share Capital/Settled Funds 2,123 2,123 2,123 2,123 2,123 2,123 2,123
0 Revaluation Reserves 0 0 0 0 0 0 0
478 Restricted Funds 478 478 478 478 478 478 478
1,913 Retained Earnings 1,592 1,579 1,771 1,869 1,869 1,869 1,869
4,514 Total Shareholder/Trust Funds 4,193 4,180 4,372 4,470 4,470 4,470 4,470
Current Assets
40 Cash and Bank 40 40 40 40 40 40 40
641 Accounts Receivable 600 600 600 600 600 600 600
141 Other Current Assets 150 150 150 150 150 150 150
822 Total Current Assets 790 790 790 790 790 790 790
Investments
840 Deposits on Call 3,080 475 2,805 790 790 790 790
0 Other Investments 0 0 0 0 0 0 0
840 Total Investments 3,080 475 2,805 790 790 790 790
Non-Current Assets
4,422 Fixed Assets 4,500 4,500 4,500 4,500 4,500 4,500 4,500
0 Other Non-current Assets 0 0 0 0 0 0 0
4,422 Total Non-current Assets 4,500 4,500 4,500 4,500 4,500 4,500 4,500
6,084 Total Assets 8,370 5,765 8,095 6,080 6,080 6,080 6,080
Current Liabilities
1300 Accounts Payable and Accruals 2277 1255 1823 1310 1310 1,310 1,309
270 Other Current Liabilities 1900 330 1900 300 300 300 300
1,570 Total Current Liabilities 4,177 1,585 3,723 1,610 1,610 1,610 1,609
Non-Current Liabilities
0 Loans - WCC 0 0 0 0 0 0 0
0 Loans - Other 0 0 0 0 0 0 0
0 Other Non-Current Liabilities 0 0 0 0 0 0 0
0 Total Non-Current Liabilities 0 0 0 0 0 0 0
4,514 Net Assets 4,193 4,180 4,372 4,470 4,470 4,470 4,471
1.07 Current Ratio 0.93 0.80 0.97 0.98 0.98 0.98 0.98
0.77 Equity Ratio 0.50 0.73 0.54 0.74 0.74 0.74 0.74
22 Experience Wellington – Statement of Intent 2018-19Forecast STATEMENT OF CASH FLOWS Budget Budget Budget Budget Total YE Total YE Total YE
30-Jun-18 ($‘000) 30-Sep-18 31-Dec-18 31-Mar-19 30-Jun-19 30-Jun-19 30-Jun-20 30-Jun-21
Cash provided from:
2,330 Trading Receipts 470 404 608 423 1,905 1,816 1,981
8,891 WCC Grants 4,552 0 4,553 0 9,105 9,290 9,485
1045 Other Grants 299 246 386 466 1,397 1,099 1,397
347 Sponsorships and Donations 31 76 38 94 239 260 285
65 Investment Income 15 6 15 6 42 50 55
531 Other Income 52 49 78 289 468 489 499
13,209 5,419 781 5,678 1,278 13,156 13,004 13,702
Cash applied to:
6,045 Payments to Employees 1,495 1,529 1,581 1,632 6,237 6,362 6,489
6,465 Payments to Suppliers 1,319 1,809 1,440 1,635 6,203 5,942 6,503
133 Net GST Cash flow 150 -90 190 -110 140 150 160
0 Interest Paid 0 0 0 0 0 0 0
12,643 2,964 3,248 3,211 3,157 12,580 12,454 13,152
566 Total Operating Cash Flow 2,455 -2,467 2,467 -1,879 576 550 550
Investing Cash Flow
Cash provided from:
0 Sale of Fixed Assets 0 0 0 0 0 0 0
0 Other 0 0 0 0 0 0 0
Cash applied to:
566 Purchase of Fixed Assets 215 138 137 136 626 550 550
0 Other 0 0 0 0 0 0 0
566 215 138 137 136 626 550 550
-566 Total Investing Cash Flow -215 -138 -137 -136 -626 -550 -550
Financing Cash Flow
Cash provided from:
0 Drawdown of Loans 0 0 0 0 0 0 0
0 Other 0 0 0 0 0 0 0
Cash applied to:
0 Repayment of Loans 0 0 0 0 0 0 0
0 Other 0 0 0
0 0 0 0 0 0 0 0
0 Total Financing Cash Flow 0 0 0 0 0 0 0
0 Net Increase/(Decrease) in Cash Held 2,240 -2,605 2,330 -2,015 -50 0 0
880 Opening Cash Equivalents 880 3,120 515 2,845 880 830 830
880 Closing Cash Equivalents 3,120 515 2,845 830 830 830 830
Experience Wellington – Statement of Intent 2018-19 23Forecast CASH FLOW RECONCILIATION Budget Budget Budget Budget Total YE Total YE Total YE
30-Jun-18 30-Sep-18 31-Dec-18 31-Mar-19 30-Jun-19 30-Jun-19 30-Jun-20 30-Jun-21
0 Operating Surplus/(Deficit) for the Year -321 -13 192 98 -44 0 0
Add Non-Cash Items:
566 Depreciation 137 138 137 136 548 550 550
0 Other 0 0 0 0 0 0 0
566 -184 125 329 234 504 550 550
Movements in Working Capital
0 (Increase)/Decrease in Receivables 41 0 0 0 41 0 0
(Increase)/Decrease in Other Current
0 -9 0 0 0 -9 0 0
Assets
0 Increase/(Decrease) in Accounts Payable 977 -1,022 568 -513 10 0 0
Increase/(Decrease) in Other Current
0 1,630 -1,570 1,570 -1,600 30 0 0
Liabilities
0 2,639 -2,592 2,138 -2,113 72 0 0
Net Gain/(Loss) on Sale:
0 Fixed Assets 0 0 0 0 0 0 0
0 Investments 0 0 0 0 0 0 0
566 Net Cash Flow from Operations 2,455 -2,467 2,467 -1,879 576 550 550
24 Experience Wellington – Statement of Intent 2018-19APPENDIX 2: ACCOUNTING POLICIES
Significant Accounting Policies
The following accounting policies which have a material effect on the measurement of results have been adopted by
Experience Wellington.
1. Reporting entity
The Wellington Museums Trust Incorporated, trading as Experience Wellington, is registered as a charitable entity under
the Charities Act 2005. It is a Council Controlled Organisation (CCO) in terms of the Local Government Act 2002.
The financial statements of Experience Wellington includes the activities of the following business units - the Wellington
Museums Trust Incorporated, Wellington Museum, City Gallery Wellington, Capital E including Hannah Playhouse, Nairn
Street Cottage, the Wellington Cable Car Museum, and Space Place at Carter Observatory as from 1 June 2010.
The principal activity of Experience Wellington is to develop and manage Institutions and to operate them for the benefit
of the residents of Wellington and the public generally. For the purposes of financial reporting, Experience Wellington
is a public benefit entity (public sector).
Experience Wellington has no intention of subscribing for, purchasing or otherwise acquiring shares in any other
company or other organisation.
2. Basis of preparation
a) Statement of compliance and basis of preparation
The financial statements have been prepared in accordance with New Zealand Generally Accepted Accounting Practice
(NZGAAP). They comply with Tier 2 PBE Accounting Standards (Public Sector) and disclosure concessions have been
applied.
Experience Wellington has elected to report in accordance with Tier 2 PBE Accounting Standards (Public Sector) on the
basis that it does not have public accountability and has total annual expenses of equal to or less than $30 million.
b) Basis of measurement
The financial statements are prepared on the historical cost basis.
c) Presentation currency
These financial statements are presented in New Zealand dollars ($).
3. Significant accounting policies
The accounting policies set out below will be applied consistently to all periods presented in the financial statements.
a) Property, plant and equipment
Items of property, plant and equipment are stated at cost, less accumulated depreciation and impairment losses.
(i) Subsequent costs
Subsequent costs are added to the carrying amount of an item of property, plant and equipment when that cost is
incurred if it is probable that the future economic benefits embodied with the item will flow to Experience Wellington
and the cost of the item can be measured reliably. All other costs are recognised in surplus/ (deficit) as an expense as
incurred.
Experience Wellington – Statement of Intent 2018-19 25(ii) Depreciation
Depreciation is charged to surplus/ (deficit) using the straight line method. Depreciation is set at rates that will write off
the cost or fair value of the assets, less their estimated residual values, over their useful lives. The estimated useful lives
of major classes of assets and resulting rates are as follows:
Computer equipment 33% SL
Office and equipment 25% SL
Motor vehicles 20% SL
Building Fittings 5%-25% SL
Collections & artefacts Not depreciated
The residual value of assets is reassessed annually.
b) Collections and artefacts
Collections are artefacts that are of cultural or historical importance. A substantial amount of the Experience
Wellington’s Collections were acquired on 29 February 1996 from the Wellington Maritime Museum Trust (WMMT)
with others added either as gifts or purchases since 1996. Collections are carried at historic cost as assessed at the time
of transfer from the WMMT. All subsequent acquisitions to the collections are recorded at cost if purchased. Where an
asset is acquired through a non-exchange transaction, its cost is measured at its fair value as at the date of acquisition.
Where the fair value of the assets is not able to be reliably measured, they are recorded at nil. Because the useful life
of the collections is indeterminate they are not depreciated.
An external valuation of the Collections from an independent valuer is obtained on a periodic basis to ensure that the
carrying value of the Collections that are held at cost does not exceed their fair value.
The Trustees obtained a valuation at 30 June 2014 and have confirmed that the carrying value at 30 June 2016 is
appropriate and that no impairment has occurred.
c) Intangible assets
Computer software
Software applications that are acquired by Experience Wellington are stated at cost less accumulated amortisation and
impairment losses.
Amortisation is recognised in surplus/ (deficit) on a straight-line basis over the estimated useful lives of intangible assets,
from the date that they are available for use. The estimated useful lives for the current and comparative periods are as
follows:
Computer software 33% SL
d) Trade and other receivables
Trade and other receivables are measured at their cost less impairment losses.
e) Inventories
Inventories (merchandise) are stated at the lower of cost and net realisable value. Net realisable value is the estimated
selling price in the ordinary course of business, less the estimated costs of completion and selling expenses.
Cost is based on the first-in first-out principle and includes expenditure incurred in acquiring the inventories and bringing
them to their existing location and condition.
f) Cash and cash equivalents
Cash and cash equivalents comprise cash balances and call deposits.
26 Experience Wellington – Statement of Intent 2018-19g) Impairment
The carrying amounts of Experience Wellington’s assets other than inventories are reviewed at each balance date to
determine whether there is any indication of impairment. If any such indication exists, the assets recoverable amount
is estimated.
An impairment loss is recognised for the amount by which the asset’s carrying amount exceeds its recoverable service
amount. The recoverable service amount is the higher of an asset’s fair value less costs to sell and value in use.
Value in use is determined using an approach based on either a depreciated replacement cost approach, restoration
cost approach, or a service units approach. The most appropriate approach used to measure value in use depends on
the nature of the impairment and availability of information.
If an asset’s carrying amount exceeds its recoverable service amount, the asset is regarded as impaired and the carrying
amount is written-down to the recoverable amount. The total impairment loss is recognised in the surplus or deficit.
The reversal of an impairment loss is also recognised in the surplus or deficit.
h) Employee benefits
Long service leave: Experience Wellington’s net obligation in respect of long service leave is the amount of future
benefit that employees have earned in return for their service in the current and prior periods. The obligation is
calculated using the projected unit credit method and is discounted to its present value. The discount rate is the market
yield on relevant New Zealand government bonds at the Balance Sheet date.
i) Provisions
A provision is recognised when Experience Wellington has a present legal or constructive obligation as a result of a past
event, and it is probable that an outflow of economic benefits will be required to settle the obligation. If the effect is
material, provisions are determined by discounting the expected future cash flows at a pre-tax discount rate that reflects
current market rates and, where appropriate, the risks specific to the liability.
j) Trade and other payables
Trade and other payables are stated at cost.
k) Revenue
(i) Funding
Experience Wellington’s activities are supported by grants, sponsorship, admissions and other trading
activities. Grants received that have an obligation in substance to return the funds if conditions of the grant
are not met are initially recognised as a liability and revenue is recognised only when the services are
performed or conditions are fulfilled.
Funds received that have no such obligation attached and merely a restriction imposed on the use of funds,
are recognised as revenue when they become available.
(ii) Services provided
Revenue from services rendered is recognised in profit or loss in proportion to the stage of completion of the
transaction at the reporting date. Income is recognized as the service is provided (e.g. exhibition run). Where
exhibitions are not scheduled to run until the following fiscal year, revenue is deferred and amortized to income
throughout the period of the exhibition.
(iii) Donations
Cash donations from the community are recognized in the Income Statement at the point at which they are
receipted into Experience Wellington’s bank account.
Experience Wellington – Statement of Intent 2018-19 27You can also read