Māori victimisation in Aotearoa New Zealand - Cycle 1 and 2 (March 2018 - September 2019) - Ministry of Justice
←
→
Page content transcription
If your browser does not render page correctly, please read the page content below
Māori victimisation
in Aotearoa New
Zealand
Cycle 1 and 2 (March 2018 –
September 2019)
Executive summary
Background
Calls for fundamental reform of the criminal justice system in Aotearoa New Zealand have
occurred over many years. In 2018 the Hāpaitia te Oranga Tangata, the Safe and Effective
Justice Programme was initiated to set a new direction for change. In 2019, the Turuki!
Turuki! Move together! report published by Te Uepū Hāpai i te Ora, the Safe and Effective
Justice Advisory Group, established by the Minister of Justice, called for “a fundamental
reshaping of Aotearoa New Zealand’s justice system to one which prevents harm, addresses
its causes, and promotes healing and restoration among individuals and communities.” (p.5).
The report noted, among other things, that “the [justice] system is failing Māori. … We heard
how the enduring effects of colonisation disenfranchise and impoverish Māori communities,
and how Māori experience worse outcomes than other new Zealanders at every stage of the
justice process.” (p.12), and that “We heard numerous examples of institutional racial
discrimination in the justice system, particularly towards Māori and Pacific communities.”
(p13).

Many criticisms of the criminal justice system focus on criminal justice responses to people
who offend and the disproportionately negative affect this has on Māori. However, it has
been known for a long time that Māori are also significantly over-represented among those
who are harmed by crime.

This report takes an in-depth look into Māori victimisation in Aotearoa New Zealand to help
inform the discussions and initiatives around the ongoing reform of the justice system.
Specifically, we look at victimisation within the Māori population during the first two cycles of
the NZCVS (2018/19) to examine the extent and nature of crime experienced, who within
Māori are more likely to be victimised, and what factors protect against victimisation.

Key findings
Note: All demographic findings are in comparison with the Māori population average.

Offences experienced
•   Over one third of Māori adults (38%) were victimised within a 12-month period. This is
    significantly higher than the New Zealand average of 30%.
•   Burglary (16%) and interpersonal violence (12%) are the most common types of offences
    experienced by Māori adults and are more likely to be experienced multiple times. This is
    compared with the New Zealand average of 12% and 7% respectively.

                                                                                                2
Multiple and repeat victimisation
• One fifth of Māori adults (20%) experienced one offence, and 18% of Māori adults
experienced multiple offences. These victims experienced 80% of all offences towards
Māori.
• A small proportion of Māori experience disproportionate amounts of crime against Māori,
with 5% of Māori adults experiencing 81% of all violent interpersonal offences and 56%
of burglaries.
Individual-level factors
• Factors that significantly increased the risk of victimisation for Māori include being
younger (aged 15–29), being bisexual, being in a non-legally recognised partnership1
and having a disability.
• In contrast, factors that significantly decreased the risk of victimisation include being
older (aged 50+) and being in a legally recognised partnership (marriage/civil union/de
facto relationship).
Regional, neighbourhood, household and relational factors
• Māori adults living anywhere in the North Island – apart from the Wellington region –
were less likely to experience personal offences and violent interpersonal offences
compared with Māori living in Wellington or the South Island.
• Māori adults living in rural settlements, couple-only households and low-deprivation
areas were less likely to experience household offences and burglary.
• In contrast, Māori adults living in high-deprivation areas or single-parent, single-person
or multi-family households were more likely to experience household offences and
burglary.
• Māori adults who experienced problems in their neighbourhood such as noisy
neighbours and dangerous driving were significantly more likely to experience crime.
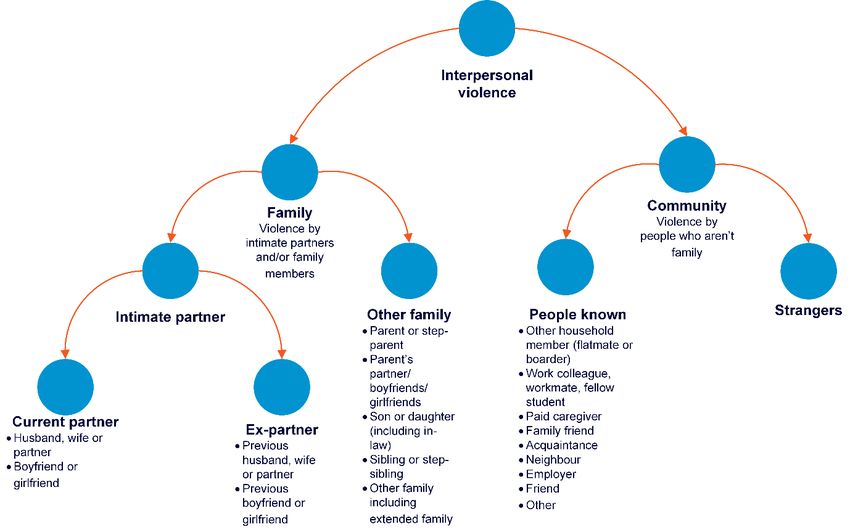
• Māori adults were more likely to experience violent interpersonal offences perpetrated by
non-family members, with roughly half of these non-family members being strangers.
Lifetime experiences of partner and sexual violence
• Thirty-six percent of Māori adults have experienced some form of intimate partner or
sexual violence during their lifetime.
• Factors associated with a higher chance of having experienced intimate partner or
sexual violence include being female, being aged 40–49, identifying as gay/lesbian or
bisexual, being separated or divorced, and living in a single-parent household.
1 Non-legally recognised partnerships are any intimate partnership where the couple are not
married/in a civil union and have not been living together for two years (de facto).
3Economic factors
• Māori adults who are retired, have high household incomes, are not financially stressed
and who own their own homes are significantly less likely to experience violent
interpersonal offences and household offences, specifically burglary.
• In contrast, Māori adults who are unemployed, under financial pressure, and who rent
their accommodation from local or central government are significantly more likely to
experience violent interpersonal offences, and their homes are more likely to be burgled.
Wellbeing factors
• There is a strong association between wellbeing and victimisation for Māori. Māori who
have experienced crime are more likely to suffer from psychological distress, have lower
life satisfaction and feel less safe.
• Māori who had experienced crime were less likely to trust people and were more likely to
expect others to take advantage of them.
Conclusion
Almost all of the factors found to increase or decrease the likelihood of victimisation for
Māori are the same as those found for the general population (see NZCVS Cycle 2 report).
However, the Māori population is overrepresented in many of the high-risk areas for
victimisation and underrepresented in many of the low-risk areas, leaving Māori to bear a
disproportionate level of victimisation overall.
The Turuki! Turuki! Move together! report published in 2019, within the Hāpaitia te Oranga
Tangata programme as well as a range of previously published reports attribute many of the
factors that lead the Māori population to be overrepresented in high-risk areas for
victimisation and underrepresented in many of the low-risk areas to the enduring effects of
colonisation2. Any intervention or response aimed at reducing victimisation for Māori needs
to take structural differences into account and extend beyond the relatively narrow set of
interventions currently available within the criminal justice system to encompass a wider set
of contextual issues. This includes recognising social and economic inequalities, urban/rural
disparities, and structural racism, as well as seeking to understand the issues and identify
solutions within a Māori conceptual framework.
The findings of this report provide one view of Māori victimisation in Aotearoa New Zealand.
However, more work is needed to also bring a specifically te ao Māori perspective to the
research, including kaupapa Māori research to better understand the issues and answer a
range of additional questions raised by this research.
2 See, for example, Jackson, M (1987) A New Perspective – He Whaipaanga Hou. Study Series 18,
Part 1, Department of Justice, Wellington; Maynard, K, Coebergh, B, Anstiss, B, Baker, B, and
Huriwai, T (1999) Ki Te Arotu: Toward a new assessment: The identification of cultural factors which
may predispose Mäori to crime. Social Policy Journal of New Zealand 13: 43–58; Quince, K (2007)
Mäori and the criminal justice system in New Zealand. In Criminal Justice in New Zealand. Tolmie, J
and Brookbanks, W (eds). Wellington: LexisNexis NZ Limited, pp333–358
4Contents
Executive summary ............................................................................................................. 2
List of figures ....................................................................................................................... 7
List of tables ......................................................................................................................... 9
Acknowledgements ........................................................................................................... 10
1 Introduction ................................................................................................................. 11
1.1 Background to this report ..................................................................................... 11
1.2 Why have we written this report? ......................................................................... 12
1.3 What is in the report? ........................................................................................... 13
1.4 Māori involvement in the survey and this report ................................................... 13
2 Offences experienced ................................................................................................. 14
2.1 What are personal and household offences? ....................................................... 14
2.2 Overall ................................................................................................................. 15
2.3 Household offences ............................................................................................. 15
2.4 Personal offences ................................................................................................ 16
2.5 Broad offence types ............................................................................................. 16
3 Multiple and repeat victimisation ............................................................................... 18
3.1 What is multiple and repeat victimisation? ............................................................ 18
3.2 Multiple victimisation ............................................................................................ 18
3.3 Repeat victimisation ............................................................................................. 19
4 Lifetime experiences of intimate partner and sexual violence................................. 21
4.1 How do we measure lifetime intimate partner and sexual violence? ..................... 21
4.2 Overall ................................................................................................................. 21
4.3 Lifetime experience of intimate partner violence ................................................... 22
4.4 Lifetime experience of sexual assault ................................................................... 22
4.5 Demographics ...................................................................................................... 22
5 Who experiences crime? ............................................................................................ 24
5.1 Structure of the Māori population ......................................................................... 24
5.2 A note on the modelling used for the remainder of this report .............................. 24
5.3 Individual-level factors .......................................................................................... 25
5.4 Regional, neighbourhood, household, and relational factors ................................ 31
5.5 Wellbeing factors.................................................................................................. 40
5.6 Economic factors.................................................................................................. 44
6 Conclusions and future research............................................................................... 48
6.1 Summary of findings ............................................................................................ 48
6.2 Directions for future research ............................................................................... 50
Appendix A: Broad offence groupings ............................................................................. 52
Appendix B: Brief report methodology ............................................................................ 53
5B.1 Sample and datasets used ................................................................................... 53
B.2 Māori booster sample and ethnicity selection ....................................................... 53
B.3 Household offences experienced by Māori ........................................................... 54
B.4 Measures of crime used in this report................................................................... 54
B.5 Estimates and statistical significance ................................................................... 54
B.6 Moving towards inferential analysis ...................................................................... 55
Appendix C: What are the strongest correlates or predictors of victimisation? ........... 56
C.1 Understanding multivariate analysis of victimisation ............................................. 56
C.2 Models of Māori victimisation ............................................................................... 57
C.3 What do the models tell us about Māori victimisation? ......................................... 63
Appendix D: Full logistic regression models of Māori victimisation.............................. 65
D.1 Variable selection method .................................................................................... 65
D.2 List of variables included/excluded for each model............................................... 66
6List of figures
Figure 2.1 Percentage of Māori-occupant households victimised and the number of
incidents per 100 households.......................................................................... 15
Figure 2.2 Percentage of Māori adults who experienced personal offences and the number
of incidents experienced per 100 adults .......................................................... 16
Figure 2.3 Percentage of Māori adults victimised and the number of incidents experienced
per 100 adults or per 100 households ............................................................. 17
Figure 3.1 Percentage of Māori adults and the percentage of all incidents towards Māori
experienced, by the number of incidents experienced ..................................... 19
Figure 3.2 Percentage of incidents experienced, by repeat victimisation across broad
offence types .................................................................................................. 19
Figure 3.3 Percentage of Māori adults who experienced repeat offences and the
percentage of offences they experienced, by broad offence types .................. 20
Figure 4.1 Percentage of Māori adults who experienced different forms of intimate partner
or sexual violence during their lifetime, by offence type................................... 22
Figure 4.2 Percentage of Māori adults who experienced sexual violence or partner
violence during their lifetime, by demographic factors ..................................... 23
Figure 5.1 Number of offences per 100 adults or per 100 households by sex .................. 25
Figure 5.2 Percentage of Māori adults who experienced different offence types, by sexual
orientation ....................................................................................................... 26
Figure 5.3 Percentage of Māori adults who identify as bisexual who experienced all
offences, household offences and personal offences ...................................... 27
Figure 5.4 Percentage of Māori adults who experienced any offence, by age group ........ 27
Figure 5.5 Percentage of Māori adults who experienced different offence types, by age
group .............................................................................................................. 28
Figure 5.6 Distribution of Māori and non-Māori populations by age (Census 2018) .......... 29
Figure 5.7 Number of offences per 100 adults or per 100 households, by partnership
status .............................................................................................................. 29
Figure 5.8 Percentage of Māori adults who experienced violent interpersonal offences, by
partnership status ........................................................................................... 30
Figure 5.9 Percentage of Māori adults who experienced any offence, by disability status 31
Figure 5.10 Percentage of Māori adults who experienced one or more violent interpersonal
offences, by region .......................................................................................... 32
Figure 5.11 Percentage of Māori-occupant households that experienced household
offences, by level of urbanisation .................................................................... 33
Figure 5.12 Number of burglary offences per 100 households, by deprivation quintile ....... 34
Figure 5.13 Percentage of Māori-occupant households that experienced household
offences, by household composition ............................................................... 35
Figure 5.14 Percentage of Māori adults or Māori-occupant households that experienced
broad offences, by household composition ..................................................... 35
Figure 5.15 Percentage of Māori adults victimised once or more, by number of children
living in the household..................................................................................... 36
Figure 5.16 Percentage of Māori adults who experienced problems in their neighbourhood,
by level of victimisation ................................................................................... 37
7Figure 5.17 Percentage of Māori adults who experienced different types of neighbourhood
problems, by victimisation ............................................................................... 37
Figure 5.18 Interpersonal violence relationship to offender framework ............................... 38
Figure 5.19 Percentage of Māori adults who experienced violent interpersonal offences
perpetrated by family and non-family members ............................................... 39
Figure 5.20 Percentage of Māori adults who experienced violent interpersonal offences by
family and non-family members, by types of interpersonal violence ................ 39
Figure 5.21 Percentage of Māori adults who experienced crime, by level of psychological
distress ........................................................................................................... 40
Figure 5.22 Percentage of Māori adults who experienced crime, by ratings out of 10 on life
satisfaction (left) and feelings of safety (right) ................................................. 41
Figure 5.23 Percentage of Māori adults who said they felt safe or very safe at home by
themselves at night, by level of victimisation ................................................... 42
Figure 5.24 Percentage of Māori adults who said they felt safe or very safe across different
places at night, by multiple victimisation .......................................................... 42
Figure 5.25 Percentage of Māori adults who said they worry about being a victim of crime a
little or none of the time, by level of victimisation ............................................. 43
Figure 5.26 Percentage of Māori adults who said it would be easy or very easy to talk to
someone if they felt down or depressed, by level of victimisation .................... 43
Figure 5.27 Percentage of Māori adults who said they expect most people to take
advantage of them a little or none of the time (left), and those who said they
have low or very low trust in most people (right), by level of victimisation........ 44
Figure 5.28 Percentage of Māori adults who experienced offences towards their household,
by employment status ..................................................................................... 45
Figure 5.29 Percentage of Māori adults who experienced one or more violent interpersonal
offences, by annual household income ........................................................... 46
Figure 5.30 Percentage of Māori adults who experienced burglary or violent interpersonal
offences, by their level of financial stress ........................................................ 46
Figure 5.31 Percentage of Māori adults who experienced burglary or interpersonal violence
offences, by home ownership status ............................................................... 47
8List of tables
Table A.1 Broad offence groupings ................................................................................. 52
Table C.1 Factors most related to Māori victimisation: All offences (Unspecified model) . 58
Table C.2 Factors most related to Māori victimisation: All offences (Specified model) ..... 59
Table C.3 Factors most related to Māori victimisation: Household offences (Unspecified
model) ............................................................................................................. 59
Table C.4 Factors most related to Māori victimisation: Household offences (Specified
model) ............................................................................................................. 60
Table C.5 Factors most related to Māori victimisation: Personal offences (Unspecified
model) ............................................................................................................. 60
Table C.6 Factors most related to Māori victimisation: Personal offences (Specified model)
....................................................................................................................... 61
Table C.7 Factors most related to Māori victimisation: Burglary (Unspecified model) ...... 61
Table C.8 Factors most related to Māori victimisation: Burglary (Specified model) .......... 62
Table C.9 Factors most related to Māori victimisation: Interpersonal violence (Unspecified
model) ............................................................................................................. 62
Table C.10 Factors most related to Māori victimisation: Interpersonal violence (Specified
model) ............................................................................................................. 62
Table D.1 Factors related to Māori victimisation full model statistics: All offences
(Unspecified model) ........................................................................................ 68
Table D.2 Factors related to Māori victimisation full model statistics: All offences
(Specified model) ............................................................................................ 70
Table D.3 Factors related to Māori victimisation full model statistics: Household offences
(Unspecified model) ........................................................................................ 71
Table D.4 Factors related to Māori victimisation full model statistics: Household offences
(Specified model) ............................................................................................ 73
Table D.5 Factors related to Māori victimisation full model statistics: Personal offences
(Unspecified model) ........................................................................................ 74
Table D.6 Factors related to Māori victimisation full model statistics: Personal offences
(Specified model) ............................................................................................ 75
Table D.7 Factors related to Māori victimisation full model statistics: Burglary offences
(Unspecified model) ........................................................................................ 77
Table D.8 Factors related to Māori victimisation full model statistics: Burglary offences
(Specified model) ............................................................................................ 78
Table D.9 Factors related to Māori victimisation full model statistics: Interpersonal violence
(Unspecified model) ........................................................................................ 80
Table D.10 Factors related to Māori victimisation full model statistics: Interpersonal violence
(Specified model) ............................................................................................ 81
9Acknowledgements
The Ministry of Justice acknowledges and thanks the following people and organisations for
their valuable contribution to the New Zealand Crime and Victims Survey.
Survey participants
First and foremost, we would like to thank the 4,641 Māori respondents who gave their time
to take part in the survey and share their stories. The insights provided in this report would
not be possible without their valuable contributions.
Service provider
We appreciate the work of CBG Health Research Ltd. Their interviewing and data
management services made this survey possible.
Internal and external experts
To produce this report, we consulted with several agencies and subject matter experts in
areas related to Kaupapa Māori and indigenous research, criminology, crime and
victimisation, statistics and the intersection of these subjects. These consultations helped
form the structure of the report which was then drafted and sent back to agencies and
subject matter experts for peer-review. We are grateful for the support, guidance and advice
of all the experts who provided consultation and peer-review for this report.
Specifically, we would like to thank Professor Chris Cunnigham (Te Pūmanawa Hauora,
Massey University), Dr Armon Tamatea (Waikato University), Dr Juan Tauri (Waikato
University), Dr Carwyn Jones (Victoria University) and Len Cook (Statistician). We would
also like to thank Tama Braithwaite-Westoby, Choyce Maere and Dr Isa Ritchie (Te Puni
Kōkiri), Sarah Townsend (Joint Venture Business Unit) and our colleagues Ngāhuia
Foreman and Jenny Oliver (MOJ Māori Engagement Team).
NZCVS Project Team
101 Introduction
This report was written by the New Zealand Crime and Victims Survey (NZCVS) team to
help inform discussions and initiatives around the ongoing reform of the criminal justice
system.
The NZCVS is a nationwide, face-to-face, annual, random-sample survey asking adults
living in private dwellings and aged 15 and over about incidents of crime they experienced in
New Zealand over the previous 12 months. This includes incidents reported to the Police
and unreported incidents. This report focuses mainly on the Māori participants of the survey
to provide a within-Māori analysis. That is, we compare the experiences of Māori who were
victimised with the experiences of Māori who were not victimised, as opposed to
comparisons with non-Māori.
1.1 Background to this report
Calls for fundamental reform of the criminal justice system in Aotearoa New Zealand have
occurred over many years. In 2018, the Hāpaitia te Oranga Tangata, the Safe and Effective
Justice Programme was initiated by Ministers to set a new direction for change. In a fresh
approach to engagement, the public was asked what their experience of the system was,
and how they would like it to change.
Many thousands of New Zealanders contributed to the conversation about what they want
from their criminal justice system. Their views are reflected in the Turuki! Turuki! Move
together! report published by Te Uepū Hāpai i te Ora, the Safe and Effective Justice
Advisory Group, established by the Minister of Justice. The report called for “a fundamental
reshaping of Aotearoa New Zealand’s justice system to one which prevents harm, addresses
its causes, and promotes healing and restoration among individuals and communities.” (p.5).
The report also noted, among other things, that “the [justice] system is failing Māori. … We
heard how the enduring effects of colonisation disenfranchise and impoverish Māori
communities, and how Māori experience worse outcomes than other new Zealanders at
every stage of the justice process.” (p.12), and that “We heard numerous examples of
institutional racial discrimination in the justice system, particularly towards Māori and Pacific
communities.” (p13).
The findings in Turuki! Turuki! Move together! are accompanied by recommendations for
reform, including establishing a Mana Ōrite (equal power) governance model between Māori
and the Crown, making tikanga Māori and te ao Māori values central to the justice system,
and providing better and more diverse support services for people who are victimised (see
the reports here to learn more about the issues and recommendations for reform).
111.2 Why have we written this report?
Many of the criticisms of the criminal justice system raised in the Hāpaitia te Oranga Tangata
reports and previous reports on our criminal justice system focus on responses to people
who offend. They note, for example, that Māori are over-represented in some of our most
negative crime statistics. However, it has been known for a long time that Māori are also
significantly over-represented among those who are harmed by crime. For example, in 2006,
a report written by Cunningham et al on Māori victimisation3 provided statistics that showed
that Māori were more likely than non-Māori to be victimised across all offence types and
were more likely to experience multiple offences. That report also found that victimisation
was more likely for Māori with fewer social and economic resources.
The government has already started to roll out its plan to keep our communities safe through
the Hāpaitia te Oranga Tangata, the Safe and Effective Justice Programme, which is
bringing people together to address the root causes of crime, empower victims, reduce
offending, and reduce the over-representation of Māori in the criminal justice system. This
report provides evidence in support of this plan.
The first two cycles of the NZCVS (Cycle 1 and 2: 2018/2019) have found similar results to
the Cunningham report. Some of the findings are presented in the text box below.
• Māori are significantly more likely to experience crime across all offences,
household offences and personal offences (38% vs. New Zealand average of
30%).
• Māori were almost twice as likely to be victims of interpersonal violence than
the New Zealand average.
• Māori were more likely to be victims of Intimate Partner Violence and/or sexual
violence than the New Zealand average.
• When controlling for both age and the level of deprivation, Māori are 3
percentage points more likely to be victims of crime compared with the New
Zealand average. This difference is not statistically significant. This suggests
that the higher overall rates of victimisation observed for Māori are largely due
to there being higher proportions of young Māori and higher proportions of
Māori in high deprivation areas.
Note. Statistical control is a technique that helps to separate the effect of one or more
particular factors from the remaining factors.
These repeated findings suggest that little progress has been made to address high rates of
Māori victimisation and that this is likely to continue if changes are not made.
3 Cunningham, C, Triggs, S, and Faisandier, S. 2009. Analysis of the Maori experience: Findings
from the New Zealand Crime and Safety Survey 2006. Wellington: New Zealand Ministry of Justice.
12This report has been written to provoke interest in and help illuminate this issue of Māori
victimisation, inform discussion and enable targeted solutions to be identified and
implemented. The statistics may also be used as baselines to assess whether further reform
initiatives are having the desired impact.
1.3 What is in the report?
This report takes a deep look into the Māori population data within the NZCVS to provide a
detailed picture about Māori experiences of crime in Aotearoa New Zealand. It focuses on
the extent and nature of victimisation experienced by Māori and the diversity of victimisation
within the Māori population – it asks which Māori are more or less likely to be victimised?
With the exception of high-level comparisons from previous reports, no comparisons are
made with the average New Zealand experience or the experience of any other ethnic
group.
High-level questions addressed in this report include:
• What is the extent and nature of victimisation for Māori in Aotearoa New Zealand?
• How is victimisation distributed within the Māori population?
• Who within the Māori population is more or less likely to be victimised?
• For Māori, which factors are most predictive of victimisation, and which appear to protect
against victimisation?
1.4 Māori involvement in the survey and this
report
Although Māori were consulted on the development of the NZCVS survey questionnaire both
externally and within the Ministry of Justice, the survey reflects a mainly Eurocentric
worldview and was influenced by similar international surveys in the United States, Australia
and Europe. We intend to enhance future reports on this topic by building on a kaupapa
Māori research model with Māori authors or co-authors in the research design, analysis and
writing to provide a more te ao Māori perspective. More discussion on how we intend to
share our data and research outputs and our intentions for future research are provided in
Section 6.2 of this report.
132 Offences experienced
2.1 What are personal and household
offences?
Personal offences include:
• theft and property damage (personal)
• robbery and assault (except sexual assault)
• fraud and deception
• cybercrime
• sexual assault
• harassment and threatening behaviour.
Household offences include:
• burglary
• theft of/unlawful takes/converts motor vehicle theft from motor vehicle
• unlawful interference/getting into motor vehicle
• damage to motor vehicles
• unlawful takes/converts/interferes with bicycle
• property damage (household)
• theft (except motor vehicles – household)
• trespass.
Summary of findings
Over one third of Māori adults (38%) were victimised within a 12-month period. Twenty-
six percent of Māori have experienced a household offence and 20% a personal
offence. The most common and frequent type of household offence experienced was
burglary. The most common types of personal offences experienced were fraud and
deception, followed by assault and robbery.
Looking at broad offence types, burglary and interpersonal violence are the most
common and are more likely to be experienced multiple times.
142.2 Overall
Thirty-eight percent of Māori experienced a crime within a 12-month period. Altogether,
Māori experienced 529,000 incidents, or 97 incidents per 100 adults.
Twenty-six percent of Māori experienced a household offence and 20% experienced a
personal offence.4 Both types of offence were experienced at similar rates, with 48
household offences occurring per 100 households and 49 personal offences occurring per
100 adults.
2.3 Household offences
Burglary was by far the most common and frequent household offence, with 16% of
households experiencing a burglary and 26 burglary incidents occurring per 100 households.
Household thefts, property damage, trespass and motor vehicle offences were less common
and less frequent household offences, with 1%–3% of Māori experiencing each of these
offences at rates between 1 and 5 per 100 households (see Figure 2.1).
All household offences 48
26%
Burglary 26
16%
Theft (except motor vehicles – household) 5
3%
Property damage (household) 4
3%
Trespass 4
3%
Damage to motor vehicles 3
3%
Theft of/unlawful takes/converts motor vehicle 3
2%
Theft (from motor vehicle) 2
2%
Unlawful interference/getting into motor vehicle 1
1%
Unlawful takes/converts/interferes with bicycle 1
1%
Number of incidents per 100 households % of households victimised
Figure 2.1 Percentage of Māori-occupant households victimised and the number of incidents
per 100 households5
4 Underlying percentages of offences experienced do not sum to the total because some people
experienced both household and personal offences.
5 Bars with the same number may not appear even because the underlying data was not rounded.
152.4 Personal offences
Fraud and deception was the most common personal offence experienced, followed by
assault and robbery. However, those experiencing assault and robbery offences
experienced more incidents. Specifically, 7% of Māori adults experienced a fraud and
deception offence at a rate of 10 per 100 adults, whereas 6% experienced an assault or
robbery at a rate of 12 per 100 adults.
Sexual assaults and harassment offences were relatively less common but were
experienced at relatively high frequencies, with 4% of Māori adults experiencing each of
these offences at rates of 10 per 100 adults (see Figure 2.2).
49
All personal offences
20%
10
Fraud and deception
7%
12
Robbery and assault (except sexual assault)
6%
10
Harassment and threatening behaviour
4%
10
Sexual assault
4%
4
Cybercrime
3%
4
Theft and property damage (personal)
3%
Number of incidents per 100 adults % of Māori adults victimised
Figure 2.2 Percentage of Māori adults who experienced personal offences and the number of
incidents experienced per 100 adults
2.5 Broad offence types
In the NZCVS the same offences described above are grouped into four broad categories
excluding burglary and trespass to aggregate similar but less common offences together.
These broad offence categories are interpersonal violence; fraud and cybercrime; theft and
damage offences; and vehicle offences (see Appendix A for how the offences are grouped).
Looking at the broad offence types displayed in Figure 2.3, burglary followed by
interpersonal violence are the most common types of offence experienced by Māori.
Together, these two offence types account for over half of all incidents experienced by
Māori. Violent interpersonal offences are experienced at a higher rate than any other broad
offence, with a rate of 34 incidents occurring per 100 adults. This suggests that those
experiencing interpersonal violence are more likely to experience multiple events.
1626
Burglary
16%
34
Violent interpersonal offences
12%
13
Fraud and cybercrime
10%
12
Thefts and damage offences
8%
9
All vehicle offences
7%
4
Trespass
3%
Number of incidents per 100 adults or 100 households % of Māori adults victimised
Figure 2.3 Percentage of Māori adults victimised and the number of incidents experienced
per 100 adults or per 100 households
173 Multiple and repeat
victimisation
3.1 What is multiple and repeat victimisation?
Multiple victimisation refers to experiencing any offence more than once within a 12-month
period.
Repeat victimisation refers to experiencing a specific type of offence (eg, burglary) more
than once within 12 months.
Summary of findings
Eighteen percent of Māori adults experienced multiple offences within a 12-month
period, and these victims experienced 80% of all offences towards Māori. A small
proportion (5%) experienced almost half (46%) of all offences towards Māori.
Interpersonal violence is the most repeated type of offence, with 81% of all offences
occurring as part of a chain, with burglary the second most repeated at 56%. Analysis
of repeat victimisation reveals that a small proportion of Māori experience
disproportionate amounts of crime, with 5% of Māori experiencing 81% of violent
interpersonal offences and 56% of burglaries.
3.2 Multiple victimisation
As mentioned above, 38% of Māori adults experienced crime within a 12-month period. Of
them, 20% of Māori adults experienced a single offence within a 12-month period. This
group experienced 20% of all incidents towards Māori.
The remaining 18% of victims experienced more than one offence within a 12-month period
and experienced 80% of all incidents towards Māori.
Five percent of Māori adults experienced five or more offences within a 12-month period.
This group experienced almost half (46%) of all incidents towards Māori (see Figure 3.1).
1846%
% of adults or incidents
20% 20%
15%
11% 9%
8%
4% 5%
2%
One Two Three Four Five or more
Number of incidents experienced
% of Māori adults % of incidents experienced
Figure 3.1 Percentage of Māori adults and the percentage of all incidents towards Māori
experienced, by the number of incidents experienced
3.3 Repeat victimisation
Interpersonal violence is the most repeated broad offence type, with 81% of all interpersonal
violence incidents towards Māori experienced as part of chain of multiple incidents (see
Figure 3.2).
Burglary is the next most repeated offence, with 56% of all burglaries occurring as part of a
chain. In contrast, 72% of all vehicle offences experienced by Māori are one-off events.
81%
72%
64%
60%
% of incidents
56%
49% 51%
44%
40%
36%
28%
19%
Violent Burglary Theft and Fraud and Trespass Vehicle offences
interpersonal offences damage cybercrime offences
offences offences offences
Victimised once Victimised twice or more
Figure 3.2 Percentage of incidents experienced, by repeat victimisation across broad
offence types
19Small proportions of Māori adults experience large proportions of offences. For example, 5%
of Māori adults experience 81% of all violent interpersonal offences towards Māori (see
Figure 3.3). Similarly, 56% of all burglaries experienced by Māori occur within 5% of Māori
households.
Even with less-repeated offences like fraud, there are still 2% of Māori adults who
experience 40% of all fraud and cybercrime offences.
81%
% of adults or incidents
56%
51%
40%
28%
5% 5%
2% 2% 1%
Violent Burglary offences Theft and damage Fraud and Vehicle offences
interpersonal offences cybercrime
offences offences
% of Māori adults who experienced the offence twice or more
% of incidents they experienced
Figure 3.3 Percentage of Māori adults who experienced repeat offences and the percentage
of offences they experienced, by broad offence types
204 Lifetime experiences of
intimate partner and
sexual violence
4.1 How do we measure lifetime intimate
partner and sexual violence?
The NZCVS asked whether someone had ever experienced intimate partner violence and/or
sexual violence at some point during their lives (lifetime prevalence).6 With sensitive
questions like these, survey respondents may not want to admit that an incident has taken
place, even though they enter their own responses to the questions confidentially. They may
choose to put “don’t know” or “don’t wish to answer” as their responses. As such, we have
included people who said “yes”, “don’t know” and “don’t wish to answer” in these estimates.
Summary of findings
Thirty-six percent of Māori adults have experienced some form of intimate partner or
sexual violence during their lifetime. Twenty-three percent have experienced intimate
partner violence, and 30% have experienced sexual violence.
Factors associated with include being female (50%), being aged 40–49 (46%),
identifying as gay/lesbian or bisexual (64%), being separated or divorced (50%), and
living in a single-parent household (54%).
4.2 Overall
Thirty-six percent of Māori experienced some form of intimate partner or sexual violence
during their lifetime7 (see Figure 4.1).
6 The intimate partner violence question was only for those who have ever had a partner. The
questionnaire did not explicitly ask about either current partners or ex-partners at the time of the
incident.
7 Underlying percentages of intimate partner or sexual violence will not sum to the total because
some people experience both types of offence.
21Any intimate partner or sexual violence 36%
Any sexual violence 30%
Non-consensual sexual touches 29%
Any intimate partner violence 23%
Forced intercourse 20%
Deliberately used force or violence 20%
Threat to use force or violence 19%
% of Māori adults victimised once or more during their lifetime
Figure 4.1 Percentage of Māori adults who experienced different forms of intimate partner or
sexual violence during their lifetime, by offence type
4.3 Lifetime experience of intimate partner
violence
Twenty-three percent of Māori adults experienced intimate partner violence during their
lifetime, with 20% experiencing a deliberate use of force or violence and 19% experiencing a
threat to use force or violence.
4.4 Lifetime experience of sexual assault
Thirty percent of Māori adults experienced sexual assault during their lifetime, with 20%
experiencing forced intercourse and 30% experiencing non-consensual sexual touches.
4.5 Demographics
Factors associated with a higher chance of having experienced intimate partner or sexual
violence include being female (49%), being aged 40–49 (46%), identifying as gay/lesbian or
bisexual (64%), being separated or divorced (50%), or living in a single-parent household
(54%) (see Figure 4.2).
Māori who present with higher levels of psychological distress, lower life satisfaction and
lower feelings of safety are also more likely to have experienced intimate partner or sexual
violence during their lifetime.
22Māori
Average 36%
Gay/lesbian, bisexual or other 64%
Demographic factor
Household compostion: One parent with child(ren) 54%
Separated/dissolved (divorced) 50%
Female 49%
Aged 40–49 years 46%
High level of psychological distress 69%
Wellbeing factor
Moderate level of psychological distress 58%
Feeling of safety: 0 to 6 (least safe) 52%
Life satisfaction: 0 to 6 (least satisfied) 44%
Employment status: Home or caring duties 48%
% of Māori adults who experienced sexual violence or partner violence
during their lifetime
Figure 4.2 Percentage of Māori adults who experienced sexual violence or partner violence
during their lifetime, by demographic factors
Colour coding in graphs showing statistical significance
This report contains a large number of graphs to visualise key findings. In some graphs
in which significance testing relative to the Māori average was carried out, the following
colour scheme is used to highlight statistical significance.
Māori average
No statistically significant difference from the Māori average
(at 95% confidence level)
Statistically significant difference from the Māori average
(at 95% confidence level)
Note: Statistical testing is based on overlapping confidence intervals and not formal tests, as described in
Section B.5.
235 Who experiences crime?
5.1 Structure of the Māori population
The rest of this report looks at how victimisation is related to diversity within the Māori
population or, more specifically, how demographic and socioeconomic factors increase or
decrease the risk of victimisation for Māori. When interpreting these results, it is important to
understand that the Māori population does not mirror the non-Māori population on key
demographic and socioeconomic factors. For example, younger people are more likely to
experience crime, but the Māori population is on average younger than the non-Māori
population, meaning the impact of higher victimisation for young people is greater for Māori
than non-Māori. Some of these populations’ features will be discussed below to add more
context to the results.
To consider differences in the structure of Māori population we used statistical control.
Statistical control is a technique that helps to separate the effect of one or more particular
factors from the remaining factors. In our analysis we attempted to look at Māori data
while considering differences between ethnic groups in average age and economic
position described by NZDep2013 (see p.33).
When controlling for both age and the level of deprivation, Māori are 3 percentage points
more likely to be victims of crime compared with the New Zealand average. This
difference is not statistically significant. This suggests that the higher overall rates of
victimisation observed for Māori are largely due to there being higher proportions of
young Māori and higher proportions of Māori in high deprivation areas.
5.2 A note on the modelling used for the
remainder of this report
For the rest of the report, we will combine the results of our usual one-way or one-
dimensional analyses with some results that we obtained from multivariate modelling. That
is, we look at the relationship between victimisation and individual demographic or
socioeconomic factors alone and then looked at these relationships while controlling for the
influence of other factors. For example, we look at the relationship between age and
victimisation and then look at this relationship when accounting for the influence of factors
like sex, employment and deprivation. These results are described in a simplified way below,
but the full details of our modelling and results are provided in Appendix C and Appendix D
for those interested in our approach.
245.3 Individual-level factors
Summary of findings
Although the proportion of male and female Māori who were victimised is similar, female
Māori experience a higher number of offences. Age is one of the strongest indicators of
victimisation for Māori, with those aged 15–29 at the highest risk of victimisation and
those aged 50+ at the lowest risk. Māori who identify as bisexual were significantly more
likely to experience personal offences. Māori adults in legally recognised partnerships
(marriage/civil union/de facto relationship) were significantly less likely to experience
violent interpersonal offences, and those who were victimised experienced fewer
household and personal offences. In contrast, those in non-legally recognised
partnerships were more likely to experience interpersonal violence. Adjusting for age,
Māori adults with a disability were significantly more likely to be victimised.
Sex
Unlike the findings for lifetime experiences described above, over a 12-month period similar
proportions of male and female Māori experienced any offence, any personal offence, any
household offence and any broad offence type, including interpersonal violence.8 Sex also
did not arise as a contributing factor to the risk of victimisation across any of these offence
types when controlling for other demographic factors using modelling (see Appendix C).
Despite the proportion of males and females who were victimised being similar, females who
were victimised experienced a higher rate (or frequency) of personal and household
incidence (see Figure 5.1). This pattern was strongest for violent interpersonal offences,
where females experienced almost double the rate of violent offences compared to males
(42 per 100 adults vs 26 per 100 adults).
56 54
Number of offences per
100 adults or per 100
42 41
households
Personal offences Household offences
Male Female
Figure 5.1 Number of offences per 100 adults or per 100 households by sex
8 Though stronger patterns do begin to emerge when looking at offences within interpersonal violence
or violence by family members.
25Sexual orientation
Trends indicate that Māori who identify themselves as gay/lesbian or bisexual are more likely
to experience crime – specifically, personal offences and interpersonal violence (see Figure
5.29). However, due to limited sample size these estimates are not statistically significant.
All offences 38%
45%
Household offences 26%
28%
Personal offences 20%
28%
Interpersonal violence 12%
20%
Burglary 16%
18%
Fraud and cybercrime 10%
12%
Māori average Gay/lesbian, bisexual or other
Figure 5.2 Percentage of Māori adults who experienced different offence types, by sexual
orientation
Māori who identify as bisexual are significantly more likely to experience personal offences
(see Figure 5.310). Bisexuality also remains one of the strongest predictors of experiencing a
personal offence when controlling for a range of other demographic and socioeconomic
factors like age, sex and employment status (see Table C.6 in Appendix C)
9 From Figure 5.2 onwards, some bars within graphs will display confidence intervals to show the
amount of variance present around prevalence rate estimates. Confidence intervals can also be
used to help detect statistically significant differences by identifying whether the confidence intervals
of comparable estimates do not overlap.
10 When figures are two dimensional (eg, multiple groups by multiple outcomes) we cannot always
use orange to denote significance, meaning differences may only be observed using confidence
intervals.
2638%
All offences
46%
26%
Household offences
25%
20%
Personal offences
37%
Māori average Bisexual
Figure 5.3 Percentage of Māori adults who identify as bisexual who experienced all offences,
household offences and personal offences
Age
Across our analyses, age was one of the best indicators for identifying who was and was not
victimised within Māori. On the high level, the likelihood of any victimisation for Māori is at its
peak for those aged 15–29 (41%–45% prevalence rate). By the age of 50 this prevalence
rate drops quite substantially to around 34%, and past the age of 65 it almost halves at 24%
(see Figure 5.4).
Māori average 38%
15–19 years 41%
20–29 years 45%
30–39 years 38%
40–49 years 43%
50–59 years 34%
60–64 years 34%
65 years and over 24%
% of Māori adults victimised once or more
Figure 5.4 Percentage of Māori adults who experienced any offence, by age group
This pattern found for age is consistent across different offence types, with Māori adults
aged 50+ significantly less likely to be victimised across all offences, personal offences,
household offences, violent interpersonal offences and vehicle offences. Māori aged 15–29
27trend towards higher likelihoods of victimisation across all offence types and are significantly
more likely to experience violent interpersonal offences and vehicle offences. The contrast in
victimisation between younger and older Māori was greatest for violent interpersonal
offences, where 19% of those aged 15–29 experienced a violent interpersonal offence
compared to only 4% of those aged 50+ (see Figure 5.5).
38%
All 44%
30%
All offences
26%
Household 30%
22%
20%
Personal 26%
13%
Broad offence types
12%
Violent interpersonal 19%
4%
7%
Vehicle 11%
5%
% of Māori adults victimised once or more
Māori average 15–29 years 50+ years
Figure 5.5 Percentage of Māori adults who experienced different offence types, by age group
Controlling for the influence of other demographic and socioeconomic factors in our
modelling analyses, age consistently remained a strong indicator of victimisation across all
offence types, but especially with regard to personal offences and violent interpersonal
offences. That is, controlling for other factors, being aged 15–29 was the strongest predictor
for experiencing a personal or violent interpersonal offence for Māori. Furthermore, Māori
aged 30–49 were also among the highest risk groups for experiencing personal and violent
interpersonal offences (see Table C.5, Table C.6, Table C.9 and Table C.10 in Appendix C).
Victimisation and age structure of the Māori population
The relationship found between victimisation and age in our analysis is similar to that found
for the general population in Cycle 1 and 2 of the NZCVS but is particularly relevant for
Māori because the Māori population is more youthful than the non-Māori population (see
Figure 5.6). This means that Māori are disproportionately affected by the impacts of age
because there are higher proportions of younger Māori, who experience higher rates of
victimisation, and lower proportions of older Māori, who experience lower rates of
victimisation.
28You can also read