Application of a modified Inception-v3 model in the dynasty-based classification of ancient murals
←
→
Page content transcription
If your browser does not render page correctly, please read the page content below
Cao et al. EURASIP Journal on Advances in Signal Processing           (2021) 2021:49
https://doi.org/10.1186/s13634-021-00740-8
                                                                                                            EURASIP Journal on Advances
                                                                                                                     in Signal Processing

 RESEARCH                                                                                                                                      Open Access

Application of a modified Inception-v3
model in the dynasty-based classification of
ancient murals
Jianfang Cao1,2* , Minmin Yan2, Yiming Jia2, Xiaodong Tian2 and Zibang Zhang2

* Correspondence: caojianfangcn@
163.com                                Abstract
1
 Department of Computer Science
& Technology, Xinzhou Teachers         It is difficult to identify the historical period in which some ancient murals were created
University, No. 10 Heping West         because of damage due to artificial and/or natural factors; similarities in content, style,
Street, Xinzhou 034000, China          and color among murals; low image resolution; and other reasons. This study proposed
2
 School of Computer Science &
Technology, Taiyuan University of      a transfer learning-fused Inception-v3 model for dynasty-based classification. First, the
Science and Technology, Taiyuan        model adopted Inception-v3 with frozen fully connected and softmax layers for
030024, China                          pretraining over ImageNet. Second, the model fused Inception-v3 with transfer learning
                                       for parameter readjustment over small datasets. Third, the corresponding bottleneck
                                       files of the mural images were generated, and the deep-level features of the images
                                       were extracted. Fourth, the cross-entropy loss function was employed to calculate the
                                       loss value at each step of the training, and an algorithm for the adaptive learning rate
                                       on the stochastic gradient descent was applied to unify the learning rate. Finally, the
                                       updated softmax classifier was utilized for the dynasty-based classification of the
                                       images. On the constructed small datasets, the accuracy rate, recall rate, and F1 value of
                                       the proposed model were 88.4%, 88.36%, and 88.32%, respectively, which exhibited
                                       noticeable increases compared with those of typical deep learning models and
                                       modified convolutional neural networks. Comparisons of the classification outcomes for
                                       the mural dataset with those for other painting datasets and natural image datasets
                                       showed that the proposed model achieved stable classification outcomes with a
                                       powerful generalization capacity. The training time of the proposed model was only 0.7
                                       s, and overfitting seldom occurred.
                                       Keywords: Mural classification, Dynasty identification, Transfer learning, Inception-v3
                                       model

                                     1 Introduction
                                     Murals are one of the most ancient painting forms in human history and are referred
                                     to as “the art on the wall.” Ancient murals are important cultural legacies and have sig-
                                     nificant research value for cultural heritage conservation [1]. China is a country with a
                                     long history; a large number of Chinese murals have been preserved, which provides
                                     rich resources for mural research. Ancient Chinese murals have undergone numerous
                                     historical periods. Based on the time when the murals were created, six historical pe-
                                     riods can be identified, i.e., Stone Age, Qin/Han dynasties, Wei/Jin dynasties, Sui/Tang
                                    © The Author(s). 2021 Open Access This article is licensed under a Creative Commons Attribution 4.0 International License, which
                                    permits use, sharing, adaptation, distribution and reproduction in any medium or format, as long as you give appropriate credit to the
                                    original author(s) and the source, provide a link to the Creative Commons licence, and indicate if changes were made. The images or
                                    other third party material in this article are included in the article's Creative Commons licence, unless indicated otherwise in a credit
                                    line to the material. If material is not included in the article's Creative Commons licence and your intended use is not permitted by
                                    statutory regulation or exceeds the permitted use, you will need to obtain permission directly from the copyright holder. To view a
                                    copy of this licence, visit http://creativecommons.org/licenses/by/4.0/.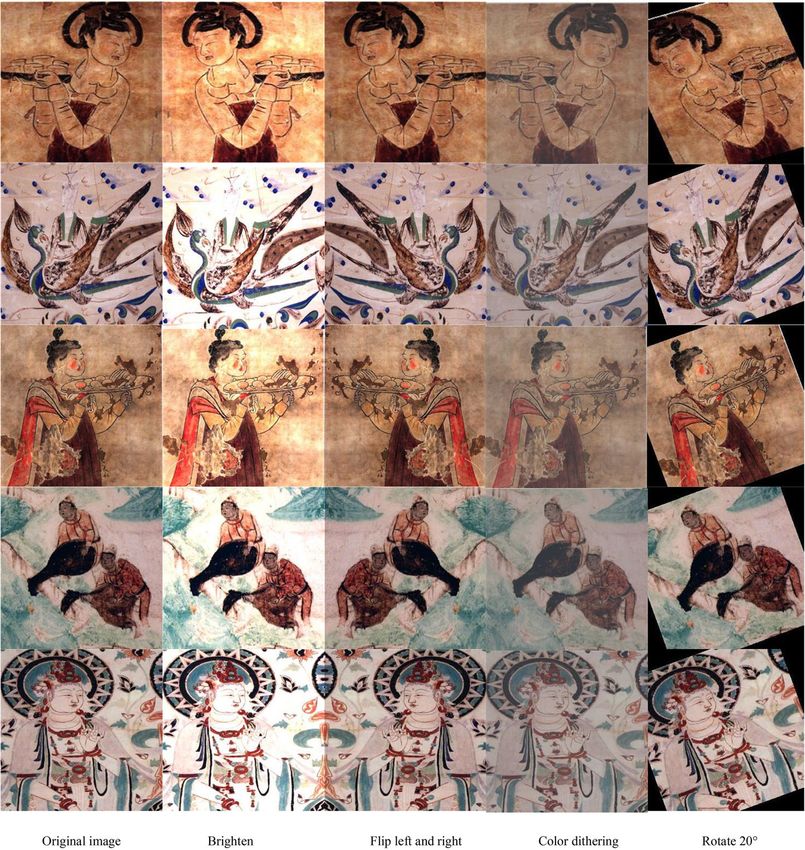
Cao et al. EURASIP Journal on Advances in Signal Processing   (2021) 2021:49                                    Page 2 of 25

                  dynasties, Song/Jin dynasties, and Ming/Qing dynasties. Traditionally, mural dynasty
                  classification is performed using a visual method in combination with preserved docu-
                  ments. However, due to the age of some murals, the similarities in content among mu-
                  rals and/or severe damage, dynasty recognition for some murals cannot be completed,
                  and therefore, more rapid and scientific dynasty classification methods for ancient mu-
                  rals are needed.
                     Digital protection and restoration and structural reconstruction are helpful tools for
                  the permanent preservation of mural information [2]. They allow infinite replications
                  of an image and realize its virtual exhibition by constructing a high-quality, original,
                  and complete data file for future generations to appreciate. Awareness of the dynasty
                  when a mural was created helps visitors better understand the hidden culture of the
                  mural. In 2003, Pan et al. [3] proposed a set of intelligent techniques and realized the
                  digital repair of murals. Yuan et al. [4] used the nearest neighbor method for digital re-
                  pair of ancient paintings with tearing and shedding. Wang et al. [5] explored the tex-
                  ture and structure of Dunhuang murals using the sparse modeling method. The
                  methods applied in these studies have significance in researching the dynasty classifica-
                  tion of ancient murals.
                     From text-based image retrieval to content-based image retrieval, the analysis of
                  image features, such as texture and color, has a crucial role in image retrieval and clas-
                  sification. Among various methods for content-based image retrieval, Zhang et al. [6]
                  proposed an algorithm in which tree-structured data are transformed into a vectorial
                  representation. According to this algorithm, a Tree2Vector framework is proposed: a
                  two-level tree is constructed to extract both the overall features and local features of an
                  image, which are then transformed into vectorial representations and coded for image
                  retrieval. Their results showed the efficacy of the proposed method. To date, numerous
                  studies of mural classification based on traditional methods, such as feature extraction
                  and classifier-based classification, have been reported. Tang et al. [7] proposed a group-
                  ing multi-instance learning method for optimizing the latent support vector machine
                  (SVM) model, targeting the issues of the intraclass difference between mural images
                  and the noise contained in the images. Based on the composition and features of an-
                  cient murals, Wang et al. [8] proposed a model in which the relevance between the
                  composition of an ancient mural and its semantics was integrated. Tang et al. [9] uti-
                  lized extracted contour features to measure the similarity degree between two mural
                  images. Although traditional methods can realize the extraction of certain features from
                  murals, they suffer from insufficient generalization capacities in terms of feature extrac-
                  tion and classification outcomes due to the diverse content of murals. Wang et al. [10]
                  proposed a new convolutional neural network (CNN) for classifying multispectral im-
                  ages, which reduced the influence of calculation errors on the precision of mural pig-
                  ment recognition. With the continuous development of technology for mural
                  digitalization and image data classification, scholars have proposed various strategies
                  for mural classification. Sun [11] investigated the visual features and perception of the
                  Taoist murals in the Ming/Qing dynasties located in northern Shananxi, based on
                  which he classified the image data of the murals into the categories of correlated im-
                  ages, reference images, and associated images. Hao [12] employed the target detection
                  method to position the image characters of the investigated murals according to the
                  special artistic styles of character mural images created in different historical periods;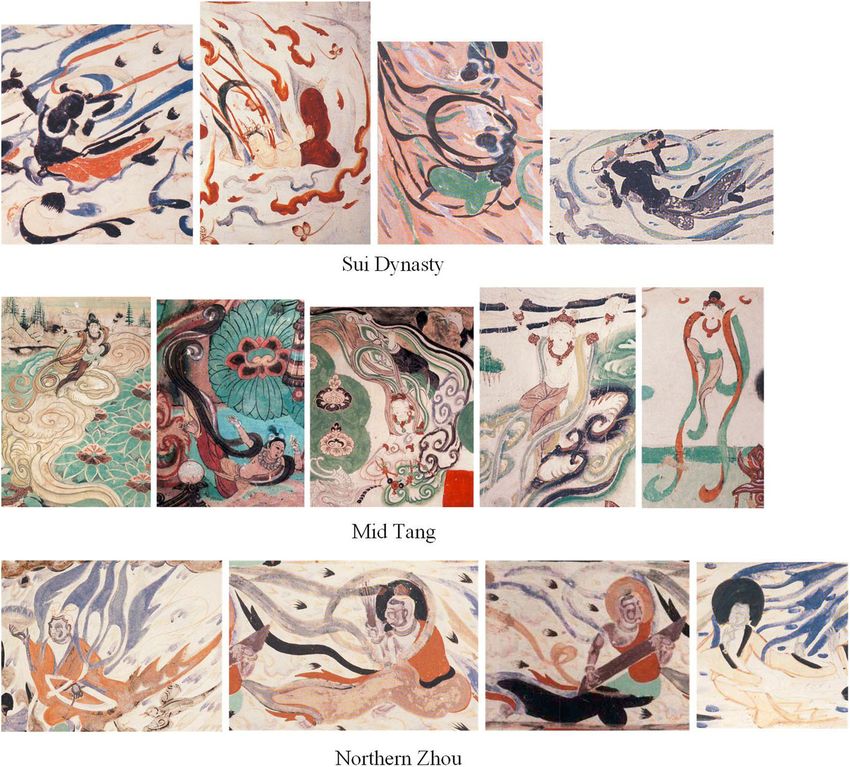
Cao et al. EURASIP Journal on Advances in Signal Processing   (2021) 2021:49                                   Page 3 of 25

                  they extracted the features associated with the appearance, headdress, and costumes of
                  the mural characters for mural classification. These scholars have made useful attempts
                  at mural classification based on different methods and from different perspectives.
                  However, research on methods for mural dynasty recognition has rarely been reported.
                     As deep learning techniques continuously develop, CNNs have proven effective in
                  the fields of image recognition and classification [13–15]. In recent years, CNNs have
                  been gradually applied in the repair, superresolution reconstruction, and classification
                  of ancient mural images. Li et al. [16] encoded painting styles with a CNN for 194 Dun-
                  huang Grotto murals, whose time of creation had been identified, and then utilized
                  color descriptors for color vision code extraction. Zou et al. [17] extracted and encoded
                  the appearance and formed features of mural images with a scale-invariant feature
                  transform (SIFT) and kAS descriptors; then, they applied a supervised learning strategy
                  in combination with a feature histogram for mural dynasty classification. Although
                  these methods can achieve high classification accuracy, their final outcomes for some
                  mural images are inconsistent with the officially identified dynasties due to the small
                  number and identical source of the investigated murals as well as great similarities
                  among murals in terms of content and painting styles.
                     Inception-v3 [18], which was proposed by the Google team, is a network architecture
                  based on modifications of AlexNet. Inception-v3 has been frequently applied in image
                  recognition. Liu et al. [19] combined Inception-v3 with S-Mask R-CNN and fused
                  transfer learning in the input layer. They applied this technique in lesion recognition
                  for prostate images in the to-be-detected region determined by S-Mask R-CNN; their
                  method achieved higher canceration identification results than traditional artificial rec-
                  ognition methods. Chowdary et al. [20] fused Inception-v3, VGG19, Resnet50, and
                  MobileNet for facial emotion recognition of 918 images in the CK+ dataset. The results
                  showed that the fusion between transfer learning and Inception-v3 achieved high classi-
                  fication accuracy. Enlightened by the notion of convolution decomposition in the
                  Inception-v3 model, Yeh et al. [21] decomposed the convolution of the extended layer
                  in a lightweight network. This operation reduced the calculation complexity of the net-
                  work and guaranteed the stability of the feature expressiveness of the model to effect-
                  ively extract image features from multiple scales. All these studies have proven the
                  advantages of Inception-v3 in image recognition and target detection and recognition.
                  Compared with Inception-v1 and Inception-v2, Inception-v3 integrates convolution de-
                  composition to accelerate the calculation process; it possesses a deeper network archi-
                  tecture, with an input size of 299 × 299. In addition, this model requires fewer
                  parameters and shorter training times. Based on these virtues of Inception-v3, this
                  study proposed a transfer learning-fused Inception-v3 model to complete ancient mural
                  dynasty identification. The mural images for testing the classification performance of
                  the proposed model reflected different dynasties and varying painting styles.
                     This study is organized as follows: In the following section, we introduced the fea-
                  tures and detailed network configuration of the Inception-v3 model as well as the
                  transfer learning-fused ancient mural dynasty identification model that was proposed in
                  this study. In the third section, we described the sources and detailed data of the data-
                  sets selected for the experiment in this study and described the main results. In the
                  fourth section, we drew conclusions based on the main findings obtained in this study
                  and suggested a direction for future research.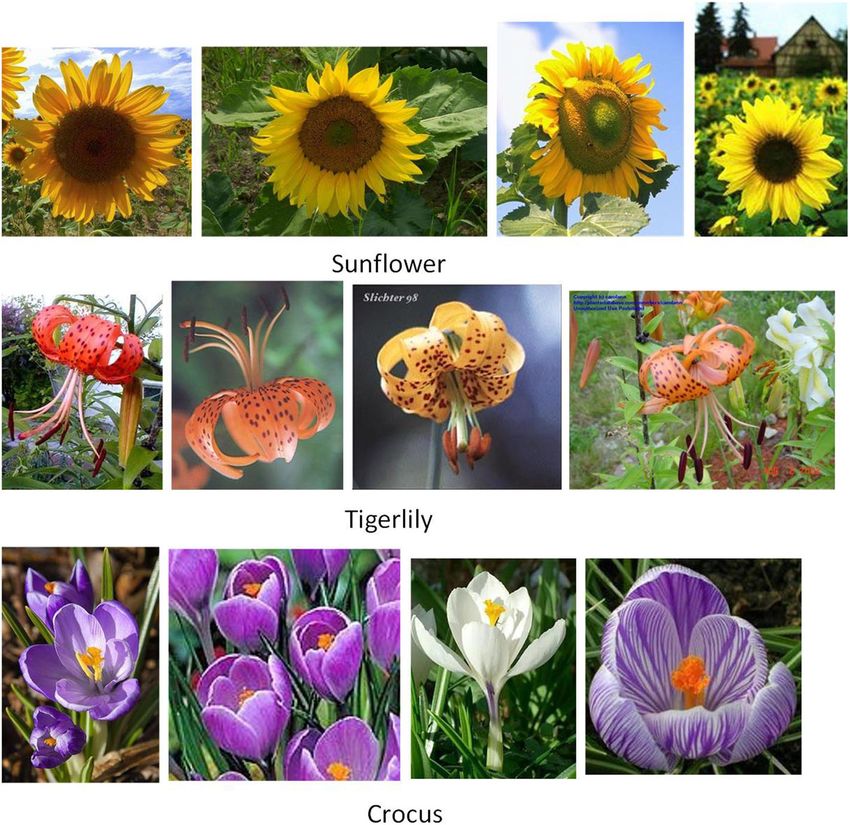
Cao et al. EURASIP Journal on Advances in Signal Processing    (2021) 2021:49                                    Page 4 of 25

                  2 Methods
                  2.1 Inception-v3 model
                  The Inception model is a deep CNN architecture that was proposed by Szegedy et al.
                  in the Large-Scale ImageNet Visual Identification Challenge 2014; its aim was to
                  weaken the influence of computational efficiency and low parameters in application sit-
                  uations [17]. The image size input into Inception-v3 was 299 × 299. Although this size
                  is 78% larger than that of VGGNet (244 × 244), the running speed of Inception-v3 is
                  faster than that of VGGNet. The main reasons for this high efficiency of Inception-v3
                  are presented as follows: compared with AlexNet, the number of parameters of
                  Inception-v3 is fewer than half that of AlexNet (60,000,000) and fewer than one fourth
                  that of VGGNet (140,000,000); additionally, the number of floating-point computations
                  of the whole Inception-v3 network is approximately 5,000,000,000, which is much lar-
                  ger than that of Inception-v1 (approximately 1,500,000,000). These characteristics make
                  Inception-v3 more practical, that is, it can be easily implemented in a common server
                  to provide a rapid response service.
                    Inception-v3 adopts convolutional kernels of different sizes, which enables it to own
                  receptive fields of different areas. To reduce the design space of the network, it adopts
                  a modular system followed by final joining, thereby realizing the fusion of features of
                  varying scales. The network parameters of Inception-v3 are summarized in Table 1.
                  The configuration of the Inception-v3 model is shown in Fig. 1.
                    In Inception-v3, a batch normalization (BN) layer is inserted as a regularizer between
                  the auxiliary classifier and the fully connected (FC) layer. In the BN model, the batch
                  gradient descent method can be employed to accelerate the training speed and model
                  convergence of the deep neural network. The formulas of BN are expressed as follows:

                      Β ¼ χ 1…m ; γ; β                                                                  ð1Þ

                               yi ¼ BN γ;β χ i                                                             ð2Þ

                                  1 Xm
                         μΒ ←           χ
                                     i¼1 i
                                                                                                           ð3Þ
                                  m

                  Table 1 Network structure of the Inception-v3 model
                  Type                                        Patch size/stride               Input size
                  conv                                        3 × 3/2                         299 × 299 × 3
                  conv                                        3 × 3/1                         149 × 149 × 32
                  conv                                        3 × 3/1                         147 × 147 × 32
                  pool                                        3 × 3/2                         147 × 147 × 64
                  conv                                        3 × 3/1                         73 × 73 × 64
                  conv                                        3 × 3/2                         71 × 71 × 80
                  conv                                        3 × 3/1                         35 × 35 × 192
                  3 × Inception                               ——                              35 × 35 × 288
                  5 × Inception                               ——                              17 × 17 × 768
                  2 × Inception                               ——                              8 × 8 × 1280
                  pool                                        8×8                             8 × 8 × 2048
                  linear                                      logits                          1 × 1 × 2048
                  softmax                                     classifier                      1 × 1 × 1000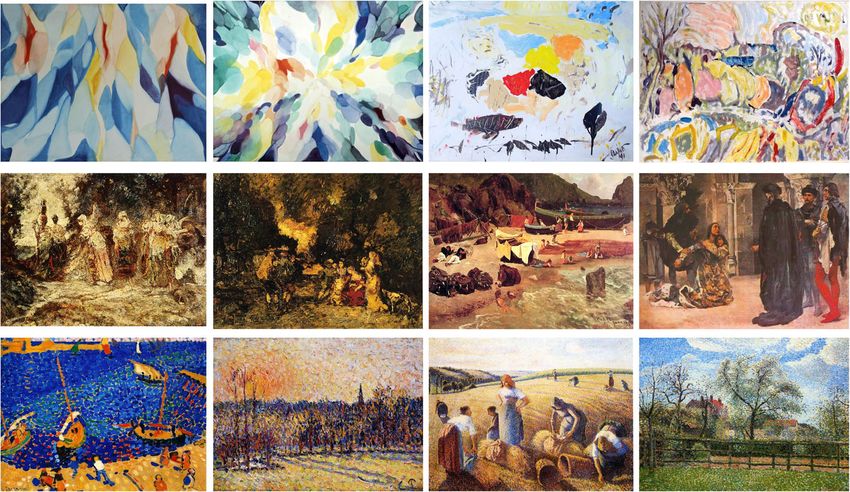
Cao et al. EURASIP Journal on Advances in Signal Processing    (2021) 2021:49                                  Page 5 of 25

                    Fig. 1 Structure diagram of the Inception-v3 model

                               1 Xm              2
                      σ Β2←                 χ −μΒ
                                        i¼1 i
                                                                                                        ð4Þ
                              m
                              χ i −μΒ
                      ^χ i ← pffiffiffiffiffiffiffiffiffiffiffiffiffi                                                             ð5Þ
                                σ 2Β þ ε

                      yi ←γ^ χ i þ β ¼ BN γ;β χ i                                                       ð6Þ

                  where x is the minimum activation value of batch B, m is the number of activation
                  values, γ and β are learnable parameters (γ is responsible for adjusting the variance in
                  the value distribution and β is responsible for adjusting the position of the average
                  value), μΒ represents the average value in one dimension, σΒ2 is the standard deviation
                  in each dimension of the feature map, and ε is a constant.
                    Furthermore, in Inception-v3, large convolution kernels are divided into small convo-
                  lution kernels in series, convolution and pooling are connected in parallel, and LSR la-
                  bels are added for regularization based on the smoothing criteria. In addition,
                  considering the distribution inconsistency between inputs and outputs in a traditional
                  deep neural network, which creates great obstacles for feature extraction, BN is intro-
                  duced into Inception-v3. By normalizing the input into each layer, the learning effect is
                  optimized.

                  2.2 Transfer learning-fused model for ancient mural dynasty recognition
                  Research on mural images suffers from issues such as low quality, a small number of
                  murals and collection difficulty. To deeply extract image features over small mural
                  datasets, the model proposed in this study was pretrained over the large dataset Ima-
                  geNet, and then the knowledge obtained through transfer learning was applied to small
                  mural datasets to achieve dynasty recognition and classification for the murals.

                  2.2.1 Transfer learning-fused model for dynasty-based classification
                  In this study, the model proposed for dynasty-based classification of ancient murals
                  consists of the feature extraction section and classification section. For feature extrac-
                  tion, a CNN is adopted. The classification section is composed of FC layers and soft-
                  max layers and is illustrated in Fig. 2.
                    As shown in Fig. 2, in the proposed model, the convolution layers and pooling layers
                  before the FN layer and softmax layer are frozen. The size of the convolution kernel of
                  each convolution layer is 3 × 3. The size of the first pooling layer is 3 × 3 and that of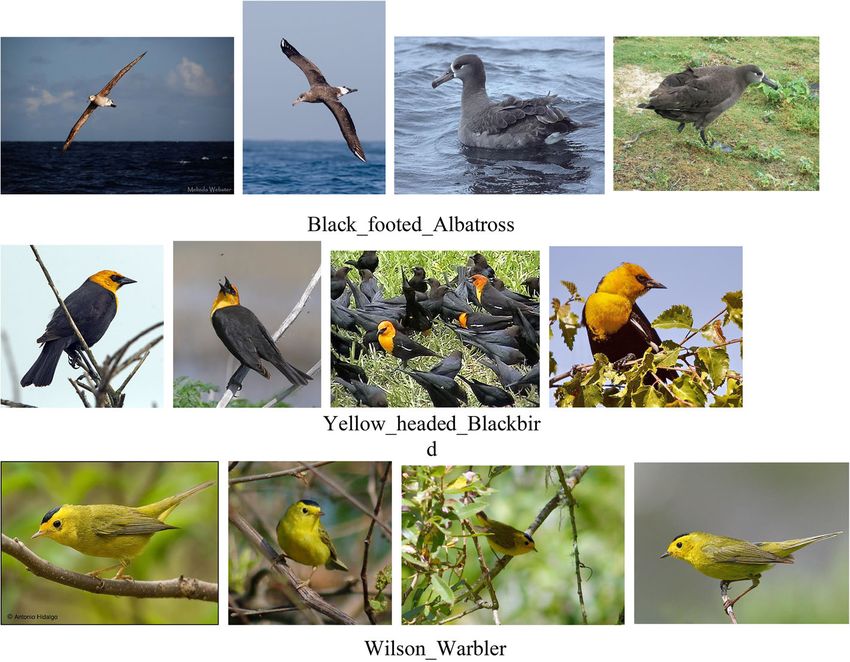
Cao et al. EURASIP Journal on Advances in Signal Processing     (2021) 2021:49                                  Page 6 of 25

                    Fig. 2 Dynasty-based classification model for ancient murals

                  the second is 8 × 8. The convolution layers and pooling layers are responsible for
                  extracting low-level features. The inception structure in the middle consists of three
                  module groups: the size of the image input into the first group is 35 × 35 × 288; in the
                  second group, the size of the feature map is reduced to 17 × 17 × 768 and filters are
                  added; in the third group, the size of the image is 8 × 8 × 1,280, and the parallel convo-
                  lution and pooling structure is adopted. The Inception-v3 model with frozen convolu-
                  tion and pooling layers is pretrained over the large dataset ImageNet. Afterward, the
                  last two layers, i.e., the FC layer and softmax layer, are trained over mural datasets. The
                  convolution layer before the FC layer and softmax layer is the bottleneck layer, which is
                  used to calculate the bottleneck values for mural images during training. In this layer,
                  the extracted features are transformed into a 2048-dimensional eigenvector. The pos-
                  ition for bottleneck features is the feature output position, and the generated eigen-
                  vector is applied as the output node in the softmax layer. The knowledge obtained
                  from deep learning is stored in the disc, and the deep-level features of ancient mural
                  images are extracted.

                  2.2.2 Modifications

                    (1) Fusion with transfer learning

                    The challenges associated with existing ancient murals are that they are small in
                  number, of low quality, and often severely damaged, which create difficulties in image
                  collection and screening. In addition, for the purpose of dynasty-based classification,
                  mural images of different historical periods should be collected. However, the current
                  technique for mural image classification remains immature, and for some murals, the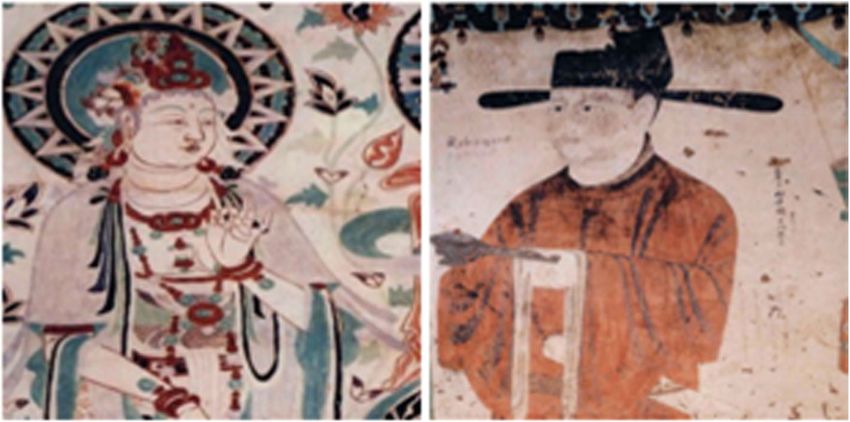
Cao et al. EURASIP Journal on Advances in Signal Processing   (2021) 2021:49                                   Page 7 of 25

                  dynasties in which they were created have not been identified. This condition makes
                  the task of large data collection more difficult.
                    To further enhance the learning efficiency of the model and to better extract the
                  deep-level features of murals, transfer learning was fused into the Inception-v3 model
                  in this study. Transfer learning is a type of machine learning in which common know-
                  ledge obtained from learning is used to solve problems in other fields; its aim is to ac-
                  complish the transfer of valuable information learned in some fields to other fields.
                  Transfer learning can improve the stability and generalization of the model, thereby
                  avoiding the negative influence of the changes in image pixels on the final classification
                  outcomes.
                    Specifically, transfer learning was utilized in this study as follows. The Inception-v3
                  model was pretrained over ImageNet, and the low-level image features were extracted.
                  The knowledge obtained from transfer learning as the output of the bottleneck layer
                  was applied over ancient mural datasets. The convolution layers before the FC and soft-
                  max layers were frozen. By continuously adjusting the parameters of the network, a
                  new FC layer and a new softmax layer were trained for extracting the deep-level fea-
                  tures of the mural images, thus realizing model training and image classification in a
                  relatively short time period.

                    (2) Algorithm for the adaptive learning rate on stochastic gradient descent (ALR-SGD)

                     In the SGD algorithm, the loss functions are stochastically selected over some train-
                  ing data during each iteration for gradient descent optimization to accelerate the par-
                  ameter update speed. The ALR-SGD algorithm enables a consistent learning rate to be
                  applied during the whole experiment.
                     To maintain the convergence rate of the model during training, an FC layer was used
                  at the end of the model proposed in this study. This layer outputs the score of each
                  possible dynasty when the mural was created and then calculates the distribution dis-
                  tance between the predicted dynasty classification of the image according to the pro-
                  posed model and the authentic dynasty to which the image belongs. In addition, a
                  cross-entropy function was employed as the loss function in this study to optimize the
                  errors of the model during backpropagation.
                     If the learning rate is low, the convergence rate of the parameters with a large gradi-
                  ent will gradually decrease. If the learning rate is high, the parameters that have been
                  optimized may become unstable. To solve the problem that some parameters near the
                  minimum value have a large gradient, in this study, the ALR-SGD algorithm was uti-
                  lized as the optimizer of the proposed model, the cross-entropy function was applied as
                  the minimized cost function, and the learning rate was properly modified to achieve
                  better convergence to avoid saturating the learning rate during model training.

                    (3) Cross-entropy loss function

                    To solve the problem of gradient disappearance and to assess the difference between
                  the authentic value and the predicted value, the cross-entropy function and the softmax
                  function were combined into the loss function in this study. A lower cross-entropy
                  value indicates a smaller difference between the actual output and the expected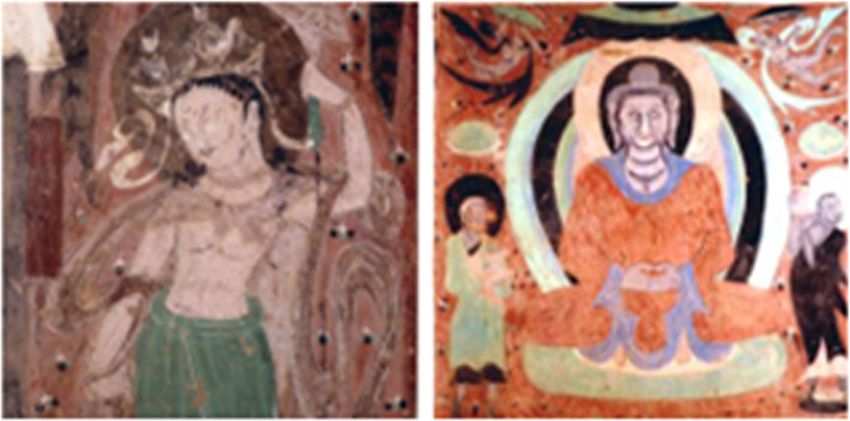
Cao et al. EURASIP Journal on Advances in Signal Processing      (2021) 2021:49                                                      Page 8 of 25

                  outcome and a better effect. Given the same conditions, the cross-entropy function has
                  a faster learning rate than a quadric cost function, and compared with the sigmoid
                  function, it can avoid a decrease in the learning rate.
                    The cross-entropy function equation is expressed as follows:

                                      X      0
                      H ðy; pÞ ¼ −          yi logðyi Þ                                                                        ð7Þ
                                        i

                                                          0
                  where y is the predicted value, yi is the actual value, and i is the number of categories.
                    Cross-entropy represents the distance between the actual output and the expected
                  output. During backpropagation, the larger the error between the actual value and the
                  predicted value is, the larger the conditioned amplitude of the parameter and the faster
                  the convergence of the model. The cross-entropy value during training that is output at
                  the end of the experiment can be used to determine whether overfitting occurs in the
                  model. In this study, the cross-entropy function and the softmax classifier were com-
                  bined. The final output of the softmax classifier underwent processing, and cross-
                  entropy was used to calculate the loss.

                  2.2.3 Flowsheet for mural classification
                  The framework of the transfer learning-fused Inception-v3 model for the dynasty-based
                  classification of ancient murals is shown in Fig. 3, which realized the classification task
                  through four primary stages.

                  2.2.3.1 Stage 1: Image preprocessing Input: Ancient mural image datasets;
                    Output: Training, testing and verifying datasets;
                    Step 1: Modify the size of each mural image in the datasets to a pixel at 299 × 299;
                    Step 2: Enlarge the datasets through image reversion, color dithering and lightness
                  enhancement using the data enhancement method;
                    Step 3: Obtain the expanded datasets;
                    Step 4: Divide the images in the expanded datasets with the random function: 80% of
                  the images constitute the training set, 10% of the images constitute the testing set, and
                  10% of the images compose the verifying set.

                    Fig. 3 Framework of the Inception-v3 model fused with transfer learning for ancient mural classification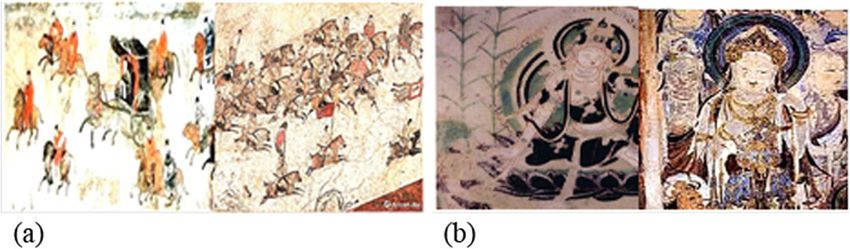
Cao et al. EURASIP Journal on Advances in Signal Processing (2021) 2021:49 Page 9 of 25
2.2.3.2 Stage 2: Model pretraining Input: Training dataset;
Output: Trained dataset;
Step 1: Train the downloaded Inception-v3 model over ImageNet;
Step 2: Use the images in the training set for model training to obtain the trained
Inception-v3 model;
Step 3: Set the learning rate and batch value and change the number of iterations;
record the accuracies at different learning rates and batch values and after different
numbers of iterations;
Step 4: Obtain the migration model.
2.2.3.3 Stage 3: Model testing Input: Testing dataset;
Output: Testing accuracy;
Step 1: Introduce the testing dataset into the pretrained migration model;
Step 2: Statistically calculate the classification outcomes to obtain the final accuracy.
2.2.3.4 Stage 4: Model verification Input: Verifying dataset;
Output: Verify the mural image classification accuracy;
Step 1: Introduce the verifying dataset into the pretrained migration model;
Step 2: Statistically calculate the verification outcomes.
3 Results and discussion
3.1 Experimental environment
The hardware environment primarily consists of an Intel Core i5-8250U CPU, with 16
GB memory and an NVIDIA GeForce MX150 video card. The software environment is
Python 3.7 for language programming on the Windows 10 system, with TensorFlow as
the framework and PyCharm 2019.3.5 × 64 for compiling.
3.2 Datasets and sources
The mural images collected in this study were obtained from the electronic books
Underground gallery-brick frescoes of the Wei and Jin Dynasties in Jiayuguan, Complete
works of Dunhuang frescoes in China, and Murals of the Song Dynasty in Kaihua Tem-
ple. The content of the murals includes Buddha and Bodhisattva images, Buddhist stor-
ies, Jataka stories, sutra tales, and various routine production and life activities, such as
mulberry picking, carriages and horses, patrolling, cooking, productive laboring, ser-
vants, wining and dining, hunting, breeding and grazing, butchering, houses and music
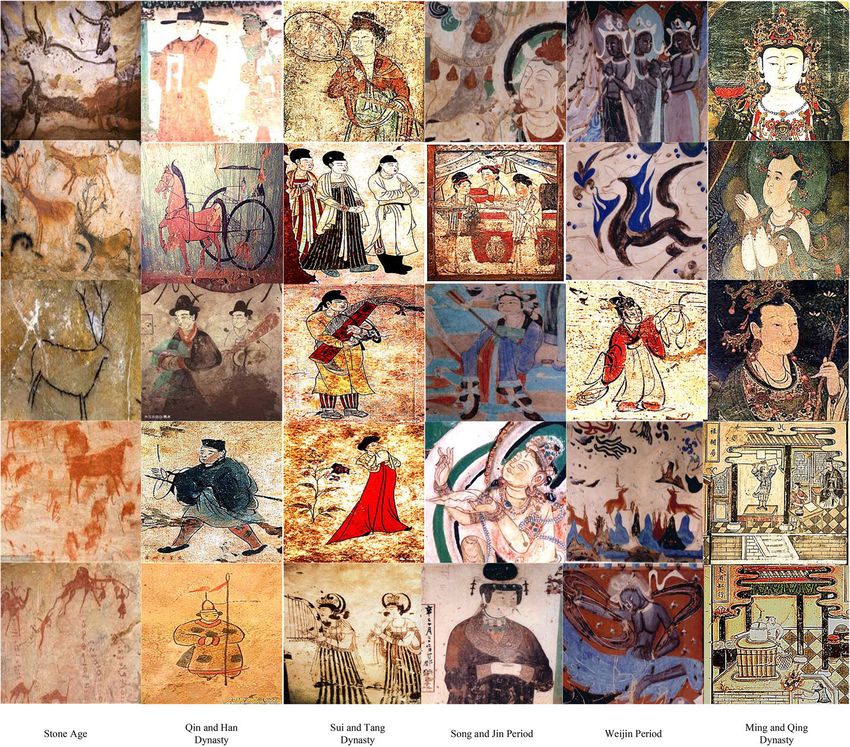
playing, which represent the mural arts in different historical periods. Based on clipping
and analysis, the collected mural images were divided into the Stone Age, Qin/Han
dynasties, Sui/Tang dynasties, Song/Jin dynasties, Wei/Jin dynasties, and Ming/Qing
Dynasties. Some examples of different dynasties are shown in Fig. 4, and the mural
numbers of different dynasties collected in this study are provided in Table 2.
To enlarge the datasets, data enhancement methods were used to preprocess the mu-
rals (some images after preprocessing are shown in Fig. 5). The methods included (1)
brightness increase; (2) left and right flipping; (3) random color dithering, including
contrast enhancement and color enhancement; and (4) image rotation with a rotation
angle of 20°.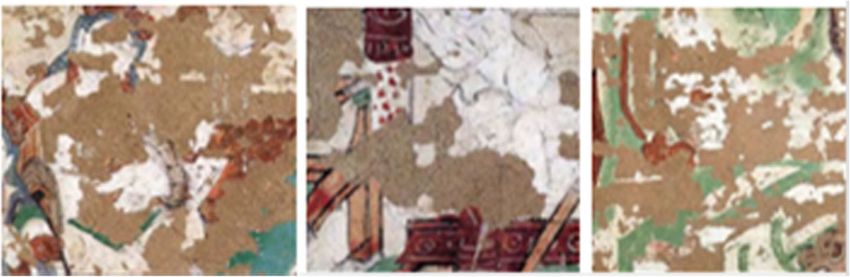
Cao et al. EURASIP Journal on Advances in Signal Processing       (2021) 2021:49                                Page 10 of 25

                    A total of 9700 images were collected in this study, which included enhanced images.
                  These images were divided into the training set, testing set, and verification set at a ra-
                  tio of 8:1:1. The number of images in different dynasties is summarized in Table 3.

                  3.3 Outcomes of model training and verification
                  In this study, the training step frequency and experimental learning rate were 10,000
                  and 0.1, respectively, based on multiple training and testing cycles. Figure 6 shows the
                  variations in the accuracy rate and cross-entropy value during training. During model
                  training, the accuracy rate constantly increased. After the step frequency reached 8000,
                  the accuracy rate became stable with an accuracy rate of approximately 88% (Fig. 6a).
                  The cross-entropy loss value continuously decreased as the training proceeded. At a
                  step frequency of 3000, the value became stable and gradually neared 0 (Fig. 6b). Dur-
                  ing the verification process, the verification accuracy continuously increased, and when
                  the step frequency reached 6000, the accuracy rate tended to stabilize. The verification
                  cross-entropy loss value showed a continuous decrease followed by a tendency for sta-
                  bility as the verification process proceeded (Fig. 6c, d). Figure 7 shows that when the
                  learning rate was 0.1, the model achieved the best performance in terms of accuracy.
                  Based on these results, the model proposed in this study showed satisfactory perform-
                  ance and rarely caused overfitting.

                    Fig. 4 Sample images of different dynasties
Cao et al. EURASIP Journal on Advances in Signal Processing (2021) 2021:49 Page 11 of 25
Table 2 Number of murals in each dynasty
Dynasty type Number of images
Stone Age 168
Qin/Han Dynasties 312
Sui/Tang Dynasties 372
Song/Jin Period 256
Wei/Jin Period 436
Ming/Qing Dynasties 396
Total 1940
The learning rate serves as a scaling factor for weight adjustment during training. A
learning rate that is too large will cause model volatility and convergence failure,
whereas a learning rate that is too small can cause model convergence to be too slow,
thereby wasting time and calculation resources [22]. In this study, at the same iteration
step (10,000), the learning rate was set to 0.001, 0.01, and 0.1 for a multigroup experi-
ment. The variations in the accuracy rate at different learning rates during training are
shown in Fig. 7.
Fig. 5 Example images after data enhancementCao et al. EURASIP Journal on Advances in Signal Processing (2021) 2021:49 Page 12 of 25
Table 3 Number of mural images in different dynasties
Dynasty type Number of images Training set Validation set Test set
Stone Age 840 672 84 84
Qin/Han Dynasties 1560 1248 156 156
Sui/Tang Dynasties 1860 1488 186 186
Song/Jin Period 1280 1024 128 128
Wei/Jin Period 2180 1744 218 218
Ming/Qing Dynasties 1980 1584 198 198
As shown in Fig. 7, the model showed the best performance when the learning rate
was 0.1, with a final maximum accuracy rate of 88.4%. This accuracy rate was 13.1%
and 4.4% higher than that of the 0.001 group and the 0.01 group, respectively.
During model training, model parameter selection is vital to the occurrence of over-
fitting and training time. The size of a database matters in the selection of model pa-
rameters. After a substantial number of tests, we set the epoch value of the model to
32, batch size to 100, and dropout to 0.5. In addition, we selected Adam as the
optimizer and the cross-entropy function as the loss function. To demonstrate the
feasibility of the model parameters in this study, we performed tests with parameters at
different values; the outcomes are summarized in Table 4.
Fig. 6 Results of the accuracy and cross-entropy loss during training and verification. a Accuracy during
training. b Cross-entropy loss during training. c Accuracy during verification. d Cross-entropy loss
during verificationCao et al. EURASIP Journal on Advances in Signal Processing (2021) 2021:49 Page 13 of 25
Fig. 7 Comparison of the accuracy rates at different learning rates
3.4 Comparisons with other models
To better illustrate the superiority of the proposed model in dynasty recognition for an-
cient murals, its accuracy rate was compared with the accuracy rates of typical deep
learning network models, which included AlexNet [23], LeNet [24] and VGG [25] and
DenseNet [26], MobileNet [27], and modified CNN models, which included LeNet-5
[28], Alex-10 [29], R-VGGNet [30], and Du et al.’s model [31].
(1) Running step number of 10,000 at a learning rate of 0.1
The running time and accuracy rate of the proposed model were compared with
those of AlexNet, LeNet, VGG, LeNet-5, Alex-10, R-VGGNet, and AlexNet-S6; the
comparison results are shown in Figs. 8 and 9.
As shown in Fig. 8, it only took 0.7 h for the proposed model to run 10,000 steps,
which was 7/25, 7/40, and 7/50 of the time needed for AlexNet, ResNet, and VGGNet,
respectively. Compared with the considered modified CNNs, the proposed model also
showed great advantages in terms of running time. The following reasons may explain
Table 4 Comparison outcomes for different parameter values
Size Accuracy
Number of categories 6 –
Dropout 0.5 –
Batch size 50 76.8%
100 88.4%
Epoch 16 69.4
32 88.4%
64 78.3%
Iterations 5000 62.5%
10,000 88.4%
2000 82.5%Cao et al. EURASIP Journal on Advances in Signal Processing (2021) 2021:49 Page 14 of 25
these differences: AlexNet, ResNet, and VGGNet have deeper network architectures
than the proposed model, and therefore, they consume a larger amount of memory
space. When the number of calculations, such as the feature extraction for the mural
datasets in this study, is too large, they consume a substantial amount of time. In con-
trast, the advantage of the inception structure is manifested by its convolution decom-
position. Given the same size of the perception field, this advantage increases the
calculation efficiency of Inception, reduces its number of parameters, and increases its
convergence rate. With an increase in the number of extracted features, the training of
Inception gradually accelerates, which achieves a balance between the width of the net-
work and its depth, thereby reducing the possibility of overfitting during training.
As shown in Fig. 9, after 10,000 running steps, the accuracy rate of the proposed
model increased by 66.1%, 19.1%, 42.4%, 5.4%, 13.4%, 9.8%, and 4.4% compared with
AlexNet, ResNet, VGGNet, LeNet-5, Alex-10, R-VGGNet, and AlexNet-S6, respect-
ively. Presumably, the modified CNNs (i.e., LeNet-5, Alex-10, R-VGGNet, and
AlexNet-S6) reported in the literature are the models that are modified over their cor-
responding datasets, and thus, they only serve specific purposes. When they were ap-
plied to mural datasets, problems such as inappropriate parameters and insufficient
feature extraction occurred. In contrast, the model proposed in this study was infused
with transfer learning and was trained over the mural datasets after pretraining. Fur-
thermore, during the training process, the parameters of this model were continuously
adjusted according to the outcomes of each training session. Therefore, it achieved a
higher recognition accuracy rate and could deeply extract the mural features, such as
color, texture, and painting styles.
(2) With the same running time
Over the mural datasets constructed in this study, the running time was set to 1 h, and
the accuracy, recall rate, and F1 value of the proposed model were compared with those
of LeNet-5, Alex-10, R-VGGNet, and AlexNet-S6. The results are shown in Fig. 10.
After a 1-h running time, the accuracy rate, recall rate, and F1 value of the proposed
model were 88.4%, 88.36%, and 88.32%, respectively, which increased by more than 8%
Fig. 8 Comparison of the running times of different modelsCao et al. EURASIP Journal on Advances in Signal Processing (2021) 2021:49 Page 15 of 25
Fig. 9 Comparison of the accuracies of different models
in terms of each index compared with any of the deep learning CNNs (i.e., LeNet-5,
Alex-10, R-VGGNet, and AlexNet-S6). The primary reason for these increases is that
the model proposed in this study was subjected to fine adjustment according to the fea-
tures specifically owned by murals, and the network parameters were more suitable for
the feature extraction of the datasets employed in this study. In contrast, other network
models failed to extract the abundant features of the murals after a 1-h running time
due to the large number of parameters and the long time needed for running. These
findings indicated that the model proposed in this study was advantageous over the
deep learning CNN models in any of the investigated indices: it better extracted the
features of ancient murals with a more powerful generalization capacity and more
stable classification outcomes.
(3) Accuracy in dynasty recognition
After 10,000 running steps, the accuracy rate of the proposed model in dynasty rec-
ognition was compared with those of the modified CNNs in the literature [31–34]. The
results are summarized in Table 5.
Fig. 10 Comparison of the evaluation indices among different modelsCao et al. EURASIP Journal on Advances in Signal Processing (2021) 2021:49 Page 16 of 25
Table 5 Comparison of the accuracy rates of different models for different categories of murals
Stone Qin/Han Sui/Tang Song/Jin Weijin Ming/Qing Average
Age Dynasty Dynasty Period Period Dynasty
Literature 93.23 80.36 75.43 79.86 86.32 80.46 82.61
[25]
Literature 90.45 82.70 79.54 76.50 88.53 76.45 82.36
[26]
Literature 93.57 79.76 77.87 86.12 89.60 85.30 85.37
[27]
Literature 98.95 83.21 80.58 78.8 85.65 80.39 83.26
[28]
Paper 97.50 85.82 85.67 83.80 92.64 83.89 88.4
model
Note: The bold numbers represent the highest classification accuracy rates
As shown in Table 5, compared with other CNNs, the model proposed in this study
achieved an average increase in the accuracy rate of 7.42% for the recognition of most
categories. All methods achieved a rather high accuracy rate for the murals created in
the Stone Age because most murals in this period were created on rocks or walls and
their contents were primarily animals. Compared with the murals created in other pe-
riods, those in the Stone Age are feature-contrasted. From the Qin/Han dynasty and
Sui/Tang dynasty to the Song/Jin period, the contents gradually changed from people,
palaces, and temple murals and sutra murals to tomb murals. Due to the similarities in
color, clothing, buildings, and painting styles among these murals, feature extraction
for dynasty recognition became difficult.
(4) Comparisons with DenseNet and MobileNet
Model complexity has a great influence on the running time and classification accur-
acy of the model. Specifically, time complexity influences the duration of the training
time of the model, while spatial complexity influences the number of model parame-
ters: excessive time complexity will cause excessive time waste during model training
and classification prediction, which affects the prediction and training speeds of the
model; a high spatial complexity will cause overabundant parameters, which is likely to
cause overfitting during training. To verify the satisfactory performance of the proposed
model in terms of both time complexity and spatial complexity, we compared its com-
plexities and classification accuracy with those of two other deep learning models, i.e.,
Fig. 11 DenseNet network structure diagramCao et al. EURASIP Journal on Advances in Signal Processing (2021) 2021:49 Page 17 of 25
Table 6 MobileNet network structure
Type/stride Filter shape Input size
Conv/s2 3 × 3 × 3 × 32 224 × 224 × 3
Conv dw/s1 3 × 3 × 32dw 112 × 112 × 32
Conv/s1 1 × 1 × 32 × 64 112 × 112 × 32
Conv dw/s2 3 × 3 × 64dw 112 × 112 × 64
Conv/s1 1 × 1 × 64 × 128 56 × 56 × 64
Conv dw/s1 3 × 3 × 128dw 56 × 56 × 128
Conv/s1 1 × 1 × 128 × 128 56 × 56 × 128
Conv dw/s2 3 × 3 × 128dw 56 × 56 × 128
Conv/s1 1 × 1 × 128 × 256 28 × 28 × 128
Conv dw/s1 3 × 3 × 256dw 28 × 28 × 256
Conv/S1 1 × 1 × 256 × 256 28 × 28 × 256
Conv dw/s2 3 × 3 × 256dw 28 × 28 × 256
Conv/s1 1 × 1 × 256 × 512 14 × 14 × 256
Conv dw/s1 3 × 3 × 512dw 14 × 14 × 512
Conv/s1 1 × 1 × 512 × 512 14 × 14 × 512
Conv dw/s2 3 × 3 × 512dw 14 × 14 × 512
Conv/s1 1 × 1 × 512 × 1024 7 × 7 × 512
Conv dw/s2 3 × 3 × 1024dw 7 × 7 × 1024
Conv/S1 1 × 1 × 1024 × 1024 7 × 7 × 1024
Avg Pool/S1 Poop 7 × 7 7 × 7 × 1024
FC/s1 1024 × 1000 1 × 1 × 1024
Softmax/s1 Classifier 1 × 1 × 1000
DenseNet and MobileNet, over the mural datasets. The network structure of DenseNet
is shown in Fig. 11, and that of MobileNet is summarized in Table 6.
DenseNet possesses a deep network structure. Compared with ResNet, DenseNet has
fewer parameters. During training, the insertion of a BN layer can achieve a certain
regularization effect. DenseNet contains multiple dense blocks for downsampling.
Compared with existing networks, DenseNet can receive a small number of feature
maps as model outputs; it reuses features from the feature maps of different network
layers and, thus, avoids the problems of gradient loss and model reduction. MobileNet
is a convolutional neural network that is constructed by isolating the convolution from
the two aspects of space and channels. It has the merits of a light weight and deep
structure. Both MobileNet and Inception-v3 adopt convolution separation to enhance
the calculation efficiency of the model.
The accuracy rates, calculation amounts, and parameter numbers of the proposed
model, DenseNet and MobileNet are summarized in Table 7. Compared with DenseNet
and Inception-v3, MobileNet has fewer parameters and requires less memory.
Table 7 Comparison of the accuracies and complexities of the three models
Input size Calculated Parameter Accuracy Memory rate
DenseNet 224 × 224 × 3 2.91 GFLops 40 Million 79.8% 200 MB~500 MB
MobileNet 224 × 224 × 3 0.5 GFLops 4.2 Million 82.5% 74 MB
Inception-v3 299 × 299 × 3 1.6 GFLops 23.5 Million 88.4% 90 MB~100 MBCao et al. EURASIP Journal on Advances in Signal Processing (2021) 2021:49 Page 18 of 25
DenseNet has the most parameters, but its accuracy is lowest due to the limitation of
the experimental hardware platform. The primary reason is that the large parameter
number of DenseNet increases its demand for memory during training and thus slows
the training process. During training, the deep network level of DenseNet and the
dense connection between two networks increase the memory requirement. During
backpropagation, features are continuously input from the previous layer to the next
layer due to repeated reuse of the features, which causes feature overstock. With such a
condition, explosion due to overabundant features is likely to occur. MobileNet has the
smallest number of parameters, which can accelerate the calculation speed. However,
the adoption of the rectified linear unit (ReLU) activation function in MobileNet causes
neuronal silencing. For the input mural images, the ReLU activation function can cause
the loss of some information during feature transformation. In this study, we employed
two ReLU activation functions between Inception modules and an ALR-SGD algorithm,
which increased the representativeness of the model. In addition, because both Dense-
Net and MobileNet belong to deep networks, they need longer training times with a
slower convergence speed. In this study, the fusion of transfer learning accelerated the
convergence of the model and its training time.
3.5 Comparisons of different datasets
To further validate the recognition precision of the transfer learning-fused Inception-v3
model constructed in this study for ancient murals, it was trained on other public data-
sets, and the results were compared.
(1) WikiArt [35]. WikiArt is a dataset based on artists and their arts, that is, each
category contains art created by the same artist. In this study, a total of 17,386
paintings by 17 artists, whose styles varied, were utilized. The paintings were
divided into a training set, testing set, and validation set according to the
Fig. 12 Some examples of the drawing imagesCao et al. EURASIP Journal on Advances in Signal Processing (2021) 2021:49 Page 19 of 25
Fig. 13 Some examples of bird images
Fig. 14 Some examples of flower imagesCao et al. EURASIP Journal on Advances in Signal Processing (2021) 2021:49 Page 20 of 25
proportions of 80%, 10%, and 10%, respectively. Examples of these images are
provided in Fig. 12.
(2) Caltech-UCSD Birds [36]. Caltech-UCSD Birds is a dataset that contains bird images;
it contains 200 different kinds of birds with a total of 11,788 images. In this study, 50
different kinds of birds were selected from the dataset, and the images were divided
into a training set, testing set, and validation set according to proportions of 80%,
10%, and 10%, respectively. Examples of the bird images are provided in Fig. 13.
(3) 17_Category_Flower_Dataset [37]. This dataset includes 17 kinds of flowers, and
each category contains 80 images, with 1360 images in total. In this study, all
images in the dataset were employed for the validation experiment. Furthermore,
64 images were used for training, 8 images were employed for testing, and 8
images were utilized for validation. Examples of some categories of flowers are
given in Fig. 14.
(4) DH660 [38]. In this study, the Dunhuang Flying Apsaras images created in 10
dynasties contained in DH660 were selected, with a total number of 610 images.
They were divided into the training set, testing set, and validation set according to
proportions of 80%, 10%, and 10%, respectively. Examples of the Flying Apsaras
images are provided in Fig. 15.
Under the conditions of 1000 running steps with a learning rate of 0.1, the accuracy
rates of the proposed model for different datasets are summarized in Table 8.
Fig. 15 Some examples of the Flying Apsaras mural imageCao et al. EURASIP Journal on Advances in Signal Processing (2021) 2021:49 Page 21 of 25
Table 8 Accuracy of the model for each dataset
Dataset name Accuracy/%
WikiArt 53.5
Caltech-UCSD Birds 76.0
17_Category_Flower_Dataset 94.7
DH660 88.3
As shown in Table 8, the accuracy rates of the proposed model on WikiArt, Caltech-
UCSD Birds, 17_Category_Flower_Dataset, and DH660 were 53.5%, 76.0%, 94.7%, and
88.3%, respectively. These accuracy rates were compared; the results are shown in Fig. 16.
As shown in Fig. 14, the proposed model exhibited relative stability during the whole
training process, without wide-ranging fluctuations. The model obtained the highest ac-
curacy for the 17_Category_Flower_Dataset because this dataset contains only 1360 im-
ages, which is a small number compared with the 9700 mural images constructed in
this study. Therefore, the proposed model could easily extract the features of natural
flower images, thereby achieving a high classification accuracy rate. The accuracy rate
of the proposed model for the WikiArt painting dataset was the lowest. Compared with
WikiArt and Caltech-UCSD Birds, its accuracy for the mural dataset was higher, which
indicates that the performance of the model proposed in this study is stable on mural
image datasets and is suitable for the dynasty-based classification of ancient murals.
Based on these experimental results, the model proposed in this study achieved
higher accuracy for recognizing dynasties when ancient murals were created than other
classical and modified CNNs and achieved better performance on the mural image
dataset constructed in this study. However, there were also misclassifications; some of
these misclassifications are provided in Figs. 17, 18, 19, and 20.
Misclassification 1: due to the mural content. In Fig. 17, both images contain the
carriage, horse and Buddha, and the model extracted similar features.
Misclassification 2: due to similar mural color and painting styles. Figure 18 shows
two murals that were created in the Song/Jin period, and Fig. 19 shows murals
Fig. 16 Comparison of experimental accuracy among different datasetsCao et al. EURASIP Journal on Advances in Signal Processing (2021) 2021:49 Page 22 of 25
Fig. 17 Example of misclassification of similar mural content. a The mural created in the Qin/Han Dynasties
is misclassified as the Sui/Tang Period (left) and that created in the Sui/Tang Period is misclassified as the
Qin/Han Dynasties (right). b The mural created in the Song/Jin Period is misclassified as the Sui/Tang Period
(left) and that created in the Sui/Tang Period is misclassified as the Song/Jin Period (right)
created in the Wei/Jin dynasties. Because all murals in these figures were obtained
from the Dunhuang Caves and are similar in color and painting styles,
misclassifications tend to occur.
Misclassification 3: due to large-area shedding. In Fig. 20, misclassification occurred
for all images. The reason is that all murals were subjected to multiple sheddings,
which causes difficulty in mural feature extraction.
These cases represented failed classification cases. The main reason for these misclas-
sifications is that the elements of murals, such as Bodhisattvas, figures, animals, and
buildings, were drawn directly on the wall with a paintbrush in different dynasties. In-
fluenced by the cultural spread, religious transmission, and living customs, different
murals in different grottoes may bear similarities in mural color and figure lines, which
makes it difficult to identify dynasties according to the extracted features (e.g., color
and lines). In addition, all mural images have transcended a long historical time. The
pigments on the image and wall are eroded by pests, natural disasters, and pathological
changes, which make the mural image partially shed. The characteristics of murals with
a large shedding-off area lack integrity, which impedes dynasty recognition.
Fig. 18 Mural images of the Song/Jin dynastiesCao et al. EURASIP Journal on Advances in Signal Processing (2021) 2021:49 Page 23 of 25
Fig. 19 Frescoes of the Wei and Jin dynasties
4 Conclusions
Targeting the problems of low dynasty-based classification accuracy and difficult fea-
ture extraction for ancient mural images as well as similarities in the contents and
painting styles of mural images, this study proposed a transfer learning-fused
Inception-v3 model for dynasty-based classification of ancient murals. Due to the diffi-
culty of the selection of mural datasets, we expanded the datasets available with a data
enhancement algorithm. The results showed that the proposed model achieved a classi-
fication accuracy rate of 88.4% for the testing dataset and shortened the running time.
Compared with the classic deep learning models and modified CNNs, the model pro-
posed in this study exhibited better performance and higher accuracy, reaching 10,000
steps within a short time. Furthermore, its calculation burden was small, with a low
cost and a small occupied memory space.
When the recall rate and F1 score were introduced for evaluation, the proposed
model exhibited more satisfactory classification accuracy, with a recall rate of
88.36% and an F1 score of 88.32%, which increased by 8% on average compared
with other models. After training and testing on WikiArt, Caltech-UCSD Birds,
17_Category_Flower_Dataset, and DH660, there was no noticeable difference in the
recognition accuracy of the model for DH660 and for the constructed ancient
mural dataset, which indicates that the model proposed in this study is suitable for
dynasty recognition of ancient mural images.
Fig. 20 Murals with large areas of image sheddingCao et al. EURASIP Journal on Advances in Signal Processing (2021) 2021:49 Page 24 of 25
In the experiment, due to the hardware environment and the small difference in
the painting styles of some ancient mural images, there were some shortcomings
in using the classical depth network model to train the dataset in this study. For
instance, the accuracy rate was not high due to the rich features of mural images
that could not be extracted more deeply, and misclassifications sometimes oc-
curred. In the future, the datasets need to be further expanded, and the network
structure needs to be adjusted to extract more in-depth features of mural image
texture and color. In addition, attempts to modify other models can be made in
further research on the dynasty classification of ancient murals, with the expecta-
tions of improving the classification accuracy of ancient murals and realizing rapid
and effective dynasty recognition of ancient murals.
Abbreviations
CNN: Convolutional neural network; SIFT: Scale-invariant feature transform; BN: Batch normalization; FC: Fully
connected; ALR-SGD: Adaptive learning rate on stochastic gradient descent
Acknowledgements
None.
Authors’ contributions
JC devised the study plan and led the writing of the article. MY, YJa, and XT conducted the experiment and collected
the data. ZZ conducted the analysis, and JC supervised the whole process. All authors read and approved the final
manuscript.
Funding
This study was supported by the Natural Science Foundation of Shanxi Province (201701D21059), Key Research Base
Project of Humanities and Social Sciences in Colleges and University of Shanxi Province (20190130), Art and Science
Planning Project of Shanxi Province (2017F06), and Xinzhou Platform and Talent Project (20180601).
The funding organizations had no role in the design of the study, the collection, analysis, and interpretation of data or
the writing of the manuscript.
Availability of data and materials
All data generated or analyzed during this study are included in this article.
Declarations
Competing interests
The authors declare that they have no competing interests.
Received: 13 October 2020 Accepted: 1 June 2021
References
1. X.J. Kang, Conservation of a silk robe excavated from the Loulan Mural Tomb, Xinjiang, China. Stud. Conserv. 59(S1),
S55–S57 (2014)
2. G.K. Wang, H.Q. Wang, Y. Yin, et al., Color restoration and evaluation of murals based on spectral reconstruction
technique. Opt. Laser Technol. 43(02), 280–285 (2019)
3. Y.P. Pan, D.M. Lu, Digital protection and restoration of ancient Dunhuang frescoes. J. Syst. Simul. 15(3), 310–314 (2003)
4. Zeng Y, Gong Y, Nearest neighbor based digital restoration of damaged ancient Chinese paintings. Proc of the 2018
IEEE 23rd International Conference on Digital Signal Processing (IEEE, Shanghai, China, 2018), p. 19-21.
5. H. Wang, Q.Q. Li, Q. Zou, Inpainting of dunhuang murals by sparsely modeling the texture similarity and structure
continuity. J. Comput. Cult. Herit. 12(3) (2019)
6. H.J. Zhang, S. Wang, X.F. Xu, et al., Tree2Vector: learning a vectorial representation for tree-structured data. IEEE Trans.
Neural Netw. Learn. Syst. 29(11), 5304–5318 (2018)
7. D.W. Tang, D.M. Lu, D.Q. Xu, Grouping multi-Instance learning method in mural image classification. Chin. J. Image
Graph. 19(5), 708–715 (2014)
8. Q. Wang, D.M. Lu, Composition analysis-based relevance ranking for ancient mural. J. Zhejiang. Univ. Eng. Sci. 46(3),
392–401 (2012)
9. D.W. Tang, D.M. Lu, B. Yang, et al., Measurement of mural image similarity under constraint of overall structure of
contour. Chin. J. Image Graph. 18(8), 968–975 (2013)
10. Y.N. Wang, D.N. Zhu, H.Q. Wang, et al., Classification of paint multi-spectral images in mural paintings based on
convolutional neural network. Adv. Laser Optoelectronics 56(22), 48–56 (2019)
11. Sun F, Study on image data classification of Taoist murals in the Ming and Qing Dynasties in Northern Shaanxi. 2019, 2(10).
12. B. Hao, Research and implementation of the classification algorithm of Chinese ancient character murals based on style
characteristics (Tianjin University, Tianjin, 2017)Cao et al. EURASIP Journal on Advances in Signal Processing (2021) 2021:49 Page 25 of 25
13. L.J. Zhou, Q.W. Li, G.Y. Huo, Y. Zhou, Image classification using biomimetic pattern recognition with convolutional neural
networks features. Computa. Intell. Neurosci. 2017, 3792805 (2017)
14. P. Tang, X.G. Wang, B.G. Shi, X. Bai, Deep FisherNet for image classification. IEEE Trans. Neural Netw. Learn. Syst. 99, 1–7
(2018)
15. Z.L. Hao, X.S. Luo, S.L. Zhao, Single-cell image classification based on same-layer multi-scale kernel CNN. Comput. Eng.
Appl. 54(15), 181–184 (2018)
16. Q.Q. Li, Q. Zou, D. Ma, Q. Wang, S. Wang, Dating ancient paintings of Mogao Grottoes using deeply learnt visual code.
Sci. China Inf. Sci. 2018, 092105 (2018)
17. Q. Zou, Y. Cao, Q.Q. Li, C.H. Huang, S. Wang, Chronological classification of ancient paintings using appearance and
shape features. Pattern Recognit. Lett. 49, 146–154 (2014)
18. Szegedy C, Vanhoucke V, Ioffe S, Shlens J, Rethinking the inception architecture for computer vision. Proc of the IEEE
Conference on Computer Vision and Pattern Recognition (IEEE, Las Vegas, USA, 2016), p. 2818-2826.
19. Z. Liu, C. Yang, J. Huang, et al., Deep learning framework based on integration of S-Mask R-CNN and Inception-v3 for
ultrasound image-aided diagnosis of prostate cancer. Future Generation Comput. Syst. 114, 358–367 (2020)
20. Chowdary MK, Nguyen TN, Hemanth DJ, Deep learning-based facial emotion recognition for human–computer
interaction applications. Neural Comput. Appl. (2021). https://doi.org/https://doi.org/10.1007/s00521-021-06012-8.
21. C.H. Yeh, C.H. Lin, L.W. Kang, et al., Lightweight deep neural network for joint learning of underwater object detection
and color conversion. IEEE Trans. Neural Netw. Learn. Syst. (2021)
22. X.B. Shi, X.J. Pang, D.Y. Zhang, Z. Guo, Image classification based on deep learning mixed model transfer learning. J. Syst.
Simul. 28(01), 167–173 + 182 (2016)
23. Krizhevsky A, Sutskever I, Hinton GE, ImageNet classification with deep convolutional neural networks. Proceedings of
the 25th International Conference on Neural Information Processing Systems (Curran Associates Inc, Lake Tahoe,
Nevada, 2012), p. 1097-1105.
24. He KM, Zhang XY, Ren SQ, Sun J, Deep residual learning for image recognition. Proc of the IEEE Conference on
Computer Vision and Pattern Recognition (IEEE, Las Vegas, USA, 2016), p. 770-778.
25. Simonyan K, Zisserman A, Very deep convolutional networks for largescale image recognition [EB/OL], 2014. 20140924
[20150410. https://arxiv.org/pdf/1409.1556/.pdf.
26. Huang G, Liu Z, Laurens V, et al, Densely connected convolutional networks, IEEE Computer Society. IEEE Computer
Society (2016).
27. Howard AG, Zhu M, Chen B, et al, MobileNets: efficient convolutional neural networks for mobile vision applications
(2017).
28. Zhang RM, Zhang Q, Chen B, A license plate recognition algorithm based on improved Lenet-5. Science Technology
and Engineering 20(12), 4775-4779 (2020).
29. Xiao LS, Yan Q, Deng SY, Scene classification with improved AlexNet model. 12th International Conference on
Intelligent Systems and Knowledge Engineering (IEEE, Nanjing, China, 2017), p. 1-6.
30. Xu ZJ, Wang Y. Glaucoma fundus images classification method based on transfer learning. Computer Engineering and
Applications 57(03), 144-149 (2021).
31. Z.Q. Zhong, J. Yuan, X.Y. Tang, Left and right eye recognition based on convolutional neural network. Comput. Res. Dev.
55(08), 1667–1673 (2018)
32. Y. Du, R. Zhang, A. Zargari, T.C. Thai, C.C. Gunderson, K.M. Moxley, H. Liu, B. Zheng, Y.C. Qiu, Classification of tumor
epithelium and stroma by exploiting image features learned by deep convolutional neural networks. Annals of
Biomedical Engineering 46(12), 1988–1999 (2018)
33. O. Eminaga, N. Eminaga, A. Semjonow, B. Breil, Diagnostic classification of cystoscopic images using deep convolutional
neural networks. JCO Clin. Cancer Inform. 17(2), 1232 (2018)
34. G. Wang, M. Lü, T. Li, G.L. Yuan, W.Z. Liu, Convolutional neural network based on spatial pyramid for image classification.
J. Beijing Inst. Technol. 27(04), 630–636 (2018)
35. WikiArt, WikiArt the online home for visual arts from all around the world, 2016.
36. Wah C, Branson S, Weinder P, The caltech-ucsd birds-200-2011 dataset, 2011.
37. M.E. Nilsback, Z. Andrew, A visual vocabulary for flower classification. Proc. IEEE Conf. Comput. Vision Pattern Recognit.
2, 1447–1454 (2006)
38. Q. Zou, L.H. Ni, Q. Wang, Z.W. Hu, Q.Q. Li, S. Wang, Local pattern collocations using regional co-occurrence factorization.
IEEE Trans. Multimedia 19, 492–505 (2017)
Publisher’s Note
Springer Nature remains neutral with regard to jurisdictional claims in published maps and institutional affiliations.You can also read