USING SEARCH QUERY DATA TO PREDICT THE GENERAL ELECTION: CAN GOOGLE TRENDS HELP PREDICT THE SWEDISH GENERAL ELECTION?
←
→
Page content transcription
If your browser does not render page correctly, please read the page content below
USING SEARCH QUERY DATA TO PREDICT THE
GENERAL ELECTION: CAN GOOGLE TRENDS HELP
 PREDICT THE SWEDISH GENERAL ELECTION?

                             Submitted by
                            Rasmus Sjövill

       A thesis submitted to the Department of Statistics in partial
  fulfillment of the requirements for a one-year Master of Arts degree
              in Statistics in the Faculty of Social Sciences

                              Supervisor
                            Mattias Nordin

                             Spring, 2020
ABSTRACT The 2018 Swedish general election saw the largest collective polling error so far in the twenty-first century. As in most other advanced democracies Swedish pollsters have faced ex- tensive challenges in the form of declining response rates. To deal with this problem a new method based on search query data is proposed. This thesis predicts the Swedish general elec- tion using Google Trends data by introducing three models based on the assumption, that during the pre-election period actual voters of one party are searching for that party on Google. The results indicate that a model that exploits information about searches close to the election is in general a good predictor. However, I argue that this has more to do with the underlying weight this model is based on and little to do with Google Trends data. However, more analysis needs to be done before any direct conclusion, about the use of search query data in election predic- tion, can be drawn. Keywords: Polling, Big Data, Google Trends Data, Political Prediction, Web Search Data.
Contents
1   Introduction                                                                                1

2   Literature Review                                                                           2

3   Data                                                                                        6
    3.1    The Swedes, Google and The Voters . . . . . . . . . . . . . . . . . . . . . . . 12

4   Method                                                                                     14
    4.1    Model Development . . . . . . . . . . . . . . . . . . . . . . . . . . . . . . . 14
    4.2    Prediction Methodology . . . . . . . . . . . . . . . . . . . . . . . . . . . . . 16
    4.3    Joint Analysis . . . . . . . . . . . . . . . . . . . . . . . . . . . . . . . . . . . 17
    4.4    Weight Analysis . . . . . . . . . . . . . . . . . . . . . . . . . . . . . . . . . . 19
           4.4.1   Long-term Model . . . . . . . . . . . . . . . . . . . . . . . . . . . . . 19
           4.4.2   Intermediate Model . . . . . . . . . . . . . . . . . . . . . . . . . . . . 20
           4.4.3   Short-term Model . . . . . . . . . . . . . . . . . . . . . . . . . . . . . 21
    4.5    Weight Selection . . . . . . . . . . . . . . . . . . . . . . . . . . . . . . . . . 22

5   Results                                                                                    24
    5.1    Swedish General Election 2018 . . . . . . . . . . . . . . . . . . . . . . . . . . 24
           5.1.1   Long-term Model . . . . . . . . . . . . . . . . . . . . . . . . . . . . . 24
           5.1.2   Intermediate Model . . . . . . . . . . . . . . . . . . . . . . . . . . . . 25
           5.1.3   Short-term Model . . . . . . . . . . . . . . . . . . . . . . . . . . . . . 26
    5.2    Swedish General Election 2014 . . . . . . . . . . . . . . . . . . . . . . . . . . 27
           5.2.1   Short-term Model . . . . . . . . . . . . . . . . . . . . . . . . . . . . . 27
    5.3    Swedish General Election 2010 . . . . . . . . . . . . . . . . . . . . . . . . . . 28
           5.3.1   Short-term Model . . . . . . . . . . . . . . . . . . . . . . . . . . . . . 28

6   Robustness                                                                                 29
    6.1    Model Specifics . . . . . . . . . . . . . . . . . . . . . . . . . . . . . . . . . . 29
           6.1.1   Search Keywords . . . . . . . . . . . . . . . . . . . . . . . . . . . . . 29
           6.1.2   Change of Pre-election Period . . . . . . . . . . . . . . . . . . . . . . 30
    6.2    County Level Analysis . . . . . . . . . . . . . . . . . . . . . . . . . . . . . . 33
7 Concluding Discussion 35
1    Introduction
We are spending an increasing amount of time on our phones and computers. Searching for
information on the Internet has become a daily routine in our lives, whether it is finding a good
place to eat, your next vacation or finding a new job. It places computing neatly integrated
into our daily lives. This opens the possibility of a complete recording of all aspects of our
life, creating a data driven society where information is stored in a huge data cloud. When it is
made accessible to by scientists it provides a universe of research potential. When combining
the words Internet and searches usually a particular company comes to mind, Google. Previ-
ous research suggests that Google searches could be useful in predicting influenza epidemics
(Polgreen et al. 2008; Ginsberg et al. 2009), goods sales (Choi and Varian 2009; Chamberlain,
2010) and unemployment rate (McLaren and Shanbhogue, 2011; Askitas and Zimmermann,
2009; Suhoy, 2009). This suggests a new data approach, since the Internet has proven to pro-
vide answers to questions that are not even asked. There are over 150 billion searches on
Google every month (internetlivestats.com, 2020). This raises the question, could data from
Google searches help predict the results of the Swedish general election?
    Election prediction is the science of predicting the outcome of an election, based on the
results of a predefined set of methods. Predicting the election outcome is a complex task. In
recent years, the 2016 EU referendum (Brexit election) and 2016 US presidential election are
some famous examples in which the majority of opinion polls wrongly predicted the outcome.
    Recently, a new approach has been developed in the field of electoral prediction which
is based on Internet search data. It is commonly known that when people are interested and
concerned about something, they are likely to search for information about it on the Internet.
The Internet contains a wealth of data about the general public opinions’ on political campaigns,
events and people. This includes information on the general public’s opinions’ they would not
necessarily otherwise reveal. Extracting the views of the public in the given moment into a
model could be of great interest when predicting election results. The paper attempts to tackle
the following problem: Given the right set of search terms, would it be possible to use such
aggregated web statistics to predict election results? If so, are there some underlying logic
behind these predictions or are they simply a matter of luck? Answers to these questions are
important since the aim is to develop a model that can be used to predict upcoming elections.
More specifically, the paper focuses on predicting the vote support for all major political parties
in the Swedish national election by employing three simple models. This is the first paper, to my

                                                1
knowledge, that i.) Predicts the Swedish general election using Google Trends data ii.) Predicts
vote share for all major political parties in an election iii.) Creates models based on different
time horizons iv.) Thoroughly analyses the relationship between Google search proportion and
voting support.
The results indicate that a model, referred to as the Short-term Model, based on party sup-
port measured by the average polls of polling institutes is generally a good predictor for elec-
tions. However, I argue that this has more to do with the underlying voting percentage the
model is based on and little to do with the Google Trends data.
The article is structured as follows: In Section 2. Literature Review, an outlook on the pre-
vious research on predicting general elections with Internet search data is presented along with
the contribution of this thesis to previous studies. In Section 3. Data, Google Trends data is
presented along with keyword selection and the construction of variable that measures Google
search interest and some descriptive statistics about the Swedes use of Google. In Section 4.
Method, a description of the statistical methods and analysis is presented in detail along with
the models used for prediction. Later, in Section 5. Results, the main results of the study are
presented, comparing accuracy measurements for the different models. In Section 6. Robust-
ness, the sensitivity of the results is analysed. Finally, in Section 7. Concluding Discussion,
the main findings and limitations of the thesis are discussed along with recommendations for
future studies.
2 Literature Review
The potential value of search data has become increasingly recognised by researchers and sci-
entists. Recent work suggests that search query data might be useful in economic forecasting
due to its real-time nature and the easiness of data collection. However, the topic is new and
relatively little studied. To my knowledge, Ettredge et al. (2005) were the first to suggest the
use of Internet search data in forecasting. Since then, many studies have researched the use
of Internet search data in various contexts and found different results. For example, previous
research suggests that Google searches could be useful in predicting influenza epidemics (Pol-
green et al. 2008; Ginsberg et al. 2009), goods sales (Choi and Varian 2009; Chamberlain,
2010) and unemployment rate (McLaren, 2011; Askitas and Zimmermann, 2009; Suhoy, 2009)
As aforementioned, search query data has attracted plenty of attention from researchers mainly
2because of its real-time nature and the easiness of data collection. This work mainly focuses
on the part of research dealing with electoral prediction. For better understanding of the re-
search area, related studies using social media data and traditional data are also discussed and
compared with search query data.
The literature review serves three purposes. First, it provides an outlook on the previous
research on predicting general elections with Internet search data and the related field of social
media data. Second, it gives a brief outlook of the traditional polling technique, the field of
survey weighting, and it discusses the limitations and possible advantages of search query data.
Third, it explains the contribution of this thesis to previous studies.
The main goal of any researcher or polling institute whether they are predicting the general
opinion or forecasting election results is to obtain an accurate estimate. Known issues with
traditional opinion polling techniques are related to selection problem in the way voters are
polled. In order to deal with the selection issue, weights are commonly assigned to make the
weighted records represent the population of interest as closely as possible. The weights are
usually developed in a series of stages to compensate for bias arising from, for example, un-
equal selection probabilities, nonresponse, noncoverage and sampling fluctuations from known
population values (Brick and Karlton, 1996).
Many studies have reviewed weighting methods and evaluated them by volume of bias
(Kalton and Flores-Cervantes, 2003; Brick and Montaquila, 2009). Brick and Jones (2008)
reviews bias for different method of weighing. Generally, there is no specific method which
performs better than others when reducing bias. Many of the commonly used methods are in
fact relatively similar and the weighting adjustments they produce are highly correlated (Deville
et al. 1993). Thus, the choice of auxiliary variables and the mode in which they are employed
in the adjustments may be of more significance than the choice of method. When applying
a complex weighting procedure, focus should be on the assumptions of the specific statistical
model and the information it can handle. Methods that limit opportunities to utilize information
about the sample yield higher bias (Brick, 2013). This means that the choice of method should
be taken in relation to the data.
The use of Internet search data in the field of political research and opinion polling is
mostly related to sentiment analysis. Opinion polling based on sentiment analysis has become
more and more popular over the last decade (Liu et al., 2012). Sentiment analysis and opinion
mining is the field of study that analyses people’s opinions, sentiments, evaluations, attitudes,
3and emotions from written language. Opinion mining is traditionally performed by means of
sentiment lexical or dictionaries (Cambria et al., 2012). The most commonly used source of
Internet search data is Twitter data. O‘Connor et al. (2010) connected measures of public
opinion from polls with sentiment measured from text and found strong correlations between
public opinion and tweet texts. This highlights the potential of text streams as a substitute or
supplement to traditional polling, other studies showed that the mere number of political parties
mentions accurately reflects the election results (Tumasjan et al., 2010). Burnap et al., (2016)
used Twitter data to forecast the outcome of the 2015 UK General Election, they exploited
sentiment analysis and prior party support to generate a forecast of parliament seat allocation
that turned out to predict the election result with high accuracy.
Even though the use of social media data in election prediction is beginning to draw more
attention, so also its sceptics. Gayo-Avello (2012) is critical to the use of social media data in
election prediction and the previous research in the field. Gavo-Avello et al. (2011) revealed
that data from Twitter did no better than chance in predicting results in the US congressional
elections. Arguing that as long as the knowledge of the exact demographics of the people
discussing elections in social media is scant, the research will continue to have similar results.
One of the most intriguing possibilities raised by the emergence of social media data is that
it could be used to supplement traditional methods for public opinion polling, especially the
sample survey, because social media data offer considerable advantages in comparison with
surveys in terms of the speed with which they can be acquired and the cost of collection.
However, the selection bias in social media is clear, not everyone uses it, and people who
do are not randomly distributed throughout the population. The use of Google Trends data
might solve this problem as Google is widely used by the general public. Google Trends has
in various fields been proven an effective tool in prediction, nowcasting and forecasting. It
also has considerable potential benefit in comparison with social media data, as it requires no
complex sentiment detection.
Research in the field of political prediction using Google Trends data has achieved mixed
results. Lui et al. (2011) found that Google Trends was in general not a good predictor for the
2008 and 2010 US elections, while Polykalas et al, (2013a); Askitas, (2015a); Mavragani and
Tsagarakis, (2016) successfully predicted Greek elections using Google Trends data. Gener-
ally, studies using search data rely on the assumption that the volume of keywords searched and
the chatter in social networks are revealing the current thinking of a large and quickly growing
4section of the population (Khabrov and Cybenko, 2010).
Like traditional survey data, search query data needs to be weighted for differences in sam-
pling versus target population. Known issues are related to demographic bias and search term
popularity for different parties. Polykalas et al. (2013a); Polykalas et al. (2013b) who predict
general elections use the following methodology to account for these differences, they consider
two cases i.) In cases where the search behavior of the electorate of each party does not change
drastically between consecutive elections, they create a weight based on the ratio between rel-
ative search popularity and normalized election result from the previous election. ii.) In cases
where the search behavior does change, more specifically if the variances differ in absolute val-
ues more than 10 percent for the calculated weight, then they abandon their calculated weight
and solely base the prediction on data prior to the forecasted election. Other methods, such as
Mavragani and Tsagarakis, (2016); Askitas (2015a); Askitas (2015b), simply studies the ratio
between two search terms to predict voting results. The results of previous studies indicate
that the use of search terms may influence the accuracy of the predictions, therefore a proper
adjustment of the parameters is required, considering the framework inside which each election
race takes place.
There has only been a handful of studies with the aim of investigating the use of aggre-
gated web statistics to predict election results. Askitas (2015a); Askitas (2015b); Mavragani
and Tsagarakis, (2016); Polykalas et al. (2013a); Polykalas et al. (2013a); all have two things
in common, they study a binary outcome and apply a relatively simple model with modest data
adjustments. The setup of studying only two outcomes might be the reason why they overall
achieve good results. Lui et al. (2011) argues that there are strong limitations on the predictabil-
ity power of Google Trends since it is near impossible to determine the circumstances behind
a user’s search for the profile of a certain candidate. In related studies, Reilly et al. (2012)
demonstrates that higher Google searches for ballot measures’ names and topics in state one
week before the 2008 Presidential election correlate with actual participation on those ballot
measures. This effect was found across states and suggests that Internet search data may help
political scientists predict political phenomena, particularly at the level where data is hard to
come by.
In conclusion, research in the field of political prediction using Google Trends is a new and
relatively small studied area. There is clearly room for more research in the topic in order to
determine if a model that is mainly based on Google Trends data can predict elections. Ar-
5guably there is significant potential in Google Trends data for predicting the outcome of future
elections due to its real time nature and easiness of data collection. It also has considerable
potential benefits in comparison with social media data, as it requires no complex sentiment
detection.
This study extends the previous literature on the topic by i.) Developing models that pre-
dicts vote share for all major parties in a general election. ii.) Predicting the Swedish general
election. iii.) Thoroughly analyses the relationship between Google search proportion and vot-
ing support. The study tries to answer the following questions: Can a model based on Google
Trends data predict elections? If so, are there some underlying logic behind these predictions
or are they simply a matter of luck? Answers to the questions have both practical and academic
relevance. Forecasters would need to know in which occasions Google search volumes could
offer advantage and on which forecast horizons the data could be useful. Academically, the
answers could help to describe Internet search behaviour in relation to the party popularity in
terms of voting results.
3 Data
The primary data source for this thesis is the Google Trends database by Google Inc (Google
Trends, 2020). The Google Trends database measures volumes of Google searches. Specifi-
cally, it lists how many searches that have been made on a specific search term, compared to
the total amount of Google search queries for the selected terms in the same time period.
Google Trends provides keyword-related data including search volume index and geograph-
ical information about search engine users. Google Trends does not report the exact number of
search queries made with a specific keyword, but an index, from 0 to 100, which describes the
intensity for a selected keyword over a selected time period. Google Trends data are available
globally from 2006. Google collects the data using the IP addresses. The data is available on
different time horizons, from searches per minute up to monthly searches. In Sweden, the data
is published both on a national and county level. To summarize, Google Trends data consists
of what the Internet users search for on Google.
This section, which covers Google Trends data, focuses on three parts: i.) The selection
of relevant search terms. ii.) The construction of a variable which describes search volumes
for the relevant search terms. iii.) Discussion regarding the benefits and limitations of Google
6Trends data.
The focus of this thesis is to find out whether it is possible to predict the opinion of the
Swedish people and consequently forecast the actual election results for the Swedish general
election using Google searches. However, the number of different Google searches that might
be related to the election and political parties are large. In order to use the Google data, one
must select which specific search terms to use. Therefore, the first task is to select a set of
relevant search terms that could describe party preference for each of the major parties in the
Swedish general election.
In order to examine whether a specific word should be included in the set of keywords for a
given party, I apply the following rules: examine whether the variation of web interest presents
peak values around general elections and whether it, according to research, has an influence
when voting for a specific party. The data is collected daily on the national level.
Figure 1: Relative search interest in Sweden over time for Moderaterna and Sverigedemokra-
terna.
The names of all parties are included. Looking at the time period a few weeks prior to the
election there are clear spikes in interest of the chosen search terms, party names, meaning that
the raw number of searches for these search terms peaks around elections, there is a higher
variation in this period compared to any other time. This can be illustrated by Figure 1, which
displays the relative search interest in Sweden for Moderaterna (M) and Sverigedemokraterna
(SD). During election periods there is a spike in search volume for search terms Moderaterna
7and Sverigedemokraterna, most notably during the general elections 2006, 2010, 2014 and
2018 but also during EU-election 2014.
Figure 2: Relative search interest in Sweden over time for S and SD.
Using party names is obvious, what influences an individuals voting decision for a party is
most likely the party itself. However, some parties are more than others associated with their
acronym. People who search on a specific party might use the party acronym instead of the full
party name, thus these searches needs to be captured in order to collect all party name related
searches.
Looking at the differences in search intensity, there are three parties whose acronym search
is at its highest around election. These are for parties: Sverigedemokraterna (SD), Miljöpartiet
(MP) and Kristdemokraterna (KD). Including these but not the acronyms for the others might at
first glance sound strange, however, the goal is to try to catch any set of words for each specific
party that gives valuable information in order to predict the party interest at any given time.
Figure 2 shows the search interest over time for S and SD. Searches for S have no relation
with the general elections whatsoever but for SD there is clear increase in searches in election
periods, illustrating that people searches for SD for information about Sverigedemokraterna.
This indicates that it should be reasonable to include searches for SD in the analysis given the
conditions stated previously but not the acronym for Socialdemokraterna (S). Differences in
number of search terms per party will be taken into account in our model.
According to research, it is parties that win elections in Sweden, not party leaders, but as
8party loyalty diminishes, party leaders can play an increasingly important role for the electorate
(Anders Lindholm, 2013). However, the size of party leader effects has proven to be very small
in party-oriented multi-party systems such as the Swedish (Aarts et al., 2013). There exist two
types of party leader effects on the voter’s decision. The first one is directly associated with the
party leader, one votes on a party because of the leader independently of party preference. The
second, party leaders can have indirect effects on voters that shift their party preference over
time, thereby affecting voting behaviour (Peter Esaiasson, 1985).
However, it is difficult to isolate the effects of the messenger (party leader) from the mes-
sage (the party’s political program). Still, there are individual examples of clear party leader
effects (Oscarsson, 2017). Therefore, it seems valuable to include the name of party leaders in
the analysis in order to capture the effect directly associated with the party leader. The relative
search interest for all party leaders have been analysed, with search interest peaking around
elections.
Figure 3: Relative search interest in Sweden over time for Jan Björklund and Jimmie Åkesson.
For example, Figure 3 shows the relative search interest in Sweden for leaders of political
parties Liberalerna (L), Jan Björklund, and Sverigedemokraterna (SD), Jimmie Åkesson. There
are clear spikes in interest of the chosen search terms during election periods, meaning that the
raw number of searches for these search terms peaks around elections.
In summary, a total of 31 search terms related to party preference have been selected.
These search terms are the name of the party, party acronyms and the name of the party
9leader(s) at a given time. Specifically, these search terms are used: Sverigedemokraterna, So-
cialdemokraterna, Miljöpartiet, Vänsterpartiet, Moderaterna, Centerpartiet, Folkpartiet, Lib-
eralerna, Kristdemokraterna, Stefan Löfven, Jimmie Åkesson, Annie Lööf, Ulf Kristersson,
Jonas Sjöstedt, Lars Ohly, Ebba Busch Thor, Jan Björklund, Isabella Lövin, Gustav Fridolin,
Åsa Romson, Göran Hägglund, Fredrik Reinfeldt, Lars Leijonborg, Maria Wetterstrand, Peter
Eriksson, Mona Sahlin, Göran Persson, Maud Olofsson, sd, mp, kd.
The following part describes the construction of the search query variable, Google search
interest, from the selected search terms. The variable represents the ability to predict the party
preference for a general election and its ability to do so is possible to test in a statistical model.
The variable is constructed in the following way, within limits of the Google Trends. First,
the search terms are downloaded using a reference search term, since Google Trends does not
report the exact number of search queries made with a specific keyword, but an index, from 0 to
100, making the terms in relation to each other. The reference term is the search term with the
highest amount of searches during the selected time period, thus is varies depending on time
period. The advantage of this method is that it gives each search term a weight based on its
search volume, even though the actual search volumes are not directly available from Google
Trends. Secondly, all search terms related to a specific political party is aggregated, creating a
party specific search interest. Lastly, the number of search queries made for a specific political
party for a given time period is divided by the total number of search queries made in the same
time period, resulting in the proportion of all Google searches that were made for any given
party in relation to every other party.
In summary, the variable, from a mathematical standpoint, is described in the equations
below:
PN
i=1 keywordi,p,t = P artyp,t . (1)
P arty p,t
Pn = Google search interestp,t . (2)
p=1 P artyp,t
Let keywordi,p,t denote the amount of searches with a set of keywords, i, for a given polit-
ical party, p, and time, t. Let also P arty p,t denote the total amount of search queries for party,
p, at time, t. Then the unit of measurement for Google search interestp,t is P arty p,t divided
by the sum of all P arty p,t for a specific party at a given time period. From equation 2 it is easy
to see that the search intensity depends on keyword, i, party, p, and the search interest for all
10other parties in time, t.
Whatever data one decides to use comes with its own benefits and limitations. Google data
is more easily accessible and can provide important information in short time and without cost
compared to surveys. Google Trends data is available in real time, while surveys first needs to
be collected and processed. This gives the Google data a meaningful lead when trying to predict
the present or even the future (Choi and Varian, 2012). The difference in publication lag is one
of the main motivations in terms of why Google data might improve the predictions of opinion
polls as the delay in data presents a limitation to accurately assess current climate. Another ap-
pealing property as statistical indicators include the potentially vast sample of respondents. As
in most other advanced democracies (Prosser and Mellon, 2018), Swedish pollsters have faced
extensive challenges in the form of declining response rates (Vernersdotter, 2016). People may
not be willing to reveal their real opinions in an increasingly polarised political climate. Google
Trends data could avoid problems associated with non-response or inaccurate responses.
However, there are difficulties with using search data. Internet use remains highly correlated
with factors such as age, indicating that the sample may not be representative. There are also
issues surrounding the collection of data in contrast to traditional survey methods, they are
collected as a by-product of normal activity, rather than asking individuals to respond to specific
survey questions which means that information is collected on a wider range of issues, rather
than just on a few pre-determined questions. This creates the problem of white noise in the
time series, making it unpredictable. It is not possible to predict from a set of random events.
One big uncertainty when using Google Trends data revolves around the Google search al-
gorithm. Lazer et al. (2014) argue that the Google search algorithm is constantly changing, and
that it is hard to train the forecasting model using past data. Part of this change is initiated by
Google itself. Lazer et al. (2014) point out that, for example, Google’s recommended search
algorithm may increase the relative volumes of certain search queries. The search behaviour
is thus not only exogenous determined but also endogenously with respect to the search en-
gine. Consequently, it is relevant to understand the search algorithm in order to produce robust
forecasts.
In this thesis, the keyword selection is based on prior knowledge of Swedish voters and
reasoning. The underlying idea is that, during the pre-election periods, actual voters of a party
are searching for that party or party leader(s) on Google, with the argument being that this is
adequate to establish a relation between the search term popularity of a party, during the pre-
11election period, and the number of votes that this party will finally receive. This is a strong
assumption, not every person that searches for a party, during the pre-election period, will vote
for that party. Also, the relation between the search term popularity and the final election results
may differ between the various parties. The profile of the potential voters of one party may be
more Internet friendly than the respective profile of another party. In order to reduce the noise
in our predictions, generated from differences in profile of the potential voters for one party,
we need to know more about the relationship between Swedish voters and Google.
3.1 The Swedes, Google and The Voters
Google’s dominance in the search engine field has had a substantial impact on how people
navigate the Internet. In the beginning of 2020 Google had a 95.6 percent market share of the
search engine market in Sweden (Statcounter, 2020).
In 2018, 97 percent of the Swedish Internet users searched for information on Google regu-
larly with 61 percent using Google every day. Google is particularly connected to the younger
generations’ daily life, 74 percent of ages between 16 and 65 uses Google daily in contrast to
the oldest age group, consisting of people over the age of 76, who have the lowest daily use
with 33 percent. However, even in that age group 86 percent uses Google on a regular basis
(Svenskarna och internet, 2018).
Ahead of the general election 2018, many more than before turned to the Internet for politi-
cal information. During the previous general election, 2014, less than 50 percent researched for
political information on the Internet (Svenskarna och internet valspecial, 2018). The trend is
particularly evident among first-time voters, who also value web pages as one of the most im-
portant sources of information before the election (Svenskarna och internet valspecial, 2018).
Figure 4 graphs answers to the question: How often do you take note of political information
on the Internet?
12Figure 4: Answer to the question: How often do you take note of political information on the
Internet?
Younger people take note of political information on the Internet more than older people.
Roughly 50 percent of people between 16 and 35 take note of political information every month
on the Internet with the percentage diminishing, on average, the older the age group, with the
percentage being half of that for people over the age of 75.
Figure 5: Answer to the question: Have you searched for a politician on the Internet?
The same trend can be seen in searches for the answers to the question: Have you searched
for a politician on the Internet?, Figure 5, with the younger the age group you belong to the
more likely it is that you do search for politicians on the Internet. Looking at the share of voters
13for whom have already decided who they are going to vote for at the election versus people who
are undecided, there is no difference in relation to number of searches (Internet och Svenskarna
valspecial, 2018).
Statistics on eligible voters are published 30 days before election day when the electoral
register is determined. (Valmyndigheten, 2020) Thus, before the election we know for a fact
the differences in size of age groups for eligible voters. However, eligible voters and actual
voters may differ. Looking at the actual voters for the 2018 general election and comparing
with number of Google searches and voting size per age group there is a clear difference (SCB,
2019). Indicating that young people are most likely over representative in number of Google
searches, and thus in the sample.
4 Method
The following section presents the main methods used in this thesis to answer whether Google
searches can be used to predict the results of the Swedish general election but also the analysis
to answer the sub-question: Is there any underline logic behind these predictions or are, they
simply a matter of luck? In order to do so three prediction models, based on the assumption:
That, during the pre-election period actual voters of one party are searching for that party on
Google, are introduced. This assumption enables me to treat the data as a version of survey data.
Thus, the data can be handled in such manner, it can be weighted like any other survey to reduce
bias arising from differences in sample versus target population. The method development and
prediction models are described in the following sections.
4.1 Model Development
The goal of any researcher or polling institute, whether they are predicting the general opinion
or forecasting election results, is first and foremost to predict the target of interest with as high
accuracy as possible. For traditional surveys, weights are commonly assigned to respondent
records in a survey data file in order to make the weighted records represent the population of
inference as closely as possible, to eliminate bias arising from for example, unequal selection
probabilities, nonresponse, noncoverage and sampling fluctuations from known population val-
ues (Brick and Karlton, 1996). Methods that limit opportunities to utilize information about the
sample yield higher bias (Brick, 2013). This means that the choice of method should be taken
14in relation to the data.
In contrast to regular survey data, Google Trends data does not provide information about
the actual searcher as the data is collected as a by-product of normal activity, rather than asking
individuals to respond to specific survey questions. Thus, we do not know the social character-
istics of the individual searchers i.e. there is no individual data. However, it is clear that there
are differences in the sample versus the target population, the voters in the general election.
Also, the relationship between the search popularity and election results may differ between
various parties due to other factors. One important characteristic when it comes to Internet data
revolves around the Internet friendliness of different potential party voters. The profile of the
potential voters of one party might be more Internet friendly than the respective profile of
another party. In addition, not every person that searches for a party will vote for that party,
some keywords are likely have higher search interest than others in general, independent of
party vote.
There is a clear selection problem introduced by the selection of individuals and data for
analysis in such a way that randomization is not achieved, the sample obtained is not repre-
sentative of the population intended to be analyzed. In order to predict the Swedish general
election with accuracy one needs to take these differences into consideration. To deal with
the selection problem a weight, that accounts for differences generated from demographics of
voters, general search interest and Internet friendliness of voters, is introduced. The weight
assumes that the selection differences are constant over a given time period. Three models are
constructed,Long-term, Intermediate, Short-term, which differ with respect to the underlying
voting support and time period in which the weight is calculated.
Voters have a tendency to align their past votes with their present preference. Thus, the
Long-term model is introduced which assumes that selection differences are constant between
elections. Since general elections in Sweden are only held every fourth year it might be to naive
to assume that selection differences are constant over such a broad time period since there are
changes in keywords (party leaders changes) but also Internet use within the sample. Therefore
two models based on shorter time spans are presented. The Intermediate is based on SCBs
Party Preference Survey (PSU) which is normally assumed to be the most reliable opinion poll
in Sweden. PSU is released every six months. Lastly, The Short-term model is introduced
which is based on the average opinion per month from polling institutes. The model can so
forth utilize information from differences in the ratio between relative search popularity and
15voting support closely to the election date.
In summary, the three models presented are: Long-term, Intermediate, Short-term.
The Long-term model, uses the ratio between relative search popularity and normalized
election result from the previous elections as a weight.
The Intermediate model, follows the same principle but instead uses SCBs Party Prefer-
ence Survey (PSU) as the normalized voting percentage.
The Short-term model, uses the ratio between relative search popularity and normalized
average opinion per month from polling institutes as a weight.
The construction of the main variable, P arty prediction p,t , which represent the prediction
of election result for a election, along with the corresponding weight variable for all models
is described in the section below. Later, the three models each are presented in more detail
along with model discussion, weight analysis and weight selection for each model for the 2018
general election.
4.2 Prediction Methodology
First, the average Google search interest (see Section 3. Data, Equation (1) and (2) for the
methodology behind the construction of this variable) for given party is calculated for a given
month, utilizing that a large percentage of the population searches for political information
every month. Secondly, the average Google search interest is divided by the sum of all parties
average Google search interest for that month, arriving in the proportion of Google Search
interest for a specific party in relation to all other parties over the last month at the given
time period. Thirdly, the proportion of Google Search interest for a party is divided by the
normalized voting percentage of that party for the given time period, creating a weight for each
party at the given time period. Lastly, using the party weight, the normalized search proportion
for the period leading up to the election is divided by the party weight, creating the party
percentage forecast for the given general election. The pre-election timeline corresponds to the
day before the election and every day up to 30 days back. According to data gathered, volume
of discussion during general election peaks during the month leading to election and a majority
of Swedes searches on Google each month, thus this timeline is used.
The variable, from a mathematical standpoint, is described in more detail in the equations
below.
16PN
Google search interesti,t,p
Pi=1
N = Google proportionp,t . (3)
i=1 Google search interesti,t
The sum over number of days, N , of Google search interesti,t,p for given party, p, at
time, t, is divided by the sum of all parties average Google search interesti,t,p , creating the
proportion of Google search interest, Google proportionp,t , for a given party over a given time
period, t. In order to compensate for the differences in search behaviour in relation to actual
voting percentage and the fact that there is a difference in the number of search keyword for
different parties the following weight is created for each party.
Google proportionp,t
N ormalized voting percentagep,t
= W eightp,t . (4)
Google proportionp,t is divided by the N ormalized voting percentagep,t creating the W eightp,t .
The weight is then analysed, and a fixed weight is selected for each party depending on model
and election. Lastly the weight is utilized in the forecast by dividing the Google proportionp,t
for the pre-election period, t, by the corresponding party W eightp , which is later normalized
to 100 percent making the P arty prediction p,t for a specific party at a given election.
[Google proportionp,t / W eightp ]
PN = P arty prediction p,t . (5)
p=1 [Google proportionp,t / W eightp ]
4.3 Joint Analysis
In this section, the joint analysis method, which aim to provide descriptive analysis on the re-
lationship between Google proportion and the normalized voting support, is presented. Google
proportion describes search activity for a political party in relation to every other party. De-
scriptive information on the dynamics of normalized party support and Google proportion is
provided by their cross-correlation function. The cross-correlation function is the joint auto
correlation function of two series. Analysing the cross-correlation function serves two pur-
poses i.) it tells how strong the correlation between the normalized party support and Google
proportion is. ii.) tells whether, for example, current Google proportion are more strongly
correlated with future party support than with the present.
The sample cross-correlation is defined by the ratio,
PN
Xit − X̄i Xjt − X̄j
t−1
qP
N 2 PN 2 = ρ̂i,j . (6)
i=1 (Xi − Xi ) i=1 Xj − X̄j
17Cross-correlation between Xi and Xj is defined by the ratio of co-variance to root-mean
variance. The analysis of the cross-correlation correlation function could help explain the re-
lationship between our main variable and determine if, indeed, Google Trends data is a useful
when predicting elections but also if searches for a political party is more related to the present,
past or future party support.
The analysis will be carried out in the simplest case, analysing the relationship between
party name popularity and voting support. This is done on the time period between the 2014
and 2018 elections. For every month between the elections, the average opinion per month for
polling institutes: Demoskop, Sifo, Novus, Ipsos, Inizio, Yougov and Sentio is compared to the
search proportion for each party.
Table 1: Cross-correlation for all parties at different lags.
Party/Lag -3 -2 -1 0 1 2 3
C 0.584 0.577 0.577 0.555 0.549 0.491 0.481
L -0.005 0.033 0.247 0.156 0.057 0.295 0.315
M -0.159 -0.211 -0.283 -0.304 -0.371 -0.365 -0.391
KD 0.01 0.2 0.238 0.375 0.423 0.399 0.277
S 0.132 0.065 0.13 0.183 0.099 0.153 0.17
V 0.27 0.301 0.294 0.335 0.235 0.231 0.139
MP -0.141 -0.113 -0.08 0.019 0.028 0.001 0.027
SD -0.024 -0.018 0.081 0.069 -0.123 -0.22 -0.252
Do Google search volumes on party name predict voting support? As a simple summary
of the temporal relationship between the voting support and the Google proportion, Table 1
displays the values of the estimated cross-correlation function for all parties with the pattern of
cross correlations displayed for lag of different order. The main observation is that the values of
the cross-correlation function between present voting support and Google searches appear to be
larger on average than the case of lags. This suggest that it is reasonable to use Google searches
during a given month to predict the voting support at the same time period. However, the cross-
correlation for most parties are low and varies over time. All cross-correlations are positive at
lag 0 except for M, meaning that higher searches on M indicates lower voting support. This
suggest that the impact of party name searches might be small.
184.4 Weight Analysis
In the three corresponding subsections, the weights for all parties for each model are analysed in
detail including model specifics, the analysis focuses on the 2018 general election. Analysis of
the weights are of most importance, since it shows the relationship between search proportion
and normalized voting percentage. For Google Trends to be a good predictor of party support
one should expect these trends to be stable over time or otherwise there should be a clear
explanation of any deviation in trend for a given period. This is since if the weight is constant
over time, one could use the previous weight from time T to perfectly predict the general
opinion in T+1. The standard deviation will be analysed for weight stability, a low standard
deviation indicates that the model is stable, i.e. the relation between proportional Google search
interest and normalized party support is stable over time.
4.4.1 Long-term Model
The Long-term model is based on the model created by previous researchers, utilizing previous
pre-election periods to create the party weights. The weight is constructed by dividing the
Google proportion for each party over the 30 days before the given election by the normalized
election result for each party at the corresponding election year. In Table 2, the weights are
shown for the 2006, 2010, 2014 general election, including the average weight for all elections
and the standard deviation.
Table 2: Weight for political parties over time, Long-term model.
Political Party 2006 2010 2014 Average STD
C 0.96 1.33 1.36 1.22 0.22
L 1.77 1.453 1.63 1.61 0.16
KD 1.70 1.37 1.49 1.52 0.17
MP 2.86 1.69 1.85 2.13 0.63
M 0.55 0.45 0.48 0.49 0.05
S 0.44 0.44 0.43 0.44 0.003
SD 2.92 3.75 2.00 2.89 0.88
V 2.01 2.00 1.55 1.85 0.26
The weight displays the difference between the search interest for a party and the normal-
19ized election result. MP, SD have both an average weight of over 2, meaning that they have
more than twice the search frequency compared to election result. Parties with 3 or 4 keywords
have on average a higher weight (SD, MP, KD). Parties, for example V, who have stronger
support in the younger vote groups have on average a higher weight.
The weight varies most for MP and SD. For MP the change is high between the 2006 and
2010 election and for SD between all elections, indicating that the weight might have a hard
time capturing big percentage swings in number of votes for parties between elections since
both parties’ support changed drastically between the stated elections. This suggest that the
Long-term model would be a bad predictor for elections and consequently, that a four year
time span between weights might be too long.
4.4.2 Intermediate Model
Trying to deal with the fact that the long-term model has a hard time capturing big percentage
changes in number of votes for parties between elections, suggesting that the time frame of
four years between each weight might be too long, an intermediate model is proposed. The In-
termediate model weights for the 2018 prediction are constructed two times per year between
the 2014 and 2018 elections. The weight is created in the same manner but instead uses SCBs
Party Preference Survey (PSU) as the normalized voting percentage. The average search pro-
portion for that given month is calculated and divided by the PSU normalized voting support
percentage. PSU presents "election results if an election were to be held today". PSU is re-
leased two times per year, in November and May, and is generally considered to be the most
accurate opinion-poll in Sweden due to its vast sample size.
In Figure 6 the weights for each party are shown over the duration of time.
The weight varies most for parties MP and KD. The big rise in weight for MP in May 2016
can probably be explained by the fact that the party had a change in spokesperson, making the
relative searches higher for that time period than in general. The shift in KDs weight between
November 2014 and May 2015 can possibly be explained by the change of party leader.
Table 3: Mean weight and standard deviation for all parties, Intermediate model.
Weight C L M KD S V MP SD
Mean 0.86 1.03 0.38 2.65 0.39 0.92 3.38 2.08
STD 0.15 0.27 0.09 0.90 0.05 0.19 1.21 0.41
20Figure 6: Weight for political parties over time, Intermediate model.
Table 3 demonstrates the mean weight and standard deviation for all parties. The standard
deviation indicates that the model looks stable, i.e. the relation between proportional Google
search interest and normalized party support is stable. However, one should take into consider-
ation the shift in weight for MP and KD and be more conscious for parties with higher standard
deviation as for which weight to use for these parties. The model indicates that change of search
terms, for example a change in party leader, have an impact on the search volume, meaning that
one needs to take this into account when using Google Trends as a predictor for elections, since
different party leaders have a difference in search activity. Also, the change of party name
of L might have a effect on the search interest for that party, since the old name, Folkpartiet,
might generate a different general search interest. This suggest that it would be suitable to use
a model which is solely based the keywords used when measuring the Google proportion for
the pre-election period, which the election prediction is based on.
4.4.3 Short-term Model
The Short-term model uses the average opinion per month from polling institutes: Demoskop,
Sifo, Novus, Ipsos, Inizio, Yougov and Sentio in the run up to the 2018 general as the normalized
voting percentage. The party weights represent the difference between relative search popular-
ity per month and the average opinion. The model has an advantage compared to the other
two models, it only consists of the same search terms which are used when measuring the pre-
election Google proportion. The other models’ weights are based on old party leaders and old
21party names which might have other search frequency compared to the keywords for the 2018
election.
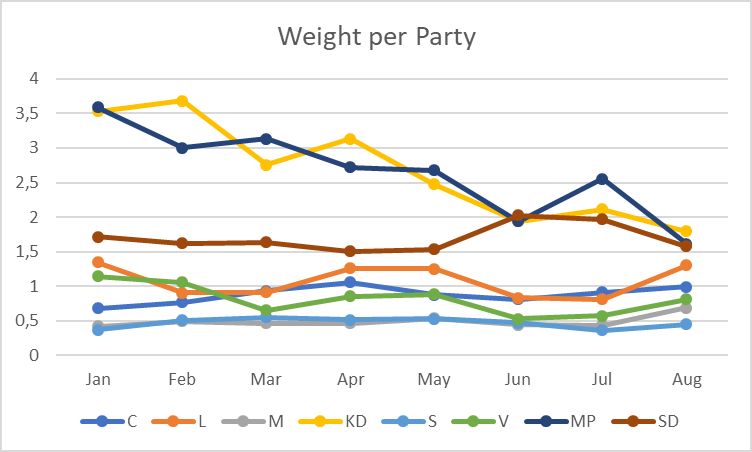
Figure 7: Weight for political parties per month 2018 leading up to the election, Short-term
model.
Figure 7 illustrates the weight for the political parties for every month, 2018, leading up to
the election. Most parties have a stable weight with the exception of MP and KD, who have a
clear downwards trend.
Table 4: Mean weight and standard deviation for all parties, Short-term model.
Weight C L M KD S V MP SD
Mean 0.88 1.08 0.49 2.68 0.47 0.82 2.65 1.70
STD 0.12 0.23 0.09 0.72 0.07 0.22 0.64 0.20
Considering the standard deviation, Table 4, The model looks to be the most stable so far.
The weight varies most for L, KD, MP and V, indicating that the model might be worse at
predicating these parties.
4.5 Weight Selection
The weights for all the constructed models vary, more or less, depending on the model in ques-
tion and the specific party. For Google Trends to be a good predictor of party support one
22should expect these trends to be stable over time or otherwise there should be a clear expla-
nation of any deviation in trend for a given period. Factors that can change search behaviour
include underlying changes such as variations in search variables, changes in search behaviour
in the population due to changes in Internet use (for example over the years more older people
use the Internet) but also time specific changes such as political scandals and personal matters
related to party leaders.
The weight analysis suggest that, when deciding which weight to be used in the prediction,
the decision should be taken in consideration with the average weight, the ongoing trend and
any explainable shifts in search proportion.
It is clear that trimming the data for noise is of utmost interest when using search query data.
However, when predicting an election after it has already occurred, one needs to be careful of
such approach as it is easy to trim the data such as it perfectly predicts the election i.e. drawing
conclusion from noise rather then trends.
Therefore, when considering the average weight, the ongoing trend and any explainable
shifts in search proportion, the last registered weight for each model is used for the prediction
as it best fulfils the guidelines listed above and best enables me to answer the research question,
to produce a robust model which can be used to predict upcoming elections.
23Table 5: Prediction Swedish general election 2018, Long-term model.
Party Election Prediction Absolute 2014 2014
Result Deviation Election Absolute Deviation
C 0.087 0.066 0.022 0.064 0.024
L 0.056 0.053 0.003 0.057 0.001
M 0.202 0.283 0.082 0.243 0.042
KD 0.064 0.070 0.006 0.048 0.017
S 0.287 0.269 0.018 0.323 0.036
V 0.081 0.056 0.026 0.060 0.022
MP 0.045 0.051 0.006 0.072 0.027
SD 0.178 0.153 0.025 0.134 0.044
Mean Deviation 0.023 0.026
5 Results
5.1 Swedish General Election 2018
This section presents the forecast results for the 2018 general election for each of the models
described in Section 6. Models. Each forecast is based on the searches during the pre-election
period of the 2018 general election. The timeline corresponds to the day before the election
and everyday up to 30 days back. To be specific, search interest per day between 9th August
2018 to 8th September 2018 is used. The weight used for each model is the last registered,
for example for the long-term model it is the weight from the 2014 election. Every model is
compared to the voting support for which the last weight of each respective model is based.
Comparing the prediction with the normalized voting support can show if Google Trends im-
proves the forecast. The accuracy on the models are analysed by studying the deviation from
the normalized election results.
5.1.1 Long-term Model
In Table 5, the party percentage predictions for the Long-term model along with the correspond-
ing election results for the 2018 election as well as the absolute deviation between prediction
and election results are presented. The overall mean deviation is 0.023, with the prediction be-
ing particularly good for parties: L, KD, MP. However, the prediction for the rest of the parties
24is quite inaccurate, especially the prediction for M, with it being 28.3 percent, compared to the
normalized election results of 20.2 percent. As indicated when analysing the weights from the
previous election, for which this prediction is based on, the Long-Term model has a hard time
capturing big swings in voting support between elections. Comparing it with the 2014 election
results, if it would be used as a prediction for 2018 election, there would be a mean deviation
of 0.026. This is almost identical with the model prediction.
5.1.2 Intermediate Model
Table 6: Prediction Swedish general election 2018, Intermediate model.
Party Election Prediction Absolute SCB SCB
Result Deviation May 2018 Absolute Deviation
C 0.087 0.104 0.016 0.090 0.002
L 0.056 0.064 0.008 0.045 0.010
M 0.202 0.261 0.059 0.233 0.031
KD 0.064 0.034 0.030 0.030 0.034
S 0.287 0.247 0.040 0.291 0.004
V 0.081 0.091 0.010 0.076 0.005
MP 0.045 0.032 0.013 0.044 0.001
SD 0.178 0.168 0.010 0.191 0.012
Mean Deviation 0.023 0.013
The Intermediate model, Table 6, overall performs almost identical as the Long-term model,
with a mean deviation of 0.023. M is also for this model prediction the party with the high-
est inaccuracy in absolute terms. The model predicts that both KD and MP will drop under
the 4 percent legal electoral threshold, and so forth lose their place in the Swedish parliament.
Comparing the prediction with the normalized voting percentage for used for the weight con-
struction, SCBs Party Preference Survey (PSU) Maj 2018, if it would have been used as a
prediction of the final election results it would have had a mean deviation of 0.013. Thus, the
model on average performs worse than the PSU from 4 months prior to the election.
25Table 7: Prediction Swedish general election 2018, Short-term model.
Party Election Prediction Absolute Polling Average Polling
Result Deviation Aug 2018 Absolute Deviation
C 0.087 0.092 0.004 0.086 0.001
L 0.056 0.062 0.006 0.060 0.004
M 0.202 0.189 0.013 0.184 0.018
KD 0.064 0.056 0.008 0.052 0.012
S 0.287 0.253 0.034 0.249 0.038
V 0.081 0.106 0.025 0.104 0.023
MP 0.045 0.053 0.009 0.056 0.011
SD 0.178 0.189 0.011 0.209 0.031
Mean Deviation 0.014 0.017
5.1.3 Short-term Model
The Short-term model, Table 7, is the model that performs best overall, with a mean deviation
from the election result of 0.014, with the highest deviation from the normalized election results
being for S. Comparing the mean deviation with the one for the average opinion for August
from polling institutes, 0.017, it has overall a better accuracy. If we compare it with all polling
institutes final predictions, which together had an average error per party of 0.016 percentage
points (Oleskog Tryggvason, 2018), the model performs better.
265.2 Swedish General Election 2014
The model prediction for the 2014 general election for the Short-term model is presented below.
As both the Long-term model and Intermediate model is determined to be poor, due to high
inaccuracy and lack of improvement compared to the normalized voting percentage for which
the models rely on, they are not further included in the analysis. The forecast for the 2014
election is based on the average searches during the pre-election period, 14th August 2014 to
13th September 2014.
5.2.1 Short-term Model
Table 8: Prediction Swedish general election 2014, Short-term model.
Party Election Prediction Absolute Polling Average Polling
Result Deviation Aug 2014 Absolute Deviation
C 0.064 0.068 0.004 0.053 0.011
L 0.057 0.073 0.016 0.068 0.012
M 0.243 0.239 0.004 0.231 0.012
KD 0.048 0.047 0.001 0.045 0.002
S 0.323 0.323 0.000 0.318 0.005
V 0.060 0.072 0.012 0.072 0.012
MP 0.072 0.093 0.021 0.106 0.034
SD 0.134 0.087 0.048 0.107 0.027
Mean Deviation 0.013 0.014
The Short-term model is based on the normalized average opinion per month from polling
institutes: Demoskop, Novus Opinion, Sentio, Sifo, Ipsos, Yougov and United Minds. The
predictions for the 2014 general elections for the short-term model, Table 8, is overall more
accurate, 0.013, than the average prediction for the month of August for the polling institutes,
0.014. The individual party prediction with the highest absolute deviation is for SD, with a
deviation of 4,8 percentage points. Comparing with the overall mean deviation for the final
predictions for Sifo, Ipsos, Demoscope and Novus, 0,012 (Oleskog Tryggvason, 2014), the
model prediction is slightly more inaccurate.
27You can also read