Quieter Pavement Project - Death Valley National Park - Interim Report for One-Year Post-Treatment Conditions - ROSA P
←
→
Page content transcription
If your browser does not render page correctly, please read the page content below
National Park Service
U.S. Department of the Interior

Natural Resource Stewardship and Science

Quieter Pavement Project - Death Valley National
Park
Interim Report for One-Year Post-Treatment Conditions
Natural Resource Report NPS/NRSS/NSNSD/NRR—2020/2143
ON THE COVER
View of Badwater Road, Death Valley National Park
VOLPE CENTER
Quieter Pavement Project - Death Valley National
Park
Interim Report for One-Year Post-Treatment Conditions
Natural Resource Report NPS/NRSS/NSNSD/NRR—2020/2143

Aaron L Hastings, Amanda S Rapoza, Sophie R Kaye, Daniel Flynn

U.S. Department of Transportation
Office of the Assistant Secretary for Research and Technology
John A. Volpe National Transportation Systems Center
Cambridge, MA 02142-1093

June 2020

U.S. Department of the Interior
National Park Service
Natural Resource Stewardship and Science
Fort Collins, Colorado
The National Park Service, Natural Resource Stewardship and Science office in Fort Collins,
Colorado, publishes a range of reports that address natural resource topics. These reports are of
interest and applicability to a broad audience in the National Park Service and others in natural
resource management, including scientists, conservation and environmental constituencies, and the
public.

The Natural Resource Report Series is used to disseminate comprehensive information and analysis
about natural resources and related topics concerning lands managed by the National Park Service.
The series supports the advancement of science, informed decision-making, and the achievement of
the National Park Service mission. The series also provides a forum for presenting more lengthy
results that may not be accepted by publications with page limitations.

All manuscripts in the series receive the appropriate level of peer review to ensure that the
information is scientifically credible, technically accurate, appropriately written for the intended
audience, and designed and published in a professional manner.

Data in this report were collected and analyzed using methods based on established, peer-reviewed
protocols and were analyzed and interpreted within the guidelines of the protocols.

Views, statements, findings, conclusions, recommendations, and data in this report do not necessarily
reflect views and policies of the National Park Service, U.S. Department of the Interior. Mention of
trade names or commercial products does not constitute endorsement or recommendation for use by
the U.S. Government.

This report is available in digital format from the Natural Resource Publications Management
website. If you have difficulty accessing information in this publication, particularly if using assistive
technology, please email irma@nps.gov.

Please cite this publication as:

Hastings, A. L., A. S. Rapoza, S. R. Kaye, and D. Flynn. 2020. Quieter pavement project - Death
Valley National Park: Interim report for one-year post-treatment conditions. Natural Resource Report
NPS/NRSS/NSNSD/NRR—2020/2143. National Park Service, Fort Collins, Colorado.

NPS 2143, June 2020
                                                    ii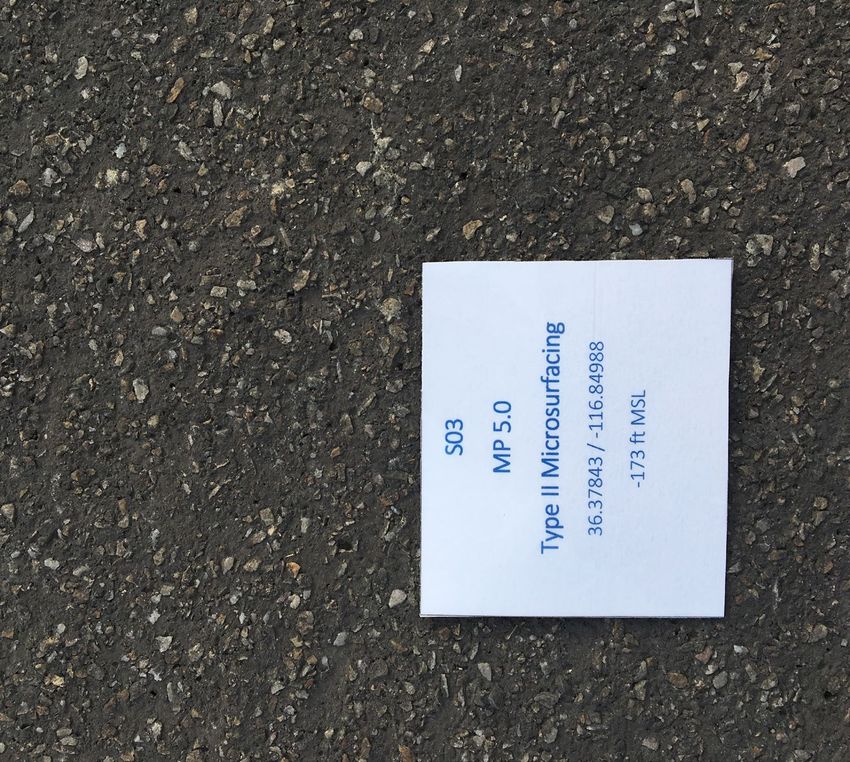
DOT-VNTSC-NPS-20-04

Above is a screenshot of the internal NPS Report Documentation Page Form that was added to this
document at the insistence of the authors. This form is not required for publishing in the NPS Natural
Resource Publications Series. A full transcription of all language displayed in this form can be found in
Appendix A.

                                                     iii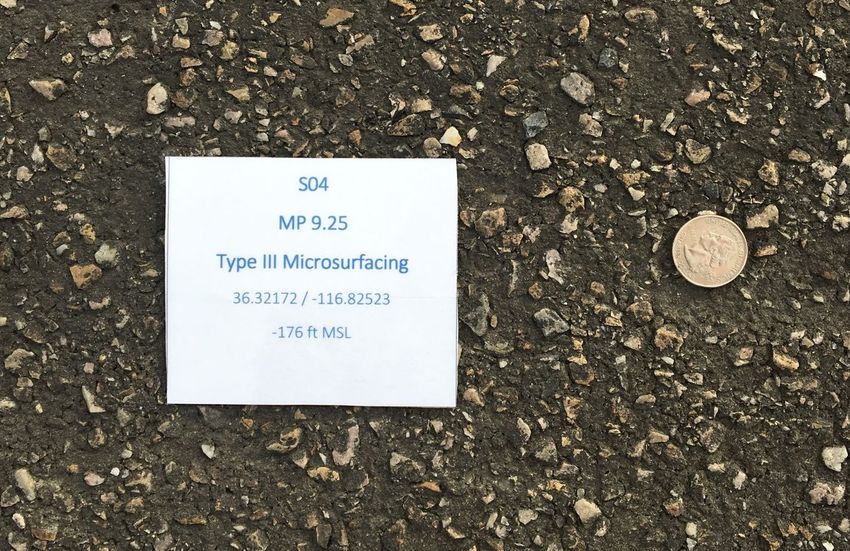
Contents
                                                                                                                                                     Page

Figures.................................................................................................................................................... v

Tables ..................................................................................................................................................viii

Abstract ................................................................................................................................................. ix

Acknowledgments................................................................................................................................. ix

1.     Introduction .................................................................................................................................... 1

2.     Measurement Locations.................................................................................................................. 3

3.     Methods ........................................................................................................................................ 14

       3.1         Tire/Pavement Sound Intensity Levels (OBSI Measurements) ....................................... 15

       3.2         Wayside Sound Level Measurement................................................................................ 16

       3.3         Effective Flow Resistivity (EFR) Measurement .............................................................. 19

4.     Results and Analyses .................................................................................................................... 22

       4.1         On-Board Sound Intensity Data ....................................................................................... 22

       4.2         Wayside Data ................................................................................................................... 27

       4.3         Effective Flow Resistivity Data ....................................................................................... 43

5.     Discussion .................................................................................................................................... 49

6.     Next Steps..................................................................................................................................... 51

7.     Literature Cited............................................................................................................................. 52

Appendix A: Report Documentation ................................................................................................... 53

                                                                             iv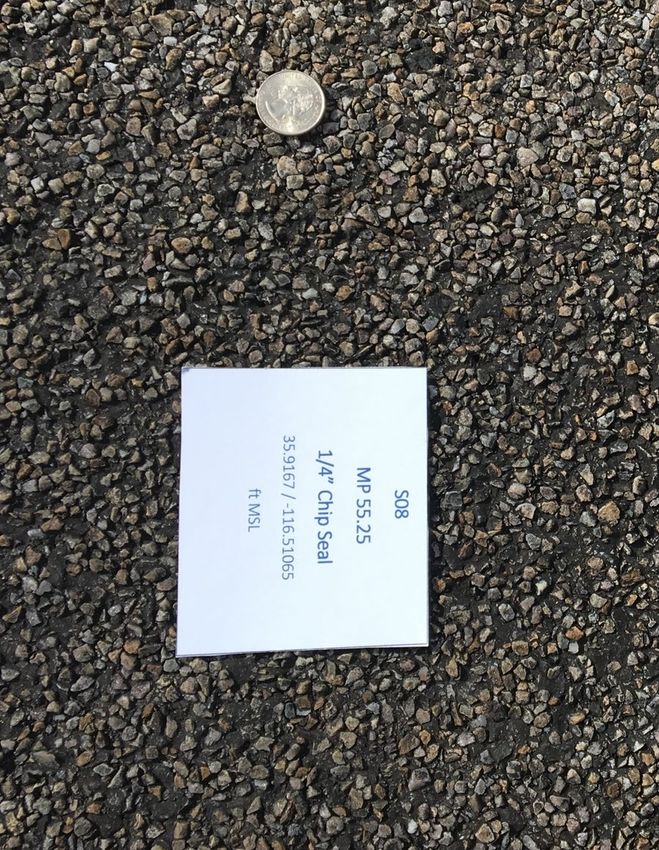
Figures
                                                                                                                                                Page

Figure 1. Park map showing Badwater / Furnace Creek area ................................................................ 4

Figure 2. Example (worst-case) of mud-caked roadway as seen on northern Badwater
Road, March 2019 (VOLPE CENTER)................................................................................................. 6

Figure 3. Example of March 2019 flood conditions on northern Badwater Road (VOLPE
CENTER)............................................................................................................................................... 6

Figure 4. Example of pre-treatment pavement at site S02, November 2016 (VOLPE
CENTER)............................................................................................................................................... 7

Figure 5. 3/8-inch chip seal treatment at site S01, March 2019 (VOLPE CENTER)............................ 7

Figure 6. 3/8-inch chip seal treatment at site S05, March 2019 (VOLPE CENTER)............................ 8

Figure 7. 1/4-inch chip seal treatment at site S02, March 2019 (VOLPE CENTER)............................ 8

Figure 8. 1/4-inch chip seal treatment at site S08, March 2019 (VOLPE CENTER)............................ 9

Figure 9. Type II microsurfacing treatment at site S03, March 2019 (VOLPE CENTER) ................. 10

Figure 10. Type II microsurfacing treatment at site S07, March 2019 (VOLPE CENTER) ............... 10

Figure 11. Type III microsurfacing treatment at site S04, March 2019 (VOLPE
CENTER)............................................................................................................................................. 11

Figure 12. Type III microsurfacing treatment at site S06, March 2019 (VOLPE
CENTER)............................................................................................................................................. 11

Figure 13. Map of Death Valley, Badwater Road, showing site locations .......................................... 12

Figure 14. Approximate instrumentation and test locations for OBSI, Wayside, Binaural
and EFR measurements........................................................................................................................ 15

Figure 15. Example of OBSI microphone array mounted on a passenger car (VOLPE
CENTER)............................................................................................................................................. 16

Figure 16. Example wayside measurement setup at site S03 (VOLPE CENTER) ............................. 17

Figure 17. Example of binaural recording, binaural head setup at S03 (VOLPE CENTER) .............. 19

Figure 18. EFR data collection instrumentation (VOLPE CENTER) ................................................. 21

Figure 19. Diagram of EFR set-up ....................................................................................................... 21

Figure 20. Measured one-third octave band sound intensity levels one-month post-
treatment and pre-treatment, 45 mph speed ......................................................................................... 23

                                                                           v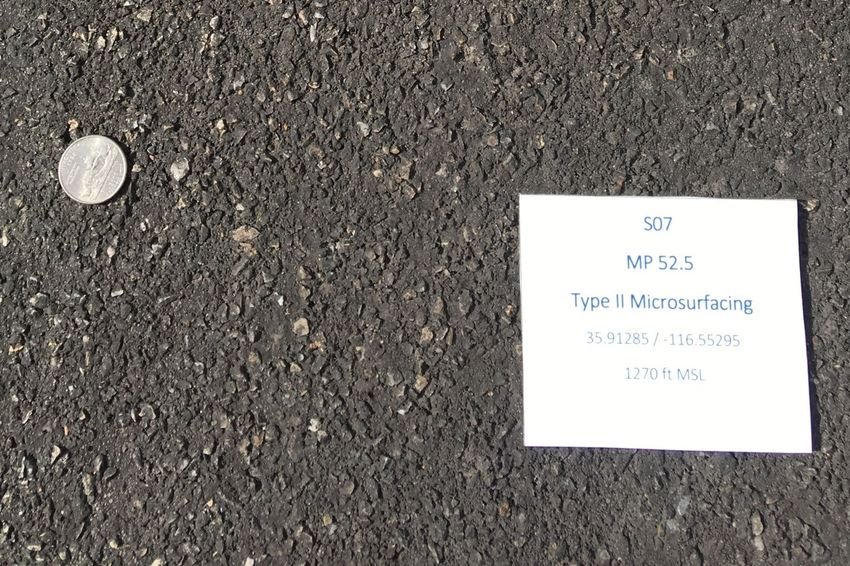
Figures (continued)
                                                                                                                                                Page

Figure 21. Measured one-third octave band sound intensity levels one-year post-treatment
and pre-treatment, 45 mph speed ......................................................................................................... 24

Figure 22. Measured one-third octave band SIL, 3/8-inch chip seal, 45 mph speed ........................... 25

Figure 23. Measured one-third octave band SIL, 1/4-inch chip seal, 45 mph speed ........................... 25

Figure 24. Measured one-third octave band SIL, type II microsurfacing, 45 mph speed .................... 26

Figure 25. Measured one-third octave band SIL, type III microsurfacing, 45 mph speed .................. 26

Figure 26. Measured wayside (50feet) A-weighted maximum sound pressure level data,
pre-treatment conditions, sites S02 and S07 ........................................................................................ 28

Figure 27. Measured wayside (50feet) A-weighted maximum sound pressure level, one-
month post-treatment conditions, sites S01 through S04 ..................................................................... 29

Figure 28. Measured wayside (50feet) A-weighted maximum sound pressure level, one-
year post-treatment conditions, sites S01 through S04 ........................................................................ 29

Figure 29. Spectral sound intensity difference between pre-treatment and 1/4-inch chip
seal pavement ....................................................................................................................................... 31

Figure 30. Spectral sound intensity difference between pre-treatment and 3/8-inch chip
seal pavement ....................................................................................................................................... 32

Figure 31. Spectral sound intensity difference between pre-treatment and type II
microsurfacing pavement ..................................................................................................................... 32

Figure 32. Spectral sound intensity difference between pre-treatment and type III
microsurfacing pavement ..................................................................................................................... 32

Figure 33. Comparison of standard REMELs and linear models of pavement treatments .................. 34

Figure 34. Comparison of standard REMELs and linear models of pre- and post-
treatment conditions, 3/8-inch chip seal pavement .............................................................................. 35

Figure 35. Comparison of standard REMELs and linear models of pre- and post-
treatment conditions, 1/4-inch chip seal pavement .............................................................................. 35

Figure 36. Comparison of standard REMELs and linear models of pre- and post-
treatment conditions, type II microsurfacing pavement....................................................................... 36

Figure 37. Comparison of standard REMELs and linear models of pre- and post-
treatment conditions, type III microsurfacing pavement ..................................................................... 36

                                                                          vi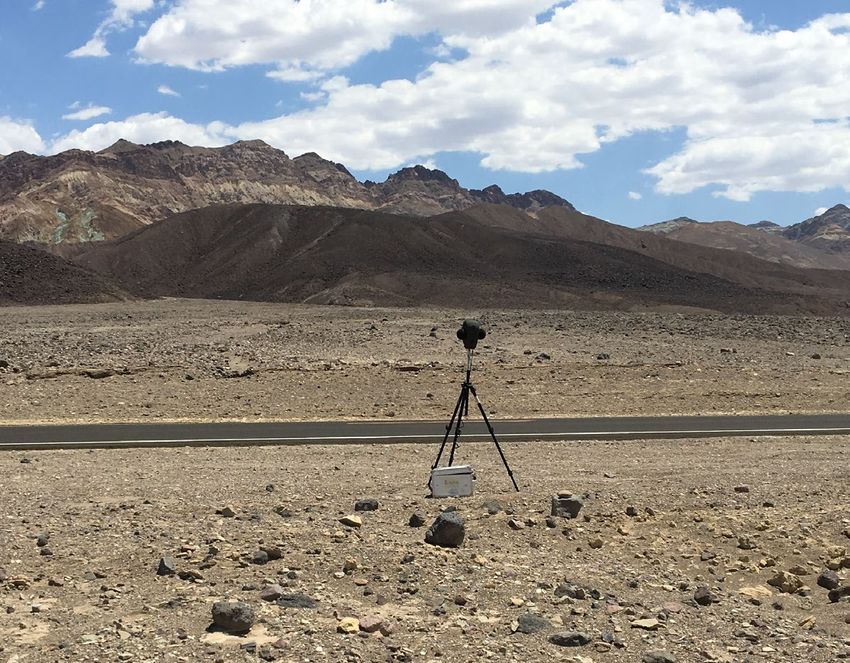
Figures (continued)
                                                                                                                                              Page

Figure 38. Measured wayside (50feet) A-weighted spectral data, pre- and one-month
post-treatment conditions ..................................................................................................................... 38

Figure 39. Measured wayside (50feet) A-weighted spectral data, pre- and one-year post-
treatment conditions ............................................................................................................................. 39

Figure 40. Measured wayside (50feet) A-weighted spectral data, pre- and post-treatment
conditions, 3/8-inch chip seal pavement .............................................................................................. 40

Figure 41. Measured wayside (50feet) A-weighted spectral data, pre- and post-treatment
conditions, 1/4-inch chip seal pavement .............................................................................................. 41

Figure 42. Measured wayside (50feet) A-weighted spectral data, pre- and post-treatment
conditions, type II microsurfacing pavement....................................................................................... 42

Figure 43. Measured wayside (50feet) A-weighted spectral data, pre- and post-treatment
conditions, type III microsurfacing pavement ..................................................................................... 43

Figure 44. Comparison of measured (blue dots), mean measured (red dots) and computed
best-fit (solid lines) sound level differences by frequency at site S01, post-treatment 3/8-
inch chip seal conditions at one year. A black line indicates the differences computed for
the EFR value that best fits the measured data (4150 cgs rayls) .......................................................... 44

Figure 45. Comparison of measured (blue dots), mean measured (red dots) and computed
best-fit (solid lines) sound level differences by frequency at site S02, post-treatment 1/4-
inch chip seal conditions, at one year .................................................................................................. 45

Figure 46. Comparison of measured (blue dots), mean measured (red dots) and computed
best-fit (solid lines) sound level differences by frequency at site S03, post-treatment type
II microsurfacing conditions, at one year............................................................................................. 46

Figure 47. Comparison of measured (blue dots), mean measured (red dots) and computed
best-fit (solid lines) sound level differences by frequency at site S04, post-treatment type
III microsurfacing conditions, at oneyear ............................................................................................ 47

                                                                        vii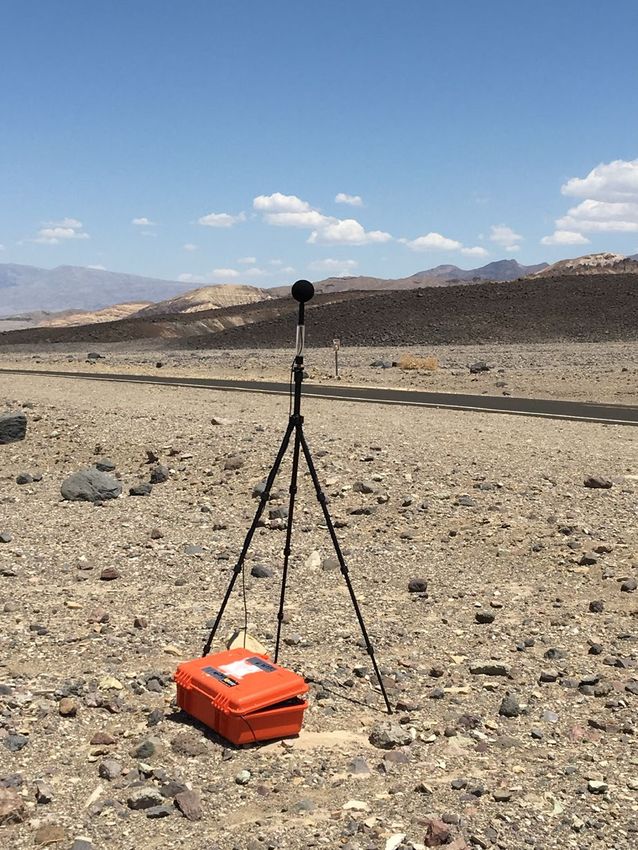
Tables
                                                                                                                                                 Page

Table 1. Death Valley measurement locations..................................................................................... 13

Table 2. Effective Flow Resistivity Data for Ground Types ............................................................... 20

Table 3. Measured overall sound intensity levels, pre-treatment and post-treatment 45
mph speed ............................................................................................................................................ 22

Table 4. Summary of one-year wayside pass-by measurements ......................................................... 27

Table 5. Multiple analysis of variance of wayside pass-by sound pressure levels for one-
year post-treatment measurements ....................................................................................................... 30

Table 6. Overall A-weighted ANOVA predicted wayside data at 50 mph speed, 90 °F
pavement temperature .......................................................................................................................... 37

Table 7. Best-fit EFR values (cgs rayls) for the four measurement locations ..................................... 48

                                                                          viii
Abstract
The U.S. Department of Transportation, John A. Volpe National Transportation Systems Center is
assisting the National Park Service (NPS) Natural Sounds and Night Skies Division in the study of
practical noise-reduction benefits of common surface treatments used by the Parks for pavement
preservation. The goal of this study is to provide park administrators and planners with paving
options using the standard surface treatments that alone, or in conjunction with other strategies, can
help reduce noise in sensitive park areas. Acoustic data for the pre-treatment conditions, before
application of the surface treatments, were collected on November 7–8, 2016. Acoustic data for
immediate post-treatment conditions, one month after treatments were applied, were collected May
23–24, 2018. Acoustic data for post-treatment conditions, nominally one year after treatments were
applied, were collected on March 19–22, 2019. This document summarizes the data collected for pre-
treatment measurements (November 2016) and post-treatment measurements at one-month and one-
year (May 2018 and March 2019 respectively). Results of the noise measurements are presented
along with the initial analyses conducted to identify preliminary trends in the data. As the pavements
age and additional measurements are made, these data and analyses will be updated in future reports.
Acknowledgments
The authors thank Frank Turina and Ashley Pipkin of the National Park Service, Natural Sounds and
Night Skies Division, and Death Valley National Park Superintendent Mike Reynolds for their vision
and support of this study, as well as Kevin Gray and Sean Wheeler of the Federal Highway
Administration. The authors also thank all the NPS Pacific West Region and Death Valley National
Park personnel who helped our team with permitting, site selection, and traffic control including:
Alison Ainsworth, Justin DeSantis, Sarah Raube, Kevin Green, Josh Hoines, Frank Lambert and
Ainsley Holeso. In addition, the authors thank the other members of the Volpe team for their support
in the planning and execution of this effort: Cynthia Lee, Trevor May, Robert Downs, John
MacDonald, and David Read. We would also like to thank the peer reviewers for this document –
Kurt Fristrup, Ashley Pipkin and Cynthia Lee.
ix1. Introduction
The U.S. Department of Transportation, John A. Volpe National Transportation Systems Center
(Volpe Center) is assisting the National Park Service (NPS), Natural Sounds and Night Skies
Division (NSNSD), in their investigation of the use of quieter pavement as a noise-abatement
measure This document details the initial three sets in a series of measurements in Death Valley
National Park (DEVA) to track the sound level characteristics of the common park pavement surface
treatments over time. Data for the pre-treatment condition were collected in November 2016, prior to
resurfacing. Measurement data for the pre-treatment condition provide a baseline/reference by which
the surface treatments can be compared. Data for post-treatment conditions were collected in May
2018, approximately one month after treatments were applied, and in March 2019, nominally one
year after treatments were applied. Post-treatment data regarding the four surface treatments under
investigation will be collected at regular intervals over the duration of this study (2016-2022). The
Death Valley study is being conducted in cooperation with DEVA staff and the Federal Highway
Administration (FHWA).
Quieter pavements have been studied and used successfully in highway applications in the US and
abroad for a number of years. Sohaney (2013) published a synthesis of quieter pavements research
and applications (“Quieter Pavements Guidance Document”) for the National Park Service in June
2013. An addendum to that document was prepared in 2018 (Hastings, 2018), which included a
summary of recent findings and an annotated bibliography.
Although numerous types of quieter pavements have been successfully used and studied in highway
applications, the cost-benefit of these pavements may not be conducive at all NPS sites. Roadways in
parks have a longer service life, requiring repairs and often resurfacing before a full replacement.
Traffic on these roadways is also generally lower in speed, and parks are concerned about sound
propagation at greater distances than highway planners (who often only consider effects up to
1000feet from the roadway. In addition, the availability and maintenance requirements for traditional
‘quieter pavement’ technologies such as open-graded asphalt and rubberized asphalt can sometimes
make them infeasible in remote parks.
As a result, the NSNSD and the Volpe Center are studying the noise reduction benefits of common
surface treatments used by the parks for pavement preservation. Based on discussions with FHWA
and NPS, chip seal (with 3/8-inch and 1/4-inch aggregate), and microsurfacing type II and type III
are common park pavement surfaces. The goal of this study is to provide park administrators and
planners with paving options using the standard surface treatments that alone, or in conjunction with
other strategies, can help reduce noise in sensitive park areas.
Measurement data for the pre-treatment condition provide a baseline/reference by which the surface
treatments can be compared. For instance, chip seal is a common surface treatment that has high
noise levels at the beginning of its lifetime (Lodico & Donovan), then gradually becomes quieter
over time; however, there are no known studies that provide quantitative measures of how chip seal
noise levels change over time. The purpose of this study is to determine that change in noise levels.
Quantifying the initial change in noise as well as the rate of change (whether quieter or louder) for
1two aggregate sizes of chip seal will provide needed input when considering cost/benefits of using
that particular surface treatment. Of the microsurfacing treatments, type II microsurfacing has a
superior texture, but type III is most typically used for roadways due to improved durability.
Quantifying the differences in noise levels as a function of surface treatment and time will again
provide needed input when considering cost/benefits of using a particular surface treatment.
This research builds upon previous survey work conducted in DEVA (Rochat and Lau 2013) and
several other NPS units in Pennsylvania and Virginia (Gettysburg National Military Park, Valley
Forge National Historic Park, Shenandoah National Park, and Delaware Water Gap National
Recreation Area) (Wayson and MacDonald 2014) where the goal was to demonstrate the potential
benefits and limitations of various pavement types and surfaces (including quieter pavement) for
NPS units.
22. Measurement Locations
Death Valley National Park is located northeast of Los Angeles, California along the border with the
State of Nevada. The park was established in February 1933 and encompasses 3.3 million acres.
Located in the arid Mojave Desert, Death Valley National Park is the National Park System’s largest
park in the contiguous 48 states and contains the lowest point in the Western Hemisphere. Over
800,000 people visit the park annually. Death Valley is an ideal candidate for this type of study, as it
contains roadways where vehicle speed is typically greater than 45 mph, where tire-pavement noise
dominates and quieter pavements can be of most benefit. In addition, the park has very low natural
ambient sound conditions (Lee & MacDonald 2016). Climatic conditions also allow for a longer
window for acoustic sampling, typically from October to May.
The specific measurement sites within Death Valley were chosen within the area where pavement
rehabilitation projects were already planned for 2017–2018. Site selection within this area was based
on proximity to acoustically sensitive areas: frequency of park visitors and/or sensitive fauna. All
sites had a region of flat ground adjacent to and extending at least 400 feet perpendicular to and
along the roadway so that wayside acoustic measurements could be conducted.
Based on these criteria, Badwater Road was identified as the best candidate for this study, receiving
pavement surface rehabilitation treatments in early 2018, and having a number of areas conducive to
acoustic measurements. Badwater Road is a 72-mile stretch of roadway in a heavily visited area of
the park. It extends from the Furnace Creek visitor area southward to Badwater Basin and Ashford
Mill turning eastward through Jubilee Pass toward the park boundary and the town of Shoshone,
California (see Figure 1).
3Figure 1. Park map showing Badwater / Furnace Creek area. Arrows point to the geographical areas
along Badwater Road selected for measurements
The locations for the test-strip surface-treatment paving and acoustic measurement were finalized
during an on-site meeting and location scoping between FHWA, NPS and Volpe personnel on
November 2–3, 2016. Eight locations were selected around two geographical areas, creating a
northern and a southern group. Each of the four pavement treatments were applied in both the
northern and southern site groups. The northern group of sites (S01-S04) has more traffic with higher
visitation where measures of visitor perception are of interest. The northern group is located nearest
to the Furnace Creek visitor center and lodging area, and is near several visitor points-of-interest. The
southern group of sites (S05-S08), located near Jubilee Pass has less visitation (less traffic and wear-
4and-tear on the roadway), where measures of wildlife-related influences may be of interest.
Additionally, the southern group is at a higher altitude (where average temperatures are a bit lower)
and in a section of roadway subjected to damaging flash flooding.
The Badwater Road re-paving project took place during March and April 2018 with coordination and
oversight from the FHWA Office of Federal Lands Highway. The repaving was part of a larger
project in Death Valley, where numerous sections of park roadways were resurfaced. The 3/8-inch
chip seal treatment was the standard treatment, applied to the majority of Badwater Road (with the
exception of the test sections). The other three types of treatment (1/4-inch chip seal and types II and
III microsurfacing) were each applied in test sections, approximately one-half mile in length at the
locations identified by the Volpe/NPS/FHWA team during the November 2016 site scoping. Test
section lengths and spacing between sections were such that treatments on one section would not
affect the noise levels at nearby measurement sites. Specifically, measurement sites were at least
2000feet from the nearest change in surface treatment.
In addition to the eight measurement locations along Badwater Road, a ninth measurement location
at the Golden Canyon parking lot (nearby S01) was added in 2018. This parking lot was treated with
the type II microsurfacing, but would not receive the same amount of moving vehicle traffic as the
roadway itself. As this site is nearby the S01 location with easy access, it provided a convenient
location to examine repeatability of effective flow resistivity (EFR) tests between two locations with
the same type of pavement but different amounts of traffic. During visual inspection of the test strips
in May 2018, the type III microsurfacing sections were less even and smooth than specified. This
pavement quality can affect the overall sound level results for this pavement type.
Before testing began for the pavements at one-year of age in March 2019, the northern sites (S01-
S04) experienced periods of flooding and washouts; mud was caked into the pavements. The
southern sites (S05-S08) did not show evidence of flooding. Figure 2 shows a worst-case example of
a portion of mud-caked roadway, where portions were completely filled in and covered over with
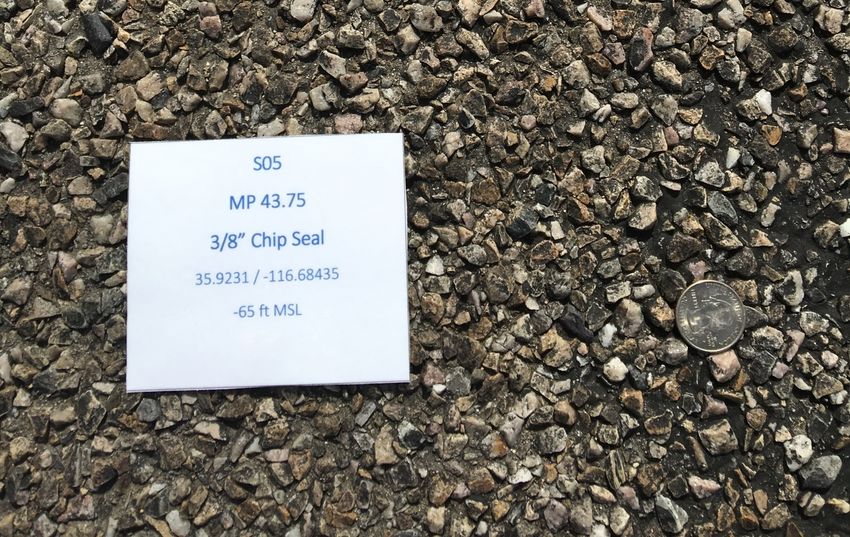
dirt. Road conditions immediately after a period of flash flooding witnessed during the measurement
trip on March 22, 2019 is evidenced in Figure 3, where portions of the roadway are not visible
beneath the mud. Because of the flooding, the S01 wayside measurement location was relocated
approximately 1000feet south of the original location to avoid the worst of the mud-caked roadway.
This relocated site was in an area with the same 3/8-inch chip seal pavement type, as this was the
default pavement for the entire roadway. This site was designated S01A. The flooding has the
potential to effectively and prematurely age the pavement by increasing the amount of air voids filled
with dirt and by increasing the wear on the surface due to the clearing process used for removing the
detritus post-flooding.
Figures 4 through Figure 12 show photographic examples of the pre-treatment pavement in March
2016 and post-treatment pavement sections of Badwater Road as of March 2019.
5Figure 2. Example (worst-case) of mud-caked roadway as seen on northern Badwater Road, March 2019
(VOLPE CENTER)
Figure 3. Example of March 2019 flood conditions on northern Badwater Road (VOLPE CENTER)
6Figure 4. Example of pre-treatment pavement at site S02, November 2016 (VOLPE CENTER)
Figure 5. 3/8-inch chip seal treatment at site S01, March 2019 (VOLPE CENTER)
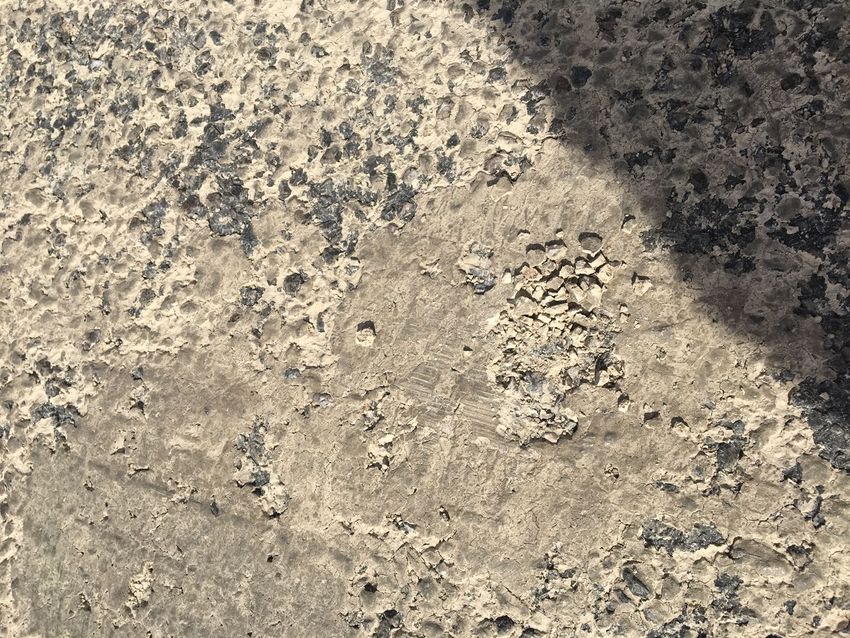
7Figure 6. 3/8-inch chip seal treatment at site S05, March 2019 (VOLPE CENTER)
Figure 7. 1/4-inch chip seal treatment at site S02, March 2019 (VOLPE CENTER)
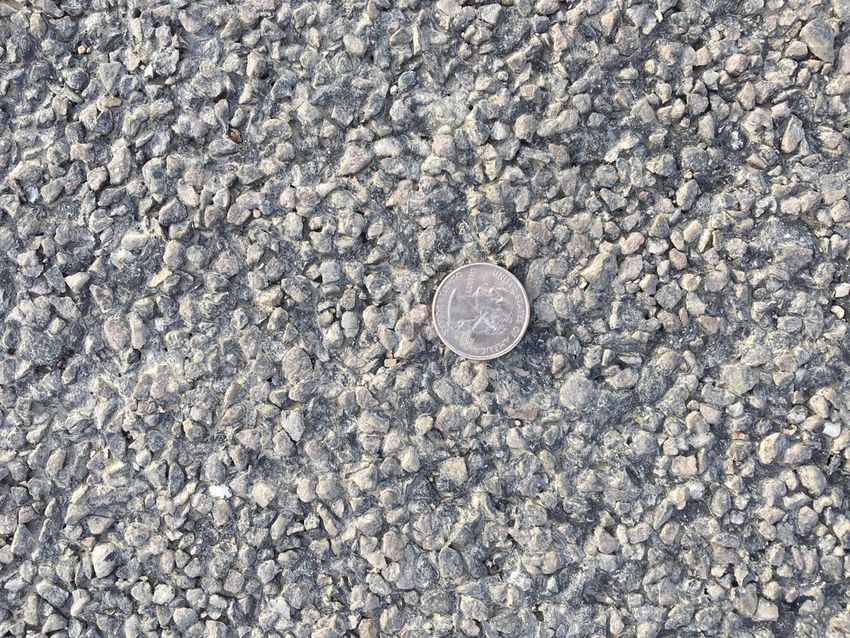
8Figure 8. 1/4-inch chip seal treatment at site S08, March 2019 (VOLPE CENTER)
9Figure 9. Type II microsurfacing treatment at site S03, March 2019 (VOLPE CENTER)
Figure 10. Type II microsurfacing treatment at site S07, March 2019 (VOLPE CENTER)
10Figure 11. Type III microsurfacing treatment at site S04, March 2019 (VOLPE CENTER)
Figure 12. Type III microsurfacing treatment at site S06, March 2019 (VOLPE CENTER)
11Figure 13 provides a map showing the site locations on Badwater Road, labeled S01 through S08.
Table 1 lists the surface treatments applied, latitude, longitude, and altitude at each of these locations.
The coordinates for the locations listed below represent the center point of the test section.
Figure 13. Map of Death Valley, Badwater Road, showing site locations
12Table 1. Death Valley measurement locations
Pavement Type Roadway Mile
(Post-paving, Post of test Altitude (ft,
Site May 2018) Latitude Longitude strips MSL)
3/8-inch chip
S01 36.41783 -116.84708 2.0 to 2.5 -187
seal (default)
3/8-inch chip
S01A 36.413311 -116.845924° 2.0 to 2.5 -170
seal (default)
1/4-inch chip
S02 36.40432 -116.84638 3.0 to 3.5 -203
seal
Type II
S03 36.37843 -116.84988 4.74 to 5.24 -173
microsurfacing
Type III
S04 36.32172 -116.82523 9.0 to 9.5 -176
microsurfacing
3/8-inch chip
S05 35.9231 -116.68435 43.5 to 44.0 -65
seal (default)
Type III
S06 35.91185 -116.58432 50.0 to 50.5 1230
microsurfacing
Type II
S07 35.91285 -116.55295 52.25 to 52.75 1270
microsurfacing
1/4-inch chip
S08 35.9167 -116.51065 55.0 to 55.5 1957
seal
Golden Canyon Type II
36.42063 116.84711 2.0 -187
Lot (near S01) microsurfacing
133. Methods
Data for pre-treatment conditions were collected during November 7-8, 2016. Data for the post-
treatment conditions at nominally one-month were collected during May 23-24, 2018. Data for post-
treatment conditions at nominally one-year were collected March 20 and 22, 2019. Data were
collected using three acoustic measurement techniques, detailed further in Sections 3.1 through 3.3.
1) On-board sound intensity (OBSI): A measure of the tire/pavement generated noise at the
source using an intensity probe that is mounted on a test vehicle
2) Wayside vehicle noise emission level measurements: Vehicle noise emission levels are
measured using standard FHWA procedures (Lee 1996), using a microphone at a distance of
50 feet from the centerline of the near traffic lane, 5 feet above the pavement surface. In
addition to standard wayside measurements, wayside binaural recordings were obtained using
two microphones and a model of a human head (referred to as “Eddie” in Figure 14), placed
25 feet from the centerline of the near traffic lane.
3) Effective flow resistivity (EFR): EFR is a measure of acoustic flow resistivity, which
includes the influence of material characteristics such as tortuosity, porosity, shape of ground
surface, etc. The EFR of the ground affects how a sound wave will reflect off the pavement.
An acoustic point source (compression driver with tube) is used to generate tones that are
measured by two microphones.
Additional measures of the pavement characteristics were also collected:
1) Photogrammetry: Beginning in 2018, digital photographs of the pavement surface were
collected in a specific manner such that they can be used to create a standard digital model
through a technique called photogrammetry. These digital models provide a three-
dimensional picture of the pavement surface and can be used to compute texture metrics such
as porosity and roughness. This analysis will be summarized in the final report upon
completion of all five years of post-treatment monitoring.
2) Pavement temperature: Pavement temperature can affect the performance of the pavement
and can thus affect the noise generated by the tire/pavement interaction.
Ideally, all three types of acoustic measurements would be conducted concurrently at each location to
form matched datasets. This permits noise measurement along the roadway as well as the noise at the
tire/pavement interface and allows analysis of propagation effects. This is important since not only
does the pavement surface texture affect the noise created at the tire/pavement interface (source), but
it also affects the sound wave as it propagates over the surface (path) before it is heard along the road
(receiver).
However, due to logistical constraints all measurement types were not collected at all sites. Instead,
measurement effort was apportioned to maximize the amount of data for the three measurement types
across all pavement types. OBSI measurement data were collected at all eight sites during the three
14measurement periods in 2016, 2018, and 2019. Wayside and EFR measurements for the pre-
treatment condition were limited to sites S02, S07, and S08 as the pre-treatment pavement surface
did not vary from site to site. Wayside and EFR measurement data for the one-month and one-year
post-treatment conditions were collected for each of the four pavement treatment types in the
northern section (S01, S02, S03, and S04). Because the treatments in the northern group of
measurement locations were repeated in the southern group, it was reasonable to limit these more
time-consuming test types to one location grouping. The northern sites were considered more
demonstrative of realistic road condition changes over time as they are more heavily trafficked
throughout the year, and therefore are subjected to more wear and tear.
Figure 14 shows the approximate locations of the OBSI and EFR measurements relative to the
wayside location at a single site.
Figure 14. Approximate instrumentation and test locations for OBSI, Wayside, Binaural and EFR
measurements.
3.1 Tire/Pavement Sound Intensity Levels (OBSI Measurements)
On-board sound intensity (OBSI) is a measure of the tire/pavement noise generated at the source.
The standard test method (AASHTO TP76-10) was used, wherein two intensity probes were placed
three-inches from the pavement/tire interface. Each intensity probe consisted of a phase-matched pair
of microphones. These probes were positioned at the leading or trailing edges of the tire/pavement
interface (see Figure 15). In this way the tire/pavement generated noise was measured as sound
intensity at the two locations. The OBSI measurement method was not significantly affected by
sounds outside the vicinity of the pavement/tire interface. Therefore, measurement accuracy was
unaffected by the presence of other vehicles and natural or other anthropogenic sounds. In addition, a
15standard reference test tire was used to minimize any differences in the tire ‘source’ from location to
location and year to year.
Figure 15. Example of OBSI microphone array mounted on a passenger car (VOLPE CENTER)
The OBSI test data were collected as the test vehicle traversed each measurement site. The test was
run over a 6.7-second data collection interval while the vehicle maintained a fixed speed of 45 mph,
resulting in a test section of pavement 440 feet in length. Multiple passes were performed in each
location to get an accurate representation of the noise levels associated with the pavement.
The intensity probes were mounted on a passenger car as illustrated in Figure 15. Cables carried the
electrical signal from the probes at the wheel, to the data analyzer and laptop computer inside the car
where the sound intensity from the probes was automatically recorded. Data collected for each test
run consisted of the overall sound intensity level and the sound intensity level in one-third octave
bands between 250 and 5000 Hz. Multiple passes were run on each test section of roadway and
averaged to obtain a single OBSI level. After each test run, the data were reviewed for quality control
and stored. Post-test, the data were processed according to the standard method in AASHTO TP76-
10.
3.2 Wayside Sound Level Measurement
The wayside measurement is a standard method to measure the noise generated by vehicles near a
roadway. Measurements were conducted in conformance with standard FHWA procedures 1 (Lee,
1996), where the goal is to collect maximum sound level data for individual vehicle pass-by events.
During the pre-treatment measurements, data were collected for 4–6 hours at each site S02 and site
1
These procedures are consistent with the methods used during the development of the Reference Energy Mean
Emission Level (REMEL) database for the FHWA TNM (Lau et.al, 2004).
16S07. During the one-month and one-year post-treatment measurements, data were collected for 2–3
hours each at sites S01/S01A–S04.
The measurement microphone was located at a distance of 50 feet from the centerline of the near
traffic lane, 5 feet above the pavement surface (see Figure 16). A Class 1 sound level meter measured
A-weighted maximum sound level (using fast response) 2 as well as one-third octave band one-half
second equivalent levels. Meteorological data (air temperature, relative humidity, wind speed, and
wind direction) and pavement temperature were recorded at hourly intervals.
During measurements, field personnel monitored pass-by events and recorded the event time, vehicle
speed (measured by radar), vehicle type (auto, RV, medium truck, motorcycle, bus, etc.) and any
interfering noises such as an aircraft flyover. Personnel also evaluated event quality in the field. A
clean event occurred when no other vehicles were nearby, allowing the sound level to rise and fall 10
dB from the maximum during the approach and departure. In general, this 10 dB rise-and-fall will
occur when the vehicle is clear of other vehicles by 150feet on each side of the microphone (for
multiple automobiles) or 500feet for automobiles with motorcycles nearby.
Figure 16. Example wayside measurement setup at site S03 (VOLPE CENTER)
2
Fast response is typically used for measuring individual vehicle pass-bys (see Lee 1996 and RSG 2018).
17Post-test, wayside data were processed to produce a database of vehicle-pass-by information, one
record per vehicle. Each record contains:
1. Vehicle speed and type identification (auto, motorcycle, medium truck/RV, bus)
2. Meteorological data: temperature, humidity, wind speed
3. Acoustical data: A-weighted maximum sound level, fast response, and corresponding one-
third octave band sound levels.
The half-second sound level time-history records for each vehicle pass-by were also identified within
the dataset, examined to ensure a 10 dB rise and fall (no contamination from other sources) and
stored for later analysis.
In addition to traditional wayside data collection, binaural audio recordings were obtained using a
two-microphone dummy head recorder. This device takes the form of a full sized human head model,
with one microphone in each ear. Recordings using two microphones along with the physical
representation of a human head replicate the acoustic conditions in which humans experience sound.
Listening to these recordings through high quality headphones produces a simulation of the actual
audio environment, thus providing a three-dimensional listening experience. Binaural audio
recordings can be helpful for education and laboratory ‘audio clip’ studies where subjects wish to
differentiate between the pass-by sounds produced by different pavement types. Because binaural
recordings alter the frequency content of the signal, these recordings are not usually used as raw data
sets for measuring or modeling traffic noise on roadways.
During the wayside measurements, the binaural head and microphones were positioned 25 feet from
the centerline of the near traffic lane, 5 feet above the pavement surface. Figure 17 shows the setup
of the binaural head recording system along Badwater Road at site S03.
18Figure 17. Example of binaural recording, binaural head setup at S03 (VOLPE CENTER)
3.3 Effective Flow Resistivity (EFR) Measurement
EFR is a measure of flow resistivity, which includes the influence of material characteristics such as
tortuosity, porosity, shape of ground surface, etc. EFR is a parameter used in various acoustic
propagation algorithms to determine the amount of sound absorbed and/or reflected by the pavement
when propagating outwards from the roadway.
In the FHWA Traffic Noise Model (TNM® ) Version 2.5, a single EFR value of 20,000 cgs rayls is
the default value applied to pavements. Studies have shown that pavement EFR values can range
from about 2,000 to 30,000 cgs rayls, depending on pavement type and age (a review of the studies
can be found in Rochat et al. 2012). For EFR, low values represent a sound absorbing material, and
high values represent a sound reflecting material. EFR is on a proportional scale in the sense that, for
example, a difference of 1,000 cgs rayls in the low range (0-1,000 cgs rayls) represents a significant
difference between very sound absorbent powder snow and roadside dirt, whereas in a higher range
(10,000-30,000 cgs rayls), a 1,000 cgs rayls difference represents slight differences in, for example,
the EFR of two different dense-graded asphalt pavements. Table 2 displays EFR values for common
ground types.
19Table 2. Effective Flow Resistivity Data for Ground Types
Effective Flow
Effective Flow Resistivity (x Resistivity (x
Ground Type 103 Pa-s/m2) 103 Pa-s/m2)
Upper limit 2.5 x 10⁵ – 25 x 105 800,000
Concrete, painted 200,000 200,000
Concrete, depends on finish 30,000-100,000 65,000
Asphalt, old, sealed with dust 25,000-30,000 27,000
Quarry dust, hard packed 5000-20,000 12,500
Asphalt, new, varies with particle size 5,000-15,000 10,000
Dirt, exposed, main-packed 4,000-8,000 6,000
Dirt, old road, filled mesh 2,000-4,000 3,000
Limestone chips, 1.25-2.5 cm mesh 1,500-4,000 2,750
Dirt, roadside with < 10 cm rocks 300-800 550
Sand, various types 40-906 317
Soil, various types 106-450 200
Grass, lawn or grass field 125-300 200
Clay, dry, (wheeled/unwheeled) 92-168 130
Grass field, 16.5% moisture content 75 75
Forest floor (pine/hemlock) 20-80 50
Grass field, 11.9% moisture content 41 41
Snow, various types 1.3-50 29
EFR measurements at DEVA were conducted in conformance with ANSI S1.18, Template Method
for Ground Impedance, using “Geometry A”. The instrumentation set-up consisted of an acoustic
point source (compression driver with tube) and two microphones a set distance away and at two
different heights above the ground (see Figure 18 and Figure 19). Samples were collected four times
at each test section, one in the direction of travel (0 degrees), and one each at 90, 180, and 270
degrees of rotation from the direction of travel.
The method generally consists of using a signal generator to produce tones at one-third-octave band
center frequencies between 250 and 4000 Hz, noting the difference in sound level between the two
microphones for each frequency. This general method was used during the pre-treatment
measurements in 2016. Based on these data, it was determined that more accurate EFR estimates
might be obtained for the test pavement surfaces by increasing the number of data points collected
between 2000 Hz and 2250 kHz, where the EFR values for hard surfaces vary the most. In 2018,
additional data were collected for frequencies at 62 Hz intervals between 2000 Hz and 2250 Hz, as
well as frequencies at 1000 Hz, 2500 Hz, and 3150 Hz.
20Figure 1. EFR data collection instrumentation (VOLPE CENTER)
Figure 2. Diagram of EFR set-up
214. Results and Analyses
Sections 4.1 through 4.3 summarize the measured data and analyses of both pre-treatment
measurements (November 2016) and post-treatment measurements at one-month and one-year (May
2018 and March 2019 respectively).
4.1 On-Board Sound Intensity Data
Table 3 shows the measured overall on-board sound intensity levels measured with OBSI techniques
by location for both pre- and post-treatment pavements. In all cases, the reported overall sound
intensity level (SIL) is the arithmetic average of at least three good ‘runs’ on each surface. As of the
one-year post-treatment measurement, all northern sites (S01A-S04) produced higher overall SIL
than that of the same pavement type in the southern test region (S05-S08). Moreover, all overall SIL
in the northern region increased during the time period between the one-month and one-year
measurement, whereas all overall SIL in the southern region decreased during that period. The
increase in SIL in the northern region can be attributed to the heavier traffic volume, in addition to
flooding at the northern sites, which will contribute to faster pavement deterioration. All post-
treatment SILs are within 4 dB of the pre-treatment measurement at each site. These data have not
been corrected to adjust for differences in pavement temperature at the time of measurement.
Table 3. Measured overall sound intensity levels, pre-treatment and post-treatment 45 mph speed
One-month One-year One-year of
Pre- Post- Post- Deterioration Overall
Treatment Treatment Treatment 2018-2019 2016-2019
Location Pavement Treatment Overall SIL Overall SIL Overall SIL Delta Delta
S01/S01A 3/8-inch Chip Seal 99.7 100.6 101.1 0.5 1.4
S02 1/4-inch Chip Seal 100.1 99.3 99.4 0.1 -0.7
S03 Type II Microsurfacing 98.4 97.4 99.0 1.6 0.6
S04 Type III Microsurfacing 101.1 98.9 100.0 1.1 -1.1
S05 3/8-inch Chip Seal 98.3 100.1 99.4 -0.7 1.1
S06 Type III Microsurfacing 100.8 99.7 98.6 -1.1 -2.2
S07 Type II Microsurfacing 100.2 97.7 96.7 -1.0 -3.5
S08 1/4-inch Chip Seal 99.7 100.2 98.0 -2.2 -1.7
Figure 20 and Figure 21 show the one-third octave band sound intensity levels measured at each site
in for the one-month and one-year post-treatment measurements respectively, allowing comparisons
across pavement type. These levels correspond to the overall sound intensity levels shown in Table 3.
Figure 22 through Figure 25 display the measured one-third octave band sound intensity levels from
both for each material compared to the 2016 pre-treatment sound intensity levels, showing the trends
for each pavement type over time. Visible trends include:
224. Type III microsurfacing pavement produced the most low-frequency and the least high-
frequency content.
5. Type II microsurfacing pavement produced the least low-frequency and significantly,
although not always, the most high-frequency content.
6. 3/8-inch chip seal pavement produced the most mid-frequency content with significant peaks
at 800 and 1000 Hz.
7. Both chip seal pavements produced less low-frequency content over time.
Figure 20. Measured one-third octave band sound intensity levels one-month post-treatment and pre-
treatment, 45 mph speed
23Figure 21. Measured one-third octave band sound intensity levels one-year post-treatment and pre-
treatment, 45 mph speed
24Figure 22. Measured one-third octave band SIL, 3/8-inch chip seal, 45 mph speed
Figure 23. Measured one-third octave band SIL, 1/4-inch chip seal, 45 mph speed
25Figure 24. Measured one-third octave band SIL, type II microsurfacing, 45 mph speed
Figure 25. Measured one-third octave band SIL, type III microsurfacing, 45 mph speed
264.2 Wayside Data
Pre-treatment wayside data for vehicle pass-bys were collected at two of the eight measurement
locations. Site S02 was chosen to be representative of the northern section, and site S07 was chosen
to be representative of the southern section. For post-treatment conditions, both at one month and one
year, wayside vehicle pass-by data were collected for each of the four treatment types at the more
heavily trafficked locations S01 through S04. Table 4 summarizes the wayside maximum sound level
pass-by data obtained in March 2019, one year after application of treatments..
Table 4. Summary of one-year wayside pass-by measurements
LAFmx
Average Sound
Number Speed Average Pavement LAFmx Level
of Clean Range Speed Temperature Sound Level Average
Location Pavement Type Pass-bys (mph) (mph) (°F) Range (dBA) (dBA)
S01A 3/8-inch Chip Seal 33 30-54 43.7 85 65.1-74.5 69.8
S02 1/4-inch Chip Seal 38 30-64 48.8 64 61.2-78.4 71.0
S03 Type II Microsurfacing 34 30-57 45.1 67 65.1-74.5 70.0
S04 Type III Microsurfacing 24 42-67 56.0 81 65.2-76.4 71.1
Figure 26 depicts the wayside data for the pre-treatment conditions, while Figure 27 and Figure 28
depict the data for post-treatment conditions, one month and one year after treatments were applied
respectively. These figures contain the measured maximum sound pressure level data (A-weighted,
fast response) as a function of vehicle speed for each vehicle pass-by. Overlaid on these charts is the
reference energy mean emission level (REMEL) curve for automobiles, average pavement, as
developed for FHWAs TNM®, Version 1.0 (Fleming et al. 1995) and measured with similar
procedures, thus allowing for direct comparison.
27Figure 3. Measured wayside (50feet) A-weighted maximum sound pressure level data, pre-treatment
conditions, sites S02 and S07. The REMEL relationship for automobiles is overlaid for comparison.
28Figure 4. Measured wayside (50feet) A-weighted maximum sound pressure level, one-month post-
treatment conditions, sites S01 through S04. The solid line represents the REMEL relationship for
automobiles, which is overlaid for comparison.
Figure 5. Measured wayside (50feet) A-weighted maximum sound pressure level, one-year post-
treatment conditions, sites S01 through S04. The solid line represents the REMEL relationship for
automobiles, which is overlaid for comparison.
29Measured data can be affected by vehicle speed, pavement type, pavement temperature, and the
interactions between these main effects. In order to further isolate the effect of pavement type, a
multiple analysis of variance (MANOVA) was conducted using measurements from the pre-
treatment and post-treatment conditions. The predictors in the MANOVA include the treatment type,
vehicle speed, and pavement temperature. The response variables are the one-third octave band levels
associated with the pass-by for each event. In contrast to an analysis of variance (ANOVA) model,
the response in the statistical model is a matrix (number of observations × number of one-third
octave bands as response variables) rather than a single vector (number of observations × single
response variable). This analysis allows the greatest amount of data to be utilized in order to isolate
the contribution of pavement type on the difference in measured levels.
The results of the MANOVA are shown in Table 5. The first column describes the effect under
consideration, either a main effect (pavement type (treatment), pavement temperature, vehicle speed)
or an interaction effect (interaction between pavement temperature and vehicle speed, interaction
between pavement type and vehicle speed). The second column is the number of degrees of freedom
associated with each effect. The third column is an estimate of Pillai’s trace, which is a test statistic
used in multivariate analyses. Pillai’s trace is based on the eigenvalues associated with each
predictor, across all the sound level frequencies. A larger value indicates that this predictor explains
more of the difference in the response data (the matrix of all the sound levels across frequencies).
The next three values give the approximate F-statistic, which is used for evaluating statistical
significance and the degrees of freedom for the numerator and denominator in the F-statistics. The
final column gives the p-value. A p-value less than 0.05 is typically considered statistically
significant.
Table 1. Multiple analysis of variance of wayside pass-by sound pressure levels for one-year post-
treatment measurements
Metric Df Pillai approx F num Df den Df Pr(>F)
Treatment 4 2.383 10.315 108 756 < 0.001
Pavement Temperature 1 0.223 1.982 27 186 0.004
Speed 1 0.685 14.946 27 186 < 0.001
Pavement Temperature : Speed 1 0.175 1.461 27 186 0.076
Treatment : Speed 4 0.707 1.502 108 756 0.001
Residuals 212 – – – – –
The MANOVA indicates that there are strong, statistically significant effects for all predictors
included in the MANOVA across the range of one-third octave bands analyzed. Once this was
established, it was appropriate to conduct single analyses of variance (ANOVAs) for each one-third
octave band frequency using this model to determine the effects of pavement type (along with the
other factors) on sound level.
30Figure 29 through Figure 32 show the differences in sound level according to the ANOVA statistical
model between each new pavement type and an average of the two pre-treatment locations for which
wayside data was collected (S02 and S07). Note that in these figures the error bars are based on ± 1
standard error, which provides a confidence interval of 68.3 percent, rather than the typical ± 1.96
standard errors, which provides a 95 percent confidence interval. This was done to help highlight
potential differences. Because this interval is less conservative, as new data are added, some trends
may change. From these figures, the following conclusions can be drawn:
8. Type II microsurfacing pavement produced less of both high and low frequencies, than the
pre-treatment pavement.
9. Type III microsurfacing pavement produced more low frequency content and less high
frequency content than the pre-treatment pavement.
10. Both chip seal pavements differ from the pre-treatment pavement almost identically.
Figure 29. Spectral sound intensity difference between pre-treatment and 1/4-inch chip seal pavement.
ANOVA analysis adjusting for average parameters: 50 mph average speed and 90° F pavement
temperature.
31Figure 30. Spectral sound intensity difference between pre-treatment and 3/8-inch chip seal pavement.
ANOVA analysis adjusting for average parameters: 50 mph average speed and 90° F pavement
temperature.
Figure 31. Spectral sound intensity difference between pre-treatment and type II microsurfacing
pavement. ANOVA analysis adjusting for average parameters: 50 mph average speed and 90 °F
pavement temperature.
Figure 32. Spectral sound intensity difference between pre-treatment and type III microsurfacing
pavement. ANOVA analysis adjusting for average parameters: 50 mph average speed and 90 °F
pavement temperature.
32Figure 33 shows the REMEL curve for automobiles on average pavement as well as the trend lines
developed using the results from the ANOVAs for the one-year data. Figure 34 through Figure 37
display the change in these trends over time for each pavement for the pre-treatment and post-
treatment conditions. Note that the trend lines are linear while the REMEL curve has a logarithmic
form. For limited speed ranges, comparison between the two forms is useful and the following
observations are noted:
11. The slope of the pre-treatment trend line is in good agreement with the REMEL relationship
albeit with a slightly lower level.
12. All one-year post-treatment trend lines slopes are similar to the REMEL relationship, and to
each other, suggesting that all pavement treatments respond similarly to changes in speed.
13. The two chip seal pavement trend lines as of one-year post-treatment are shifted slightly
above the predicted REMEL relationship, meaning the sound levels are slightly louder than
average for all speeds.
14. The trend lines for both microsurfacing pavements as of one-year post-treatment are by
contrast, slightly below the REMEL relationship for speeds greater than about 40 mph
therefore the sound levels are slightly quieter than average 3.
15. The 3/8-inch chip seal pavement has become significantly louder over the period between
one-month and one-year measurements, whereas the 1/4-inch chip seal pavement has not
changed significantly. It is possible that this is due to clogging of the larger air voids in the
3/8-inch chip seal as a result of the flooding 4.
3
Note below 40 mph the linear approximation may not hold for comparisons with the REMELs curve. So this
analysis focuses on speeds 40 mph and greater.
4
Although we moved the 3/8-inch chip seal measurement location, there was still some residual flooding effects at
the new location.
33You can also read