880 Evaluation of ECMWF forecasts, including the 2020 upgrade
←
→
Page content transcription
If your browser does not render page correctly, please read the page content below
Technical
 Memo

 880
 al Memo Technical Memo Technical Memo Technical Memo Tech
 Evaluation
 ical Memo Technical ofMemoECMWF Technical Memo Technical Memo Te
 hnicalforecasts,
 Memo Technical Memo Technical
 including the Memo Technical Memo T
 chnical Memo Technical Memo Technical Memo Technical Memo
 2020 upgrade
Technical Memo Technical Memo Technical Memo Technical Mem
 Technical Memo Technical Memo Technical Memo Technical Me
mo Technical Memo Technical Memo Technical Memo Technical M
 mo Technical Memo Technical Memo Technical Memo Technical
MemoT. Technical MemoF. Vitart,
 Haiden, M. Janousek, Technical Memo Technical Memo Technic
 Memo Technical Memo Technical Memo Technical Memo Techn
 Z. Ben Bouallegue, L. Ferranti, F. Prates
 and D. Richardson
 al Memo Technical
 (Forecast Department)Memo Technical Memo Technical Memo Tech
 ical Memo Technical Memo Technical Memo Technical Memo Tec
 January 2021
hnical Memo Technical Memo Technical Memo Technical Memo T
 chnical Memo Technical Memo Technical Memo Technical Memo
 echnical Memo Technical Memo Technical Memo Technical Mem
 Technical Memo Technical Memo Technical Memo Technical Me
 o Technical Memo Technical Memo Technical Memo Technical M
 mo Technical Memo Technical Memo Technical Memo Technical
Memo Technical Memo Technical Memo Technical Memo Technica
 Memo Technical Memo Technical Memo Technical Memo Techni
 al Memo Technical Memo Technical Memo Technical Memo Tech
 cal Memo Technical Memo Technical Memo Technical Memo Tec
 nical Memo Technical Memo Technical Memo Technical Memo T
 chnical Memo Technical Memo Technical Memo Technical Memo
Series: ECMWF Technical Memoranda

A full list of ECMWF Publications can be found on our website under:
http://www.ecmwf.int/en/publications

Contact: library@ecmwf.int

© Copyright 2021

European Centre for Medium-Range Weather Forecasts, Shinfield Park, Reading, RG2 9AX, UK

Literary and scientific copyrights belong to ECMWF and are reserved in all countries. This publication
is not to be reprinted or translated in whole or in part without the written permission of the Director-
General. Appropriate non-commercial use will normally be granted under the condition that reference
is made to ECMWF.

The information within this publication is given in good faith and considered to be true, but ECMWF
accepts no liability for error or omission or for loss or damage arising from its use.
Evaluation of ECMWF forecasts

1 Introduction
The most recent change to the ECMWF forecasting system (IFS Cycle 47r1, on 30 June 2020) is
summarised in section 2. The description of changes and meteorological impacts from this upgrade
largely follows the ECMWF Newsletter article of Sleigh et al. (2020). Verification results of the
ECMWF medium-range upper-air forecasts are presented in section 3, including, where available, a
comparison of ECMWF’s forecast performance with that of other global forecasting centres. Section 4
presents the verification of ECMWF forecasts of weather parameters and ocean waves, while severe
weather is addressed in section 5. Finally, section 6 discusses the performance of monthly and seasonal
forecast products.
As in previous reports a wide range of verification results is included and, to aid comparison from year
to year, the set of additional verification scores shown here is consistent with that of previous years
(ECMWF Tech. Memos. 346, 414, 432, 463, 501, 504, 547, 578, 606, 635, 654, 688, 710, 765, 792,
817, 831, 853). A few new plots have been included to highlight additional aspects of ECMWF’s
forecast performance. A short technical note describing the scores used in this report is given at the end
of this document.
Verification pages are regularly updated, and accessible at the following address:
www.ecmwf.int/en/forecasts/charts
by choosing ‘Verification’ under the following headers
 • ‘Medium Range’ (medium-range and ocean waves)
 • ‘Extended Range’ (monthly)
 • ‘Long Range’ (seasonal)

2 Changes to the ECMWF forecasting system
2.1 Meteorological content of IFS Cycle 47r1
On 30 June 2020, ECMWF implemented a substantial upgrade of its Integrated Forecasting System
(IFS). IFS Cycle 47r1 includes changes in the forecast model and in the data assimilation system. The
upgrade has had a small positive impact on forecast skill in the medium and extended range in the
troposphere, and a large positive impact on analyses and forecasts in the stratosphere. The latter is
mainly due to reduced large-scale biases. Cycle 47r1 brings changes in many areas, including:
In data assimilation: revised model error in weak-constraint 4D-Var data assimilation; situation-
dependent skin temperature background error variances from the Ensemble of Data Assimilations
(EDA); shorter time step in the last 4D-Var minimisation; first guess in delayed cut-off 12-hour 4D-Var
obtained from 8-hour Early Delivery Data Assimilation.
In the use of observations: revised ATMS (Advanced Technology Microwave Sounder) observation
errors; spline interpolation introduced in the 2D GPS-RO (radio occultation) bending angle operator.

Technical Memorandum No.880 1
Evaluation of ECMWF forecasts

In the model: quintic vertical interpolation in semi-Lagrangian advection; modified Charnock
parameter for high wind speeds in tropical cyclones; 6-component MODIS (Moderate Resolution
Imaging Spectroradiometer) albedo over land.

2.1.1 Data assimilation
In Cycle 47r1, the covariances controlling the model bias estimate in weak-constraint 4D-Var have been
revised. The previous weak-constraint 4D-Var corrected only a small fraction of the model bias above
40 hPa, while the revised weak-constraint implementation better corrects the diagnosed cold and warm
biases of the model above 100 hPa, reducing the mean error by up to 50%. Results show that biases in
the upper stratosphere between 11 hPa and 1.5 hPa are also significantly reduced in the new system. For
more details, see Laloyaux and Bonavita (2020).
Another important contribution to Cycle 47r1 is a change in the estimate of the background error
variance for skin temperature over land, from constant values to spatially varying, situation-dependent
variances derived from the EDA. This affects the assimilation of microwave and infrared (IR) radiance
observations of the mid- and lower troposphere, which typically contain a contribution of radiation
emitted from the surface. The EDA estimate was activated over land surfaces initially, where the
magnitude of skin temperature errors can be very heterogeneous in space and time.
The time step in the last 4D-Var minimisation has been reduced in this new cycle from 900 seconds to
450 seconds. With this change, the inner loop and outer loop time steps match. This avoids different
gravity wave speeds between the tangent-linear model (used in the computation of the final increment
as part of the last inner loop) and the nonlinear model (outer loop). In the semi-implicit advection scheme
of the IFS, the gravity wave speed depends on the time step. The change brings multiple benefits: clear
improvements to stratospheric analyses and forecasts, and a smaller but statistically significant impact
on tropospheric skill; monotonic convergence of incremental 4D-Var in some atmospheric situations,
such as sudden stratospheric warming events; and an improved initial balance of the 4D-Var analysis.
The concept of continuous data assimilation introduced in Cycle 46r1 has been extended by using the
analyses from each 8-hour Early Delivery Data Assimilation (DA) window as first guesses for the 12-
hour Long-Window Data Assimilation (LWDA). From Cycle 47r1, the LWDA analysis can be viewed
as a time extension of the DA analysis. There is no change in the background state for the LWDA, but
the first minimisation is provided with a more accurate starting point. For more details, see Hólm et al.
(2020).
As a result of this change, the analysis increments in LWDA increase, mainly due to the fact that more
information is extracted from observations. This leads to an apparent degradation of forecasts when they
are verified against own analyses. In reality, forecasts have not deteriorated but the analysis against
which they are assessed has changed. When verified against an independent analysis, like reanalysis,
the impact on forecast skill from this change is neutral overall. An important benefit of this change is
that it allows 4D-Var to more effectively initialise non-linear processes. Short-range forecasts are closer
to observations in particular for observations which are more non‐linearly related to the model state,
such as radiances sensitive to water vapour, cloud and precipitation.

2 Technical Memorandum No.880
Evaluation of ECMWF forecasts

2.1.2 Use of observations
The use of hyperspectral IR data (AIRS, IASI, CrIS instruments) has been enhanced in Cycle 47r1 by
allowing high-peaking channel radiances to be assimilated in locations where lower-peaking channels
are rejected due to aerosol contamination. Up to Cycle 46r1, the aerosol detection scheme rejected entire
IR spectra if aerosol was detected in any channel. The number of assimilated IR observations has
increased by up to 5% for stratospheric channels due to this enhancement. The change is most effective
in regions where aerosol (particularly Saharan dust) occurs most frequently.
In Cycle 47r1, a consistent formulation of the inter-channel error correlations was introduced for ATMS
from the Suomi-NPP and NOAA-20 satellites. This change results in small but consistent improvements
to first-guess fits to independent observations such as AMSU-A and the IR humidity sounding channels,
indicating improved short-range forecasts of tropospheric temperature and humidity.
From Cycle 47r1, a bilinear interpolation replaces the nearest-neighbour interpolation in the
computation of forecast departures for all-sky microwave radiance observations for most variables.
These include temperature and humidity but not cloud hydrometeors and not the land–sea mask, for
which nearest-neighbour interpolation is preferable. This change results in significantly improved first-
guess fits to all-sky microwave imager and sounder radiances.
In Cycle 47r1, an improved interpolation approach has been introduced in the GPS-RO observation
operator for bending angles. This revision of the interpolation ensures that refractivity gradients are
continuous in the vertical and produce more realistic profiles of bending angle variability. The change
leads to a small increase in the standard deviation of GPS-RO first guess departures due to the intended
increase in variability, but the analysis departures are slightly improved.

2.1.3 Model changes
In Cycle 47r1, the advection of temperature and humidity has been changed by increasing the order of
the vertical interpolation in the semi-Lagrangian scheme from three to five. This quintic interpolation in
the semi-Lagrangian advection alleviates an unphysical cooling of the IFS model in the stratosphere at
high horizontal resolution. The change and its impact are described in detail in Polichtchouk et al.
(2020).
A number of improvements have been made to the specification of the shortwave albedo of the land
surface, snow and sea ice. The land-surface albedo is based on a monthly climatology derived from the
MODIS instrument. Until Cycle 46r1, it consisted of separate albedos for direct and diffuse solar
radiation in two spectral regions: ultraviolet/visible, and near-IR. Albedo for direct solar radiation was
computed assuming an overhead sun, for which albedo is systematically lower than for other sun angles.
In Cycle 47r1, the dependence of the direct albedo on solar zenith angle is represented following Schaaf
et al. (2002). This requires six climatological fields, three in each of the two spectral regions. This tends
to increase the albedo of snow-free land surfaces, on average. In addition, the albedo for the 0.625–
0.778 μm band of the shortwave radiation scheme has been determined by a weighted average of the
MODIS albedos for the ultraviolet/visible and the near-IR, instead of using the latter only. The improved
albedo for this spectral band justified the removal of an artificial adjustment of the limits of the
prognostic snow albedo, and the introduction of spectrally varying snow albedos consistent with MODIS
observations as reported by Moody et al. (2007). These changes warm summer land areas in the model

Technical Memorandum No.880 3
Evaluation of ECMWF forecasts

by around 0.1˚C and by up to 0.3˚C over North Africa, primarily due to the darkening of the land surface
from the recomputed albedo in the 0.625–0.778 μm band. There is a small reduction in the root-mean-
square error of temperature forecasts, which stems from a reduction in the model’s cold bias in 2-metre
temperature in many regions. A clear improvement in daytime temperature forecasts over the Sahara
has been observed.
Two additional changes were made in the treatment of radiation: (i) the time series of total solar
irradiance has been updated using data from Matthes et al. (2017), which include the 11-year solar cycle
and are consistent with the latest solar measurements; (ii) the time series of concentrations of greenhouse
gases have been updated (CMIP6’s SSP3-7.0 / option 2). There is no detectable impact of (i) on
forecasts, while (ii) slightly warms the upper stratosphere in analyses and forecasts in present-day
simulations because in Cycle 47r1 CO2 concentrations are consistent with recent measurements and
slightly lower than previously used estimates of CO2 concentrations.
The parametrization of momentum exchange with the ocean surface has been changed in Cycle 47r1.
The relationship is expressed in a wind-speed-dependent drag coefficient. A considerable reduction of
the drag under very strong winds (above 33 m/s) has been introduced. This change of drag over the
ocean at high wind speeds yields a substantial improvement in maximum 10-metre wind speeds in
intense tropical cyclones (Bidlot et al., 2020).
Minor changes have been made in the convection scheme in Cycle 47r1. They involve stability
corrections to the mid-level and deep convective closures and reduced bounds for parcel perturbations.
Furthermore, the convective inhibition diagnostic (CIN) has been revised to use virtual potential
temperature instead of equivalent potential temperature. The revised CIN is now much reduced and is
closer to values expected by forecasters.

2.2 Meteorological impact of the new cycle
Figure 1 and Figure 2 show score changes and their statistical significance for the high-resolution
forecast (HRES) and the ensemble forecast (ENS), respectively. HRES is run at TCo1279 resolution
(corresponding to a horizontal grid spacing of about 9 km) and ENS at TCo639 (corresponding to a
horizontal grid spacing of about 18 km).
The new cycle brings improvements throughout the troposphere of the order of 0.5% in extratropical
forecasts. The improvements are most apparent in ENS scores, both against own analysis and against
observations. In the extratropical stratosphere, the new cycle brings large improvements, such as 2–5%
error reductions for temperature and geopotential at 100 hPa, and 5–15% at 50 hPa. In the tropics, there
is an apparent degradation of 1–3% in upper-air scores when forecasts are verified against the new
cycle’s own analyses. This does not reflect any change for the worse in the forecasts but is the result of
changes to the analysis, as described above. Verification against observations shows that upper-air
changes in the tropics are neutral overall, with small improvements and deteriorations balancing each
other out. One exception is 250 hPa temperature in the tropics, where a deterioration of 1–3% is seen
against observations. This is mainly due to a small (about +0.1 K) shift in the mean, resulting from the
model changes.
The new cycle improves forecasts of several near-surface parameters, most notably 2-metre temperature
and humidity (by about 0.5–1%) both in the extratropics and, when verified against observations, also

4 Technical Memorandum No.880
Evaluation of ECMWF forecasts

in the tropics. Extratropical 10-metre wind in HRES is slightly improved, as well as total cloud cover in
ENS and HRES. Tropical 10-metre wind and precipitation are slightly deteriorated. Significant wave
height is mostly neutral against observations and improved against own analysis.
The impact of Cycle 46r1 on the model climate in the extended range (up to 46 days ahead) was generally
neutral. By contrast, Cycle 47r1 has a significant positive impact in the lower stratosphere, with a
decrease of the cold bias in the tropics at around 50 hPa. The impact of Cycle 47r1 on weekly mean
anomalies is neutral, except for some improvement in 50 hPa meridional wind, and a small but
statistically significant degradation in week 1 in the tropics for upper-level fields. The degradation in
the fair CRPSS is consistent with a slight reduction of ensemble spread in week 1 over the tropics.
In addition to monitoring the evolution of probabilistic forecast skill scores in the scorecards, it is
important to monitor the predictive skill of sources of sub-seasonal predictability, such as the Madden–
Julian Oscillation (MJO). The difference in MJO bivariate correlation between Cycle 47r1 and Cycle
46r1 is not statistically significant. However, in Cycle 46r1, the MJO was too weak compared with the
ERA5 reanalysis (by about 20% after day 15), and Cycle 47r1 weakens the MJO further by 3–4% in the
extended range.
The seasonal forecast is not changed with Cycle 47r1. Nevertheless, the impact of the model upgrade
on the model climate has been evaluated in lower-resolution seasonal forecasts. The most marked impact
on the model climate in the seasonal range comes from introducing quintic vertical interpolation. This
warms the equatorial and winter-hemisphere model climate stratosphere by about 0.5 K from the
tropopause throughout the lower stratosphere, reducing the cold bias. Changes to the model physics
have resulted in a small increase in precipitation in the Intertropical Convergence Zone (ITCZ) year-
round. Longstanding biases in boreal summer zonal 10 m wind in the Indian Ocean increase slightly,
worsening eastern equatorial Indian Ocean sea-surface temperature biases.

3 Verification of upper-air medium-range forecasts
3.1 ECMWF scores
Figure 3 shows the evolution of the skill of the high-resolution forecast of 500 hPa height over Europe
and the extratropical northern and southern hemispheres since 1981. Each point on the curves shows the
forecast range at which the monthly mean (blue lines) or 12-month mean centred on that month (red
line) of the anomaly correlation (ACC) between forecast and verifying analysis falls below 80%. For
the three domains shown, in 2019-20 the score has surpassed all previous 12-month values. This is
mainly due to improvements from model cycle 46r1, which was implemented in June 2019 and
described in detail in last year’s report (Haiden et al., 2019) and in the ECMWF Newsletter (Sleigh et
al., 2019).
A complementary measure of performance is the root mean square (RMS) error of the forecast. Figure
4 shows RMS errors for both extratropical hemispheres of the six-day forecast and the persistence
forecast. In both hemispheres, the 12-month running mean RMS error of the six-day forecast has reached
its lowest values so far.

Technical Memorandum No.880 5
Evaluation of ECMWF forecasts

Figure 5 shows the time series of the average RMS difference between four- and three-day (blue) and
six- and five-day (red) forecasts from consecutive days of 500 hPa forecasts over Europe and the
northern extratropics. This illustrates the inconsistency between successive 12 UTC forecasts for the
same verification time. Consistent with the decrease in RMS error (Figure 4), the 12-month running
mean of this metric has continued its downward trend in both hemispheres.
The quality of ECMWF forecasts in the upper atmosphere in the northern hemisphere extratropics is
shown through time series of temperature and vector wind scores at 50 hPa in Figure 6. Stratospheric
scores benefitted less from model cycle 46r1 but are expected to show improvements due to 47r1,
especially for temperature (see Figure 1).
The trend in ENS performance is illustrated in Figure 7, which shows the evolution of the continuous
ranked probability skill score (CRPSS) for 850 hPa temperature over Europe and the northern
hemisphere. At these relatively large lead times (around day 9), year-to-year variations in atmospheric
predictability affect the score evolution more strongly than in the early medium-range. Unlike for the
HRES, 12-month running mean values have not yet surpassed previous maxima, but there is a tendency
for increased summer skill (seen as minima in the blue curve) in recent years. As soon as a winter season
with higher predictability (such as 2016, 2017, or 2018) occurs, the year-round increase in skill will
become more clearly apparent in the 12-month running mean values.
In a well-tuned ensemble system, the RMS error of the ensemble mean forecast should, on average,
match the ensemble standard deviation (spread). The ensemble spread and ensemble-mean error over
the extratropical northern hemisphere for last winter, as well as the difference between ensemble spread
and ensemble-mean error for the last three winters, are shown in Figure 8. Both for 500 hPa geopotential
height and 850 hPa temperature, forecasts show a good overall match between spread and error. For
both parameters, the match between spread and error has improved overall in 2020 compared to 2019.
A good match between spatially and temporally averaged spread and error is a necessary but not a
sufficient requirement for a well-calibrated ensemble. It should also be able to capture day-to-day
changes in predictability, as well as their geographical variations. This can be assessed using spread-
reliability diagrams. Forecast values of spread over a given region and time period are binned into
equally populated spread categories, and for each bin the average error is determined. In a well-
calibrated ensemble, the resulting line is close to the diagonal. Figure 9 and Figure 10 show spread-
reliability plots for 500 hPa geopotential and 850 hPa temperature in the northern extratropics (top),
Europe (centre), and the tropics (bottom, in Figure 10 only) for different global models. Spread
reliability generally improves with lead time. At day 1 (left panels), forecasts are only moderately
skillful in ‘predicting’ the average error, resulting in curves that deviate significantly from the diagonal,
while at day 6 (right panels) most models are capturing spatio-temporal variations in error pretty well.
Overall, ECMWF performs best, with its spread reliability closest to the diagonal. The stars in the plots
mark the average values, corresponding to Figure 8, and ideally should lie on the diagonal, and as close
to the lower left corner as possible. In this regard ECMWF performs best among the global models with
the exception of 850 hPa temperature at day 1, where the Japan Meteorological Agency (JMA) forecast
has the lowest error (although ECMWF has slightly better match between error and spread).
To create a benchmark for the ENS, the CRPS is also computed for a ‘dressed’ ERA5 forecast. This
allows to better distinguish the effects of IFS developments from those of atmospheric variability and

6 Technical Memorandum No.880
Evaluation of ECMWF forecasts

produces a more robust measure of ENS skill. The dressing uses the mean error and standard deviation
of the previous 30 days to generate a Gaussian distribution around ERA5. Figure 11 shows the evolution
of the CRPS skill of the ENS relative to the ERA5 reference for various upper-air parameters. Both at
forecast days 5 (upper panel) and 10 (lower panel), the effect of 46r1 is clearly visible, leading to a
forecast performance which is at its highest level so far.
The forecast performance in the tropics, as measured by RMS vector errors of the wind forecast with
respect to the analysis, is shown in Figure 12. Both the 200 hPa and 850 hPa errors have decreased
further and, more clearly visible in the day 5 curves, reached their lowest values. Scores for wind speed
in the tropics are generally sensitive to inter-annual variations of tropical circulation systems such as the
Madden-Julian oscillation, or the number of tropical cyclones.

3.2 WMO scores - comparison with other centres
The model inter-comparison plots shown in this section are based on the regular exchange of scores
between WMO designated global data-processing and forecasting system (GDPFS) centres under WMO
Commission for Observation, Infrastructure and Information Systems (Infrastructure Commission)
auspices, following agreed standards of verification.
Figure 13 shows time series of such scores for 500 hPa geopotential height in the northern and southern
hemisphere extratropics. Over the period shown, errors have decreased for all models, while ECMWF
continues to maintain (at the 2-day range) or even slightly increase (at the 6-day range) the lead.
WMO-exchanged scores also include verification against radiosondes. Figure 14 (Europe), and Figure
15 (northern hemisphere extratropics), each showing 500 hPa geopotential height and 850 hPa wind
forecast errors averaged over the past 12 months, confirm the leading performance of ECMWF medium-
range forecasts relative to the other centres from day 2 onwards when verified against observations.
The WMO model intercomparison for the tropics is summarised in Figure 16 (verification against
analyses) and Figure 17 (verification against observations), which show vector wind errors for 250 hPa
and 850 hPa. When verified against the centres’ own analyses, the JMA forecast has the lowest error in
the short range (day-2) while in the medium-range, both ECMWF and JMA are the leading models in
the tropics. In the tropics, verification against analyses (Figure 16) is sensitive to details of the analysis
method, in particular its ability to extrapolate information away from observation locations. When
verified against observations (Figure 17), the ECMWF forecast has the smallest overall errors in the
medium range. The positive effect of cycle 46r1 is not as strong in the tropics as in the extratropics.
Improvements are smaller and only seen against observations.

4 Weather parameters and ocean waves
4.1 Weather parameters – high-resolution and ensemble
The supplementary headline scores for deterministic and probabilistic precipitation forecasts are shown
in Figure 18. The top left panel shows the lead time at which the stable equitable error in probability
space (SEEPS) skill for the high-resolution forecast for precipitation accumulated over 24 hours over
the extratropics drops below 45%. The threshold has been chosen in such a way that the score measures
the skill at a lead time of 3–4 days. For comparison the same score is shown for ERA5. The top right

Technical Memorandum No.880 7
Evaluation of ECMWF forecasts

panel shows the score difference between HRES and ERA5. The bottom left panel shows the lead time
at which the CRPSS for the probability forecast of precipitation accumulated over 24 hours over the
extratropics drops below 10%, the bottom right panel shows the lead time where the Diagonal Skill
Score (DSS) drops below 20%. The ENS thresholds have been chosen in such a way that the scores
measure the skill at a lead time of about 7 days. All plots are based on verification against SYNOP
observations.
The deterministic precipitation forecast has reached its highest level of skill so far. There is considerable
variation in the score due to atmospheric variability, as shown by comparison with the ERA5 reference
forecast (black line in Figure 18, top left panel). By taking the difference between the operational and
ERA5 scores, much of this variability is removed, and the effect of model upgrades is seen more clearly
(upper right panel in Figure 18). The positive effect of cycle 46r1 shows up as a substantial increase
over the year 2019.
The probabilistic precipitation headline score CRPSS (lower left panel in Figure 18) shows a long-term
improvement as well. However, the positive effect from cycle 46r1 is not as readily seen. The year 2019
had overall slightly higher values than 2018 but these have not yet surpassed the high point in 2015. It
should be noted that in addition to the difference HRES vs ENS also the scores used (SEEPS vs CRPSS)
measure different aspects of the forecast. SEEPS, as a categorical score in probability space, does not
penalize errors at high precipitation values as much as the CRPSS. The DSS (lower right panel)
measures, similar to SEEPS, errors in probability space and puts more weight on the discrimination
aspect of the forecast, while the CRPSS is more sensitive to the reliability/calibration of the forecast.
The discrimination ability of the ENS has in fact reached its highest value ever (as seen in the DSS), but
the reliability has decreased somewhat so that the CRPSS has not increased as much.
ECMWF performs a routine comparison of the precipitation forecast skill of ECMWF and other centres
for both the high-resolution and the ensemble forecasts using the TIGGE data archived in the
Meteorological Archival and Retrieval System (MARS). Results using these same headline scores for
the last 12 months show both the HRES and ENS leading with respect to the other centres (Figure 19).
ECMWF’s probabilistic precipitation forecasts retain positive skill beyond day 9.
Trends in mean error (bias) and standard deviation for 2 m temperature, 2 m dewpoint, total cloud cover,
and 10 m wind speed forecasts over Europe are shown in Figure 20 to Figure 23. Verification is
performed against SYNOP observations. The matching of forecast and observed value uses the nearest
grid-point method. A standard correction of 0.0065 K m-1 for the difference between model orography
and station height is applied to the temperature forecasts.
For 2 m temperature (Figure 20), the reduction in error standard deviation (upper curves) which started
around 2016, has continued in 2019. Biases in 2 m temperature (lower curves) have however remained
very similar to previous years. For 2 m dewpoint (Figure 21), error standard deviation shows little
change in 2019, but the dry bias (especially during the day) has been slightly reduced. Systematic errors
in near-surface parameters have been investigated in the USURF project (‘Understanding uncertainties
in surface-atmosphere exchange’), which has helped to identify the causes of some of the biases and
informed ongoing and future model changes (Haiden et al., 2018; Schmederer et al., 2019). A
comprehensive summary of the USURF activities, which have ended in 2020, and their main outcomes,
has been published.

8 Technical Memorandum No.880
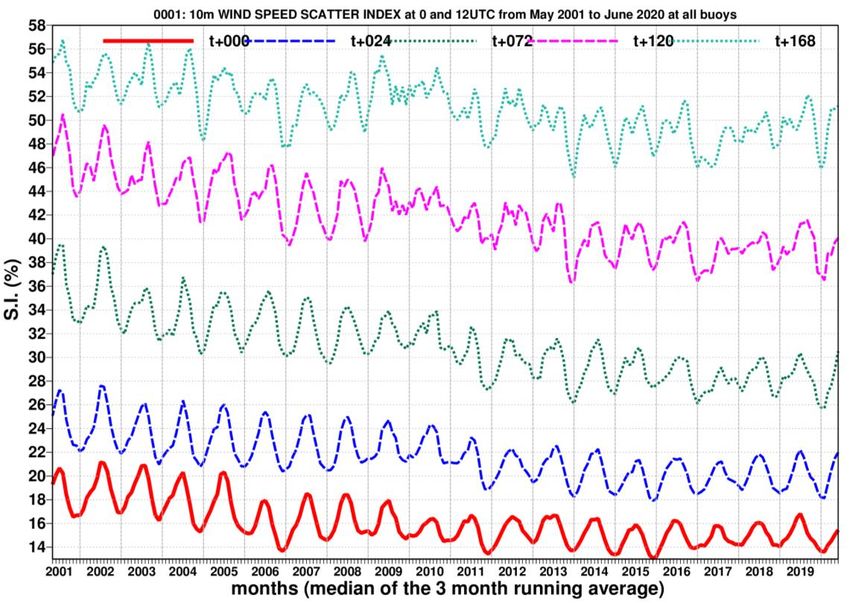
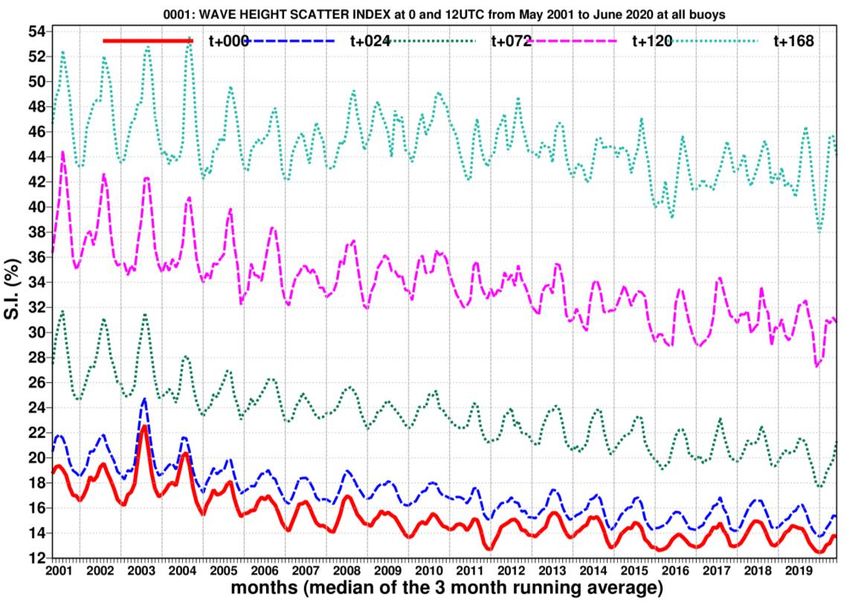
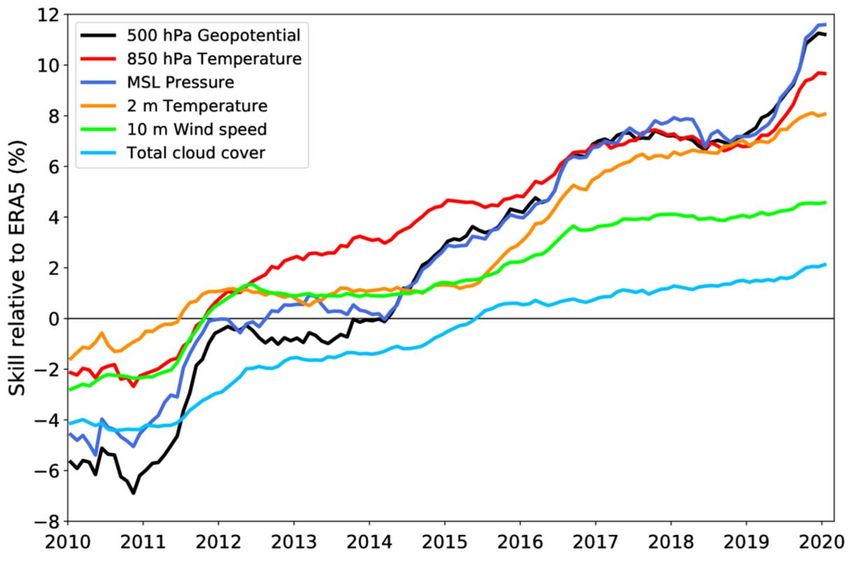
Evaluation of ECMWF forecasts

For total cloud cover (Figure 22) and 10 m wind speed (Figure 23) there has been little change, both in
terms of error standard deviation and bias.
It is worth noting that the mean errors documented in Figure 20 to Figure 23 do not show the full range
of biases on the regional scale, due to compensation effects. For example, in winter there is a positive
night-time bias in 2 m temperature of several K in northern Scandinavia, while in the rest of Europe
there is a negative bias of 0.5-1 K. As a result of USURF, these issues are now better understood. For
example, the positive night-time bias in northern Scandinavia in winter is partly due to the use of a
single-layer model of snow on the ground, and a multi-layer scheme is currently being prepared for
inclusion in one of the next model cycles.
ERA5 is useful as a reference forecast for the HRES, as it allows filtering out some of the effects of
atmospheric variations on scores. Figure 24 shows the evolution of skill at day 5 relative to ERA5 in the
northern hemisphere extratropics for various upper-air and surface parameters. The metric used is the
error standard deviation. Curves show 12-month running mean values. Improvements in near-surface
variables are generally smaller than those for upper-air parameters, partly because they are verified
against SYNOP, which implies a certain representativeness mismatch that is a function of model
resolution. For the upper-air variables (verification against analysis), the positive effect from 46r1 is
quite strong, and the largest of the last 5 years. For the near-surface variables, there is a clear signal in
2 m temperature, and slight positive effects for 10 m wind speed and total cloud cover.
The fraction of large 2 m temperature errors in the ENS has been adopted as an additional ECMWF
headline score. An ENS error is considered ‘large’ in this context whenever the CRPS exceeds 5 K.
Figure 25 shows that in the annual mean (red curve) this fraction has decreased from about 7% to 4.5%
over the last 15 years, and that there are large seasonal variations, with values in winter more than twice
as high as in summer. The beneficial effect of the resolution upgrade in 2016 is apparent, but further
improvements were achieved by more recent model upgrades. The winter 2019-20 is the 6th winter in
succession that shows a reduction in the number of large errors compared to the previous one.
A similar measure of the skill in predicting large 10 m wind speed errors in the ENS is shown in Figure
26. Here, a threshold of 4 m/s for the CRPS is used, to obtain similar fractions as for temperature. As
for temperature, the 2016 resolution upgrade has resulted in a substantial decrease of the large error
fraction. Whether the recent slight increase, driven by winter 2019-20, indicates an actual reduction in
skill or is just due to atmospheric variability, needs to be investigated.

4.2 Ocean waves
The quality of the ocean wave model analysis and forecast is shown in the comparison with independent
ocean buoy observations in Figure 27. While errors in 10 m wind speed have not changed too much in
2019 compared to previous years, the wave height forecasts have further improved. This is also seen in
the verification against analysis (Figure 28). Improvements from cycle 46r1 are most evident in the 5-
day forecasts (red curves) and, in the southern hemisphere, also in the 10-day forecast.
ECMWF has become the WMO Lead Centre for Wave Forecast Verification, and in this role, it collects
forecasts from wave forecasting centres to verify them against buoy observations. An example of this
comparison is shown in Figure 29 for the 3-month period March-May 2020. In the extratropics, ECMWF
and Meteo-France (which uses ECMWF winds) generally lead other centres in significant wave height,

Technical Memorandum No.880 9
Evaluation of ECMWF forecasts

while for peak period ECMWF is within the bundle of models, ranking between 3rd and 5th. In the
tropics (Figure 30), ECMWF is leading in terms of peak period, and ranking 2nd for significant wave
height. This difference in ranking between extratropics and tropics is partially due to different wave
characteristics and partly due to the different distribution of buoys in terms of proximity to coasts
between extratropics and tropics.
A comprehensive set of wave verification charts is available on the ECMWF website at
http://www.ecmwf.int/en/forecasts/charts
under ‘medium-range verification’ (select parameter ‘Ocean waves’). Verification results from the
WMO Lead Centre for Wave Forecast Verification can be found at
https://confluence.ecmwf.int/display/WLW/WMO+Lead+Centre+for+Wave+Forecast+Verification+L
C-WFV

5 Severe weather
Supplementary headline scores for severe weather are:
• The skill of the Extreme Forecast Index (EFI) for 10 m wind speed verified using the relative
operating characteristic area (Section 5.1)
• The tropical cyclone position error for the high-resolution forecast (Section 5.2)

5.1 Extreme Forecast Index (EFI)
The Extreme Forecast Index (EFI) was developed at ECMWF as a tool to provide early warnings for
potentially extreme events. By comparing the ensemble distribution of a chosen weather parameter to
the model’s climatological distribution, the EFI indicates occasions when there is an increased risk of
an extreme event occurring. Verification of the EFI has been performed using synoptic observations
over Europe from the GTS. An extreme event is judged to have occurred if the observation exceeds the
95th percentile of the observed climate for that station (calculated from a moving 15-year sample). The
ability of the EFI to detect extreme events is assessed using the relative operating characteristic (ROC).
The headline measure, skill of the EFI for 10 m wind speed at forecast day-4 (24-hour period 72–96
hours ahead), is shown by the blue lines in the left column of Figure 31 (top), together with results for
days 1–3 and day 5. Corresponding results for 24-hour total precipitation (centre) and 2 m temperature
(bottom) are shown as well. Each plot contains seasonal values, as well as the four-season running mean,
of ROC area skill scores; the final point on each curve includes the spring (March–May) season 2020.
For wind speed, skill has been high in 2019 compared to previous years, while for precipitation and
temperature, ROC skill has reached a plateau in recent years, with some inter-annual variations.
A complementary way of verifying extremes is to use the Diagonal Elementary Skill Score DESS
(Bouallegue et al., 2018), as shown in the right column of Figure 31 for the same three variables. It is
based on verification in probability space and, like the ROC area, it emphasizes the discrimination aspect
of the forecast. As for the EFI, the 95th quantile is used, but for wind and temperature, instantaneous
rather than daily averages are used. Another difference between the two methods is that in the
computation of the DESS, observation uncertainty (representativeness) has been explicitly taken into
account using the method described in Bouallegue et al. (2020).

10 Technical Memorandum No.880
Evaluation of ECMWF forecasts

It can be seen that in terms of the DESS, forecast skill has increased more continuously in recent years
than in terms of EFI ROC area. Medium-range (day 5, red curves) performance has reached a new high
point for all three parameters in 2019.

5.2 Tropical cyclones
The tropical cyclone position error for the 3-day high-resolution forecast is one of the two supplementary
headline scores for severe weather. The average position errors for the high-resolution medium-range
forecasts of all tropical cyclones (all ocean basins) over the last ten 12-month periods are shown in
Figure 32. Errors in the forecast central pressure of tropical cyclones are also shown. The comparison
of HRES and ENS control (central four panels) demonstrates the benefit of higher resolution for some
aspects of tropical cyclone forecasts.
Both HRES and ENS position errors at day 5 (top and bottom panels, Figure 32) have increased in the
latest season. Comparison with ERA5 (grey curves) shows that this is due to variations in predictability.
The HRES mean absolute error of intensity has further decreased, and the grey curve shows that this is
an actual improvement also relative to ERA5.
The bottom panel of Figure 32 shows the spread and error of ensemble forecasts of tropical cyclone
position. For reference, the HRES error is also shown. The forecast was generally under-dispersive
before the resolution upgrade in 2010, but the spread-error relationship has improved since then. At day
3, the spread has become more underdispersive again, however for day 5 the match between spread and
error is quite good.
The ensemble tropical cyclone forecast is presented on the ECMWF website as a strike probability: the
probability at any location that a reported tropical cyclone will pass within 120 km during the next
240 hours. Verification of these probabilistic forecasts for the three latest 12-month periods is shown in
Figure 33. Results show a small increase in reliability compared to the previous year (top panel), but
still less than 2 years before. Skill is shown by the ROC and the modified ROC, the latter using the false
alarm ratio (fraction of yes forecasts that turn out to be wrong) instead of the false alarm rate (ratio of
false alarms to the total number of non-events) on the horizontal axis. This removes the reference to
non-events in the sample and shows more clearly the reduction in false alarms in those cases where the
event is forecast. For both measures, strike probability skill has increased in the most recent season but
not quite reached the level of 2 years ago.

6 Monthly and seasonal forecasts

6.1 Monthly forecast verification statistics and performance
Figure 34 shows the probabilistic performance of the monthly forecast over the extratropical northern
hemisphere for summer (JJA, top panels) and winter (DJF, bottom panels) seasons since September
2004 for week 2 (days 12–18, left panels) and week 3+4 (days 19–32 right panels). Curves show the
ROC score for the probability that the 2 m temperature is in the upper third of the climate distribution
in summer, and in the lower third of the climate distribution in winter. Thus it is a measure of the ability
of the model to predict warm anomalies in summer and cold anomalies in winter. For reference, the
ROC score of the persistence forecast is also shown in each plot. Forecast skill for week 2 exceeds that

Technical Memorandum No.880 11
Evaluation of ECMWF forecasts

of persistence by about 10%, for weeks 3 to 4 (combined) by about 5%. In weeks 3 to 4 (14-day period),
summer warm anomalies appear to have slightly higher predictability than winter cold anomalies,
although the latter has increased in recent winters (with the exception of 2012). In 2019, week 2 forecast
skill for summer warm anomalies was somewhat lower than in 2018, however skill above persistence
was comparable to 2018, also for week 2 cold anomalies. Summer week 3+4 forecast skill and
persistence were near the upper end of values seen so far. Week 3+4 skill for winter cold anomalies in
2019 was high, but only marginally higher than persistence.
Because of the low signal-to-noise ratio of real-time forecast verification in the extended range (Figure
34), re-forecasts are a useful additional resource for documenting trends in skill. Figure 35 shows the
skill of the ENS in predicting 2 m temperature anomalies in week 3 in the northern extratropics. This is
an additional headline score of ECMWF which was recommended by the TAC Subgroup on
Verification. Verification against both SYNOP and ERA-Interim analyses shows that there has been a
substantial increase in skill from 2005-2012, and little change (against analysis), and a slight decrease
(against observations) thereafter. However, a marked increase is seen in 2020, which is mainly due to
ERA5 replacing ERA-Interim as initial condition for the reforecasts. Due to this change, the reforecast
skill has in a way ‘caught up’ again and has become more representative of real-time forecast skill. Note
also that the verification is based on a sliding 20-year period and is therefore less sensitive to changes
from year to year than the real-time forecast evaluation, but some sensitivity remains, e.g. due to major
El Niño events falling within, or dropping out of, the sliding period.
An evaluation of forecast skill from the medium to the extended range in terms of large-scale Euro-
Atlantic regimes and their effect on severe cold anomalies in Europe has been given by Ferranti et al.
(2018).
Comprehensive verification for the monthly forecasts is available on the ECMWF website at:
http://www.ecmwf.int/en/forecasts/charts

6.2 Seasonal forecast performance

6.2.1 Seasonal forecast performance for the global domain
The current version SEAS5 of the seasonal component of the IFS (implemented in November 2017)
includes updated versions of the atmospheric (IFS) and interactive ocean (NEMO) models and adds the
interactive sea ice model LIM2. While re-forecasts span 36 years (from 1981 to 2016), the re-forecast
period used to calibrate the forecasts when creating products uses the more recent period 1993 to 2016.
Compared to the previous version, SEAS5 shows an improvement in SST drift, especially in the tropical
Pacific, and improvements in the prediction skill of Arctic sea ice.
A set of verification statistics based on re-forecast integrations from SEAS5 has been produced and is
presented alongside the forecast products on the ECMWF website at
www.ecmwf.int/en/forecasts/charts

by choosing ‘Verification’ under the header ‘Long Range’. A comprehensive user guide for SEAS5 is
provided at:

12 Technical Memorandum No.880
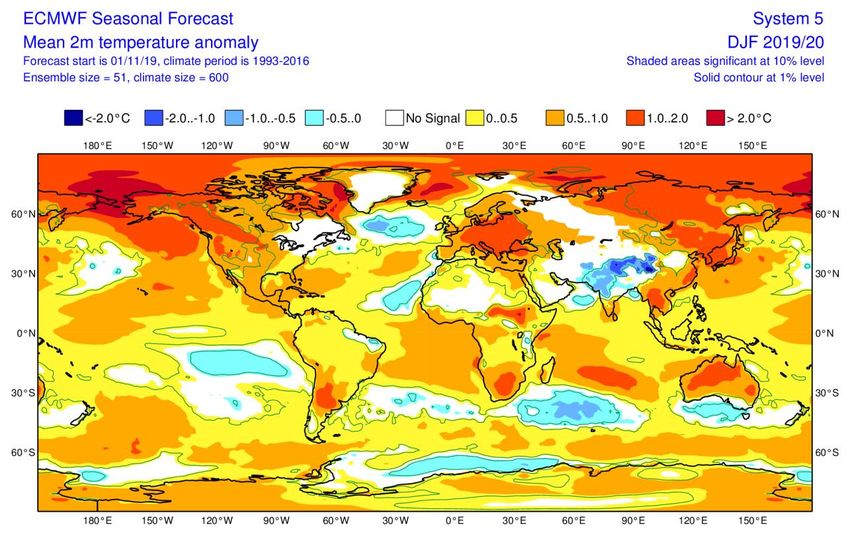
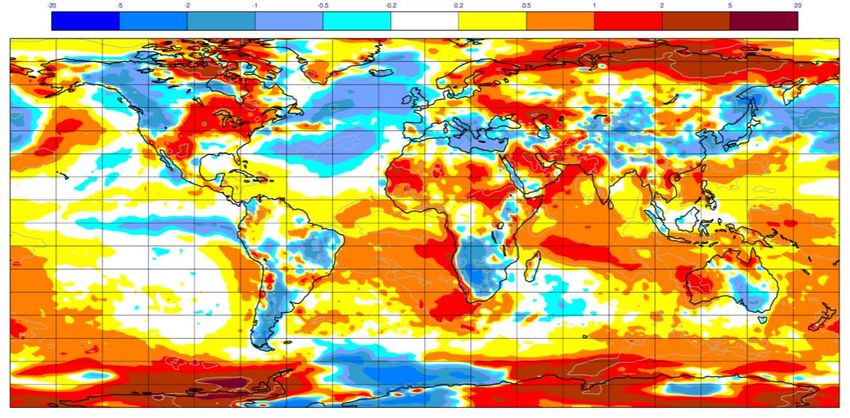
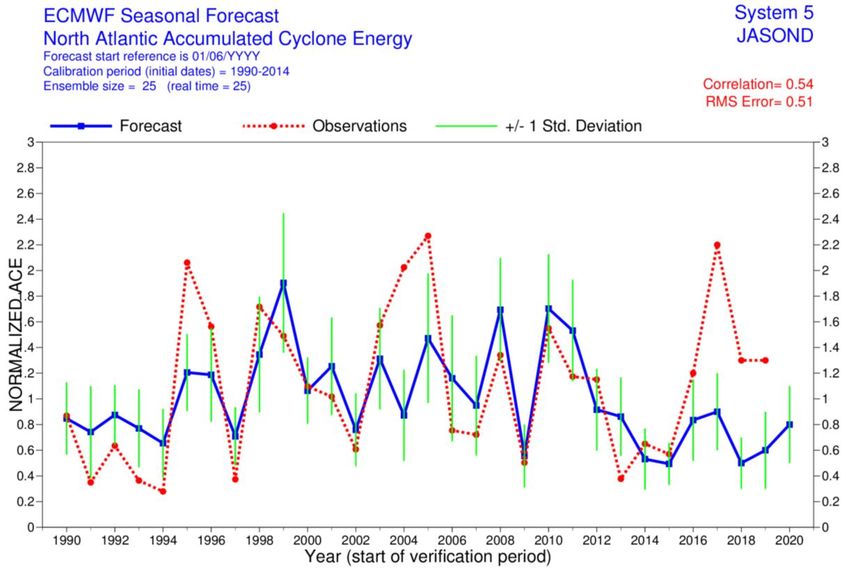
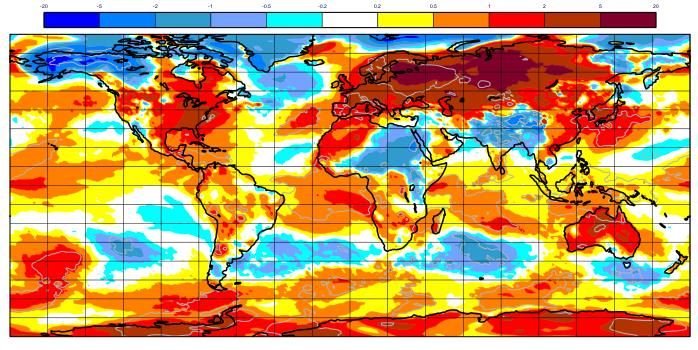
Evaluation of ECMWF forecasts

https://www.ecmwf.int/sites/default/files/medialibrary/2017-10/System5_guide.pdf

6.2.2 The 2019–2020 El Niño forecasts
The summer of 2019 was characterized by a return from weakly positive SST anomalies to neutral
conditions in the eastern tropical Pacific. While this scenario was among those given by the ensemble
forecasts in May 2019 (Figure 36, top row), the spread both in SEAS5 and C3S was very large such that
no clear guidance could be derived from the forecast. Forecasts for subsequent seasons had less spread,
and correctly indicated an evolution toward small positive SST anomalies. The second return to neutral
conditions in spring 2020 (and the change to even slightly negative SST anomalies) was indicated
qualitatively, but the timing was not captured well. Forecasts at first predicted the change too early and
subsequently too late. Comparison of SEAS5 and C3S shows that the multi-model ensemble, due to its
larger spread, better covers the observed evolution. Comparing the forecasts of Nov 2019 and Feb 2020
(Figure 36, 3rd and 4th rows) we can see that C3S does not indiscriminately produce more spread, and
that the spread difference between the two could be used as additional guidance.

6.2.3 Tropical storm predictions from the seasonal forecasts
The 2019 Atlantic hurricane season had a total of 18 named storms including 6 hurricanes and 3 major
hurricanes. It was the fourth consecutive above-average and damaging season, with an accumulated
cyclone energy index (ACE) of about 130% of the 1993–2015 climate average (Figure 37). Seasonal
tropical storm predictions from SEAS5 indicated a below average level of activity over the Atlantic
(ACE of about 60% (+/- 30%) of the 1993–2015 climate average). Similarly, the number of tropical
storms (18) which formed in 2019 was above average (13) whereas the forecast predicted 8.5 (with a
range from 5.5 to 11) tropical storms in the Atlantic (Figure 38). Subsequent forecasts issued in July and
August predicted an average season. This poor seasonal forecast can partly be related to the
overestimation of the 2019 El-Niño event as well as to the failure of the model to represent decadal
changes of tropical cyclone activity including the increased tropical cyclone activity over the Atlantic
since 2016.
Figure 38 also shows that SEAS5 predicted above average activity over the eastern North Pacific and
western North Pacific (ACE of about 110% of the 1993–2015 climate average). The 2019 Pacific
typhoon season was indeed an above-average season producing 29 storms, 17 typhoons, and 4 super
typhoons, with an ACE about 10% above average, as predicted by SEAS5. The eastern North Pacific
hurricane season was also an above average season with 17 named storms from July to December (1993-
2017 climate average is 12 tropical storms) while SEAS5 predicted 15.

6.2.4 Extratropical seasonal forecasts
Because of the lack of a strong El Niño or La Niña signal, low seasonal predictive skill would have been
expected for 2019. However, a very strong positive phase of the Indian Ocean Dipole (IOD) peaking
towards the end of 2019 became the main tropical driver of global long-range forecast skill. As a result,
2 m temperature anomaly patterns in boreal winter (DJF 2019–20) were reasonably well predicted over
large parts of the globe, especially over ocean areas, including the North Atlantic (Figure 39). In mid-
and high-latitude regions of the American and Eurasian continents, however, forecast skill was lower.

Technical Memorandum No.880 13
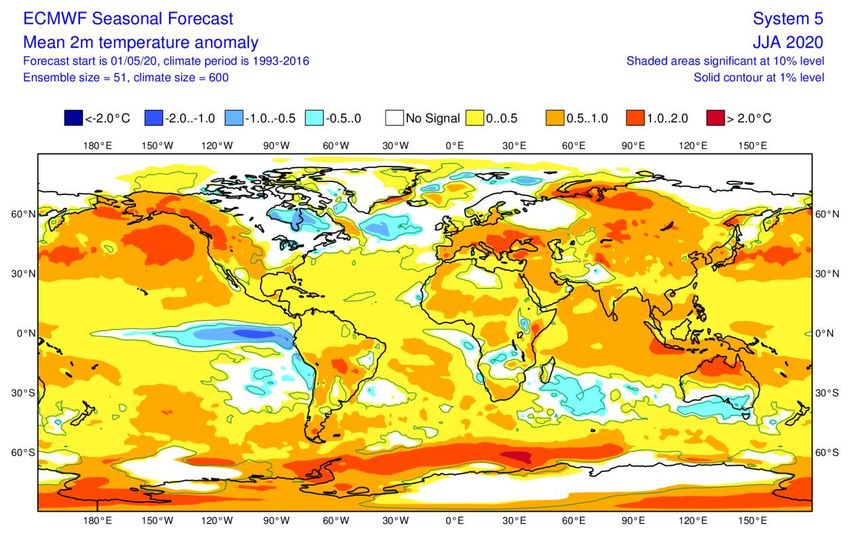
Evaluation of ECMWF forecasts

The extreme positive anomaly over Siberia (exceeding 1.5 standard deviations in some areas) was hinted
at but not captured in magnitude, and the cold anomaly in Alaska and northern Canada was missed.
In spring 2020, both the IOD as well as temperature anomalies in the tropical Pacific returned to close-
to-neutral values, leaving the 2020 boreal summer without two strong drivers on seasonal timescales.
The seasonal forecast captured the weak cold anomaly in the tropical eastern Pacific (El Niño region),
and the warm anomaly over the Indian Ocean and, in part, the strong warm anomalies around Antarctica
(Figure 40). However, in the Northern Hemisphere, and especially over the continents, there is little
resemblance between forecast and analysis. This includes Europe, where a cold anomaly in the
Mediterranean area, and higher than normal temperatures in most of Scandinavia (forming the western
extension of the strong Siberian warm anomaly) were missed in the forecast.
Since the ensemble mean carries only part of the information provided by an ensemble, we also look at
the forecast distribution in the form of quantile (climagram) plots. Climagrams for Northern and
Southern Europe for winter 2019-20 and summer 2020 are shown in Figure 41. Red squares indicate
observed monthly anomalies. The November 2019 forecast for winter season 2019-20 gave a good
indication of the warm anomalies observed both in Northern and Southern Europe. For example, the
forecast gave a high probability for a very warm January 2020 in Northern Europe, as observed. The
magnitude of the anomaly was slightly higher than the 95th quantile of the forecast. The May 2020
forecast for summer 2020 was less skillful, which is expected for summer seasons in general. Whereas
in winter, the sign of the forecast anomaly was predicted correctly most of the time, in summer there
were more discrepancies such as a cold June in Southern Europe and and cold July in Northern Europe.
In both seasons, observations fall within the ensemble distribution with few exceptions.

14 Technical Memorandum No.880
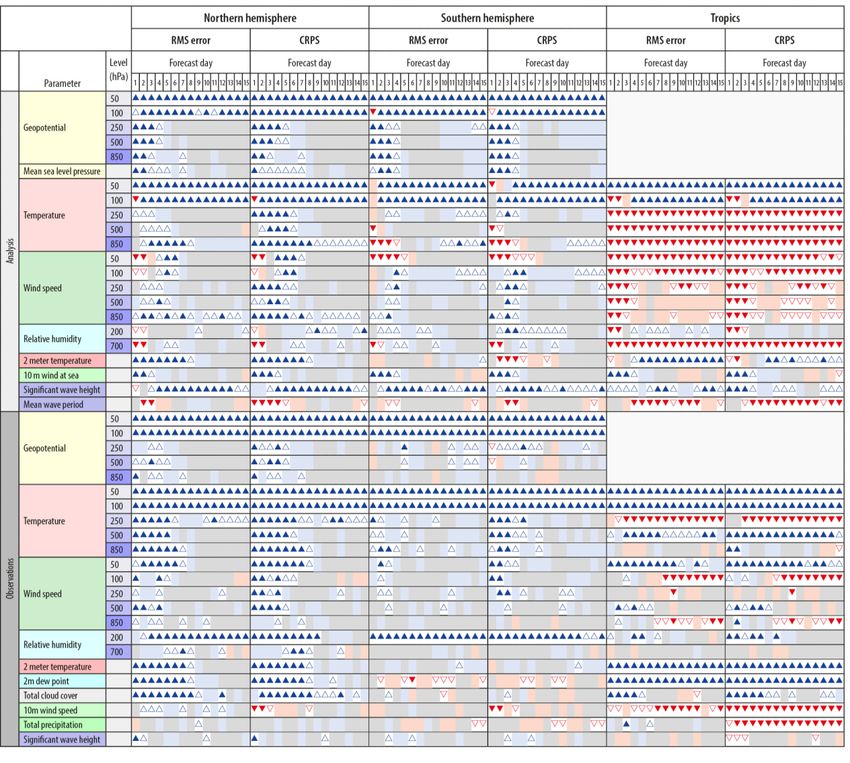
Evaluation of ECMWF forecasts

Figure 1: Summary score card for IFS Cycle 47r1. Score card for HRES cycle 47r1 versus cycle 46r1 verified by
the respective analyses and observations at 00 and 12 UTC for 780 forecast runs in the period December 2018 to
June 2020. Yellow colouring indicates that symbols refer to the second score indicated at the top of the column.

Technical Memorandum No.880 15
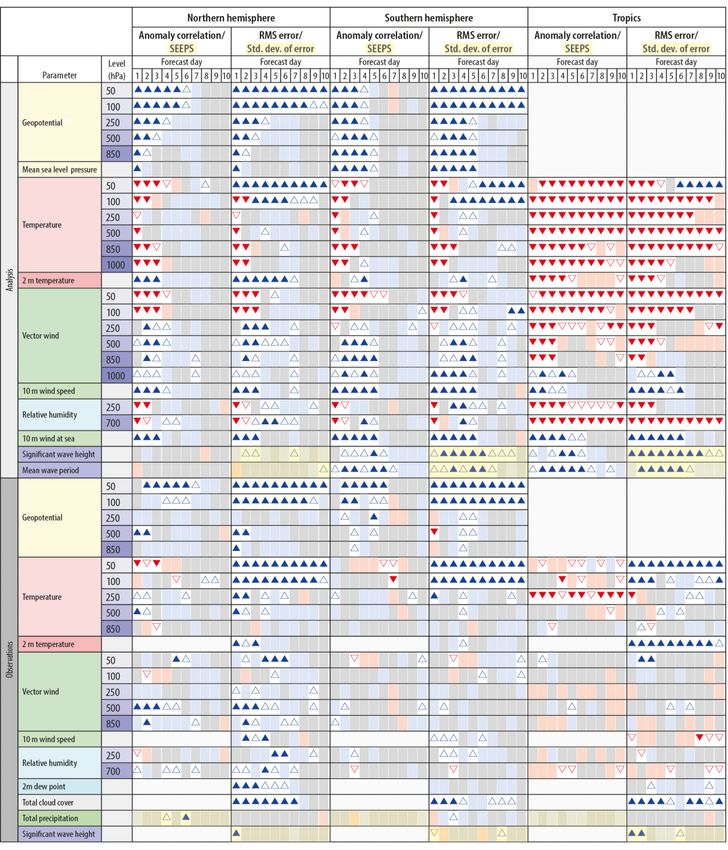
Evaluation of ECMWF forecasts

Figure 2: Summary ENS score card for IFS Cycle 47r1. Score card for ENS cycle 47r1 versus cycle 46r1 verified
by the respective analyses and observations at 00 UTC for 495 ENS forecast runs in the period December 2018 to
June 2020.

16 Technical Memorandum No.880
Evaluation of ECMWF forecasts

 Europe

 NH

 SH

Figure 3: Primary headline score for the high-resolution forecasts. Evolution with time of the 500 hPa geopotential
height forecast performance – each point on the curves is the forecast range at which the monthly mean (blue lines)
or 12-month mean centred on that month (red line) of the forecast anomaly correlation (ACC) with the verifying
analysis falls below 80% for Europe (top), northern hemisphere extratropics (centre) and southern hemisphere
extratropics (bottom).

Technical Memorandum No.880 17
Evaluation of ECMWF forecasts

 NH

 SH

Figure 4: Root mean square (RMS) error of forecasts of 500 hPa geopotential height (m) at day 6 (red), verified
against analysis. For comparison, a reference forecast made by persisting the analysis over 6 days is shown (blue).
Plotted values are 12-month moving averages; the last point on the curves is for the 12-month period August 2019–
July 2020. Results are shown for the northern extra-tropics (top), and the southern extra-tropics (bottom).

18 Technical Memorandum No.880
Evaluation of ECMWF forecasts

 Europe

 NH

Figure 5: Inconsistency of the 500 hPa height forecasts over Europe (top) and northern extratropics (bottom).
Curves show the monthly average RMS difference between forecasts for the same verification time but initialised
24 h apart, for 96–120 h (blue) and 120–144 h (red). 12-month moving average scores are also shown (in bold).

Technical Memorandum No.880 19
Evaluation of ECMWF forecasts

 50 hPa temperature

 50 hPa wind speed

Figure 6: Model scores for temperature (top) and wind (bottom) in the northern extratropical stratosphere. Curves
show the monthly average RMS temperature and vector wind error at 50 hPa for one-day (blue) and five-day (red)
forecasts, verified against analysis. 12-month moving average scores are also shown (in bold).

20 Technical Memorandum No.880
Evaluation of ECMWF forecasts

 Europe

 N Hemisphere Extratropics

Figure 7: Primary headline score for the ensemble probabilistic forecasts. Evolution with time of 850 hPa
temperature ensemble forecast performance, verified against analysis. Each point on the curves is the forecast
range at which the 3-month mean (blue lines) or 12-month mean centred on that month (red line) of the continuous
ranked probability skill score (CPRSS) falls below 25% for Europe (top), northern hemisphere extratropics
(bottom).

Technical Memorandum No.880 21
Evaluation of ECMWF forecasts

Figure 8: Ensemble spread (standard deviation, dashed lines) and RMS error of ensemble-mean (solid lines) for
winter 2019–2020 (upper figure in each panel), and differences of ensemble spread and RMS error of ensemble
mean for last three winter seasons (lower figure in each panel, negative values indicate spread is too small);
verification is against analysis, plots are for 500 hPa geopotential (top) and 850 hPa temperature (bottom) over the
extratropical northern hemisphere for forecast days 1 to 15.

22 Technical Memorandum No.880
Evaluation of ECMWF forecasts

Figure 9: Ensemble spread reliability of different global models for 500 hPa geopotential for the period August
2019–July 2020 in the northern hemisphere extra-tropics (top) and in Europe (bottom) for day 1 (left) and day 6
(right), verified against analysis. Circles show error for different values of spread, stars show average error-spread
relationship. Due to random outages in the data supply, NCEP curves are based on a reduced data set (70%).

Technical Memorandum No.880 23
Evaluation of ECMWF forecasts

Figure 10: As Figure 9 for 850 hPa temperature.

24 Technical Memorandum No.880
Evaluation of ECMWF forecasts

Figure 11: Skill of the ENS at day 5 (top) and day 10 (bottom) for upper-air parameters in the northern extra-
tropics, relative to a Gaussian-dressed ERA5 forecast. Values are running 12-month averages, and verification is
performed against own analysis.

Technical Memorandum No.880 25
Evaluation of ECMWF forecasts

 200 hPa

 850 hPa

Figure 12: Forecast performance in the tropics. Curves show the monthly average RMS vector wind errors at 200
hPa (top) and 850 hPa (bottom) for one-day (blue) and five-day (red) forecasts, verified against analysis. 12-month
moving average scores are also shown (in bold).

26 Technical Memorandum No.880
Evaluation of ECMWF forecasts

Figure 13: WMO-exchanged scores from global forecast centres. RMS error of 500 hPa geopotential height over
northern (top box) and southern (bottom box) extratropics. In each box the upper plot shows the two-day forecast
error and the lower plot shows the six-day forecast error of model runs initiated at 12 UTC. Each model is verified
against its own analysis. JMA = Japan Meteorological Agency, CMC = Canadian Meteorological Centre, UKMO
= the UK Met Office, KMA = Korea Meteorological Administration, NCEP = U.S. National Centers for
Environmental Prediction, DWD = Deutscher Wetterdienst.

Technical Memorandum No.880 27
Evaluation of ECMWF forecasts

Figure 14: WMO-exchanged scores for verification against radiosondes: 500 hPa height (top) and 850 hPa wind
(bottom) RMS error over Europe (annual mean August 2019–July 2020) of forecast runs initiated at 12 UTC.

28 Technical Memorandum No.880
Evaluation of ECMWF forecasts

Figure 15: As Figure 14 for the northern hemisphere extratropics.

Technical Memorandum No.880 29
Evaluation of ECMWF forecasts

Figure 16: WMO-exchanged scores from global forecast centres. RMS vector wind error over tropics at 250 hPa
(top box) and 850 hPa (bottom box). In each box the upper plot shows the two-day forecast error and the lower
plot shows the six-day forecast error of model runs initiated at 12 UTC. Each model is verified against its own
analysis.

30 Technical Memorandum No.880
Evaluation of ECMWF forecasts

Figure 17: As Figure 16 for verification against radiosonde observations.

Technical Memorandum No.880 31
Evaluation of ECMWF forecasts

 SEEPS SEEPS difference
 HRES

 ERA5 HRES – ERA5

 CRPSS DSS

Figure 18: Supplementary headline scores (left column) and additional metrics (right column) for deterministic
(top) and probabilistic (bottom) precipitation forecasts. The evaluation is for 24-hour total precipitation verified
against synoptic observations in the extratropics. Curves show the number of days for which the centred 12-month
mean skill remains above a specified threshold. The forecast day on the y-axis is the end of the 24-hour period
over which the precipitation is accumulated. The black curve in the top left panel shows the deterministic headline
score for ERA5, and the top right panel shows the difference between the operational forecast and ERA5 (blue).
Probabilistic scores in the bottom row are the Continuous Ranked Probability Skill Score (CRPSS) and the
Diagonal Skill Score (DSS).

32 Technical Memorandum No.880
You can also read