Geraldton CBD and Port Flood and Inundation Study
←
→
Page content transcription
If your browser does not render page correctly, please read the page content below
Geraldton CBD and Port Flood and Inundation Study
 Project Modelling Report

 Geraldton CBD and Port
 Flood and Inundation Study

 Project Modelling Report

 CW1096100

 Prepared for
 City of Greater Geraldton and Midwest Port
 Authority – Port of Geraldton

 11 February 2021

11 February 2021 Cardno i
Geraldton CBD and Port Flood and Inundation Study
 Project Modelling Report

 Contact Information Document Information
 Cardno (WA) Pty Ltd Prepared for City of Greater Geraldton
 ABN 77 009 119 000 and Midwest Port Authority –
 Port of Geraldton
 11 Harvest Terrace
 Project Name Project Modelling Report
 West Perth WA 6005
 Australia
 File Reference CW1096100-RP-001-
 ProjectModellingReport_Rev
 www.cardno.com
 0.docx
 Phone +61 8 9273 3888
 Fax +61 8 9486 8664 Job Reference CW1096100

 Date 11 February 2021

 Version Number Rev 0

 Author(s):

 Sajidul Haque - Water Engineer Effective Date 11/02/2021

 Zac McCosker - Water Engineer

 Frederic Saint-Cast - Principal Coastal Engineer

 Approved By:

 Frederic Saint-Cast - Principal Coastal Engineer Date Approved 11/02/2021

Document History
 Version Effective Date Description of Revision Prepared by Issued to

 A 30/11/2020 Draft report for internal review Sajidul Haque Ryan Brooke
 Zac McCosker Cory Smith
 Frederic Saint-Cast
 B 3/12/2020 Draft report for client review Frederic Saint-Cast Monica Sullivan - MWPA
 Mike Dufour - CGG
 0 10/02/2021 Final report for client use Frederic Saint-Cast Monica Sullivan - MWPA
 Mike Dufour - CGG

© Cardno. Copyright in the whole and every part of this document belongs to Cardno and may not be used, sold, transferred, copied or reproduced in whole
or in part in any manner or form or in or on any media to any person other than by agreement with Cardno.

This document is produced by Cardno solely for the benefit and use by the client in accordance with the terms of the engagement. Cardno does not and
shall not assume any responsibility or liability whatsoever to any third party arising out of any use or reliance by any third party on the content of this
document.

Our report is based on information made available by the client. The validity and comprehensiveness of supplied information has not been independently
verified and, for the purposes of this report, it is assumed that the information provided to Cardno is both complete and accurate. Whilst, to the best of our
knowledge, the information contained in this report is accurate at the date of issue, changes may occur to the site conditions, the site context or the
applicable planning framework. This report should not be used after any such changes without consulting the provider of the report or a suitably qualified
person.

CW1096100 | 11 February 2021 | Commercial in Confidence ii
Geraldton CBD and Port Flood and Inundation Study
 Project Modelling Report

Table of Contents
 Executive Summary 1
 1 Introduction 3
 2 Study area 4
 2.1 Geographic location 4
 2.2 Climate and rainfall 4
 2.3 Coastal processes 4
 3 Data review 6
 3.1 Elevation data 6
 3.2 Land use 7
 3.3 Drainage data 8
 3.4 Ocean water levels 8
 4 Hydrology 10
 4.1 Catchment delineation 10
 4.2 Model setup 10
 4.3 Model parameters 11
 4.4 Impervious fractions 12
 4.5 Rainfall losses 13
 4.6 Design rainfall depths 13
 4.7 Storm temporal pattern 13
 4.8 Model verification 13
 4.9 Model results 14
 5 Coastal and nearshore processes modelling 16
 5.1 Background 16
 5.2 Coastal and nearshore modelling framework 17
 5.3 Extreme design water level conditions 20
 5.4 Extreme design wave conditions 24
 5.5 Storm tide scenarios 25
 5.6 Tsunami inundation scenarios 30
 6 Preliminary hydraulic model 32
 6.1 Model boundary 32
 6.2 Cell size 32
 6.3 Topography 32
 6.4 Roughness 32
 6.5 Boundary condition and initial water level 33
 6.6 Rainfall 33
 6.7 Rainfall losses 33
 6.8 Model validation 33
 7 Integrated hydraulic model 35

CW1096100 | 11 February 2021 | Commercial in Confidence iii
Geraldton CBD and Port Flood and Inundation Study
 Project Modelling Report

 7.1 Model setup 35
 7.2 Stormwater network 36
 7.3 Boundary conditions 36
 7.4 Initial conditions 36
 8 Hydraulic model results 38
 8.1 Background 38
 8.2 Rainfall only 38
 8.3 Storm tide & Rainfall 39
 8.4 Tsunami 41
 8.5 Flood level in the Port 42
 9 Conclusion 46
 10 References 47

Appendices

Appendix A IFD Data
Appendix B Flood maps

Tables
Table 3-1 Water levels at Geraldton Port (DoT, 2019). 8
Table 3-2 Sea level rise allowances after the City’s Coastal Hazard Risk Management and Adaptation
 Plan – CHRMAP (Baird, 2019), which is consistent with SPP2.6 sea level rise scenario. 9
Table 4-1 Effective Impervious Fractions for Land Use Categories 12
Table 4-2 Rational Method Comparison with RORB Model Flows – 1% AEP 14
Table 4-3 RORB Model Results – 5% AEP 14
Table 4-4 RORB Model Results – 1% AEP. 15
Table 4-5 RORB Model Results – 0.2% AEP. 15
Table 5-1 Design scenarios. 16
Table 5-2 Design scenarios adopted. 17
Table 5-3 Extreme water level (mAHD, excluding wave set-up) at Geraldton provided by the City’s
 CHRMAP for Geraldton Port - North area (GP-N), Point Moore - North area (PM-N), Point
 Moore - South area (PM-S) and South of Point Moore area (SoPM), as illustrated in Figure 5-4.
 21
Table 5-4 Present day extreme water level (mAHD, excluding wave set-up) at Geraldton obtained from
 UWA extreme water level study. 21
Table 5-5 Present day extreme water level (mAHD, excluding wave set-up) at Geraldton obtained from
 MPWA (2011) and Cardno (2012). 22
Table 5-6 Present day extreme water level (mAHD, excluding wave set-up) at Geraldton obtained from the
 EVA of the port data. 23
Table 5-7 Extreme water level (mAHD, excluding wave set-up) at Geraldton obtained from the simulation
 of DoT’s 500yr ARI tropical cyclone design storm event. 23
Table 5-8 Summary of extreme water level (mAHD) for the 500yr ARI “offshore” design water level for
 present day conditions. 24

CW1096100 | 11 February 2021 | Commercial in Confidence iv
Geraldton CBD and Port Flood and Inundation Study
 Project Modelling Report

Table 5-9 Offshore extreme wave conditions at Beacon 1 (outer channel entrance) obtained from the EVA
 of the Port data. 25
Table 5-10 Maximum mean overtopping discharge (l/s per m) for each transect and scenario. 27
Table 5-11 Maximum maximum overtopping discharge (l per m) for each transect and scenario. 28
Table 5-12 Acceptable limits of overtopping (Eurotop, 2018) 29
Table 5-13 Nearshore tsunami design water level (mAHD). 31
Table 6-1 Critical storms simulated in the hydraulic model. 33
Table 7-1 Modelling Scenarios 35
Table 7-2 TUFLOW model boundary conditions. 36
Table 8-1 Rain flood level in the Port area. 43
Table 8-2 Storm tide & rainfall flood level (mAHD) in the Port area. 44
Table 8-3 Tsunami flood level (mAHD) in the Port area. 45

Figures
Figure 1-1 Locality plan. 3
Figure 2-1 Tsunami source zones (left, GA 2018) and example of tsunami wave generation (right, Burbidge
 et al. 2009). 5
Figure 2-2 IPCC projected sea level rise SLR until 2300 (Oppenheimer et al. 2019). 5
Figure 3-1 DEM of the study area derived from LiDAR data. 6
Figure 3-2 Example of bathymetric data from the Australian Hydrographic Service (left) and the
 Department of Transport (right). 7
Figure 3-3 Land use categories (provided by the City of Greater Geraldton Jan. 2019). 7
Figure 3-4 Recommended allowance for sea level rise in coastal planning for WA (DoT, 2010). 9
Figure 4-1 Sub-catchment plan. 10
Figure 4-2 RORB model setup. 11
Figure 4-3 Sub-catchment impervious fractions. 12
Figure 5-1 Illustration of key coastal processes terms and associated water level. 16
Figure 5-2 Stage 1 – Coastal Model four nested grids. 18
Figure 5-3 Stage 1 – Coastal Model high-resolution bathymetry. 19
Figure 5-4 Stage 2 - Nearshore Model transects locations (dashed line), applicable shoreline section
 (coloured lines) and City’s CHRMAP areas (solid navy lines). 20
Figure 5-5 Present day extreme still water level (mAHD): 100-year return period (left), design curve (right)
 [http://sealevelx.ems.uwa.edu.au/index.php accessed 6/09/2019]. 21
Figure 5-6 Design water level from MPWA (2011) and Cardno (2012), including extrapolation to 1 in 500yr
 ARI. 22
Figure 5-7 Tide gage record at Geraldton Port obtained from the Port of Geraldton. 22
Figure 5-8 Snapshots of tropical cyclone wind field (left) and associated wave conditions (right). 23
Figure 5-9 Examples of extreme wave conditions for south-westerly conditions (left) and north-westerly
 conditions (right). 25
Figure 5-10 Examples cross-sectional wave conditions and statistics for 2 different water level inputs. 26
Figure 5-11 Example of parametric reconstruction of storm tide events. 27

CW1096100 | 11 February 2021 | Commercial in Confidence v
Geraldton CBD and Port Flood and Inundation Study
 Project Modelling Report

Figure 5-12 Tsunami hazard curves off the coast of Geraldton for different models after Burbidge et al.
 (2009) (left) and PTHA18 tsunami stage provided by GA for this project (right-top), including
 Delft3d tsunami stage input modulated by a typical tide (MHHW) and sea level rise allowance
 (right-bottom). 30
Figure 5-13 Example of Delft3D tsunami water level snapshot (left) and timeseries result at a nearshore
 location (right). 31
Figure 6-1 Manning’s ‘n’ roughness values used in TUFLOW. 32
Figure 6-2 Sub-catchments G and H – 5% AEP (2hr TP20). 34
Figure 6-3 Sub-catchments G and H – 1% AEP (1.5hr TP28). 34
Figure 6-4 Sub-catchments G and H – 0.2% AEP (1hr TP29). 34
Figure 7-1 TUFLOW quadtree mesh transition. 35
Figure 7-2 Rainfall boundary conditions. 37
Figure 7-3 Tsunami boundary conditions. 37
Figure 8-1 Peak rainfall extent 100year ARI (2070) event. High resolution maps provided in Appendix B. 38
Figure 8-2 Peak storm tide & rainfall extent 20year ARI (2110) event. High resolution maps provided in
 Appendix B. 39
Figure 8-3 Peak storm tide & rainfall extent 100year ARI (2110) event. High resolution maps provided in
 Appendix B. 40
Figure 8-4 Peak storm tide & rainfall extent 500year ARI (2110) event. High resolution maps provided in
 Appendix B. 40
Figure 8-5 Peak Tsunami Extent 500year ARI (2110) event. High resolution maps provided in Appendix B.
 41
Figure 8-6 Terrestrial elevation below 1.6mAHD. 41
Figure 8-7 Point location where flood levels were extracted. 42

CW1096100 | 11 February 2021 | Commercial in Confidence vi
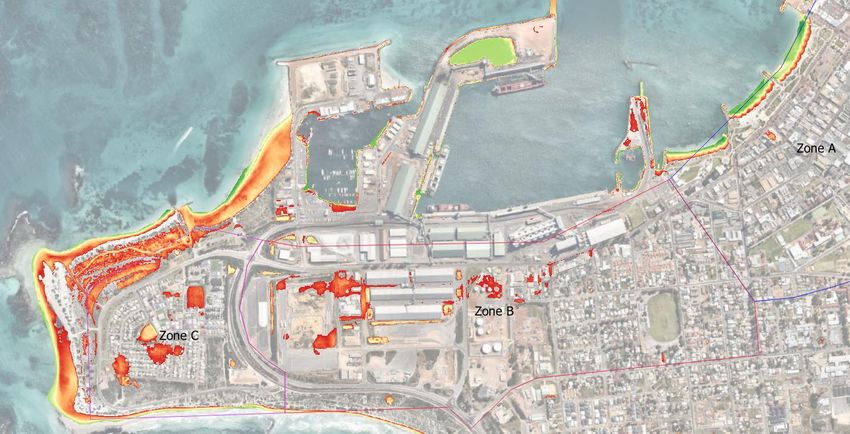
Geraldton CBD and Port Flood and Inundation Study
 Project Modelling Report

Executive Summary

Summary
This Project Modelling Report outlines the technical foundation of the assessment of the flood and inundation
hazards in the City of Greater Geraldton coastal zone, including the Port of Geraldton and the suburbs of
West End, Geraldton and Beresford.
The flood and inundation hazards assessment considered a range of processes including rain, storm tide
(including wave set-up and overtopping) and tsunami. Three design events (i.e. 20yr ARI or 5%AEP, 100yr
ARI or 1%AEP and 500yr ARI or 0.2%AEP) and three timeframes (i.e. 2030, 2070 and 2110) with adequate
allowance for mean sea level rise.
A comprehensive high-resolution hydraulic model was developed that integrates detailed coastal boundary
conditions and hydrological conditions modelled specifically for each scenario. The Port and the City
provided local survey information used to inform the digital elevation model and develop the drainage
infrastructure. The design rainfalls were obtained from the Bureau of Meteorology (BoM) and temporal
pattern from the regional Australian Rainfall and Runoff (ARR) Data Hub. The design storm tide levels were
based on the City’s Coastal Hazard Risk Management and Adaptation Plan (CHRMAP).
Modelling results indicate that:
> The tsunami cases modelled present minimal risk to the Geraldton area. This is demonstrated in Figure
 8-5 and Appendix B with minimal flooding shown. Some areas of inundation on terrestrial locations are a
 result of the initial tailwater level being higher than the existing ground level. This may indicate that there
 is backflow through the stormwater network to some of these locations.
> During the rain events, isolated locations within the study area are inundated by flood waters up to 2m
 deep. These are generally confined to drainage features and inlet locations. Some locations shown are
 where basement carpark entrances have been captured in the terrain survey or where terrain filling has
 introduced localised ponding. Typically, depths on land during the 500yr ARI rain event are less than
 0.5m with flow paths typically confined to road reserves and existing drainage reserves/park areas.
 Furthermore, of those residential properties that are impacted by flooding, depths are generally less than
 300mm.
> The most significant coastal inundation hazards are attributed to storm tide & rainfall events and wave
 overtopping.
 - Residential areas in Zone C become inundated during the 20yr ARI event, with depths increasing to
 approximately 2m in the 500yr ARI. Foreshore street in Zones A and B are inundated by flood depths
 of up to 1.8 m during the 500yr ARI event. During this event, a significant number of residential and
 commercial properties are inundated.
 - In the Port area, the two reclaimed land areas are expected to experience significant overtopping
 under all scenarios to 2110, with the fishing boat harbor northern reclaim being submerged under the
 100yr ARI event.
 - Wave overtopping rates at the extraction locations during storm tide exceed limits of tolerable
 discharges provided in overtopping guidelines for pedestrian, and vehicles safety and damage to
 building and defence structures (Table 5-12).
This Project Modelling Report provides the basis for subsequent mapping and planning considerations. It is
accompanied by:
> Inundation and flood maps (water level and water depth) for each scenario;
> Inundation and flood animations for each scenario;
> Data package containing all GIS layers created and model output files;
> Stormwater Infrastructure Plan for the City, which rationalises the existing drainage network and
 considers future drainage upgrades; and
> Emergency Response Plan for the City, which further characterises high flood hazard areas and outlines
 appropriate response.
Recommendations

CW1096100 | 11 February 2021 | Commercial in Confidence 1
Geraldton CBD and Port Flood and Inundation Study
 Project Modelling Report

Development level and coastal protection
Typically, buildings and structures should, as a minimum, be designed with a constructed floor level that
provides adequate inundation immunity for the life of the project. Depending on the governing policy, finished
floor level should be above the 1 in 100yr inundation level plus a freeboard allowance of 0.5 m (SPP2.9),
alternatively development level should be above the 1 in 500yr coastal inundation level (SPP2.6).
Finished floor level are provided in the accompanying Emergency Response Plan.
A risk-based approach is recommended to be followed that considers the changing inundation hazard events
frequency overtime (as sea levels rise) and the cumulative probability of such events to be exceeded during
the life of the project.
Where coastal protections are likely to get inundated and overtopped by waves, there is a need to:
> Consider the adequacy of existing rock works, adjacent pavement and neighbouring property
 development level going forward; and
> Ensure adequate mitigation measures that meet standard personal safety and infrastructure integrity
 requirements are in place to address storm tide inundation and wave overtopping risk.
Design water level review
Considering the recent extreme water level review findings and the significance of the storm tide level in the
coastal inundation extent, it would be beneficial to ascertain the extreme water level in the study area
independently from previous studies. A more detailed assessment of the design water levels that would
consider synthetic cyclone climatology and synoptic storm tide modelling is recommended to establish these
extreme water levels. This could be part of the next CHRMAP periodic review - a process whereby the most
recent and reliable information (including the design water level) can be examined and the CHRMAP
updated as required.

CW1096100 | 11 February 2021 | Commercial in Confidence 2
Geraldton CBD and Port Flood and Inundation Study
 Project Modelling Report

1 Introduction

Cardno was commissioned through a collaboration between the City of Greater Geraldton and the Midwest
Port Authority – Port of Geraldton have, to undertake an inundation study for the Geraldton CBD and Port
area shown in Figure 1-1. Coastal, hydrologic and hydraulic processes modelling was undertaken to
determine inundation depths and durations across the study area. This involved integrated modelling of
rainfall across the catchment and coastal boundary conditions associated with cyclonic and non-cyclonic
storm tide and tsunami events for 3 design events covering a range of Average Recurrence Interval (ARI) or
Annual exceedance probability (AEP), including 20yr ARI (5% AEP), 100yr ARI (1% AEP) and 500yr ARI
(0.2% AEP). The effect of sea level rise (SLR) was also assessed for 3 timeframes including 2030, 2070 and
2110. The outputs of this modelling form the basis of a range of inundation maps and informs the City’s
Emergency Response Plan and Stormwater Infrastructure Plan accompanying this Project Modelling Report.

 Champion Bay

 Port

 Point Moore

Figure 1-1 Locality plan.

CW1096100 | 11 February 2021 | Commercial in Confidence 3
Geraldton CBD and Port Flood and Inundation Study
 Project Modelling Report

2 Study area

2.1 Geographic location
Geraldton is a coastal city located in the Mid West region of Western Australia, approximately 400 km north
of Perth CBD. The City can be divided into four locations: Zone A (Central Business District or CBD), Zone B
(Beachlands), Zone C (West End) and the Port area, as shown in Figure 1-1. The topography can be
characterised as flat and low-lying and therefore susceptible to coastal inundation. The coastal regions are
lined with dunes, offering a barrier against storm tide and coastal inundation, however these dunes are
susceptible to erosion and overtopping during large events.
The City is separated from external hydrological catchments by a 3 km long ridge in a north-south orientation
as can be seen in Figure 3-1. In addition, there are no watercourses that drain through the Study Area, with
the closest river being the Chapman River, located approximately 4 km north of the Study Area. The surface
geology of the City can be characterised as sandy, with aeolian, beach and coastal sediments.

2.2 Climate and rainfall
Geraldton’s climate can be characterised as Mediterranean with a semi-arid influence. The region has hot
dry summers and warm winters. Annual precipitation is approximately 442 mm, with the majority occurring in
winter months. The main sources of rainfall are winter fronts, troughs and cut-off lows from the South-West.

2.3 Coastal processes
2.3.1 Water level
Geraldton’s tidal regime is microtidal and mainly diurnal with an astronomical tidal range of about 1.2m. The
water level can be affected by other processes such as weather systems (storm tide), local wave conditions
on the beach (wave set-up), remote earthquakes (tsunami) and global warning (global mean sea level rise).

2.3.2 Wind
Geraldton experiences seasonal extremes in weather, from hot summer days characterised by north-easterly
winds from the interior of the state, to cold, wet, windy winter days as cold fronts from the Southern Ocean
move through the region. On rare occasions tropical cyclones can move rapidly southwards and travel along
the Western Australia (WA) coast while dissipating. AS/NZS1170.2:2011 (Standards Australia ,2011) places
Geraldton in the non-cyclonic Wind Region B.

2.3.3 Wave
Offshore coastal waters west of Champion Bay and Point Moore experience high wave energy (MWPA,
2014). The four main elements of the offshore wave climate in Geraldton are:
> Locally generated seas resulting from sea breeze conditions (waves 0.5–1.5m high from the south to
 south-west);
> Seas generated locally by the passage of cold fronts during winter (waves 1-3m high from the west to
 south-west);
> Swell waves generated by storms in the southern Indian Ocean (waves 1-3m high from the south-west);
 and
> Severe waves caused by dissipating tropical cyclones.

2.3.4 Tsunami
Western Australia is susceptible to tsunamis from seismic sources that originate from distant sources
including the Sunda Arc (sunda2 in Figure 2-1). The Indian Ocean tsunami (“Boxing Day 2004” tsunami)
revealed the destructive effects of tsunamis across the Indian Ocean with a maximum run-up exceeding 30m
in Banda Aceh (Indonesia). In Western Australia the impact was greatly reduced as the tsunami wave height
tend to decrease with the distance travelled (Pattiaratchi, 2020). The Geraldton tide gage recoded a
maximum water level of 1.8mAHD during that event (DoT, 2019). A tsunami in Western Australia is more
likely to cause dangerous rips and currents and travel up river systems and estuaries rather than flood low
lying land (DFES, 2020).

CW1096100 | 11 February 2021 | Commercial in Confidence 4
Geraldton CBD and Port Flood and Inundation Study
 Project Modelling Report

Figure 2-1 Tsunami source zones (left, GA 2018) and example of tsunami wave generation (right, Burbidge et al. 2009).

2.3.5 Global mean sea level rise
According to the latest Intergovernmental Panel on Climate Change (IPCC) assessment report, global mean
sea level is rising and accelerating. The sum of glacier and ice sheet contributions is now the dominant
source of global mean sea level rise. Future rise in global mean sea level caused by thermal expansion,
melting of glaciers and ice sheets, and land water storage changes, is strongly dependent on which
Representative Concentration Pathway (RCP) emission scenario is followed. Sea level rise at the end of the
century is projected to be faster under all scenarios, including those compatible with achieving the long-term
temperature goal set out in the Paris Agreement. Global mean sea level will rise between 0.43m and 0.84m
by 2100 relative to 1986–2005 (Oppenheimer et al. 2019). These updated results are consistent with earlier
reviews of mean sea level variations along the Western Australian (WA) coastline, and current
recommendations on appropriate allowances for mean sea level change to be used in coastal planning
(DoT, 2010).

Figure 2-2 IPCC projected sea level rise SLR until 2300 (Oppenheimer et al. 2019).

CW1096100 | 11 February 2021 | Commercial in Confidence 5
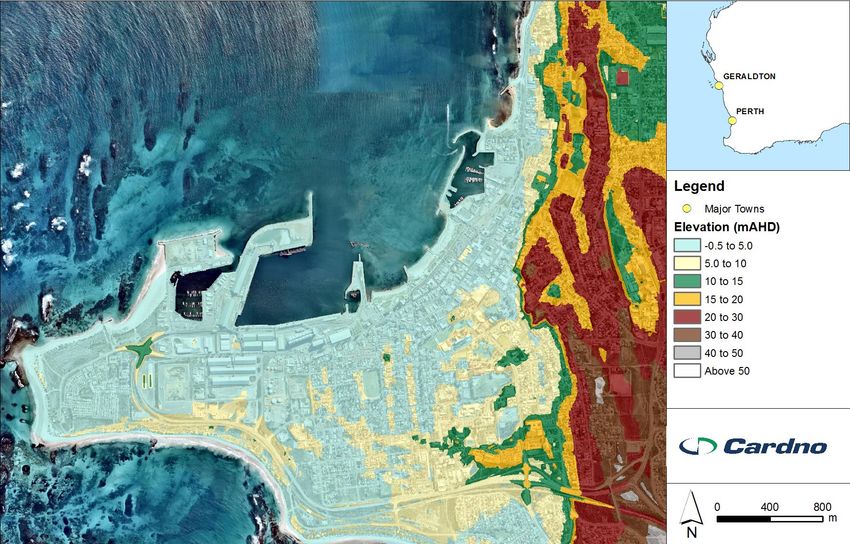
Geraldton CBD and Port Flood and Inundation Study
 Project Modelling Report

3 Data review

3.1 Elevation data
3.1.1 Topography
Elevation data was provided by the City in the form of Light Detection and Ranging (LiDAR) point cloud data.
This was used to generate a digital elevation model (DEM) of the Study Area, shown in Figure 3-1. Buildings
were filtered from the datasets and elevations at the footprint were interpolated using elevations at the
boundaries. This dataset covers the Study Area in its entirety.

Figure 3-1 DEM of the study area derived from LiDAR data.

CW1096100 | 11 February 2021 | Commercial in Confidence 6
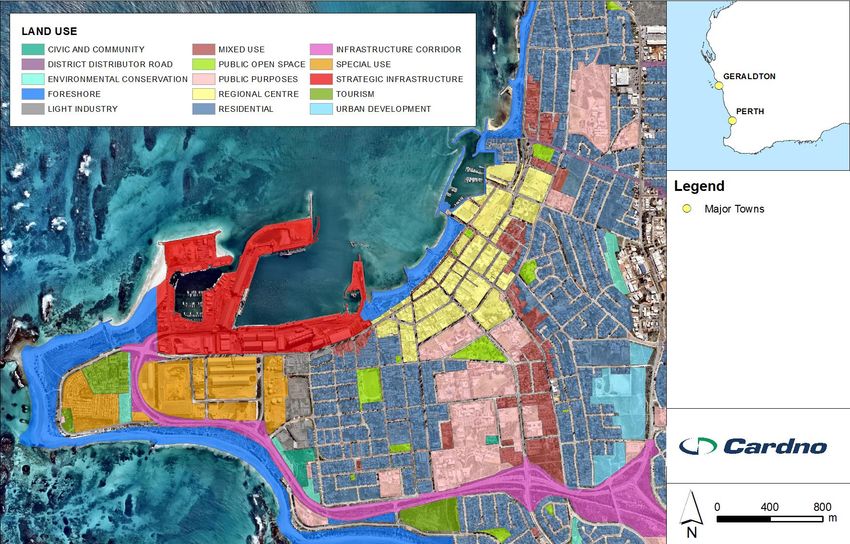
Geraldton CBD and Port Flood and Inundation Study
 Project Modelling Report

3.1.2 Bathymetry
Bathymetry data was based on a combination of national bathymetric data for the deep water from Geoscience
Australia, navigation charts for coastal regions from the Australian Hydrographic Service, and nearshore
bathymetric LiDAR data from the Department of Transport, as shown in Figure 3-2.

Figure 3-2 Example of bathymetric data from the Australian Hydrographic Service (left) and the Department of Transport (right).

3.2 Land use
Land use data was provided by the City as a Shapefile. The distribution of land use categories across the
Study Area is shown in Figure 3-3. These categories were used to determine effective impervious areas and
hydraulic roughness values.

Figure 3-3 Land use categories (provided by the City of Greater Geraldton Jan. 2019).

CW1096100 | 11 February 2021 | Commercial in Confidence 7
Geraldton CBD and Port Flood and Inundation Study
 Project Modelling Report

3.3 Drainage data
Drainage data was provided by the City and the Port in the form of GIS files. However, a vast quantity of the
provided data contained information gaps, such missing pipe diameters and invert levels. Cardno undertook
tasks to ensure the dataset was appropriate for hydraulic modelling. These tasks and assumptions are
detailed below:
 • Pipe sizes smaller than 300mm diameter were filtered out of the dataset;
 • Missing pipe diameters were infilled using diameters of neighbouring pipe sizes;
 • A size of 300mm was adopted at locations where there was no neighbouring diameter data;
 • Where a pipe was seen to be missing from the network, additional pipes were added;
 • Pipes which were disconnected from the network and were seen not to drain anywhere based on
 aerial imagery were removed from the dataset;
 • Pipes were checked for connectivity;
 • Pipes were checked to be flowing in the correct direction and if not, forced to do so;
 • Pits were automatically placed at pipe junctions;
 • Pipe invert levels were calculated using the DEM, pipe diameter and an assumed cover of 600mm.
It was noted that there are several infiltration basins (or sumps) across the Study Area which parts of the
network drain to. These have been assumed to have a design infiltration rate of 5m/day in accordance with
common design practice across WA for similar soils as those found in the Study Area.

3.4 Ocean water levels
Background information on ocean water levels is provided below.

3.4.1 Tidal planes
The tidal planes at Geraldton, taken from DoT’s submergence curve (DoT, 2019), are shown in Table 3-1.

 Table 3-1 Water levels at Geraldton Port (DoT, 2019).

 Water levels Level (mCD) Level (mAHD)
 Highest recorded (26/12/2004)* 2.36 1.81
 HAT - Highest Astronomical Tide 1.26 0.71
 MHHW – Mean High High Water 1.01 0.46
 MHLW – Mean High Low Water 0.86 0.31
 MSL – Mean Sea Level 0.64 0.09
 AHD – Australian Height Datum 0.55 0
 MLHW – Mean Low High Water 0.41 -0.14
 MLLW – Mean Low Low Water 0.27 -0.28
 LAT – Lowest Astronomical Tide 0.07 -0.48
 Lowest recorded (27/12/2004)* -0.48 -1.03

(*) related to 2004 Boxing Day Tsunami.

3.4.2 Sea level rise allowance
Sea level rise allowances as result of climate change have been estimated in accordance with the WA
Planning Commission State Planning Policy No. 2.6: State Coastal Planning Policy (SPP2.6) and are
provided in Figure 3-4 and summarised in Table 3-2.

CW1096100 | 11 February 2021 | Commercial in Confidence 8
Geraldton CBD and Port Flood and Inundation Study
 Project Modelling Report

Figure 3-4 Recommended allowance for sea level rise in coastal planning for WA (DoT, 2010).

 Table 3-2 Sea level rise allowances after the City’s Coastal Hazard Risk Management and Adaptation Plan – CHRMAP
 (Baird, 2019), which is consistent with SPP2.6 sea level rise scenario.

 Timeframe 2030 2070 2110
 Sea level rise allowance (m) +0.07 +0.39 +0.90

3.4.3 Extreme water levels
Further information and analysis of extreme and adopted design water levels are presented in Section 5 -
Coastal and nearshore processes modelling.

CW1096100 | 11 February 2021 | Commercial in Confidence 9
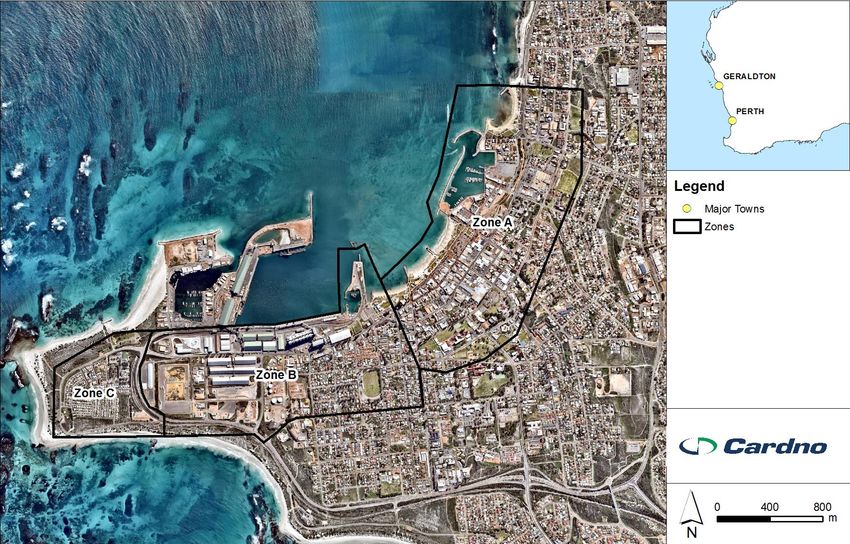
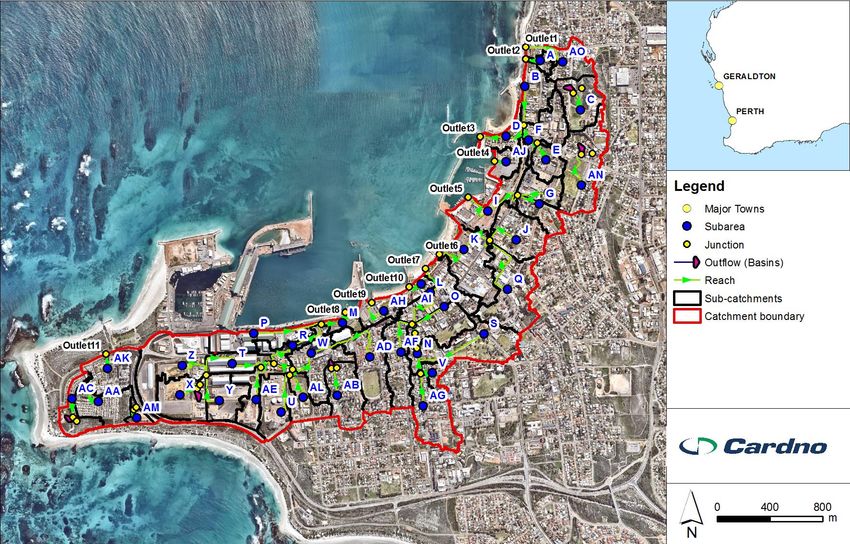
Geraldton CBD and Port Flood and Inundation Study
 Project Modelling Report

4 Hydrology

A hydrology model of the CBD was constructed using the runoff-routing software RORB (Laurenson et al.,
2010). This model gives an indication of the critical storm durations across the CBD. A Monte-Carlo analysis
was undertaken to determine the critical flows and durations at sub-catchments across the Study Area. The
Monte Carlo process involves stochastically sampling from a distribution of design rainfall depths for a range
of AEPs and a random selection of temporal patterns, resulting in thousands of model runs. The durations
which presented the median peak flows at chosen sub-catchments were adopted as the critical durations for
each AEP being analysed. The ensemble of ten design temporal patterns for the critical durations were then
run to determine the temporal pattern that corresponded with the peak flow from the Monte Carlo analysis.

4.1 Catchment delineation
The DEM derived from the LiDAR elevation data was used to define the main drainage channels throughout
the catchment, which mainly constituted of overland flow through kerbed roads. Sub-catchments were then
delineated using the topography. The sub-catchment plan for the CBD is shown in Figure 4-1.

Figure 4-1 Sub-catchment plan.

4.2 Model setup
The ArcRORB (v1.7) extension for ArcGIS was used to setup the RORB model as follows:
 • Reaches were assigned as Type 3: lined channel or pipe;
 • Slopes were derived from the elevation data;
 • Junction nodes were placed at channel confluences and locations where a hydrograph output was
 required;
 • Multiple ocean outfalls, which were converged to a single outlet using dummy reaches. These have
 no influence on hydrologic calculations.

CW1096100 | 11 February 2021 | Commercial in Confidence 10
Geraldton CBD and Port Flood and Inundation Study
 Project Modelling Report

 • Infiltration basins were modelled as outflows from the model at a constant rate of 5m/day1. No
 groundwater interaction has been modelled.
The model setup is shown in Figure 4-2.

Figure 4-2 RORB model setup.

4.3 Model parameters
RORB uses an empirical coefficient ‘k c’ applicable to the catchment and drainage network and is the
principal storage and routing parameter of the model. In addition, a non-linearity factor ‘m’ is used in the
RORB storage equations. In the absence of flow gauge data in the CBD, a regional estimate of the design kc
value was adopted from Australian Rainfall and Runoff 2019 based on Equation 1 for the Wheatbelt, North-
West and Kimberley Region. The variable ‘L’ represents the length (km) of the main stream length and Se
represents the equal area slope of the main stream. In this case, the main stream was taken as the longest
kerbed flow path through the Study Area.

 = 1.06 0.87 −0.46 Equation 1

This resulted in a kc value of 1.29 and the recommended default value of 0.8 for ‘m’ was adopted to
represent the non-linearity in catchment storage.

1
 The 1:250,000 Geraldton – Houtman Abrolhos geological map sheet describes the ground conditions at Point Moore and surrounds as
'Dune and beach sands - white calcerous and quartzose sands.' Considering this classification and experience in similar ground
conditions it was assumed that the soils in the study area basins are well drained sands, and a hydraulic conductivity of 5m/day was
assumed. Often materials such as these could have hydraulic conductivities in excess of 10m/day, however 5m/day represents a
conservative assumption in the absence of at-site data, and potential clogging at the top of layer of basins. It is noted that an infiltration
rate of 5m/day may not be appropriate for some climate change scenarios where the base of the basins will be permanently inundated
due to sea level rise. Sensitivity testing was conducted on some basins to assess their ability to manage inflows in a high groundwater
scenario and it was determined they still function in those conditions to manage water volume.

CW1096100 | 11 February 2021 | Commercial in Confidence 11
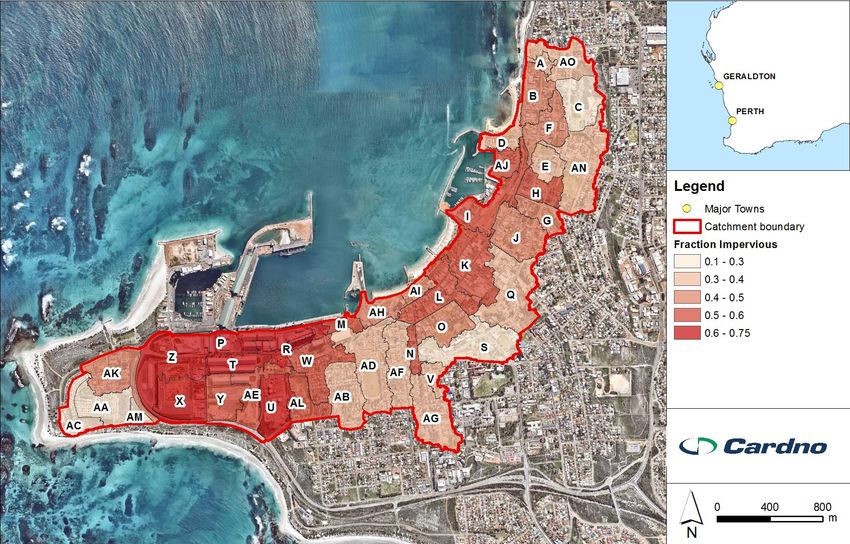
Geraldton CBD and Port Flood and Inundation Study
 Project Modelling Report

4.4 Impervious fractions
The supplied land use data was simplified into twelve different land use categories as shown in Table 4-1
and used to determine the impervious fraction for each sub-catchment. The approximate fraction impervious
was estimated using aerial photography and GIS. Effective impervious areas for each land use category was
then calculated using the methods outlined in Book 5 of ARR 2019, and are presented in Table 4-1. The
effective impervious fraction for each sub-catchment is shown in Figure 4-3.
 Table 4-1 Effective Impervious Fractions for Land Use Categories

 Land use Fraction impervious (%) Effective Impervious Fraction (%)
 POS 5 2
 Low veg 0 0
 High Veg 0 0
 Commercial (RAC-3) 80 60
 Industrial 95 74
 Foreshore 90 69
 Public purposes 60 42
 Residential - Low density 50 33
 Residential - Medium density (R60) 70 51
 Residential - High density 80 60
 Roads (including reserve) 90 69

Figure 4-3 Sub-catchment impervious fractions.

CW1096100 | 11 February 2021 | Commercial in Confidence 12
Geraldton CBD and Port Flood and Inundation Study
 Project Modelling Report

4.5 Rainfall losses
An initial loss (IL) and continuing loss (CL) model was used to determine rainfall losses for the catchment.
Loss data was obtained from the ARR Data Hub and values of 45 mm IL and 3 mm/hour CL were applied in
the RORB model. The fraction impervious for each sub-catchment was calculated through ArcRORB using
the effective impervious fractions in Table 4-1 for the different land use categories. The initial and continuing
losses for each sub-catchment was then calculated by RORB using the following equations:

 = (1 − ) Equation 2

 = (1 − ) Equation 3

Where:
 : Initial loss of sub-catchment
 : Continuing loss of sub-catchment
 : Effective impervious fraction for sub-catchment
 : Pervious initial loss for the catchment
 : Pervious continuing loss for the catchment

4.6 Design rainfall depths
Design rainfall depths were obtained from Intensity Frequency Duration (IFD) curves available from the
Bureau of Meteorology (BoM) for 28.78o S, 114.61o E. This IFD data is shown in Appendix A.

4.7 Storm temporal pattern
Point temporal patterns were obtained from the ARR Data Hub for the Southern and South Western
Flatlands (West) region.

4.8 Model verification
In the absence of gauged flow data for the CBD area, the Rational Method was chosen to check the validity
of the RORB model setup. The Rational Method was used to estimate peak flows for specific sub-
catchments in the model, which were compared to the modelled peak flow in RORB. The sub-catchments
chosen were B, O and U to represent spatial variation of flows throughout the Study Area catchment as they
are located in Zones A, B and C respectively. The time of concentration was determined using Izzard’s kerb
flow travel time equation:

 = 0.025 Equation 4
 0.5

Where:
 : time of gutter flow (min)
 : length of gutter flow (m)
 : slope of gutter (%)

CW1096100 | 11 February 2021 | Commercial in Confidence 13
Geraldton CBD and Port Flood and Inundation Study
 Project Modelling Report

The results of this verification for the 1% AEP event are shown in Table 4-2. It can be seen that the
differences in peak flow between the Rational Method and RORB model are within approximately 5%2,
indicating that flows generated by the RORB model are within an acceptable level of accuracy.

 Table 4-2 Rational Method Comparison with RORB Model Flows – 1% AEP

 Sub-catchment Q (m3/s) – Rational Q (m3/s) – RORB Critical Duration Difference
 Method – RORB (hrs)
 B 2.20 2.10 0.5 4.97 %
 U 2.78 2.72 0.5 2.43 %
 O 2.18 2.06 0.5 5.89 %

4.9 Model results
A number of durations and temporal patterns were modelled. The modelled RORB peak flow results, critical
durations and ARR temporal patterns at critical locations in the Study Area for the 5%, 1% and 0.2% AEP
design events are presented in Table 4-3, Table 4-4 and Table 4-5 respectively. These locations include the
major ocean outlets and several sub-catchments spread across the Study Area.

 Table 4-3 RORB Model Results – 5% AEP
 Location Peak Flow (m3/s) Critical Duration (hours) Temporal Pattern
 AF 1.25 2 TP20
 AG 1.37 2 TP13
 B 1.47 0.5 TP16
 J 1.88 0.5 TP16
 O 1.42 0.5 TP16
 U 2.00 0.5 TP15
 Outlet 3 3.95 2 TP20
 Outlet 5 2.54 2 TP20
 Outlet 6 3.10 2 TP18
 Outlet 7 3.85 2 TP13
 Outlet 8 6.09 2 TP16

2
 Within 10% is accepted industry practice.

CW1096100 | 11 February 2021 | Commercial in Confidence 14
Geraldton CBD and Port Flood and Inundation Study
 Project Modelling Report

 Table 4-4 RORB Model Results – 1% AEP.

 Location Peak Flow (m3/s) Critical Duration (hours) Temporal Pattern
 AF 2.01 1.5 TP28
 AG 2.30 1.5 TP29
 B 2.10 0.5 TP25
 J 2.75 1.5 TP28
 O 2.06 0.5 TP29
 U 2.72 0.5 TP25
 Outlet 3 5.98 1.5 TP22
 Outlet 5 3.95 1.5 TP29
 Outlet 6 5.10 1.5 TP22
 Outlet 7 7.24 2 TP28
 Outlet 8 10.21 2 TP21

 Table 4-5 RORB Model Results – 0.2% AEP.

 Location Peak Flow (m3/s) Critical Duration (hours) Temporal Pattern
 AF 2.94 2 TP24
 AG 3.40 1.5 TP28
 B 3.08 1 TP29
 J 4.19 1 TP29
 O 3.17 1 TP29
 U 4.16 1 TP29
 Outlet 3 9.17 1 TP29
 Outlet 5 5.57 1 TP30
 Outlet 6 7.41 1.5 TP28
 Outlet 7 10.72 1.5 TP28
 Outlet 8 14.44 2 TP22

CW1096100 | 11 February 2021 | Commercial in Confidence 15
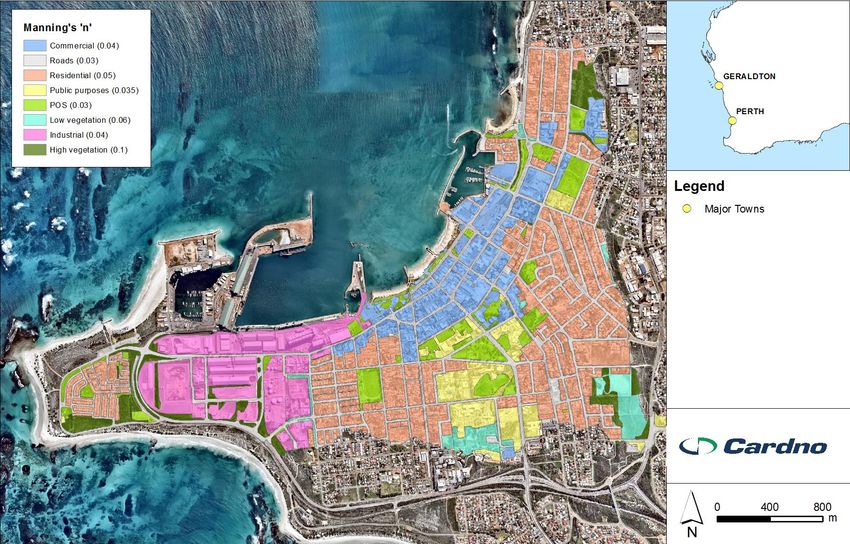
Geraldton CBD and Port Flood and Inundation Study Project Modelling Report 5 Coastal and nearshore processes modelling 5.1 Background 5.1.1 Key coastal processes The flood and inundation model required coastal boundary conditions to represent the effects of elevated water level and wave overtopping flow during the specified design events. Key coastal processes terms and associated water levels are schematically illustrated in Figure 5-1. Wave overtopping Figure 5-1 Illustration of key coastal processes terms and associated water level. 5.1.2 Design scenarios considered The design scenarios considered in the flood and inundation model included storm tide conditions (due to cyclonic and non-cyclonic events), tsunami conditions and the effects of sea level rise for 3 timeframes and 3 return periods, as illustrate in Table 5-1. Table 5-1 Design scenarios. Storm Tide Tsunami Source Synoptic storms Tropical cyclones Remote earthquakes Timeframe 2030 2070 2110 2030 2070 2110 2030 2070 2110 20yr ARI (5% AEP) 100yr ARI (1% AEP) 500yr ARI (0.2% AEP) CW1096100 | 11 February 2021 | Commercial in Confidence 16
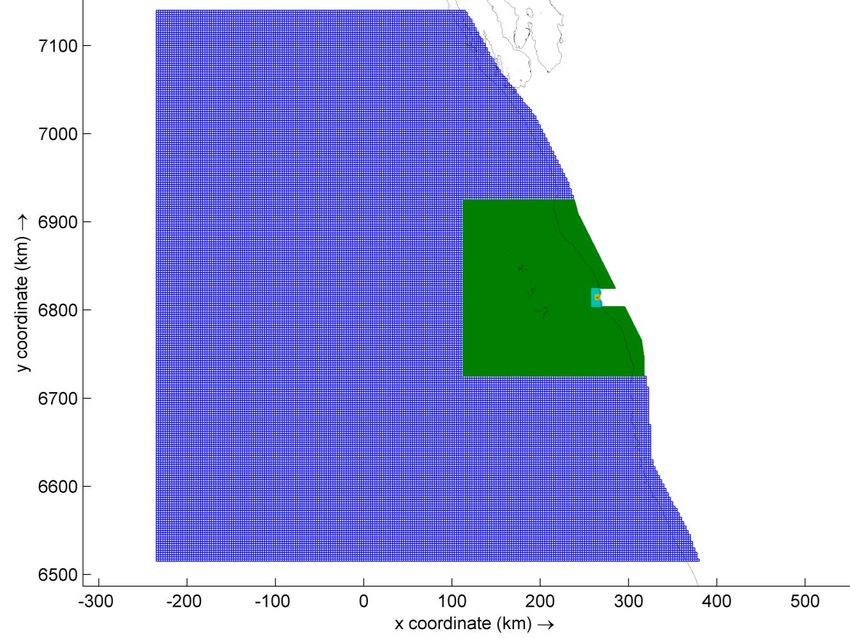
Geraldton CBD and Port Flood and Inundation Study Project Modelling Report 5.1.3 Design scenarios adopted The design storm events include consideration for storm tides generated under both cyclonic and non- cyclonic conditions, as well as the effects of sea level rise, for a range of return periods. These storm tide conditions were simplified in accordance with the City’s Coastal Hazard Risk Management and Adaptation Plan (CHRMAP) findings (Baird, 2019), by taking the maximum water level from cyclonic conditions and non- cyclonic conditions. This resulted in the adoption of 9 storm tide scenarios and 9 tsunami scenarios, as shown in Table 5-2. Table 5-2 Design scenarios adopted. Strom Tide Tsunami Timeframe 2030 2070 2110 2030 2070 2110 20yr ARI 100yr ARI 500yr ARI 5.2 Coastal and nearshore modelling framework The coastal modelling framework comprised two stages. Each stage involves the use of different numerical models capable of representing coastal and nearshore processes at an appropriate scale, ranging from the continental shelf to the beach. On overview of these two stages is provided below: > Stage 1 – Coastal Model - A 2D horizonal coupled hydrodynamic and wave model of the area was developed, including four nested grids ranging from coarse 2,500m offshore grid to fine 20m grid on the coast, to estimate water level and wave conditions in coastal waters under the action of selected offshore metocean conditions, including: - Tsunami conditions defined by the 2018 Australian Probabilistic Tsunami Hazard Assessment Database developed by Geoscience Australia; - Storm tide conditions defined by the extreme design water level established in the City’s CHRMAP completed in 2019 and extreme design wave conditions established from the statistical analysis of the Port of Geraldton Wave Rider Buoy data; and - Tropical cyclone storm tide inundation defined by the Department of Transport design storm conditions in the Seashore, 2018 Report - Design Storms for Western Australian Coastal Planning: Tropical Cyclones. > Stage 2 - Nearshore Model - A complementary 2D vertical nearshore wave model was developed, including 17 high resolution transects along the coast, to address wave overtopping and inundation processes along the sandy shoreline and coastal protection structures under the action of coastal metocean conditions established in Stage 1 above. These two stages are further outlined in the following sections. 5.2.1 Stage 1 – Coastal Model The coupled hydrodynamic and wave modelling framework included: > Delft3D-Flow - a multi-dimensional (2D or 3D) hydrodynamic (and transport) simulation program which calculates non-steady flow and transport phenomena that result from tidal and meteorological forcing on a rectilinear or a curvilinear, boundary fitted grid (Delft3D-Flow, 2019); > Delft3D-Wave – a spectral wave model which computes the evolution of random, short-crested waves in coastal regions with deep, intermediate and shallow water and ambient currents. The model accounts for (refractive) propagation due to current and depth, and represents the processes of wave generation by wind, dissipation due to white capping, bottom friction and depth-induced wave breaking and non-linear wave-wave interactions (both quadruplets and triads) explicitly with state-of-the-art formulations (Delft3D- Wave, 2019). > Cardno’s modified Holland cyclone wind and pressure field model including first-order wind-field asymmetry due to cyclone forward motion. The model was applied to selected tropical cyclone tracks defined by CW1096100 | 11 February 2021 | Commercial in Confidence 17
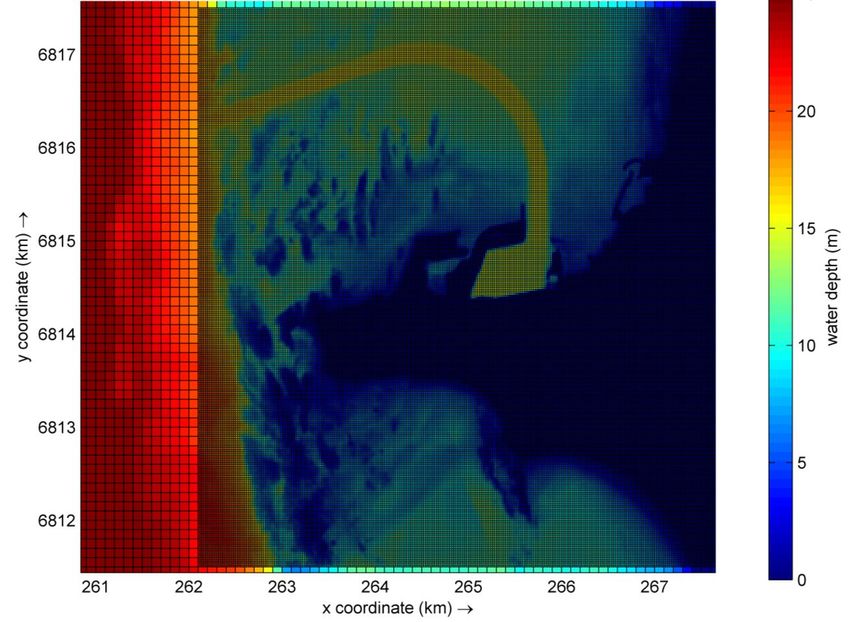
Geraldton CBD and Port Flood and Inundation Study
 Project Modelling Report

 timeseries of key parameters (e.g. date, geographical coordinates, central pressure and radius to maximum
 wind).
> Water levels along the offshore boundaries were provided as inputs representative of sea level rise
 allowance, tidal conditions and tsunami stage as required.
Cardno’s validated Beresford Foreshore model (Cardno, 2012) was required to be updated to address the
requirements of this study. This included the inclusion of additional hydrodynamic, wind and wave forcing, as
well as multiple nested grid extensions (Figure 5-2, Figure 5-3). The other parameterisation factors (e.g.
friction coefficients) were kept the same as in the original model.

 █ 2,500m grid
 █ 500m grid
 █ 100m grid
 █ 20m grid

Figure 5-2 Stage 1 – Coastal Model four nested grids.

CW1096100 | 11 February 2021 | Commercial in Confidence 18
Geraldton CBD and Port Flood and Inundation Study
 Project Modelling Report

 100m grid 20m grid

Figure 5-3 Stage 1 – Coastal Model high-resolution bathymetry.

5.2.2 Stage 2 - Nearshore Model
Complementary detailed cross-shore wave modelling was undertaken at 13 representative locations along
the coast (Figure 5-4). The model included the use of:
> Simulating Waves til SHore (SWASH, 2020) – a robust, non-hydrostatic phase resolving model capable
 of simulating refraction, shoaling, diffraction, bed friction, wave breaking and frequency-direction spectral
 input. It includes partial and full wave reflectivity off adjacent features (e.g. beach, rock revetment, wall).
 An illustration of the cross-sectional wave conditions and statistics is provided in Figure 5-10;
> Parametric reconstruction of storm tide events developing over a 6-day period consistent with historical
 events duration. The continuous 6-day storm tide event was reconstructed parametrically based on
 SWASH run results obtained for 7 “steady states” of wave and water level conditions ranging from
 ambient conditions to design criteria conditions. Each SWASH run simulated a period of 40 minutes,
 which provided sufficient data to obtain statistics such as average wave overtopping and peak steady
 water level (including wave set-up). An illustration of the parametric reconstruction of storm tide events is
 provided in Figure 5-11; and
> Dune breaching analysis in accordance with SPP2.6, which provides guidance to assess the capacity of a
 dune to provide protection from inundation based on its cross-sectional area above the design water
 level.

CW1096100 | 11 February 2021 | Commercial in Confidence 19
Geraldton CBD and Port Flood and Inundation Study
 Project Modelling Report

 7

 GP-N:
 Geraldton Port- 11
 North

 PM-N: Point 13
 Moore-North 12

 6

 8
 9
 10
 5
 4

 3 2

 PM-S: Point
 Moore-South
 SoPM: South 1
 of Point Moore

Figure 5-4 Stage 2 - Nearshore Model transects locations (dashed line), applicable shoreline section (coloured lines) and City’s
 CHRMAP areas (solid navy lines).

5.3 Extreme design water level conditions
5.3.1 Review of extreme water level estimates
A review of extreme water levels was conducted, including:
> Desktop review of existing extreme water levels studies readily available, including
 - CHRMAP (Baird 2019 and MRA 2015, 2016, 2017);
 - UWA (2018, Extreme sea level study); and
 - MWPA (2014, Geraldton Port Guideline).
> Statistical extreme analysis of the longest water level record provided by the Port to estimate design
 water level driven by frequent synoptic conditions; and
> Direct simulation of 500yr ARI tropical cyclone design storm event from DoT’s design cyclone study to
 estimate design water level driven by infrequent tropical cyclone conditions.

5.3.1.1 CHRMAP design water level
The City’s CHRMAP design water levels were obtained from (Baird 2019 and MRA 2015, 2016, 2017). The
shoreline water levels including wave set-up were obtained for 4 regions along the coast, maintaining
consistency with a number of reports covering the study area. The nearshore water level was inferred for
these 4 regions by removing an allowance for wave set-up in the range 0.8-1.1m as reported in the
supporting references. The resulting nearshore design water levels are summarised in Table 5-3.

CW1096100 | 11 February 2021 | Commercial in Confidence 20
Geraldton CBD and Port Flood and Inundation Study
 Project Modelling Report

 Table 5-3 Extreme water level (mAHD, excluding wave set-up) at Geraldton provided by the City’s CHRMAP for Geraldton
 Port - North area (GP-N), Point Moore - North area (PM-N), Point Moore - South area (PM-S) and South of Point
 Moore area (SoPM), as illustrated in Figure 5-4.

 Timeframe 2030 2070 2110
 Area GP-N PM-N PM-S SoPM GP-N PM-N PM-S SoPM GP-N PM-N PM-S SoPM
 20yr ARI 1.35 1.35 1.35 1.35 1.67 1.67 1.67 1.67 2.18 2.18 2.18 2.18
 100yr ARI 2.30 2.00 1.60 1.60 2.62 2.32 1.92 1.92 3.13 2.83 2.43 2.43
 500yr ARI 2.70 2.40 1.90 2.10 3.02 2.72 2.22 2.42 3.53 3.23 2.83 2.93

5.3.1.2 UWA Extreme sea level study
Present day extreme sea level statistics available on (http://sealevelx.ems.uwa.edu.au) were calculated from
a 59 year (1958-2016) hindcast of sea levels around Australia. The high-resolution numerical model included
the effects of astronomical tides, storm surges due to wind and pressure, and seasonal and interannual
mean sea level variability (UWA, 2018). The project was undertaken by the Coastal Oceanography Group at
the University of Western Australia, funded by the Bushfire and Natural Hazard CRC.
The extreme still water level for this study in Geraldton is shown in Figure 5-5 and summarised in Table 5-4.

Figure 5-5 Present day extreme still water level (mAHD): 100-year return period (left), design curve (right)
 [http://sealevelx.ems.uwa.edu.au/index.php accessed 6/09/2019].

 Table 5-4 Present day extreme water level (mAHD, excluding wave set-up) at Geraldton obtained from UWA extreme water
 level study.

 Storm event Water Level (95% confidence)
 20yr ARI 1.05 (1.12)
 100yr ARI 1.15 (1.25)
 500yr ARI 1.21 (1.35)

5.3.1.3 MWPA Geraldton Port Guideline
MWPA Geraldton Port Guideline design water levels refer to the levels provided in MWPA (2014) which cited
Cardno (2012) as supporting reference. The 1 in 500yr ARI event was derived by extrapolation of the lower
design water level estimates as shown in Figure 5-6.

CW1096100 | 11 February 2021 | Commercial in Confidence 21
Geraldton CBD and Port Flood and Inundation Study
 Project Modelling Report

 3.5

 3
 500, 3.15
 Water Level (mAHD)

 2.5

 2 500, 2.2

 1.5 mean
 95%
 1

 0.5

 0
 1 10 100 1000
 ARI (yr)

Figure 5-6 Design water level from MPWA (2011) and Cardno (2012), including extrapolation to 1 in 500yr ARI.

 Table 5-5 Present day extreme water level (mAHD, excluding wave set-up) at Geraldton obtained from MPWA (2011) and
 Cardno (2012).

 Storm event Water Level (95% confidence)
 20yr ARI 1.40 (1.80)
 100yr ARI 1.70 (2.50)
 500yr ARI 2.20 (3.15)

5.3.1.4 Extreme value analysis of Geraldton Port tide gage
An extreme value analysis (EVA) of Geraldton Port tide gage was conducted as part of the extreme water
level review. 30 years of data (1986/02-2018/03) was analysed using the univariate Peak Over Threshold
method and a 7-day period storm clustering threshold (Figure 5-7). Two noteworthy events were identified in
this analysis, including the 2004 Boxing Day Tsunami and the July 2010 Strong Cold Front. This analysis
enabled the determination of the probabilities of water level for extreme events, as summarised in Table 5-6.

 26 December 2004 9 July 2010
 “Boxing Day Tsunami” “Strong Cold Front”

Figure 5-7 Tide gage record at Geraldton Port obtained from the Port of Geraldton.

CW1096100 | 11 February 2021 | Commercial in Confidence 22
Geraldton CBD and Port Flood and Inundation Study
 Project Modelling Report

 Table 5-6 Present day extreme water level (mAHD, excluding wave set-up) at Geraldton obtained from the EVA of the port
 data.

 Period (1986/02-2018/03) Water Level (95% confidence)
 20yr ARI 1.35 (1.57)
 100yr ARI 1.59 (2.15)
 500yr ARI 1.85 (3.03)

5.3.1.5 Direct simulation of 500yr ARI tropical cyclone design storm event
A tropical cyclone storm surge modelling assessment was conducted as part of the review of the above
metocean design criteria estimates. The direct simulation of DoT’s 500yr ARI tropical cyclone design storm
event for Geraldton was undertaken. The modelling was based on:
> Tropical cyclone track specifications (i.e. location, central pressure, forward speed, heading) provided by
 the Department of Transport (Seashore, 2018 Design Storms for Western Australian Coastal Planning:
 Tropical Cyclones, prepared for the Department of Transport).
This enabled the determination of the extreme water level at the site and wave conditions under this
specified event, as shown in Figure 5-8. The peak water level at Geraldton Port tide gage is given in Table 5-
7.

Figure 5-8 Snapshots of tropical cyclone wind field (left) and associated wave conditions (right).

 Table 5-7 Extreme water level (mAHD, excluding wave set-up) at Geraldton obtained from the simulation of DoT’s 500yr ARI
 tropical cyclone design storm event.

 Storm event Water Level
 500yr ARI 1.2

5.3.1.6 Summary of the extreme water level review
A summary of extreme water level study results is shown in Table 5-8. The design water level adopted for
the CHRMAP are above the other extreme water level estimates, but within the 95% confidence interval of
the tide gage record extreme value analysis.
Discrepancies in design water level are common, as every study has their own limitations and assumptions.
However, design water level is an important parameter affecting inundation and wave overtopping hazard
and subsequent risk to the exposed assets and their functions.

CW1096100 | 11 February 2021 | Commercial in Confidence 23
Geraldton CBD and Port Flood and Inundation Study
 Project Modelling Report

In accordance with the precautionary principle, and in the context of the inundation study, it is probably
conservative to adopt the highest design water level estimates identified in the extreme water level review.
Accordingly, the design water level established in the CHRMAP and summarised in summarised in Table 5-3
have been subsequently adopted for the Geraldton CBD and Port Flood and Inundation Study.
 Table 5-8 Summary of extreme water level (mAHD) for the 500yr ARI “offshore” design water level for present day
 conditions.

 Water level (95% Region Type of analysis Comment / source of information
 confidence)
 2.70 (not provided) “Geraldton Port – Synthetic cyclone Based on CHRMAP corrected to
 North” modelling subtract wave set-up
 2.40 (not provided) “Point Moore – North” Synthetic cyclone Based on CHRMAP corrected to
 modelling subtract wave set-up
 2.2 (3.15) Port area 10yr water level record Interpolated from design water level
 extreme value analysis provided up to 100yr ARI in Port
 guidelines MWPA (2014) and cited
 Cardno (2012) report
 1.85 (3.03) Port area 30yr water level record Inundation hazard study (this study).
 extreme value analysis
 1.21 (1.35) Geraldton Synthetic cyclone UWA extreme sea level rise study
 modelling + 60 year (2018)
 hindcast
 1.2 (n/a) “Geraldton Port – Single track simulation at a DoT tropical cyclone design storm
 North” fixed background tide level (2018). The track parameters are
 (MHHW). being revised by the authors as the
 intensity of this cyclone is considered
 to be too low (personal
 communication, May 2020).

5.3.2 Adopted design water level
As indicated above, the design water level established in the CHRMAP have been adopted for the Geraldton
CBD and Port Flood and Inundation Study. The nearshore water levels were derived from storm tide levels
modelling results undertaken by MP Rogers (and utilised in CHRMAP), excluding wave set-up. These
nearshore water levels are summarised in Table 5-3These nearshore water levels were suitable to be
applied directly as boundary conditions to the high-resolution Stage 1 - Coastal Model so adequate water
level is provided for the simulation of the wave transformation over key bathymetric features in the area,
including shallow reefs and deep navigation channel.
Similarly, these nearshore water levels were suitable to be applied directly as boundary conditions to the
Stage 2 - Nearshore Model so adequate water level is provided for the simulation of the detailed wave
transformation over the beach and coastal protections to estimate wave set-up, wave run-up and wave
overtopping.

5.4 Extreme design wave conditions
An extreme value analysis (EVA) of Geraldton Port wave data located at the entrance of the outer channel
was conducted. 20 years of data (1999/03 to 2018/12) was analysed using a bivariate Peak Over Threshold
method and a 7-day period storm clustering threshold. This enabled the determination of joint probabilities of
wave height and period for extreme events, as summarised in Table 5-9.
Stage 1 wave modelling was undertaken using the offshore design wave criteria at Beacon 1 along the
model boundary condition for 2 wave directions (north-westerly and south-westerly) and the adopted
nearshore design water level to enable the representation of the sheltering effect of the study area by Point
Moore and estimate adequate design wave conditions for the Stage 2 wave modelling.

CW1096100 | 11 February 2021 | Commercial in Confidence 24
Geraldton CBD and Port Flood and Inundation Study
 Project Modelling Report

 Table 5-9 Offshore extreme wave conditions at Beacon 1 (outer channel entrance) obtained from the EVA of the Port data.

 Period (1999/03-2018/12) Hs (m) Tp (s)
 20yr ARI 4.8 17.0
 100yr ARI 5.1 18.1
 500yr ARI 5.4 18.9

5.5 Storm tide scenarios
A total of 18 Stage 1 – Coastal Modelling simulations were undertaken to characterise the 9 storms tide
design scenarios adopted under both the south-westerly and north-westerly conditions, as illustrated in
Figure 5-9. The worst-case scenario of both conditions was kept as adopted design conditions.
A total of 819 Stage 2 – Nearshore Modelling simulations were undertaken to characterise the 9 storms tide
design scenario adopted for 7 stages of the storm tide in 13 locations, as illustrated in Figure 5-10.
Each storm tide inundation scenario identified in the adopted design scenarios (Table 5-2) were defined by
nearshore water level time series and mean overtopping discharge, as shown in Figure 5-11.
The maximum mean overtopping discharges and maximum overtopping volumes are reported in Table 5-10
and Table 5-11 respectively.

Figure 5-9 Examples of extreme wave conditions for south-westerly conditions (left) and north-westerly conditions (right).

CW1096100 | 11 February 2021 | Commercial in Confidence 25
Geraldton CBD and Port Flood and Inundation Study
 Project Modelling Report

Figure 5-10 Examples cross-sectional wave conditions and statistics for 2 different water level inputs.

CW1096100 | 11 February 2021 | Commercial in Confidence 26
Geraldton CBD and Port Flood and Inundation Study
 Project Modelling Report

Figure 5-11 Example of parametric reconstruction of storm tide events.

 Table 5-10 Maximum mean overtopping discharge (l/s per m) for each transect and scenario.

 ARI 20yr 100yr 500yr
 Transect / Year 2030 2070 2110 2030 2070 2110 2030 2070 2110
 1 0 0 0 0 0 0 0 0 17
 2 0 0 0 0 0 0 0 0 0
 3 0 0 6 0 3 16 4 9 74
 4 32 32 49 42 86 110 104 96 263
 5 39 57 116 117 124 125 129 135 141
 6 9 13 30 35 50 59 55 59 64
 7 7 24 24 30 40 59 46 56 55
 8 30 54 56 58 61 61 65 66 81
 9 3 3 3 3 3 3 3 3 3
 10 0 0 1 1 2 5 2 4 4
 11 2 2 2 3 4 4 4 4 4
 12 0 0 7 14 57 261 78 207 528
 13 0 0 2 3 8 45 11 33 141

CW1096100 | 11 February 2021 | Commercial in Confidence 27
You can also read