Multi-compartment kinetic-allometric (MCKA) model of radionuclide bioaccumulation in marine fish
←
→
Page content transcription
If your browser does not render page correctly, please read the page content below
Biogeosciences, 18, 2591–2607, 2021
https://doi.org/10.5194/bg-18-2591-2021
© Author(s) 2021. This work is distributed under
the Creative Commons Attribution 4.0 License.
Multi-compartment kinetic–allometric (MCKA) model of
radionuclide bioaccumulation in marine fish
Roman Bezhenar1 , Kyeong Ok Kim2 , Vladimir Maderich1 , Govert de With3 , and Kyung Tae Jung4
1 Institute
of Mathematical Machine and System Problems, Glushkov av., 42, Kyiv 03187, Ukraine
2 KoreaInstitute of Ocean Science and Technology, 385, Haeyang-ro, Yeongdo-gu,
Busan Metropolitan City, Republic of Korea
3 NRG, Utrechtseweg 310, 6800 ES Arnhem, the Netherlands
4 Oceanic Consulting & Trading, 403 Munhwa-building, 90 Yangpyeong-ro, Seoul, Republic of Korea
Correspondence: Vladimir Maderich (vladmad@gmail.com)
Received: 11 November 2020 – Discussion started: 18 November 2020
Revised: 9 March 2021 – Accepted: 10 March 2021 – Published: 25 April 2021
Abstract. A model of the radionuclide accumulation in fish Forsmark Nuclear Power Plant (NPP) located on the Baltic
taking into account the contribution of different tissues and Sea coast of Sweden and for calculation of 90 Sr concentra-
allometry is presented. The basic model assumptions are as tion in fish after the accident at Fukushima Dai-ichi NPP.
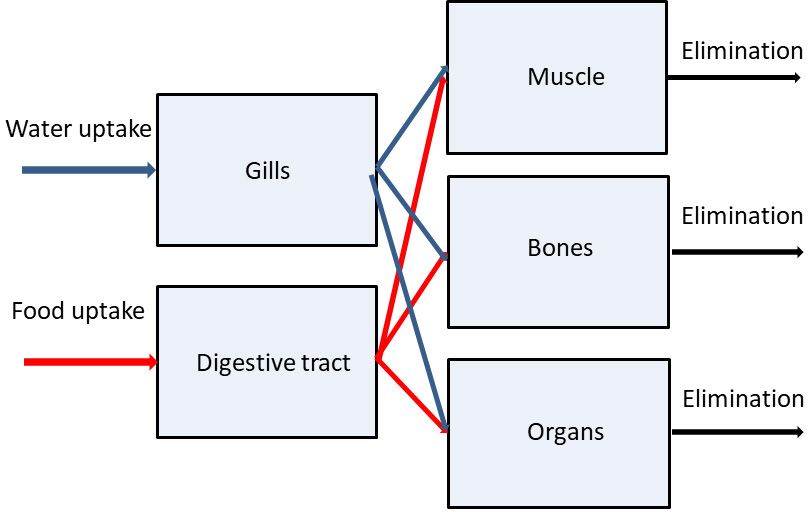
follows. (i) A fish organism is represented by several com- Computed concentrations of radionuclides in fish agree with
partments in which radionuclides are homogeneously dis- the measurements much better than calculated using standard
tributed. (ii) The compartments correspond to three groups whole-body model and target tissue model. The model with
of organs or tissues: muscle, bones and organs (kidney, liver, the defined generic parameters could be used in different ma-
gonads, etc.) differing in metabolic function. (iii) Two input rine environments without calibration based on a posteriori
compartments include gills absorbing contamination from information, which is important for emergency decision sup-
water and digestive tract through which contaminated food port systems.
is absorbed. (iv) The absorbed radionuclide is redistributed
between organs or tissues according to their metabolic func-
tions. (v) The elimination of assimilated elements from each
group of organs or tissues differs, reflecting differences in 1 Introduction
specific tissues or organs in which elements were accumu-
lated. (vi) The food and water uptake rates, elimination rate, Accumulation of radionuclides in marine organisms is a
and growth rate depend on the metabolic rate, which is scaled complicated process that is governed by uptake of radionu-
by fish mass to the 3/4 power. The analytical solutions of the clides from water, sediment and food as well as by depura-
system of model equations describing dynamics of the as- tion. In turn, these processes depend on the chemical prop-
similation and elimination of 134 Cs, 57 Co, 60 Co, 54 Mn and erties of elements, their roles in metabolic processes, the po-
65 Zn, which are preferably accumulated in different tissues, sitions of organisms in the food web and marine environ-
exhibited good agreement with the laboratory experiments. mental parameters. In the case of chronic exposure, the ra-
The developed multi-compartment kinetic–allometric model diological assessment models often assumed an equilibrium
was embedded into the box model POSEIDON-R (Maderich approach (Carvalho, 2018), in which concentration in the or-
et al., 2018b), which describes transport of radionuclides ganism relates to the concentration in water using a biologi-
in water, accumulation in the sediment and transfer of ra- cal accumulation factor (BAF). However, to describe highly
dionuclides through the pelagic and benthic food webs. The time-dependent transfer processes resulting from accidental
POSEIDON-R model was applied for the simulation of the releases, dynamic models for the uptake and retention of ac-
transport and fate of 60 Co and 54 Mn routinely released from tivity in marine organisms are necessary (Vives i Batlle et al.,
2016). According to Takata et al. (2019), the effective half-
Published by Copernicus Publications on behalf of the European Geosciences Union.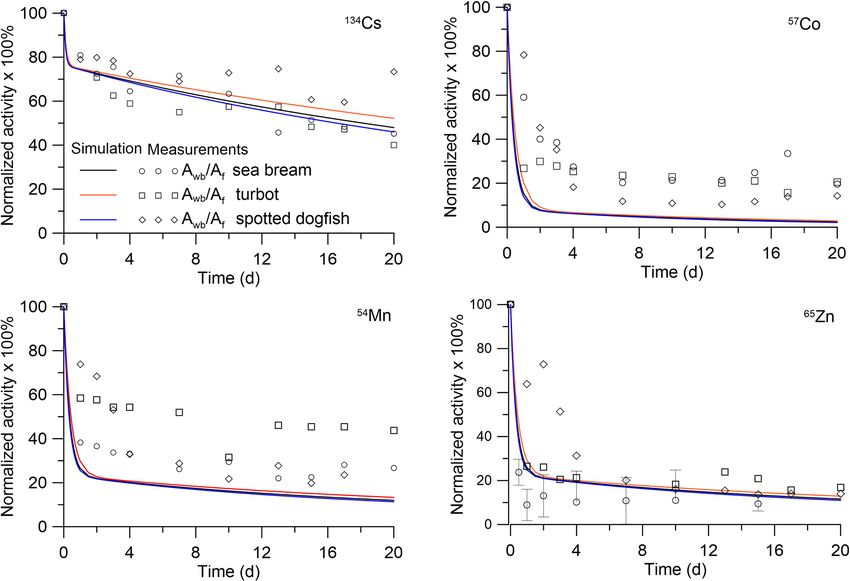
2592                                                       R. Bezhenar et al.: Multi-compartment kinetic–allometric model

lives of post-Fukushima Dai-ichi Nuclear Power Plant (FD-         the one-compartment model and the PBPK model taking into
NPP) accident disequilibrium of 137 Cs in biota ranged from       account (i) the heterogeneity of the distribution of contami-
100 to 1100 d. The most commonly used bioaccumulation             nation in fish tissues and (ii) the allometric relationships be-
models are the whole-body models, where the organism is           tween metabolic rates and organism mass. Such a model can
represented as a single box in which contamination is evenly      be used for accidental release simulations without local cali-
distributed (e.g. Fowler and Fisher, 2004; Vives i Batlle et      bration, which is a complicated task in the circumstances of
al., 2016). However, the distribution of radionuclides in or-     the accident.
ganisms, and in particular in fish, is non-uniform. For ex-          In this paper, a new approach for predicting radionuclide
ample, the highest concentration of radiocaesium in fish is       accumulation in fish by taking into account the contributions
observed in the muscle, while the highest concentrations of       of different tissues and allometry is presented. The devel-
the actinides, plutonium and americium, are measured in spe-      oped multi-compartment kinetic–allometric (MCKA) model
cific organs (Coughtrey and Thorne, 1983). Moreover, Vives        is embedded into the box model POSEIDON-R (Lepicard
i Batlle (2012) noted that elimination of activity from or-       et al., 2004; Maderich et al., 2014a, b; 2018b; Bezhenar et
ganisms occurred with different rates that can be interpreted     al., 2016), which describes transport of radionuclides in wa-
as elimination from different tissues or organs with different    ter, accumulation in the sediment, and transfer of radionu-
metabolism. In a first approximation, this is used in the “tar-   clides through the pelagic and benthic food webs. The paper
get tissue” approach (Heling et al., 2002; Tateda et al., 2013;   is organized as follows. The MCKA model is described in
Maderich et al., 2014a, b; Bezhenar et al., 2016), where ra-      Sect. 2. The comparison with laboratory experiments is given
dionuclides are grouped into several classes depending on         in Sect. 3. The results of simulation of several radionuclides
the type of tissues in which a specific radionuclide accumu-      in the marine environment for regular and accidental releases
lates preferentially (target tissue). However, the contribution   are described in Sect. 4. The conclusions are presented in
of other tissues with greater mass than the mass of the tar-      Sect. 5.
get tissue can be commensurate with the contribution of the
target tissue to the amount of radioactivity in the body. Dis-
tribution of accumulated activities of isotopes Cs, Sr and Co     2     Model
in muscle, bone and liver estimated from previously reported
data (Yankovich, 2003; Yankovich et al., 2010) are shown in       2.1    Model equations
Fig. 1. The accumulated activity in a given tissue was cal-
culated as a ratio of tissue mass fraction (%) (Yankovich,        Here, a simple multi-compartmental model to simulate ki-
2003) to body-to-tissue concentration ratio (Yankovich et al.,    netics of radionuclides in the fish is described. The basic as-
2010). As seen in Fig. 1, the accumulated activity of Sr in       sumptions are as follows: (i) a fish organism is represented
muscle is not negligible in comparison with accumulated ac-       by several compartments in which radionuclides are homo-
tivity in bones, whereas the accumulated activity of Co is        geneously distributed; (ii) the compartments correspond to
redistributed between muscle, bone and liver.                     three groups of organs or tissues differing in metabolic func-
   A more general approach to the description of the radionu-     tion: muscle, bones and organs (kidney, liver, gonads, etc.);
clide accumulation in the tissues of fish is using the physio-    (iii) two input compartments include gills which absorb con-
logically based pharmacokinetic (PBPK) models (Barron et          tamination from water and digestive tract through which con-
al., 1990; Thomann et al., 1997; Garnier-Laplace et al., 2000;    taminated food is absorbed; (iv) the absorbed radionuclide
Otero-Muras et al., 2010; Grech et al., 2019). In the PBPK        is redistributed between organs or tissues according to their
models, the fish organism is represented as three groups of       metabolic functions; (v) the elimination of assimilated ele-
compartments: absorption compartments simulating uptake           ments from each group of organs or tissues differs, reflecting
of contaminants, distribution compartments simulating tis-        differences in the specific tissues or organs in which elements
sues and organs, and excretion compartments. The exchange         were accumulated; and (vi) the food and water uptake rates,
of contaminants between compartments is limited by blood          elimination rate, and growth rate depend on the metabolic
flux perfusing compartments. However, these models require        rate, which is scaled by fish mass to the 3/4 power following
a significant number of parameters depending on elements,         general theory (West et al., 1997). A schematic representa-
fish species and marine environments. They must be deter-         tion of the model is shown in Fig. 2.
mined from laboratory experiments (Thomann et al., 1997)             The equation for concentration of radionuclide C1
or by optimization procedures (Otero-Muras et al., 2010).         [Bq kg−1 ] wet weight (WW) in the gill compartment (i = 1)
Note that, with the exception of model Grech et al. (2019),       is written as
PBPK fish models do not include scaling (allometric) rela-        dm1 C1
tionships between metabolic rates and organism mass (West                = Kw mCw − k1 m1 C1 − λ1 m1 C1 .                     (1)
                                                                    dt
et al., 1997; Higley and Bytwerk, 2007; Vives i Batlle et al.,
2007; Beresford et al., 2016). Therefore, there is a need to         The equation for concentration of unabsorbed radionu-
develop a generic model of intermediate complexity between        clide C2 [Bq kg−1 ] (WW) in the digestive tract compartment

Biogeosciences, 18, 2591–2607, 2021                                                  https://doi.org/10.5194/bg-18-2591-2021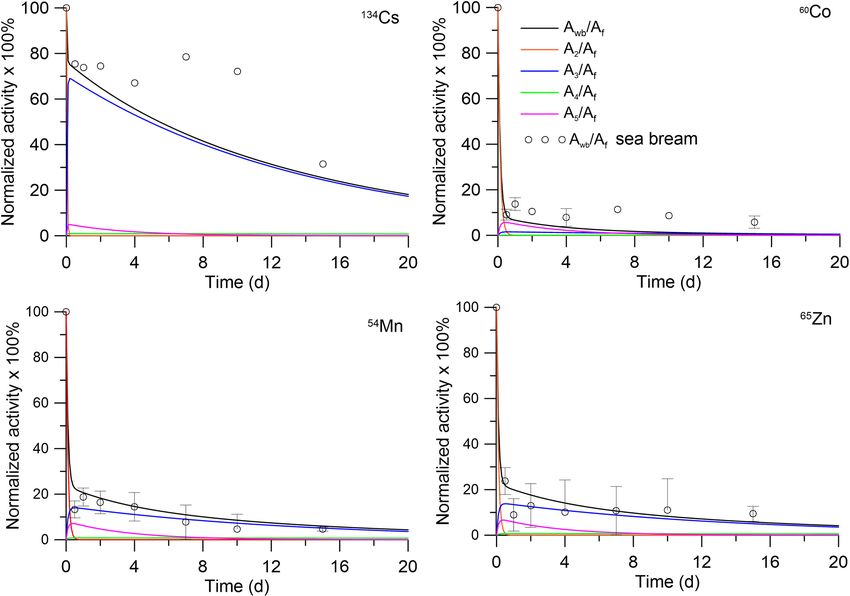
R. Bezhenar et al.: Multi-compartment kinetic–allometric model                                                                        2593

Figure 1. Distribution of accumulated activities of isotopes Cs, Sr and Co in muscle, bone and liver estimated from data (Yankovich, 2003;
Yankovich et al., 2010).

                                                                        where Cprey,j is the activity concentration in prey of type 0 ≤
                                                                        j ≤ n, Pj is preference for prey of type j , drwpred is the dry
                                                                        weight fraction of fish and drwprey,j is the dry weight fraction
                                                                        of prey of type j . The mean whole-body concentration of
                                                                        activity in the organism Cwb and whole-body activity Awb
                                                                        [Bq] are calculated as
                                                                                             5
                                                                                             X                  5
                                                                                                                X
                                                                        Awb = mCwb =               mi Ci = m          µi Ci ,           (5)
                                                                                             i=1                i=1
                                                                                                              P
                                                                                                                 5
                                                                        where µi represents weighting factors    i=1 µi = 1 .
                                                                           Transfer rates k1 and k2 are related with tissue transfer
                                                                        rates k1i and k2i as
                                                                               5                  5
Figure 2. Schematic of the multi-compartment kinetic–allometric
                                                                               X                  X
                                                                        k1 =         k1i , k2 =         k2i .                           (6)
model.                                                                         i=3                i=3
                                                                        Summing Eqs. (1) to (3) yields the equation for total concen-
(i = 2) is                                                              tration of activity in fish Cwb as
dm2 C2                                                                  dCwb
       = Kf mCf − k2 m2 C2 − λ2 m2 C2 .                          (2)          = Kw Cw + Kf Cf − λ1 µ1 C1 − λ2 µ2 C2
  dt                                                                     dt
                                                                            5
The equations for concentrations of radionuclide Ci                       X
                                                                        −     λi µi Ci − λg Cwb ,                                       (7)
[Bq kg−1 ] (WW) in the muscle (i = 3), bones (i = 4) and or-
                                                                           i=3
gans (i = 5) are
                                                                        where λg is the organism growth rate, defined as
dmi Ci
       = k2i m2 C2 + k1i m1 C1 − λi mi Ci .                      (3)           1 dm
 dt                                                                     λg =        .                                             (8)
                                                                              m dt
Here, t is time; mi is the mass of the ith tissue; m [kg] is the        The growth dilution can be ignored in the model calculations
total mass of fish; Cw [Bq m−3 ] is the concentration of ra-            when λg  λi . For short-lived radionuclides, λi should be
dionuclide in water; Cf [Bq kg−1 ] (WW) is the concentration            corrected by taking into account the physical decay. The as-
of radionuclide in food; Kw [m3 (kg d)−1 ] is a water uptake            similation efficiencies of elements from water AEw and food
rate per unit fresh weight of fish and Kf [kg(kg d)−1 ] is a            AEf (Pouil et al., 2018) can be introduced, assuming that up-
food uptake rate per unit fresh weight of fish; λ1 is a loss rate       take from water and food is equilibrated by loss to the water
from gills to water [d−1 ]; k1 , k1i , k2 , and k2i [d−1 ] are trans-   from gills and through egestion. The corresponding relations
fer rates between tissues; and λ2 [d−1 ] is the egestion rate           are
from the digestive tract; λi [d−1 ] is the absorbed radionuclide
                                                                                 Kw Cw − λ1 µ1 C1
elimination rate from different tissues or organs (i = 3, 5).           AEw =                       ,                             (9)
   The activity concentration in the food Cf is expressed by                           Kw Cw
the following equation, summing for a total of n prey types                     Kf Cf − λ2 µ2 C2
                                                                        AEf =                    .                               (10)
                                                                                      Kf Cf
       n
       X                    drwpred                                     Taking into account the relations Eqs. (9)–(10) for constant
Cf =          Cprey,j Pj             ,                           (4)
       j =0
                           drwprey,j                                    AEw and AEf , Eq. (7) will be similar to the standard whole-

https://doi.org/10.5194/bg-18-2591-2021                                                                 Biogeosciences, 18, 2591–2607, 2021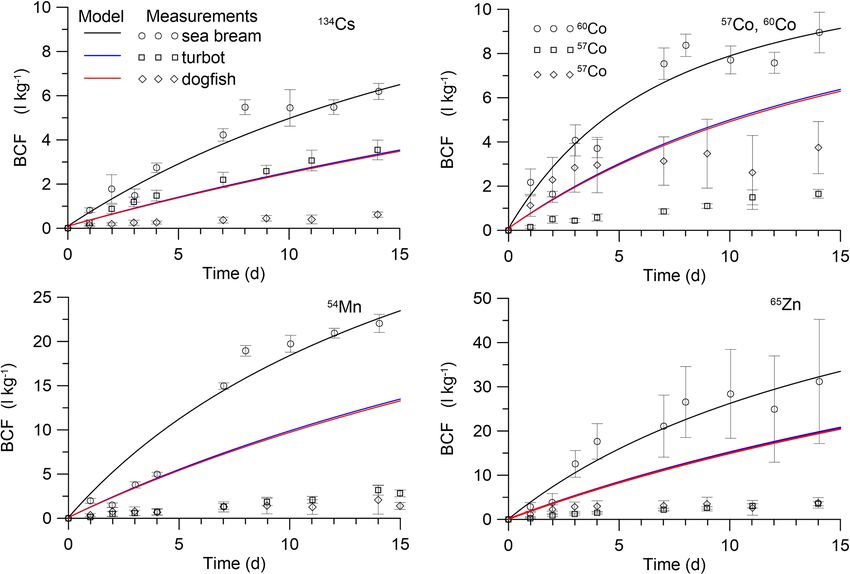
2594                                                         R. Bezhenar et al.: Multi-compartment kinetic–allometric model

body single-compartment equation                                    When λ1  λg and λ2  λg , we determine from Eqs. (16)
                                                                    and (12), approximately, that
dCwb
     = AEw Kw Cw + AEf Kf Cf − (λwb + λg )Cwb               (11)         AEw λ1          AEw α1              AEf λ2
 dt                                                                 k1 =         =                   , k2 =
                                                                        1 − AEw      (1 − AEw )m 1/4        1 − AEf
if elimination terms in Eq. (7) are replaced by a single term
λwb Cwb , assuming that λwb is a single whole-body elimina-               AEf α2
                                                                    =                .                                        (17)
tion rate (Fowler and Fisher, 2004).                                  (1 − AEf )m1/4
   The food and water uptake rates, elimination rate, and           This assumption also imposes a requirement on the mod-
growth rate depend on the metabolic rate, which in turn is          elling of radionuclides with decay constant λ  λi . Eq. (17)
known to scale by the organism mass. Here, we employed              relations are used to relate kinetic coefficients of the model
quarter-power scaling for uptake, elimination and growth            with experimentally determined parameters AEw , AEf , λ1
rates derived from general theory (West et al., 1997). This         and λ2 . Eq. (15) can be rewritten as
theory predicts for all organisms the 3/4 power law for
metabolic rates. It describes transport of essential materials                                                      BAFwb
                                                                    AEfi αf BAFfood + AEwi αw = µi (αi + αg )             ,   (18)
through space-filling fractal networks of branching tubes as-                                                        CRi
suming that the energy dissipation is minimized and that the
                                                                    where AEwi and AEfi are assimilation efficiencies for tissue
terminal branch of the network is size invariant. The scaling
                                                                    i,
relations are
                                                                    5                       5
Kw (m) = αw m−1/4 , Kf (m) = αf m−1/4 , λg (m)
                                                                    X                       X
                                                                          µi AEwi ≈ AEw ,         µi AEfi ≈ AEf .             (19)
         −1/4                 −1/4                                  i=3                     i=3
= αg m          , λi (m) = αi m      ,                      (12)
                                                                      The assimilation efficiencies are expressed through kinetic
where αw , αf , αg , αi (i = 1, 5) are constants. These param-      coefficients as
eters can also depend on temperature, salinity and fish age
(e.g. Belharet et al., 2019; Heling and Bezhenar, 2009). No-                    k1i                 k2i
                                                                    µi AEwi =       AEw , µi AEfi =     AEf .                 (20)
tice that a number of laboratory experiments (Thomas and                        k1                  k2
Fisher, 2010) showed that temperature exerts no major in-           We define the bioconcentration factor (BCF) as a ratio of
fluence on uptake and elimination, whereas the effect of            whole body of fish to water concentrations with no dietary
salinity varies for elements (Heling and Bezhenar, 2009;            intake, bioaccumulation factor (BAF) as ratio of whole body
Jeffree et al., 2017). Here, we did not analyse these fac-          of fish to water concentrations with dietary intake, and body-
tors requiring separate consideration. The values of constants      to-tissue concentration ratio (CRi ) as the ratio of whole body
αw , αf , αg , αi (i = 1, 5) estimated from laboratory experi-      to ith tissue concentrations, whereas the ratio of food to wa-
ments and marine data are provided in Table 1, whereas val-         ter concentrations is indicated as BAFfood . The parameters
ues of weighting factors µ1 = 0.01, µ2 = 0.01, µ3 = 0.78,           BAF, CRi and BAFfood are described as
µ4 = 0.12, and µ5 = 0.08 were chosen using estimates from
Yankovich (2003).                                                            Cwb         Cwb             Cfood
                                                                    BAF =        , CRi =     , BAFfood =       .              (21)
                                                                             Cw          Ci               Cw
2.2    Kinetics in equilibrium state
                                                                       Values of BAF for different radionuclides are named as
The model parameters can be estimated using measurement             CF (Concentration Factor) in IAEA (2004). Yankovich et
data and applying the kinetic equations under equilibrium           al. (2010) provide CRi based on aggregate experimental data
conditions. Equations (1)–(3) rewritten for radionuclide con-       for marine fish. We assume that the kinetics of assimilation in
centrations in the equilibrium state are                            fish tissues are similar for radionuclides absorbed from water
                                                                    and food; i.e.
               Kw Cw
µ1 C1 =                  ,                                   (13)   AEwi   AEfi
          k1 + λ1 + λg                                                   =      .                                             (22)
                                                                    AEw    AEf
               Kf Cf
µ2 C2 =                  ,                                   (14)   Notice that assimilation for some elements can be considered
          k2 + λ2 + λg
                                                                    route dependent (Reinfelder et al., 1999), and so Eq. (22) is
        Kf C f             Kw C w
k2i               + k1i              = λi µi Ci + λg µi Ci . (15)   only a first approximation. Inserting Eq. (22) into Eq. (18)
    k2 + λ2 + λg        k1 + λ1 + λg
                                                                    yields
Then, using Eqs. (13)–(14), the assimilation efficiencies of        AEfi
elements from water AEw and food AEf are rewritten as                    AEf αf BAFfood + AEw αw
                                                                    AEf
             k1 + λg              k2 + λg                                 µi (αi + αg )
AEw =                  , AEf =              .               (16)    = BAF               ,                                     (23)
          k1 + λ1 + λg         k2 + λ2 + λg                                   CRi

Biogeosciences, 18, 2591–2607, 2021                                                   https://doi.org/10.5194/bg-18-2591-2021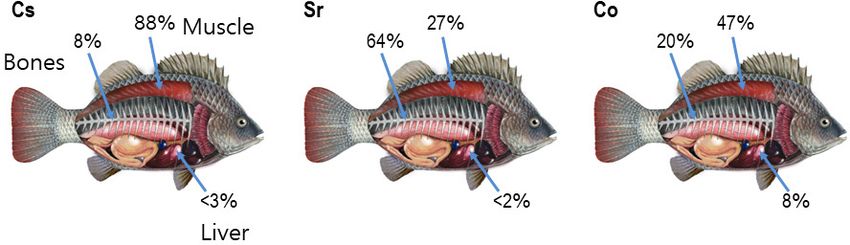
R. Bezhenar et al.: Multi-compartment kinetic–allometric model                                                                              2595

Table 1. Parameters in allometric relations, standard deviation (SD) of parameters and number of measurements N.

                  Constant         Value      N     SD         Data source
                  αw               0.08       1     –          Mathews et al. (2008)
                  αf               0.012      7     0.005      Alava and Gobas (2016)
                  αg               0.0012     7     0.0003     Alava and Gobas (2016)
                  α1               800        –     –          This study
                  α2               0.75       7     0.18       Andersen (1984); Pouil et al. (2017)
                  α3               0.007      8     0.0017     Jeffree et al. (2006); Mathews and Fisher (2008); Mathews et al. (2008)
                  α4               0.001      –     –          Heling et al. (2002)
                  α5               0.0275     1     –          Rouleau et al. (1995)

Table 2. The food assimilation efficiency AEf (Pouil et al., 2018),                of fish. The TTF values calculated by using Eq. (26) are
assimilation efficiency of elements from water AEw , tissue assimi-                given in Table 2. Among the considered elements, only cae-
lation efficiencies AEfi and trophic transfer factor (TTF) for several             sium (TTF > 1) may be biomagnified in the food chain, in
elements.                                                                          agreement with Kasamatsu and Ishikawa (1997), where it
                                                                                   was found that the BAF of 137 Cs increased with increas-
  Element         AEf             AEw       AEf3    AEf4     AEf5      TTF
                                                                                   ing trophic level. The concentrations of other radionuclides
  Cs             0.76            0.001a     0.88     0.08     0.65      1.3        in Table 2 decreased with the increase of trophic level
  Sr            0.29b         0.00003c      0.21     0.64     0.51     0.71        (TTF < 1), which is consistent with the findings presented
  Co            0.081          0.0025a      0.02    0.007     0.80     0.06        by Cardwell et al. (2013), where an inverse relationship was
  Mn             0.24          0.0045a      0.18     0.07     0.98      0.4        obtained between trophic levels and the concentration of in-
  Zn             0.22          0.0065a      0.18     0.06     0.93     0.35
                                                                                   organic metals in water chains.
a The values were estimated from experiments by Mathews and Fisher (2008). b The      Notice that values of AEf , AEw and BAF do not depend on
value was estimated using BAF from IAEA (2004). c Heling and Bezhenar (2009) for
seawater environment.
                                                                                   the fish mass. The literature data reveal diverse relationships
                                                                                   between fish mass and both radionuclide bioconcentration
                                                                                   (BCF) and bioaccumulation (BAF) factors. In particular, data
Summing Eq. (23) for i = 3, 4, 5 yields                                            of laboratory experiments (Mathews et al., 2008) showed
                                                                                   that there is no significant relationship between bioconcen-
                                             5
                                             X µi (αi + αg )                       tration factor BCF and fish size for most studied aqueous
AEf αf BAFfood + AEw αw = BAF                                     .       (24)
                                                      CRi                          metals. The BAF in larger and older fish of the same species
                                              i=3
                                                                                   can differ from smaller and younger fish due to the change
Using Eqs. (23) and (24), the ratio AEfi / AEf can be written                      of habitat and diet with age (e.g. Kasamatsu and Ishikawa,
as                                                                                 1997; Ishikawa et al., 1995; Kim et al., 2019); however, in
                                                 !                                 this study we did not consider the change of prey preference
                              5
AEfi                          X    µi (αi + αg )                                   along the fish growth.
     = µi (αi + αg )     CRi                       .    (25)
 AEf                          i=3
                                       CRi

The values of kinetic coefficients k1 and k2 and assimilation
efficiencies for tissues AEfi were calculated from Eqs. (17)                       3     Comparison with laboratory experiments
and (25) using assimilation efficiencies from experimental
data (Pouil et al., 2018). The values of AEfi for several ra-                      3.1    Depuration of radionuclides after pulse-like feeding
dionuclides are given in Table 2.
   Equation (24) can be rearranged to express the ratio of                         Retention of absorbed elements in fish after single feeding
BAFwb to BAFfood by taking into account dominance of di-                           was often used to estimate AEf and depuration rate (e.g. Jef-
etary intake over water intake (Mathews and Fisher, 2009).                         free et al., 2006; Mathews and Fisher, 2008; Mathews et al.,
This ratio is the trophic transfer factor (TTF), written as                        2008; Pouil et al., 2017). According to Goldstein and Elwood
                                                                                   (1971), single feeding can be approximated by a delta func-
                   5
                  X
                              µi (αi + αg )                                        tion δ(t) at t = 0 as
TTF = AEf αf                                .                             (26)
                        i=3
                                  CRi
                                                                                   Kf mCf = Af δ(t),                                         (27)
TTF > 1 indicates possible biomagnification, and TTF < 1
indicates that biodiminution is likely. As follows from                            where Af is the total amount of ingested activity. The solu-
Eq. (26), the TTF value does not depend on the mass                                tions of Eqs (1)–(3) for activities A2 = m2 C2 and Ai = mi Ci

https://doi.org/10.5194/bg-18-2591-2021                                                                   Biogeosciences, 18, 2591–2607, 2021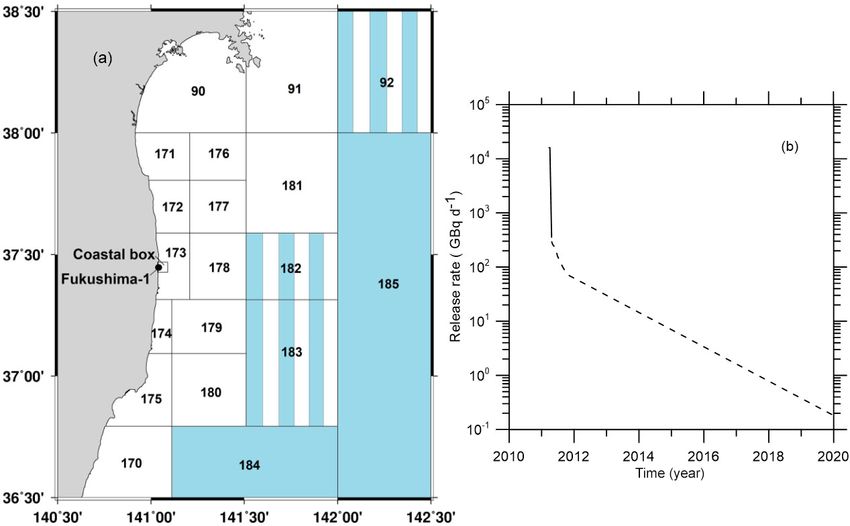
2596                                                        R. Bezhenar et al.: Multi-compartment kinetic–allometric model

and for initial conditions A2 = Ai = 0 are                         which is probably due to the neglect of other factors, except
                                                                   body weight, for the bioaccumulation kinetics. Parameters of
A2    m2 C2                                                        the MCKA model for fish from experiments (Mathews and
   =        = exp(−(k2 + λ2 )t),                           (28)
Af     Af                                                          Fisher, 2008; Mathews et al., 2008) are given in Table S1,
Ai   mi Ci         k2i                                            whereas Tables S2–S4 show dependence on radionuclides of
   =        =                exp(−λi t)
Af     Af     k2 + λ2 − λi                                         the transfer rates k2,i in different fishes.

− exp(−(k2 + λ2 )t) .                                      (29)
                                                                   3.2   Bioconcentration of dissolved radionuclides from
   As follows from these solutions, the decay of activity in             sea water
the fish organisms includes a fast component with decay
constant representing transfer of activity to the fish body        Uptake and absorption in fish of elements from water were
and unabsorbed element egestion from the digestive tract,          studied in several laboratory experiments (e.g. Jeffree et al.,
along with a slow component which is governed by elim-             2006; Mathews and Fisher, 2008; Mathews et al., 2008). The
ination constants for i tissues. These solutions are gener-        modelling of the absorption of elements can be used to esti-
alized solutions of the equations of the sequentially linked       mate an assimilation efficiency AEw . An analytical solution
two-compartment model by Goldstein and Elwood (1971),              of Eqs. (1) and (3) with initial conditions Ci = 0 at t = 0 is
whereas in the D-DAT model (Vives i Batlle et al., 2008) an        written as
organism was represented by two boxes with parallel kinet-         µ1 C1       Kw
ics, also describing “slow” and “fast” exchange processes.                =           1 − exp(−(k1 + λ1 )t) ,                 (30)
                                                                    Cw       k1 + λ1
   The analytical solutions (Eqs. 28–29) can be compared           µi Ci       k1i Kw          k1 + λ1
with laboratory experiments in which depuration of metals                =               1−                exp(−λi t)
                                                                    Cw      (k1 + λ1 )λi     k1 + λ1 − λi
from the fish after single feeding was studied. In the ex-
periment by Mathews and Fisher (2008), the retention of                    λi
                                                                   +                exp(−(k1 + λ1 )t) , (i = 3, 5).           (31)
several radioisotopes in juvenile sea bream (Sparus aura-             k1 + λ1 − λi
tus) was considered. The average wet weight of the fish was
0.0001 kg. These fish were fed radiolabelled Artemia salina           These solutions were compared with laboratory experi-
nauplii. The fish were allowed to feed for 1 h, after which        ments for prey fish (Mathews et al., 2008) and for predator
metal retention was observed in clean water over a 15 d pe-        fish (Jeffree et al., 2006). In the experiment by Mathews et
riod. The solutions with parameters corresponding to the fish      al. (2008), the uptake of several radioisotopes by juvenile
mass and metal AE (Pouil et al., 2018) were compared with          S. auratus (wet weight 0.0002 kg) was studied during 25 d
experimental data for 134 Cs, 60 Co, 54 Mn, and 65 Zn in Fig. 3.   of exposure, whereas in experiments by Jeffree et al. (2006)
As seen in Fig. 3, both model and experiments showed two           immature P. maxima (wet weight 0.0061 kg) and S. canic-
phases (fast and slow) of radionuclide elimination. Most of        ula (wet weight 0.0067 kg) were used for study during a
the activity is contained in muscle; however, the first 5 d af-    15 d period. Parameters of the MCKA model for these fishes
ter feeding the concentrations of 60 Co and 54 Mn in organs        are given in Table S5, whereas Tables S6–S8 show depen-
are much greater than in the muscle.                               dence on radionuclides of the transfer rates k1,i in different
   The solutions were also compared with laboratory exper-         fishes. The comparison of the analytical solutions (Eqs. 30–
iments for predator fish (Mathews et al., 2008). In these ex-      31) with experimental data with respect to bioconcentration
periments, the retention of several radioisotopes in sea bream     factor (BCF = Cwb /Cw [L kg−1 ]) is presented in Fig. 5. The
(Sparus auratus), turbot (Psetta maxima) and spotted dog-          values of AEw were selected to approximate the experiment
fish (Scyliorhinus canicula) was studied. Immature S. aura-        for small prey fish (Mathews et al., 2008). They differ for
tus (wet weight 0.012 kg), P. maxima (wet weight 0.027 kg)         different metals. For 134 Cs, the value of AEw was 0.001,
and S. canicula (wet weight 0.008 kg) were fed radiolabelled       whereas for 57 Co and 60 Co, 54 Mn, and 65 Zn, these values
prey fish (juvenile S. auratus). After this feeding, fish were     were 0.0025, 0.0045, 0.0065, respectively. This contrasted
fed unlabelled prey fish for 3 weeks. In Fig. 4, the solutions     with AEf , which is larger for 134 Cs than for 57 Co, 60 Co,
Eqs. (28)–(29) were compared with the laboratory experi-           54 Mn, and 65 Zn (Pouil et al., 2017). The estimated values

ments in which prey fish were labelled by 134 Cs, 57 Co, 54 Mn     of AEw are presented in Table 2. The above-mentioned val-
and 65 Zn. The analytical solutions (Eqs. 28–29) and experi-       ues of AEw were used to calculate BCF for larger predator
ment agreed, demonstrating general dependence of the depu-         fish in experiments by Jeffree et al. (2006). As seen in Fig. 5,
ration process on fish mass. Differences between experimen-        values of AEw for considered elements are of the order 10−3 ,
tal data for different species may be due to differences in        which is in agreement with most models. However, compar-
anatomy and physiology, as discussed by Jeffree et al. (2006)      ison with larger fish highlighted some differences between
for P. maxima and S. canicula. The model, unlike the situa-        species of fish, as discussed by Jeffree et al. (2006), and dif-
tion for prey fish (Fig. 3), underestimates the total concen-      ferences between model and experiment for a constant value
trations of 57 Co and 54 Mn in comparison with experiments,        of AEw . At the same time, it is known that dietary intake

Biogeosciences, 18, 2591–2607, 2021                                                   https://doi.org/10.5194/bg-18-2591-2021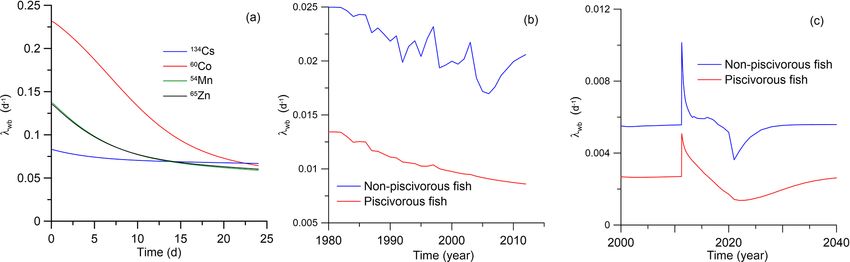
R. Bezhenar et al.: Multi-compartment kinetic–allometric model                                                                         2597

Figure 3. Retention of radionuclides in whole body and tissues of juvenile sea bream (Sparus auratus). The simulations are compared with
whole-body measurements by Mathews and Fisher (2008).

Figure 4. Retention of radionuclides in whole bodies of predator fish: sea bream (Sparus auratus), turbot (Psetta maxima) and spotted dogfish
(Scyliorhinus canicula). The simulations are compared with whole-body measurements by Mathews et al. (2008).

of metals dominates over water intake (Mathews and Fisher,               equilibrium conditions. An average value of gill BCF1 is ap-
2009). Therefore, deviations in values of AEw would not be               proximately 10 L kg−1 for 58 Co, 54 Mn, 134 Cs and 65 Zn (Jef-
significantly affected by the full uptake of elements from the           feries and Heweit,1971; Pentreath, 1973). Then for AEw =
marine environment.                                                      0.001, we obtained α1 = 800. With the selected value of α1 ,
   The parameter α1 can be estimated from the relations                  the process of adaptation of the gill tissue to changes in the
Eqs. (13) and (16) according to the experimental data for                concentration of radioactivity in water is much faster than for

https://doi.org/10.5194/bg-18-2591-2021                                                           Biogeosciences, 18, 2591–2607, 2021
2598                                                            R. Bezhenar et al.: Multi-compartment kinetic–allometric model

Figure 5. Simulated BCF in marine fish during the period of exposition in water. The simulations are compared with isotope measurements
by Mathews et al. (2008) in juvenile sea bream (Sparus auratus) and measurements by Jeffree et al. (2006) in turbot (Psetta maxima) and
spotted dogfish (Scyliorhinus canicula).

other tissues of the fish. In addition, as follows from the ana-       dionuclides; (iv) a lack of experimental data about AEw ; and
lytical solutions (Eqs. 30–31) at λ1  λi , the contribution of        (v) limited experimental data for whole-body to tissue con-
gill contamination to the whole-body contamination is small.           centration ratios, CRi , in the marine fish. Therefore, a sen-
                                                                       sitivity analysis is necessary to estimate uncertainty of the
3.3    Simplification of the model based on the results of             simulation results. We estimated the effects of variations in
       analytical solutions and laboratory experiments                 above parameters in the Eq. (24) on the value of BAF in equi-
                                                                       librium state. The simple local sensitivity analysis and the
Comparison of the model against laboratory experiments on              one-at-a-time method (Pianosi et al., 2016) were used. The
the retention of absorbed elements in fish after single feed-          sensitivity of model output was estimated using a sensitivity
ing demonstrated the need to include the kinetic character-            index (SI) calculated following Hamby (1994) as
istics of the digestive tract in the model when highly non-
equilibrium transfer dynamics are expected. However, for                      Dmax − Dmin
                                                                       SI =               ,                                       (33)
modelling of food uptake in marine environment with multi-                       Dmax
ple feedings the simple equilibrium assumption Eq. (14) can
                                                                       where Dmax and Dmin are the outputs corresponded to maxi-
be used. At the same time, the analytical solution describ-
                                                                       mal and minimal input parameter values, respectively. Simi-
ing the bioconcentration due to the uptake and absorption of
                                                                       larly to Bezhenar et al. (2016), the range for every parameter
elements from water in fish, as well as the results of the lab-
                                                                       was defined as follows: minimum value was set to half the
oratory experiment, shows that the contribution to the gills
                                                                       reference value and maximum value was set to twice the ref-
(Eq. 13) is negligible. Therefore, for modelling of uptake
                                                                       erence value. Calculated SI for three radionuclides, which are
from water, the equilibrium assumption can also be used as it
                                                                       preferably accumulated in different tissues (137 Cs, 90 Sr and
is shown above. The corresponding simplified equations for             60 Co), are given in Fig. S1.
muscle, bone and organs can be rewritten as
                                                                          The results of the sensitivity study suggest that model re-
  dCi                                                                  sults are most sensitive to variations of AEf and αf for 137 Cs
µi     = AEfi Kf Cf + AEwi Kw Cw − λi µi Ci                            and 60 Co, whereas for 60 Co they are almost not sensitive to
   dt
− λg µi Ci .                                                   (32)    variations of AEw and αw . Note that model results are also
                                                                       sensitive to the variations of parameters related to tissues
The uncertainty in calculations using Eq. (32) arises due to           where the radionuclide is mainly accumulated: α3 and CR3
(i) limited experimental data to define allometry constants            for 137 Cs and α5 and CR5 for 60 Co. For 90 Sr, the model re-
αf , αw , α3 , α4 , α5 ; (ii) large intervals in the values of known   sults are moderately sensitive to the variations of most above-
AEf coefficients; (iii) unknown AEf values for many ra-                considered parameters.

Biogeosciences, 18, 2591–2607, 2021                                                      https://doi.org/10.5194/bg-18-2591-2021
R. Bezhenar et al.: Multi-compartment kinetic–allometric model 2599
4 Model applications 4.2 Release of radionuclides during normal operation
of the Forsmark Nuclear Power Plant
4.1 Modified POSEIDON-R box model
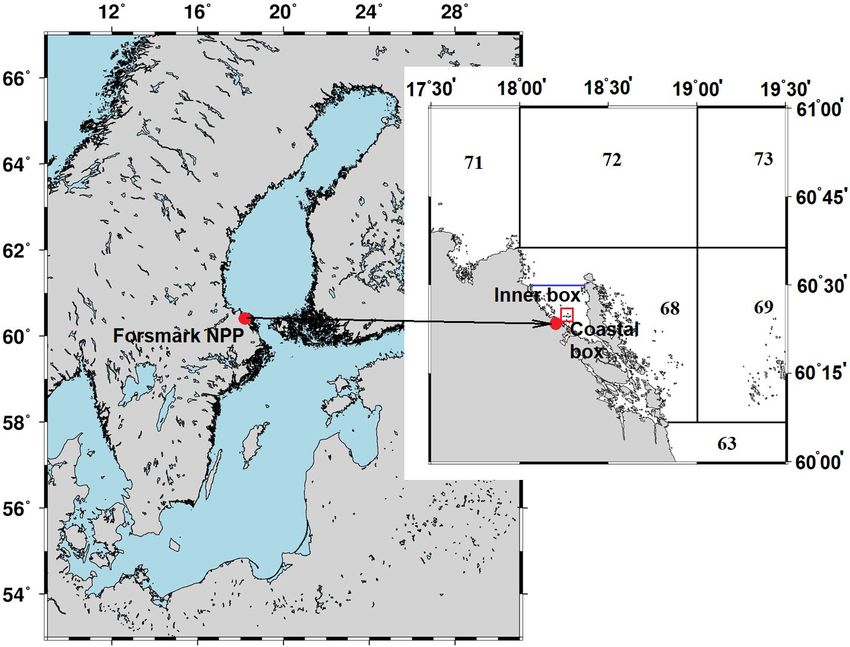
This section presents the simulation results of 60 Co and
In order to predict the accumulation of radionuclides in fish 54 Mn routine release into the marine environment from Fors-
in the marine environment using the MCKA model described mark NPP, located on the Baltic Sea coast of Sweden.
above, it is necessary to calculate changes in concentration The POSEIDON-R model with embedded food web MCKA
in water and in bottom sediments and to calculate the trans- model, one-compartment fish model and bioaccumulation
port of radionuclides through food chains. The POSEIDON- factor (equilibrium) model was customized for the Baltic
R box model (Lepicard et al., 2004; Maderich et al., 2014a, b; Sea, as described by Bezhenar et al. (2016) and Maderich
2018b; Bezhenar et al., 2016) can be used to simulate the et al. (2018a). The nested boxes (inner and coastal boxes)
marine environment as a system of 3D boxes for the water inside the regional box no. 68 in the Baltic Sea box sys-
column, bottom sediment and food web. The water column tem were added to resolve the radionuclide concentration in
box is vertically subdivided into layers. The suspended mat- the near field (Fig. 6). Parameters of the inner and coastal
ter settles in the water column. The bottom sediment box boxes are based on data from Aquilonius (2010). The main
is divided into three layers (Fig. S2). The downward burial parameters of boxes when zooming in to the NPP are pre-
processes operate in all three sediment layers. Maderich et sented in Table S10 in the Supplement. The simulation re-
al. (2018b) described the POSEIDON-R model in detail. sults for 60 Co and 54 Mn were compared with measurements
A food web model that includes pelagic and benthic food for the smallest coastal box, where measurement data for bot-
chains is implemented within the POSEIDON-R box model tom sediments and fish were available (Forsmark, 2014). The
(Bezhenar et al., 2016). In the food web model, marine or- measurement data were compared with simulations for two
ganisms are grouped into classes according to trophic level species of fish: herring (Clupea harengus membras) as a non-
and species type (Fig. S3). The food chains differ between piscivorous fish and pike (Esox lucius) as a coastal preda-
the pelagic zone and the benthic zone. Pelagic organisms tor. There is no information on the mass of fish caught in
comprise primary producers (phytoplankton) and consumers the vicinity of Forsmark NPP. Therefore, we used estimates
(zooplankton, non-piscivorous (forage) fish and piscivorous of the masses typical for prey and predatory fish, which are
fish). In the benthic food chain, radionuclides are transferred given in Table S11. In the one-compartment model, two pa-
from algae and contaminated bottom sediments to deposit- rameters must be prescribed: assimilation efficiency and bio-
feeding invertebrates, demersal fish and benthic predators. logical half-life T0.5 = ln(2)λ−1
wb . Assimilation efficiency (see
Bottom sediments include both organic and inorganic com- Table 2) was obtained from Pouil et al. (2018). Baudin et
ponents. Radioactivity is assumed to be assimilated by ben- al. (1997) used T0.5 = 21 d for 60 Co in the one-compartment
thic organisms from the organic components of the bottom model. The average value for T0.5 in predatory marine fish
deposits. Other food web components are crustaceans (detri- is 40 d (Beresford et al., 2015). Therefore, for 60 Co, we used
tus feeders), molluscs (filter feeders) and coastal predators, T0.5 = 20 d for prey fish and T0.5 = 40 d for predatory fish.
which feed throughout the water column in shallow coastal There are very limited data for T0.5 values in marine fish for
waters. All organisms take in radionuclides both via the food 54 Mn. According to Beresford et al. (2015), T
0.5 is in the
web and directly from the water. Table S9 in the Supple- range between 20 and 40 d. Therefore, we used the same val-
ment contains food preferences for organisms in the food ues of T0.5 for 54 Mn, as for 60 Co. According to Jeffree et
web which are used in the model. Details of the transfer of al. (2017), the uptake and depuration kinetics of 60 Co and
radiocaesium through the marine food web are presented by 54 Mn for fish species in marine, brackish and freshwater en-
Bezhenar et al. (2016) and Maderich et al. (2018b). vironments are very similar. Therefore, we can apply the
The POSEIDON-R model can handle different types of model parameters defined for marine environment (see Ta-
radioactive releases: including atmospheric fallout and point ble S11) to reconstruct the herring and pike contamination
sources associated with routine releases from nuclear facil- by the above-mentioned radionuclides in the area near the
ities located directly on the coast or point sources associ- Forsmark NPP with low salinity (3–5 PSU, denoting practi-
ated with accidental releases (Lepicard et al., 2004). For cal salinity unit).
coastal discharges occurring in the large (“regional”) boxes, The release rates of 60 Co from the Forsmark NPP (Fors-
“coastal” release boxes are nested into the regional box sys- mark, 2014) are plotted in Fig. 7.
tem. The intermediary boxes between coastal and regional As seen in Fig. 8a, the results of simulation for the concen-
boxes are called “inner” boxes. tration of 60 Co in the bottom sediments are in good agree-
ment with the measurements (Forsmark, 2014) in the coastal
box for the wide range of employed values of sediment distri-
bution coefficient Kd : from Kd = 3×10⁵ ÷2×10⁶ L kg−1 for
margin seas to Kd = 5 × 10⁷ L kg−1 for open ocean (IAEA,
2004). The benthic food web (Bezhenar et al., 2016a), which
https://doi.org/10.5194/bg-18-2591-2021 Biogeosciences, 18, 2591–2607, 20212600 R. Bezhenar et al.: Multi-compartment kinetic–allometric model
Figure 6. Box system around the Forsmark NPP. The numbers denote regional boxes in the box system of the Baltic Sea (Bezhenar et al.,
2016). An additional “Inner box” is separated from regional box 68 by the blue line. The coastal box (red rectangle) surrounds the area where
cooling water from NPP is discharged.
(IAEA, 2004). Whereas one-compartment and equilibrium
models underestimated the concentration of 60 Co in fish,
the MCKA model using generic parameters yields better
agreement with measurements for both non-piscivorous fish
(Fig. 8b) and coastal predator feeding by pelagic and benthic
organisms in the coastal area (Fig. 8c).
Similarly, the behaviour of 54 Mn in the marine environ-
ment near the Forsmark NPP is modelled. The release rate of
54 Mn from the NPP is also plotted in Fig. 7 using data from
Forsmark (2014). Comparison of the simulated concentra-
tion of 54 Mn in bottom sediments with measurements (Fors-
mark, 2014) for the Forsmark coastal box is given in Fig. 8d.
Good agreement was obtained when a standard value of
Kd = 2 × 10⁶ L kg−1 for 54 Mn in margin seas (IAEA, 2004)
was used. This means that, as in the case of 60 Co, a signifi-
cant fraction of radionuclide is deposited at the bottom, and
the benthic food web should be considered. Similarly to the
60 Co case, obtained results of simulation are also compared
Figure 7. Release rates of 60 Co and 54 Mn according to measure-
ments (Forsmark, 2014). with results obtained using the one-compartment model and
equilibrium approach. Again, the MCKA model yields the
best agreement with measurements for both non-piscivorous
fish (Fig. 8e) and coastal predators (Fig. 8f); however, this
describes the transfer of radioactivity from bottom sediments agreement is slightly worse than in the 60 Co case. Notice that
to deposit-feeding invertebrates and finally to fish, is quite the BAF in the equilibrium approach can be locally estimated
important in this range of Kd values. The results from the using a posteriori data. However, the MCKA model provided
POSEIDON-R calculations obtained with the MCKA model good agreement with measurements using only a priori infor-
are compared (Fig. 8b, c) with measurements and results mation, which is important in the case of accidents, as con-
of calculations obtained with a one-compartment model and sidered in the next section.
with an equilibrium approach using a standard BAF value
Biogeosciences, 18, 2591–2607, 2021 https://doi.org/10.5194/bg-18-2591-2021R. Bezhenar et al.: Multi-compartment kinetic–allometric model 2601
Figure 8. Comparison between calculated and measured 60 Co (Forsmark, 2014) concentrations in bottom sediment (a), non-piscivorous fish
(herring) (b) and coastal predator fish (pike) (c) and 54 Mn concentrations in bottom sediment (d), non-piscivorous fish (herring) (e) and
coastal predator fish (pike) (f) for the coastal box.
4.3 Accumulation of 90 Sr in the fish after the 90 Sr measurements conducted in this specific area. Details of
Fukushima Dai-ichi accident customization are given in Maderich et al. (2014a, b; 2018a).
The historical contamination due to global atmospheric
deposition in the period from 1945–2010 was simulated ac-
cording to Maderich et al. (2014b) with data from the Marine
Following caesium, 90 Sr is the second most important radi-
Radioactivity Information System database (MARIS, 2020).
ologically long-lived radionuclide released as a result of the
The value of the accidental release was estimated as 160 TBq
FDNPP accident. It is highly soluble in water and exhibits a
(16 TBq d−1 during 10 d) that was consistent with the range
relatively high ability for assimilation by marine organisms
reported by Buesseler et al. (2017). In the post-accidental
due to similar chemical properties with calcium. The atmo-
period, the continuous leakage of 90 Sr due to groundwater
spheric deposition of 90 Sr is usually not taken into account
transport of radioactivity from the NPP site was monitored
due to its low volatility. Most of the 90 Sr released from the
(Castrillejo et al., 2016). Therefore, in the simulation the con-
FDNPP was directly released to the ocean, with estimates of
servative scenario was used for release of 90 Sr in the post-
total inventory in the range from 0.04 to 1.0 PBq (Buesseler
accidental period (Fig. 9); the release of 90 Sr was assumed
et al., 2017). Here, we extended the simulation by Maderich
equal to 137 Cs release (Maderich et al. (2018a).
et al. (2014b) of transfer and fate of 90 Sr resulting from the
Comparison between calculated and measured 90 Sr con-
FDNPP accident using the POSEIDON-R model comple-
centrations in water, bottom sediment and piscivorous fish
mented by the food web model (Bezhenar et al., 2016) and
for the coastal box and box no. 173 are shown in Fig. 10.
MCKA fish model.
Measured concentrations of 90 Sr in the water and bottom sed-
The POSEIDON-R model was customized for the north-
iments before the accident were obtained from the MEXT
western Pacific and adjacent seas (the East China Sea, the
database (MEXT, 2020). Concentrations of 90 Sr after the ac-
Yellow Sea, and the East Sea or Sea of Japan) as in (Maderich
cident at TEPCO (Tokyo Electric Power Company) sampling
et al., 2018a). A total of 188 boxes covered this region. The
points near the discharging canals (T-1 and T-2) and at dif-
boxes around the FDNPP are shown in Fig. 9 with an ad-
ferent distances offshore (TD-5 inside the coastal box area
ditional 4 km × 4 km coastal box in the vicinity of FDNPP.
and T-7, TD-1 and TD-9 for outer box no. 173) are available
The coastal box was included for the model validation with
https://doi.org/10.5194/bg-18-2591-2021 Biogeosciences, 18, 2591–2607, 20212602 R. Bezhenar et al.: Multi-compartment kinetic–allometric model
Figure 9. (a) Boxes along the eastern coast of Japan with fine resolution in the area around the FDNPP (Maderich et al., 2018a). Deep boxes
with three vertical layers in the water column are coloured by blue, boxes with two vertical layers are marked by vertical stripes, and shallow
one-layer boxes are white. (b) Release rates of 90 Sr in the accidental (bold line) and post-accidental (dashed line) periods.
in the NRA (Japan Nuclear Regulation Authority) database the target tissue (TT) approach underestimates the concen-
(NRA, 2020). The results of simulation show that the concen- tration of 90 Sr in the fish.
tration of 90 Sr in the seawater reaches the maximum just after Comparison of the Eqs. (1)–(3) and (7) of the MCKA
the accidental release (Fig. 10a, d). Notice that the box model model and Eq. (11) of the standard whole-body model
gives the average concentrations for each box, which means demonstrates that the main difference is found in the descrip-
that local concentrations may be larger or smaller than the av- tion of the whole-body elimination rate λwb . Whereas in the
erage (Fig. 10). Especially large differences can occur during whole-body model the value of λwb is constant, in the MCKA
the accidental release under strongly non-equilibrium con- model it is the ratio of activity-weighted tissue elimination
ditions. Further large dispersion of measured concentrations rates to whole-body activity:
shows that non-equilibrium conditions remained for a long P5
time in the area close to NPP (Fig. 10a). The agreement be- i=3 µi λi Ci
λwb = . (34)
tween calculated and measured concentrations (Fig. 10a, d) Cwb
could be a confirmation of the correctness of estimation of
the source term. This is also confirmed by agreement of mea- Therefore, in the MCKA model, the value of λwb can vary
sured and simulated concentrations of 90 Sr in the bottom sed- over time, depending on the uptake of radionuclide and the
iment (Fig. 10b, e). Notice that there is no measurement data tissue elimination rates. The time variation of λwb com-
for bottom sediment in box no. 173 (Fig. 10e). puted from Eq. (34) is shown in Fig. 11 for three differ-
The calculated concentration of 90 Sr in piscivorous fish ent cases: (a) pulse-like feeding experiment (Mathews and
was compared with measurement data for fat greenling (Hex- Fisher, 2008), (b) release of 60 Co during normal operation of
agrammos otakii) before the accident (JCAC, 2020) and with the Forsmark NPP and (c) accumulation of 90 Sr in the fish
data from NRA (2020) and Miki at al. (2017) after the ac- due to the FDNPP accident. As seen in the plots, λwb varies
cident. The NRA data for 90 Sr are very limited. Therefore, considerably when there is non-equilibrium, such as in the
different species of piscivorous fish were considered, such case of a pulse-like feeding or an accident. Even in case of
as sharks (Triakis scyllium, Squatina japonica), rockfish (Se- a routine release, λwb follows any changes in the release rate
bastes cheni) and sea bass (Lateolabrax japonicus). Param- (Fig. 11b).
eters of the MCKA model for these fishes are given in Ta- In case of the FDNPP accident, the calculated λwb shows
ble S11. The simulation results with the MCKA model agree some tendency towards an equilibrium value, but after a
well with the experimental observations (Fig. 10c, f), while pulse-like release of 90 Sr in 2011, λwb doubled following the
release of activity and then slowly converged to the quasi-
Biogeosciences, 18, 2591–2607, 2021 https://doi.org/10.5194/bg-18-2591-2021R. Bezhenar et al.: Multi-compartment kinetic–allometric model 2603
Figure 10. Comparison between calculated and measured 90 Sr concentrations in water (a), bottom sediment (b) and piscivorous fish (c) for
the coastal box and in water (d), bottom sediment (e) and piscivorous fish (f) for box no. 173.
Figure 11. The calculated λwb for three scenarios: (a) the pulse-like feeding experiment (Mathews, Fisher (2008), (b) the release of 60 Co
during normal operation of the Forsmark NPP and (c) the accumulation of 90 Sr in the fish due to the FDNPP accident.
equilibrium state governed by the global deposition. Notice time, the concentration of 90 Sr in fish tends to equilibrium
that in this case we extended the simulation period to 2040 faster than the MCKA model predicts, which is explained by
by extrapolating deposition data and FDNPP release data in the time-dependent behaviour of λwb in the MCKA model.
Fig. 9b. Therefore, the whole-body model with a constant These results suggest also that the MCKA model could be
λwb , which is calibrated using observational data, cannot cor- effectively used to find equivalent parameters for the one-
rectly describe such transient processes in the organism. This compartment model as was done here.
is confirmed in Fig. 10 by comparing the results from the
MCKA model and the one-compartment model. Here the
AE value in both models are the same, whereas the equilib- 5 Conclusions
rium value λwb was calculated in the MCKA model using the
A new approach to predicting the accumulation of radionu-
value before 2011 for piscivorous fish (λwb = 0.0027 d−1 ).
clides in fish by taking into account heterogeneity of distri-
The one-compartment model simulation results using param-
bution of contamination in the organism and dependence of
eters from the MCKA model are close to the MCKA model
metabolic process rates on the fish mass was developed. The
results at the initial stage of accidental release. However, over
fish organism was represented by compartments for three
https://doi.org/10.5194/bg-18-2591-2021 Biogeosciences, 18, 2591–2607, 20212604 R. Bezhenar et al.: Multi-compartment kinetic–allometric model
groups of tissues or organs (muscle, bone, organs) and two defined generic parameters could be used in different marine
input compartments representing gills and the digestive tract. environments without calibration based on a posteriori infor-
The absorbed elements are redistributed between organs or mation, which is important for emergency decision support
tissues and then eliminated according to their metabolic func- systems (Periáñez et al., 2019).
tion. The food and water uptake rates, elimination rate, and
growth rate depend on the metabolic rate, which is scaled by
the fish mass to the 3/4 power, but they do not depend on the Code availability. POSEIDON-R code is a part of the decision sup-
radionuclide. At the same time, the activity is distributed be- port system JRODOS for off-site emergency management after nu-
tween the different tissues and organs according to the tissue clear accidents. https://resy5.iket.kit.edu/JRODOS/index.html
assimilation efficiencies, which differ per radionuclide (Ta-
ble 2), but do not depend on fish mass. Therefore, the trans-
fer rates can be associated with a specific radionuclide and Data availability. Data used in the study are freely available in
MARIS, JCAC, MEXT and NRA databases, and in several publi-
fish mass as shown, for example, in Tables S2–S4 and S6–
cations.
S8. The position of the fish species in the trophic level also
affects the concentration of activity in the organism.
This model is of intermediate complexity and provides an
Supplement. The supplement related to this article is available on-
alternative for the basic/simplistic whole-body models and line at: https://doi.org/10.5194/bg-18-2591-2021-supplement.
the highly advanced PBPK models. The main difference be-
tween the MCKA and whole-body models was found in the
description of the whole-body elimination rate λwb . Whereas Author contributions. RB, VM and KOK conducted the literature
in the whole-body model the value of λwb is constant, in review and designed the study. RB, VM and KTJ developed the
the MCKA model it is the ratio of activity-weighted tis- model and performed modelling of laboratory experiments. GdW
sue elimination rates to whole-body activity as described by and KOK collected data for case studies. RB, VM and KOK per-
Eq. (34). The elimination rate λwb varies considerably in formed the simulations for case studies. RB, VM, KTJ and GdW
non-equilibrium state of fish, such as in the case of a pulse- analysed results of simulations and wrote the initial article. All au-
like feeding or an accident. thors edited and approved the final article text.
The trophic transfer factors (TTF) were calculated for five
elements using assimilation efficiencies AEf obtained from
laboratory data. Among considered elements, only the cae- Competing interests. The authors declare that they have no conflict
of interest.
sium (Cs) level may elevate in the predator fish of the food
chain (TTF > 1). This is in agreement with measurements.
The concentrations of other elements (Sr, Co, Mn, Zn) de-
Acknowledgements. Authors are grateful to three anonymous re-
crease with the increase of trophic level (TTF < 1). The ki-
viewers for useful suggestions that helped to improve the article.
netics of the assimilation and elimination of 134 Cs, 57 Co,
60 Co, 54 Mn and 65 Zn, which are preferably accumulated in
different tissues, were analysed using the analytical solu- Financial support. This research has been supported by the Korea
tions of a system of model equations. These solutions exhib- Institute of Ocean Science and Technology (grant no. PE99912),
ited good agreement with the laboratory experiments for the the National Research Foundation of Ukraine (Ukraine) (grant nos.
depuration process after single feeding of fish with radiola- 2020.02/0048 and 2020.01/0421) and the International Atomic En-
belled prey and with respect to uptake of activity from water. ergy Agency (grant no. CRP K41017).
Notice that for relatively slow processes in the marine en-
vironment, transfer processes in the gills and digestive tract
can be close to equilibrium, which allows for consideration Review statement. This paper was edited by Kenneth Rose and re-
of only a three-compartment (muscle, bone, organs) version viewed by three anonymous referees.
of the model.
The developed MCKA model was embedded into the box
model POSEIDON-R, which describes the transfer of ra-
dionuclides through the pelagic and benthic food webs. The References
POSEIDON-R model was applied for the simulation of the
Alava, J. and Gobas, F.: Modeling 137 Cs bioaccumulation in the
transport and fate of 60 Co and 54 Mn routinely released from
salmon-resident killer whale food web of the Northeastern Pa-
Forsmark NPP located on the Baltic Sea coast of Sweden cific following the Fukushima Nuclear Accident, Sci. Tot. Envi-
and for calculation of 90 Sr concentration in fish after the ac- ron., 544, 56–67, 2016.
cident at Fukushima Dai-ichi NPP. Predicted concentrations Andersen, N. G.: Depletion rates of gastrointestinal content in com-
of radionuclides in fish agreed well with the measurements in mon goby (Pomatoschistus microps (Kr.)). Effects of temperature
both case studies. It is shown that the MCKA model with the and fish size, Dana, 3, 31–42, 1984.
Biogeosciences, 18, 2591–2607, 2021 https://doi.org/10.5194/bg-18-2591-2021R. Bezhenar et al.: Multi-compartment kinetic–allometric model 2605
Aquilonius, K.: The marine ecosystems at Forsmark and Laxemar- Oncorhynchus mykiss W.), J. Environ. Radioactiv., 49, 35–53,
Simpevarp. SR-Site Biosphere, Sweden, SKB, 495. pp., 2010. 2006.
Barron, M. G., Stehly, G. R., and Hayton, W. L.: Pharmacokinetic Goldstein, R. A. and Elwood, J. W.: A Two-compartment, three-
modeling in aquatic animals. Models and concepts, Aquat. Toxi- parameter model for the absorption and retention of ingested el-
col., 17, 187–212, 1990. ements by animals, Ecology, 52, 935–939, 1971.
Baudin, J. P., Veran, M. P., Adam, C., and Garnier-Laplace, J.: Grech, A., Tebb, C., Brochot, C., Bois, F. Y., Bado-Nilles,
Co-60 transfer from water to the rainbow trout (Oncorhynchus A., Dorne, J. L., Quignot, N., and Beaudouin, R.: Generic
mykiss Walbaum), Archives of Environmental Contamination physiologically-based toxicokinetic modelling for fish: Integra-
and Toxicology, 33, 230–237, 1997. tion of environmental factors and species variability, Sci. Tot.
Belharet, M., Charmasson, S., Tsumune, D., Arnaud, M., and Environ., 651, 516–531, 2019.
Estournel, C.: Numerical modeling of 137 Cs content in the Hamby, D. M.: A review of techniques for parameter sensitivity
pelagic species of the Japanese Pacific coast following the analysis of environmental models, Environ. Monit. Assess., 32,
Fukushima Dai-ichi Nuclear Power Plant accident using a 135–154, 1994.
size structured food-web model, PLoS ONE, 14, e0212616, Higley, K. A. and Bytwerk, D. P.: Generic approaches to transfer, J.
https://doi.org/10.1371/journal.pone.0212616, 2019. Environ. Radioactiv., 98, 4–23, 2007.
Beresford, N. A., Beaugelin-Seiller, K., Burgos, J., Cujic, M., Fes- Heling, R., Koziy, L., and Bulgakov, V.: On the dynamical uptake
enko, S., Kryshev, A., Pachal, N., Real, A., Su, B. S., Tagami, K., model developed for the uptake of radionuclides in marine or-
Vives i Batlle, J., Vives-Lynch, S., Wells, C., and Wood, M. D.: ganisms for the POSEIDON-R model system, Radioprotection
Radionuclide biological half-life values for terrestrial and aquatic 37, 833–838, 2002.
wildlife, J. Environ. Rad., 150, 270–276, 2015. Heling, R. and Bezhenar, R.: Modification of the dynamic radionu-
Beresford, N.A.,Wood, M.D., Vives i Batlle, J., Yankovich, T.L., clide uptake model BURN by salinity driven transfer parameters
Bradshaw, C., and Willey, N.: Making the most of what we for the marine food web and its integration in POSEIDON-R.,
have: application of extrapolation approaches in radioecological Radioprotection, 44, 741–746, 2009.
wildlife transfer models, J. Environ. Rad., 151, 373-386, 2016. IAEA (International Atomic Energy Agency): Sediment distribu-
Bezhenar, R., Jung, K. T., Maderich, V., Willemsen, S., de With, G., tion coefficients and concentration factors for biota in the marine
and Qiao, F.: Transfer of radiocaesium from contaminated bot- environment, Technical Report Series No 422, IAEA, Vienna,
tom sediments to marine organisms through benthic food chains Austria, 95 pp., 2004.
in post-Fukushima and post-Chernobyl periods, Biogeosciences, Ishikawa, Y., Yamada, K., Nonaka, N., Marumo, K., and Ueda,
13, 3021–3034, https://doi.org/10.5194/bg-13-3021-2016, 2016. T.: Size-dependent concentrations of radiocesium and stable el-
Buesseler, K., Dai, M., Aoyama, M., Benitez-Nelson, C., Char- ements in muscles of flathead flounder Hippoglossoides dubius,
masson, S., Higley, K., Maderich, V., Masque, P., Morris, P. J., Fish Sci (Tokyo), 61, 981–985, 1995.
Oughton, D., and Smith, J. N.: Fukushima Daiichi-derived ra- Jefferies, D. F. and Heweit, C. J.: The accumulation and excretion
dionuclides in the Ocean: transport, fate, and impacts, Annu. Rev. of radioactive caesium by the plaice and thornback ray, J. Mar.
Mar. Sci., 9, 173–203, https://doi.org/10.1146/annurev-marine- Biol. Ass. UK, 51, 411–422, 1971.
010816-060733, 2017. Jeffree, R. A., Warnau, M., Teyssie, J.-L., and Markich, S. J.: Com-
Cardwell, R. D., DeForest, D. K., Brix, K. V., and Adams, W. J.: parison of the bioaccumulation from seawater and depuration of
Do Cd, Cu, Ni, Pb and Zn biomagnify in aquatic ecosystems? heavy metals and radionuclides in the spotted dogfish Scyliorhi-
Reviews of Environmental Contamination and Toxicology, 226, nus canicula (Chondrichthys) and the turbot Psetta maxima
101–122, 2004. (Actinopterygii: Teleostei), Sci. Total Environ., 368, 839–852,
Carvalho, F. P.: Radionuclide concentration processes in marine or- 2006.
ganisms: A comprehensive review, J. Environ. Radioactiv., 186, Jeffree, R. A., Markich, S., Oberhansli, F., and Teyssie, J. L.: Ra-
124–130, 2018. dionuclide biokinetics in the Russian sturgeon and phylogenetic
Castrillejo, M., Casacuberta, N., Breier, C. F., Pike, S. M., Masque, consistencies with cartilaginous and bony marine fishes, J. Envi-
P., and Buesseler, K. O.: Reassessment of 90 Sr, 137 Cs and 134 Cs ron. Radioactiv., 202, 25–31, 2017.
in the coast off Japan derived from the Fukushima Dai-ichi Nu- JCAC (Japan Chemical Analysis Center): Environmental Radioac-
clear Accident, Environ. Sci. Tech., 50, 173–180, 2016. tivity Database, available at: https://www.jcac.or.jp/, last access:
Coughtrey, P. J. and Thorne, M. C.: Radionuclide distribution and 26 October 2020.
transport in terrestrial and aquatic ecosystems: A critical review Kim, S. H., Lee, H., Lee, S. H., and Kim, I.: Distribution and ac-
of data, Vol 2, edited by: Balkema A. A., Rotterdam, 500 pp., cumulation of artificial radionuclides in marine products around
1983. Korean Peninsula, Mar. Pollut. Bull., 146, 521–531, 2019.
Forsmark: Forsmark omgivningsdata utdrag ur databas Kasamatsu, F. and Ishikawa, Y.: Natural variation of radionuclide
20140113.xlsx, Forsmark, Sweden, 2014. 137 Cs concentration in marine organisms with special reference
Fowler, S. W. and Fisher, N. S.: Radionuclides in the biosphere, Ch. to the effect of food habits and trophic level, Mar. Ecol. Prog.
6. in: Marine Radioactivity, Radioactivity in environment, edited Ser., 160, 109–120, 1997.
by: Livingston, H. D., v.6. Elsevier, 167–203, 2004. Lepicard, S., Heling, R., and Maderich, V.: POSEIDON-R/RODOS
Garnier-Laplace, J., Adam, C., Lathuilliere, T., Baudin, J., and models for radiological assessment of marine environment af-
Clabaut, M.: A simple fish physiological model for radioecol- ter accidental releases: application to coastal areas of the Baltic,
ogists exemplified for 54 Mn direct transfer and rainbow trout ( Black and North Seas, J. Environ. Radioactiv., 72, 153–161,
2004.
https://doi.org/10.5194/bg-18-2591-2021 Biogeosciences, 18, 2591–2607, 2021You can also read