18S rRNA gene sequences of leptocephalus gut contents, particulate organic matter, and biological oceanographic conditions in the western North ...
←
→
Page content transcription
If your browser does not render page correctly, please read the page content below
www.nature.com/scientificreports
OPEN 18S rRNA gene sequences
of leptocephalus gut contents,
particulate organic matter,
and biological oceanographic
conditions in the western North
Pacific
Tsuyoshi Watanabe1,8*, Satoshi Nagai2, Yoko Kawakami3, Taiga Asakura4, Jun Kikuchi4,
Nobuharu Inaba5, Yukiko Taniuchi6, Hiroaki Kurogi2, Seinen Chow2, Tsutomu Tomoda7,
Daisuke Ambe2 & Daisuke Hasegawa1
Eel larvae apparently feed on marine snow, but many aspects of their feeding ecology remain
unknown. The eukaryotic 18S rRNA gene sequence compositions in the gut contents of four taxa of
anguilliform eel larvae were compared with the sequence compositions of vertically sampled seawater
particulate organic matter (POM) in the oligotrophic western North Pacific Ocean. Both gut contents
and POM were mainly composed of dinoflagellates as well as other phytoplankton (cryptophytes
and diatoms) and zooplankton (ciliophoran and copepod) sequences. Gut contents also contained
cryptophyte and ciliophoran genera and a few other taxa. Dinoflagellates (family Gymnodiniaceae)
may be an important food source and these phytoplankton were predominant in gut contents and
POM as evidenced by DNA analysis and phytoplankton cell counting. The compositions of the gut
contents were not specific to the species of eel larvae or the different sampling areas, and they were
most similar to POM at the chlorophyll maximum in the upper part of the thermocline (mean depth:
112 m). Our results are consistent with eel larvae feeding on marine snow at a low trophic level, and
feeding may frequently occur in the chlorophyll maximum in the western North Pacific.
The Japanese eel, Anguilla japonica, is a catadromous fish species with a spawning area at the West Mariana Ridge
in the western North Pacific1–4. The eel larvae exhibit a peculiar transparent leaf-like body form and are called
leptocephali5. Leptocephali drift from their spawning area via the North Equatorial Current, inhabit the Kuroshio
to a period of 4–6 months, and are transported to the coast of Northeast Asia6. Japanese eels are an economi-
cally important aquaculture species in East Asia. However, since the 1970s, its population has demonstrated a
dramatic decline due to reasons such as o verfishing7,8, and the species is currently listed as critically endangered
by the International Union for the Conservation of N ature9. As of 2010, the annual recruitment had decreased
by as much as 90% compared with eel catches in the 1 960s9.
1
Tohoku National Fisheries Research Institute, Japan Fisheries Research and Education Agency, 3‑27‑5
Shinhama‑cho, Shiogama, Miyagi 985‑0001, Japan. 2National Research Institute of Fisheries Science, Japan
Fisheries Research and Education Agency, 2‑12‑4 Fukuura, Kanazawa‑ku, Kanagawa 236‑8648, Japan. 3AXIOHELIX
Co. Ltd, 1‑12‑17 Izumi‑cho, Kanda, Chiyoda‑ku, Tokyo 101‑0024, Japan. 4RIKEN Center for Sustainable Resource
Science, 1‑7‑22 Suehiro‑cho, Tsurumi‑ku, Yokohama, Kanagawa 230‑0045, Japan. 5Civil Engineering Research
Institute for Cold Region, Public Works Research Institute, 1‑34 Hiragishi 1‑jo 3‑chome, Toyohira‑ku, Sapporo,
Hokkaido 062‑8602, Japan. 6Hokkaido National Fisheries Technology Institute, Japan Fisheries Research and
Education Agency, 116 Katsurakoi, Kushiro, Hokkaido 085‑0802, Japan. 7Shibushi Station, National Research
Institute of Aquaculture, Japan Fisheries Research and Education Agency, 205 Natsui Shibushi‑cho, Shibushi,
Kagoshima 899‑7101, Japan. 8Present address: Fisheries Technology Institute, Japan Fisheries Research and
Education Agency, 116 Katsurakoi, Kushiro, Hokkaido 085‑0802, Japan. *email: tsuyoshiw@affrc.go.jp
Scientific Reports | (2021) 11:5488 | https://doi.org/10.1038/s41598-021-84532-y 1
Vol.:(0123456789)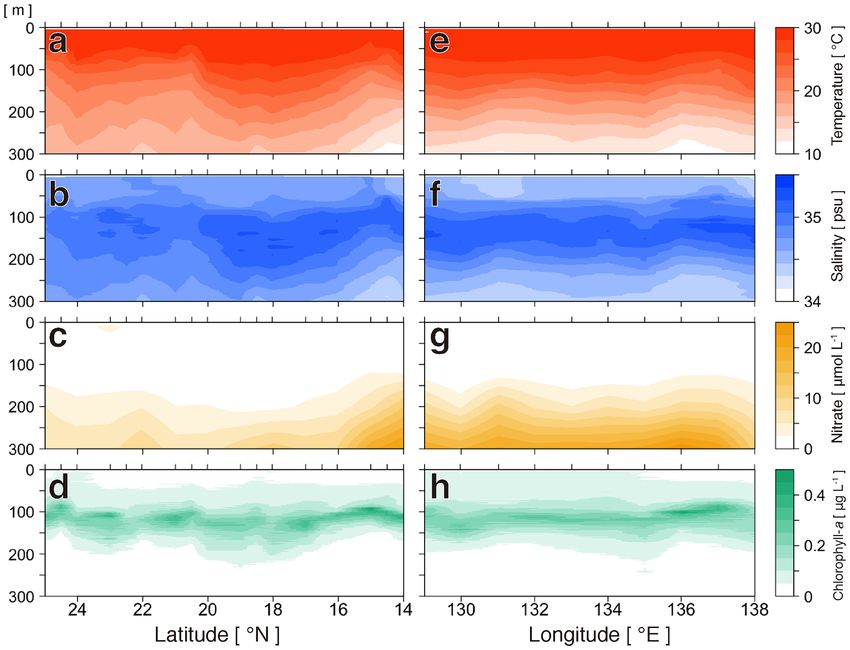
www.nature.com/scientificreports/
Many eel larvae grow in the tropical and subtropical western North Pacific Ocean, where oligotrophic condi-
tions and low biological productivity are encountered in the surface l ayer10. However, at a depth of 65–150 m, cor-
responding to 1% of the surface light intensity, a significantly high-concentration chlorophyll layer (namely, the
subsurface chlorophyll maximum, SCM) is formed11,12. Ocean waters with high vertical stability due to thermal
stratification encourage accumulation of phytoplankton and particulate organic matter (POM) at a thermocline
owing to a high water density and a slow sedimentation rate. Phytoplankton abundance thus increases at the
SCM due to reduced rates of descent and less turbulent mixing. These phenomena lead to biomass accumula-
tion, as reflected in the maximum carbon storage potential. The phytoplankton community in the SCM is mainly
composed of small phytoplankton, such as nano- and picoplankton, and community structure differs from that
in the surface l ayer12.
The natural diets of eel larvae have not been identified because their guts usually contain a considerably
indistinguishable amorphous material. Gut contents observed in different anguillid leptocephali in the North
Pacific provide visible clues regarding dietary preferences. Zooplankton fecal pellets, larvacean houses, appen-
dicularians, and aloricate protozoa were observed in a small number of i ndividuals13–16. Further, analyses of fatty
acids and l ipids17,18 and stable i sotopes20–22, indicate that leptocephali feed on POM originating from organisms
at lower trophic l evels13–16,19–22. These observations suggest that marine snow detrital-type particles in the POM
are a food source23.
Next-generation sequencing (NGS) is increasingly being used to analyze stomach contents for a range of
different organisms, as use of conventional visual methods poses unique c hallenges24–26. In the western North
Pacific, high proportions of hydrozoans, copepods, coccidian parasites, tunicates, and fungi were detected by
NGS analysis of gut contents from leptocephali belonging to five Anguilliform families, including the Japanese
eel, in a study designed to evaluate the level of contamination from the external surface of the larval intestines27.
In the Sargasso Sea, DNA sequence analysis of marine snow particles and the gut contents of European eel,
Anguilla anguilla, larvae indicated a high abundance of hydrozoans, radiolaria, copepods, and dinoflagellates
in both c ompositions28,29. Previous NGS studies in the Atlantic and Pacific oceans showed abundant hydrozoan
sequences and included relatively similar eukaryotic compositions in the leptocephali gut contents.
To help understand the nature of materials consumed as food constituting the natural diet of Pacific eel larvae,
the eukaryotic composition of gut contents was compared with POM, including the marine snow detrital-type
particles in environmental seawater, using metagenomic analysis. The differences in the gut content compositions
of eel larvae were examined by comparing eel taxa, groups with different body lengths, and eels from differ-
ent geographical regions. Oceanographic observations were conducted in the oligotrophic tropical–subtropical
western North Pacific areas, where feeding habits of eel larvae have been reported. The feeding environment of
leptocephali was determined from the relationship observed between the compositions (gut content and POM
of seawater) and marine environments. We surveyed a similar but wider area than that investigated in a previous
study27 because leptocephali feed on marine snow materials that vary in composition, both spatially and tempo-
rally, depending on the plankton composition across locations and feeding times. Oceanographic observations
were recorded at 63 stations, and water samples were collected from more than half of the stations. POM samples
for DNA analysis were obtained from five water depths above 200 m at nine stations, and phytoplankton were
observed under a microscope from the same stations and depths where POM was sampled. This study provides
a new insight into the food sources and the feeding ecology of eel larvae in the oligotrophic tropical–subtropical
western North Pacific Ocean.
Results
Anguilliformes leptocephali observed in this study. During a cruise to the western North Pacific
between 28 September and 6 November 2016, 79 stations were visited across a latitude range of 14.0°N–26.6°N
and a longitude range of 124.0°E–142.1°E (Fig. 1). Leptocephali were caught in net towing made to maximum
depths of 80–221 m (Supplementary Table 2). Overall, 75 eel larvae belonging to four taxa were caught (Table 1;
36 Japanese eels, A. japonica; 13 giant mottled eels, Anguilla marmorata; 16 marine congrid eels, Gnathophis
spp.; and 10 sawtooth eels, Serrivomeridae). Japanese eel larvae were found at 17 sampling stations and other
Anguilliformes were found at 20 stations. Leptocephali were obtained from 29 stations (Fig. 1b,c). The length of
all leptocephali was between 13.0–59.6 mm, with a mean length of 42.0 ± 11.8 mm. For Japanese eels, the length
was between 41.9–59.6 mm, with a mean length of 50.4 ± 4.0 mm (Table 1).
Hydrographic measurements in subtropical/tropical western North Pacific. Marine environ-
ments exhibited similar longitudinal (north and south line on 131.0°E, Fig. 2a–d) and latitudinal (east and west
line on 14.0°N, Fig. 2e–h) patterns in the study area. The temperature decreased with depth (Fig. 2a,e). Maxi-
mum salinity (> 35 psu) was observed between 70 and 200 m in depth (Fig. 2b,f). The concentration of nutrients
(nitrate) was depleted at depths shallower than 100 m (Fig. 2c,g). Vertical marine environments were compared
using the mean values of the standard discrete depths in the survey area (10, 50, 100, and 200 m, and SCM;
Fig. 3a–d) to describe the differences among three layers, namely 10–50 m, 100 m–SCM, and 200 m. The mean
temperature was > 28 °C at 10–50 m, between 24 °C and 28 °C at 100 m–SCM, and < 20 °C at 200 m (Fig. 3a).
The mean salinity was approximately 34.7 at 10–50 m, approximately 35.0 at 100 m–SCM, and approximately
34.8 at 200 m (Fig. 3b). Nitrate concentration was almost 0 μmol L −1 from 10 m to SCM and 5 μmol L −1 at 200 m
(Fig. 3c). The concentration of Chl-a was < 0.1 μg L−1 at 10–50 m, > 0.2 μg L−1 at 100 m–SCM, and almost 0 μg
L−1 at 200 m (Fig. 3d). Chlorophyll concentration per phytoplankton size in the SCM (three sizes: > 10 μm, large;
3–10 μm, medium; and 0.2–3 μm, small) was predominantly attributed to the presence of small phytoplankton
(Fig. 3e), which almost exclusively consisted of Prochlorococcus (Fig. 3f). Thus, the 100 m–SCM layer was the
boundary or the upper part of the thermocline and the pycnocline because marine environments changed rap-
Scientific Reports | (2021) 11:5488 | https://doi.org/10.1038/s41598-021-84532-y 2
Vol:.(1234567890)www.nature.com/scientificreports/
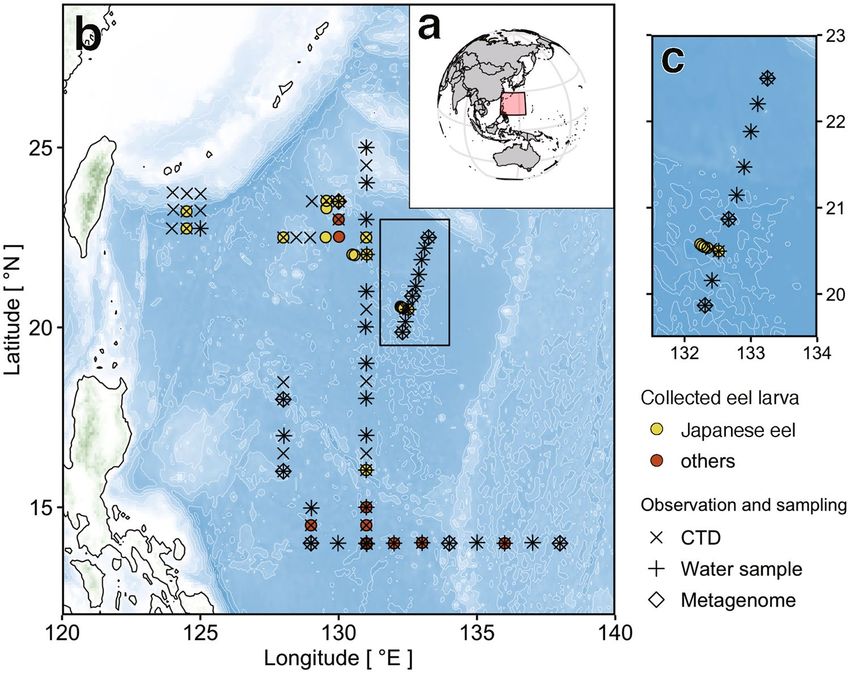
Figure 1. Sampling map. Overview map of the sampling and survey stations in the tropical and subtropical
western North Pacific. The pink square indicates our research area on the global map (a). Enlarged views of the
research area (b, c). Circles denote stations where eel larvae were collected (yellow circles: larvae of Japanese
eel, red circles: other larvae). Cross (×), plus (+), and diamond (◇) indicate CTD observation, water sample
collection points for analysis of marine environments and phytoplankton, and water sample collection points
for metagenome analysis, respectively. Location data of all stations are available in Supplementary Table 1. The
map was generated using the marmap package (version 1.0.3) in R with data imported from the NOAA server
(accessed on 5 December 2019).
Taxon name n Min Max Mean SD
Anguilla japonica 36 41.9 59.6 50.4 4.0
Anguilla marmorata 13 13.0 39.8 24.7 8.6
Gnathophis spp. 16 32.1 58.9 43.1 8.9
Serrivomeridae 10 22.2 41.0 32.6 6.8
Total 75 13.0 59.6 42.0 11.8
Table 1. Total length of leptocephalus in four taxa. s.d. indicates standard deviation.
idly upon descension from this layer. The marine environments in the area, which indicate the feeding ecology
of leptocephali, generally showed similarities across different geographical areas (horizontally) but differed verti-
cally among the three layers.
NGS sequence composition of larval gut contents and POM. The 18S rRNA gene sequences identi-
fied from the guts of 75 eel larvae from four taxa (Table 1) and the 86 filtered seawater samples (43 of > 10 μm
and 43 of 3–10 μm) passed the quality controls. They encompassed 2,706,207 reads, representing 784 taxa across
all samples, 707 taxa from POM of seawater, and 188 taxa from eel gut contents. There were 111 taxa that over-
lapped with those observed in the POM and gut contents. In POM, dinoflagellates were the most diverse (226
taxa) followed by diatoms (75 taxa), Ciliophora (63 taxa), radiolaria (61 taxa), Viridiplantae (48 taxa), copepods
(30 taxa), and haptophytes (27 taxa). In Fig. 4, “other stramenopiles” (54 taxa) represents a small number of
reads obtained from 15 classes, such as Chrysophyceae and Dictyochophyceae, and “others” (25 taxa) repre-
sents a small number of reads obtained from 13 taxonomic groups, such as Crustacea and Thaliacea (Fig. 4a).
In the gut contents, dinoflagellates showed the highest number of taxa (62 taxa). Copepods and diatoms were
represented by 15 and 12 taxa, respectively. However, other stramenopile and other taxa were not represented
(Fig. 4b). Common taxa between the POM and gut contents were dominated by dinoflagellates (58 taxa), with
Scientific Reports | (2021) 11:5488 | https://doi.org/10.1038/s41598-021-84532-y 3
Vol.:(0123456789)www.nature.com/scientificreports/
Figure 2. Oceanographic observation. Contour maps of four marine environments at a latitudinal line from
26.6°N to 14.0°N at 131°E (a–d) and at a longitudinal line from 129.0°E to 138.0°E at 14.0°N (e–h): temperature
(a, e), salinity (b, f), nitrate concentration (c, g), and chlorophyll-a concentration (d, h).
contributions from radiolaria (10 taxa) and copepods (6 taxa). Additionally, other stramenopile and other taxa
were not represented (Fig. 4c). Labyrinthulea and Siphonophorae taxa were detected in POM (8 and 17 taxa,
respectively), gut contents (1 taxon and 3 taxa, respectively), and commonly observed taxa (2 and 3 taxa, respec-
tively; Fig. 4a–c).
Next, we determined the percentage compositions of sequence reads. The primary component of POM of
seawater (Fig. 4d) was dinoflagellates (89.3%) followed by copepods (6.2%) and radiolaria (3.5%). In small POM
(3–10 μm, Fig. 4e), dinoflagellates (96.7%) dominated. Copepods (14.7%, chi-squared test: p < 0.01) and radiolaria
(6.7%, p < 0.01) were relatively more abundant in large POM (> 10 μm in size, Fig. 4f) than in small POM (Fig. 4e).
The primary components of the gut contents of leptocephali (Fig. 4g) were dinoflagellates (67.1%, p < 0.01), but
their abundance in the gut contents was lower than that in POM (Fig. 4d). Additionally, phytoplankton exclud-
ing dinoflagellates [9.7%, comprising cryptophyta (4.1%), diatoms (3.3%), Viridiplantae (1.5%), and haptophyta
(0.8%)] were more abundant than copepods (4.1%) and radiolaria (4.2%) in the gut contents. Moreover, Cili-
ophora (2.8%, p < 0.01), fungi (2.2%, p < 0.01), and cnidaria (1.1%, p < 0.01) found in the gut contents (Fig. 4d)
were markedly rare in POM (Fig. 4d). Labyrinthulea and Siphonophorae were rare at < 1% in both POM and gut
contents (Fig. 4d,g). At lower taxonomic levels, no prominent abundant taxa were observed (Table 2).
The highest abundance of genera was exhibited by the dinoflagellate family. Gymnodiniaceae, and Gyrod-
inium spp. were commonly and predominantly observed in both POM and gut contents (Table 2). Moreover,
almost all dinoflagellate genera were abundant in POM and gut contents. However, three genera (Ichthyodinium,
Nusuttodinium, and Heterocapsa) were more abundant in gut contents than in POM. Urgorri (cryptophyte) and
Pelagostrobilidium (ciliophoran) showed high abundance only in gut contents. The gut contents of Japanese eel
larvae (Fig. 4g) exhibited a lower abundance of dinoflagellates (50.2%, p < 0.01) and radiolaria (0.4%, p < 0.01), but
showed higher abundances of Cryptophyta (11.1%, p < 0.01), Ciliophora (6.6%, p < 0.01), fungi (6.6%, p < 0.01),
and copepods (5.1%, p < 0.01) compared with other species of leptocephali (Fig. 4h). The components of the gut
contents in Japanese eels (Fig. 4g) differed from those of other leptocephali, which consisted of dinoflagellates
(74.1%), Cryptophyta (1.2%), radiolaria (5.8%), and copepods (3.6%) (Fig. 4f). However, the composition of
the gut contents of leptocephali seemed to vary on an individual basis even within the same eel species (Sup-
plementary Fig. 1).
Based on genome components, gut contents clustered into one group and POM of seawater into another
(Fig. 5). The gut contents could also be classified into three significantly different groups [Permutational multi-
variate analysis of variance (PERMANOVA): r2 = 0.23, p < 0.01]; however, these groups did not correspond to eel
Scientific Reports | (2021) 11:5488 | https://doi.org/10.1038/s41598-021-84532-y 4
Vol:.(1234567890)www.nature.com/scientificreports/
a b c d
10m ● a 10m ● a 10m ● a 10m ● a
50m ● b 50m ● a 50m ● ac 50m ● b
100m ● c 100m ● b 100m ● a 100m ● c
SCM ● SCM ● b SCM ● ad SCM ● d
[112m] c [112m] [112m] [112m]
● d ● c ●
b ● e
200m 200m 200m 200m
20 24 28 34.6 34.8 35.0 35.2 0 2 4 6 8 0.0 0.1 0.2
Temperature [ °C ] Salinity [ psu ] Nitrate [ µmol L-1 ] Chlorophyll−a [ µg L-1 ]
e 0.2−3 µm
f Prochlorococcus
10m N.D. 3−10 µm
10m Synecococcus
> 10 µm Picoeukaryote
50m N.D. 50m
100m N.D. 100m
SCM SCM
[112m] [112m]
200m N.D. 200m
0 0.1 0.2 0.3 0 10 20 30 40 50
Chlorophyll−a [ µg L-1 ] Cell density [ 103 cells mL-1 ]
Figure 3. Vertical profiles of environmental factors. Line plots (a–d) generated using mean values (circles)
of all data with standard deviations (horizontal lines) at five depth layers from all 63 (temperature and
salinity) or 38 stations (nitrate and total chlorophyll-a). SCM refers to subsurface chlorophyll maximum. Gray
shading in a–d shows three layers (shallow, 10 and 50 m; middle, 100 m and the SCM; and deep, 200 m) with
different characteristics. Letters indicate significant differences in mean values (p < 0.01) (a–d). Chlorophyll-a
concentrations of three filter size fractions (0.2–3, 3–10, and > 10 μm) at SCM depth from all 37 stations of
total chlorophyll-a stations (e). Average cell densities of Prochlorococcus, Synechococcus, and picoeukaryotic
phytoplankton (f) at five depth layers from all three stations. Prochlorococcus, Synechococcus, and picoeukaryotic
phytoplankton did not show significant differences between the two layers (f). 112 m is the mean depth of
the SCM. Error bars in e and f indicate standard errors of the mean. Data are also available in Supplementary
Table 1.
taxa. There was also no significant correlation between gut content composition and geographical distribution
(Fig. 6a,b) (Mantel test: r = − 0.013, p > 0.01). Gut content composition was not related to body length as the
mean total length of leptocephali did not differ significantly among the groups (Fig. 7) (Wilcoxon rank-sum test:
p > 0.01). The mean composition appeared to differ among the eel species (Fig. 4b,d); however, the differences
among eel larvae individuals were greater than those observed among eel species (Fig. 5, Supplementary Fig. 1).
The diet of eel larvae did not vary in relation to their growth level or distribution.
POM was characterized by the pore size of the filter and water depth (Fig. 5) as follows: (1) small (3–10 μm),
10–50 m and 100 m–SCM; (2) large (> 10 μm), 10–50 m and 100 m–SCM; and (3) small and large, 200 m. There
was a significant difference in genome components among these groups (PERMANOVA: r2 = 0.23, p < 0.01) and
the difference in composition corresponded to the findings obtained from oceanographic observations, which
also changed across the same three layers (Fig. 3a–e). Regarding the composition of POM, it was considered that
the vertical difference was greater than the horizontal difference because the clustered groups were not classified
based on the sampling stations and the correlation between the composition and geographical distribution was
not significant (Mantel test: r = 0.0057, p > 0.01).
Vertical variation of POM and phytoplankton compositions at different depths. The vertical
distribution and feeding depth of the eel larvae in the present study are unknown. The feeding depth of lepto-
cephali was estimated from the gut contents by comparing the gut contents to the composition of POM based
on NGS analysis. POM can provide estimates of the water depth (Fig. 8a). First, the composition of POM was
categorized by size and vertical differences. The community structure of five layers (10, 50, 100, and 200 m, and
the SCM) showed a significant difference in both small (3–10 μm) and large POM (> 10 μm) (PERMANOVA:
r2 > 0.2, p < 0.01). In small POM (3–10 μm), dinoflagellates constituted > 96% of the total and exhibited similar
compositions at all five depths. The primary component of large POM (> 10 μm) was dinoflagellates at all five
depths (74%–94%). However, the compositions of copepods and radiolaria, the next most predominant taxa,
changed between the three layers. Specifically, the levels of these two taxa decreased in shallow layers (5.2% at
10 m, 4.7% at 50 m), increased in middle layers (16.3% at 100 m, 21.2% at SCM), and slightly decreased in the
deep layer (15.4% at 200 m), especially for copepods, which showed a high abundance (> 10%) at 100 m and in
Scientific Reports | (2021) 11:5488 | https://doi.org/10.1038/s41598-021-84532-y 5
Vol.:(0123456789)www.nature.com/scientificreports/
a POM bb Gut contents cc Common
Oth
Oth Oth
Str Fun Str Api
Api
A Str
Cli
Din Din Cni
Fun
Api Sip
Cli Din Eup
Cli
Cni Cop
Sip Fis
Dia Cop Mol Rad
Dia Cni
Rad
Vir Cop Sip
Vir Rad Lab
Cry
Cry
Hap
Eup
Vir Dinoflagellate [ Din ]
Hap Lab Lab Cry Hap
Dia
Diatom [ Dia ]
Taxon number [ % ]
Cryptophyta [ Cry ]
Haptophyta [ Hap ]
dd POM g Gut contents Viridiplantae [ Vir ]
n = 86 n = 75
Fun
Labyrinthulea [ Lab ]
Oth Str Api
Cop
Fis
Mol Cni
Radiolaria [ Rad ]
Rad Cli
Sip
Eup Copepoda [ Cop ]
Cop Euphausiacea [ Eup ]
Rad Siphonophorae [ Sip ]
Lab
Vir
Hap
other Cnidaria [ Cni ]
Din Din Cry
Mollusca [ Mol ]
Dia
Fish (non−eel) [ Fis ]
Ciliophora [ Cil ]
Apicomplexa [ Api ]
e
e 3 µm
ff 10 µm hh Anguilla japonica
n = 36 ii others
Fungi [ Fun ]
n = 43 n = 43 n = 39 other Stramenopiles [ Str ]
Oth StrCli
Mol
Oth
Str Cop others [ Oth ]
Cop Fun Api
Rad Vir
Rad Cli Hap
Dia Cry
Din Mol
Sip
Din
Din Din Cop
Vir
Cry
Hap
Dia
Relative abundance of reads [ % ]
Figure 4. Eukaryotic composition of larval eel gut contents and POM of seawater. Overview of the number of
eukaryotic taxa in POM (particulate organic matter) of 86 samples (a), eel larva gut contents (b), and common
taxon number between POM and gut contents (c). A complete overview of the eukaryotic composition in 86
POM samples (d) and eel larva gut contents of 75 samples (g). Complete overview of the eukaryote composition
in two size-filtered fractions of POM (e: 3–10 μm; f: > 10 μm; 43 samples each) and eel larva gut contents of 36
Japanese eel samples (h) and the other 39 anguillid eel larva samples (i).
the SCM. The composition of seawater in the middle layer resembled eel gut contents because of a relatively high
abundance of taxa other than dinoflagellates (Fig. 4g).
Phytoplankton observed in POM by NGS was compared to the vertical profile of phytoplankton identified
by light microscopy (Fig. 8b,c). The composition of phytoplankton (> 2 μm) estimated by cell counting showed
a predominance of dinoflagellates (85.5%), with small contributions from diatoms (5.7%), cryptophytes (4.5%),
and haptophytes (2.4%; Fig. 8b). Both dinoflagellates (49 taxa) and diatoms (39 taxa) displayed high diversity
(Fig. 8b). The dominant taxon was represented by the family Gymnodiniaceae (Table 3), and the results were
consistent with those of the NGS analysis (Table 2). However, Gymnodiniaceae may include many unidentified
genera. This family comprises small members that may be classified at the genus level using light microscopy-
based analysis. The major phytoplankton component in every depth layer was represented by dinoflagellates
(Fig. 8c). The abundance of other phytoplankton peaked in the middle layer (100 m and the SCM; Fig. 8c). The
compositions of POM and the cell count in the middle layer (100 m and SCM) corresponded to the composition
of eel gut contents (Fig. 4g).
Discussion
The gut contents of 75 eel leptocephali, as analyzed by 18S rRNA gene sequencing, showed that dinoflagellates
were the most abundant genera in the study area region of the western North Pacific Ocean during the research
cruise, with lesser contributions from other phytoplankton (cryptophyta and diatoms) and zooplankton (cilioph-
orans and copepods). Dinoflagellates were represented by many taxa, predominantly the family Gymnodiniaceae,
as evidenced by DNA-based analysis of the gut contents and POM and light microscopy. Across tropical and
Scientific Reports | (2021) 11:5488 | https://doi.org/10.1038/s41598-021-84532-y 6
Vol:.(1234567890)www.nature.com/scientificreports/
Reads percent (%)
Taxonomic group Family Genus POM Gut content
Amoebophryaceae Amoebophrya 7.3 3.5
Blastodinidae Blastodinium 3.5 1.1
Brachidiniaceae Karenia 3.7 1.1
Dinophysiaceae Ichthyodinium 1.7 5.6
Duboscquellaceae Euduboscquella 6.5 6.6
Gymnodiniaceae Gymnodinium 4.5 1.2
Dinoflagellate Gyrodinium 10.1 12.1
Lepidodinium 9.4 1.6
Nusuttodinium 0.6 5.4
Heterocapsaceae Heterocapsa 0.8 7.7
Kareniaceae Karlodinium 4.2 3.3
Prorocentraceae Prorocentrum 2.8 1.4
Warnowiaceae Warnowia 13.2 1.2
Cryptophyta Geminigeraceae Urgorri – 2.2
Ciliophora Strobilidiidae Pelagostrobilidium 0.004 2.2
Table 2. Top 10 most abundant genera in NGS reads in gut contents and POM. Bold number indicates high
abundance in POM or gut contents. “–” indicates no detection.
Eel Taxon
6
Japanese eel
Giant mottled eel
Marine congrid eels
5
Sawtooth eels
Size of POM
10 µm
4
3 µm
Sampling depth of POM
10 m & 50 m
3
100 m & SCM
200 m
2
1
0
Group 3 Group 2 Group 1
POM of seawater (n = 86) Gut content (n = 75)
Figure 5. Cluster dendrogram based on eukaryotic compositions in eel gut contents and POM of seawater.
POM samples classified into two sizes (10 μm, diamond ◇ and 3 μm, square □) and three sampling depths
(10 m & 50 m: blue; 100 m & the SCM: red; 200 m: yellow). Based on the gut content samples, three well-defined
cluster groups (Group 1: red, Group 2: green, Group 3: blue) were observed.
subtropical regions of oceans including the Pacific Ocean, dinoflagellate blooms are reportedly sporadic30. Small
dinoflagellate (< 20 μm) represented the most highly abundant phytoplankton as per the microscopic observa-
tions, and Gyrodinium spp. (belonging to Gymnodiniaceae and showing high abundance in the DNA analysis
of our study) showed predominance among the dinoflagellate t axa30. Previous NGS studies in the Sargasso Sea
and the western North Pacific Ocean also detected dinoflagellates in both the leptocephalus gut c ontents27,29,31
and the marine snow p articles31,32. Therefore, it appears that dinoflagellates may have been an important food
source for leptocephali in the survey area when our study was conducted.
Although there is currently no significant evidence indicating that Siphonophorae (belonging to the phylum
Cnidaria) are an important food source for leptocephali, they were detected as one of the dominant taxa in the
eukaryotic composition of the gut contents of leptocephali and the marine snow particles using DNA analysis
in both the western North Pacific O cean27 and the Sargasso S ea29 and have also been observed to be abundant in
29
the marine environment . However, the results of the present study showed a low abundance of siphonophores
in both the gut contents and the POM of seawater, despite being in almost the same sea area and survey period
reported by Chow et al27. The seasonal distribution and abundance of siphonophores are primarily attributed to
fluctuations in environmental factors that control the sexual cycle33,34, and in a favorable environment, sipho-
nophores can rapidly reproduce a sexually35–37. In the western North Pacific Ocean, spatiotemporal variation in
siphonophore assemblages is closely related to temperature, salinity, chlorophyll concentration, and zooplankton
Scientific Reports | (2021) 11:5488 | https://doi.org/10.1038/s41598-021-84532-y 7
Vol.:(0123456789)www.nature.com/scientificreports/
Figure 6. Distribution of four eel taxa within three cluster groups based on eukaryotic composition in gut
content samples. Distribution of four eel taxa [circle ○: Japanese eel, square □: giant mottled eel (Anguilla
marmorata), diamond ◇: marine congrid eels (Gnathopis spp.), and triangle △: sawtooth eels (Serrivomeridae
spp.)]. Colors denote three cluster groups based on eukaryotic composition in the gut content samples in Fig. 5;
gray indicates a mixture of multiple groups. Numbers on markers indicate the number of eel larvae. Note that a
giant mottled eel was excluded from this map because it was not classified in the gut content cluster in Fig. 5.
Group
30 1 (n = 44)
2 (n = 15)
Number of eels
3 (n = 15)
20
10
0
10 20 30 40 50 60
Total length [ mm ]
Figure 7. Histogram of eel larvae numbers at different size classes. Colors denote three cluster groups based on
eukaryotic composition in the gut content samples in Fig. 5. Data are also available in Supplementary Table 1.
abundance, which are strongly influenced by ocean currents38 and seasonal m onsoons39. For instance, in summer,
the southwestern monsoon increases the species number and abundance of siphonophores, whereas in winter
the northeast monsoon decreases species number and a bundance40. Moreover, typhoons have an impact on the
abundance of siphonophores, with a decrease observed immediately after the passage of a typhoon38; however,
an increase has been observed one month l ater41.
In the western North Pacific Ocean, phytoplankton increase in abundance following typhoons because the
cyclonic eddies generated by typhoons induce considerable ocean mixing and supply nutrients from the lower
layers to the oligotrophic upper layers42. High abundances of phytoplankton following typhoons have been
reported in tropical-subtropical a reas43–45, and the strength and speed of typhoons determine the scale of phy-
toplankton blooms46. Increased phytoplankton abundances are maintained for up to 10 days after the passage
of a typhoon45,47,48. Both this study (28 September—11 November 2016) and that reported by Chow et al.27 (29
September—13 October 2017) were conducted in autumn and seem to be weakly influenced by the monsoon.
In 2017, typhoons did not occur during the survey period reported by Chow et al.27, with the last occurrence
reported between 9 and 18 September at the survey area49. It is estimated that these meteorological conditions
Scientific Reports | (2021) 11:5488 | https://doi.org/10.1038/s41598-021-84532-y 8
Vol:.(1234567890)www.nature.com/scientificreports/
a 10 µm 3 µm
Dinoflagellate [ Din ]
10m Cop Din Diatom
Cryptophyta
Rad
Haptophyta
50m Viridiplantae
Labyrinthulea
Radiolaria [ Rad ]
100m Copepoda [ Cop ]
Euphausiacea [ Eup ]
Siphonophorae [ Sip ]
SCM
[ 112m ] other Cnidaria
Eup Ciliophora
Sip Apicomplexa
Fungi
200m other Stramenopiles
others
0 50 100 0 50 100
Relative abundance of reads [ % ]
Vir Cya
b Vir Hap Str Eug Hap
Cry
Cry
Dinoflagellate [ Din ]
Dia
Diatom [ Dia ]
Cryptophyta [ Cry ]
Haptophyta [ Hap ]
Din Dia Cyanobacteria [ Cya ]
Din
Euglenoidea [ Eug ]
Viridiplantae [ Vir ]
other Stramenopiles [ Str ]
Relative abundance of cells [ % ] Taxon number [ % ]
c
a
10m
a
50m
a
100m
SCM a
[ 112m ]
Dinoflagellate
b
200m Other phytoplankton
0 5000 10000 15000 20000
Cell density [ cells L−1 ]
Figure 8. Eukaryotic composition in POM of seawater. Average relative abundances of eukaryotic reads
from NGS analysis with two filter size groups (10 and 3 μm, respectively; 43 samples each) at five depth layers
from nine stations (a). Overview of phytoplankton composition and numbers of taxa (> 2 µm) obtained by
cell counting of 45 samples at the same five depth layers and same nine stations for NGS analysis of POM
(b). Average phytoplankton composition at five depth layers in nine stations (c). Letters indicate significantly
different mean values (p < 0.01) (c). Other phytoplankton composing of seven taxonomic groups excluding
dinoflagellates did not show significant differences among the layers (c). The mean depth of the SCM is 112 m.
Error bars in c indicate standard errors of the mean. Data are available in Supplementary Table 1.
Scientific Reports | (2021) 11:5488 | https://doi.org/10.1038/s41598-021-84532-y 9
Vol.:(0123456789)www.nature.com/scientificreports/
Taxinomic group Class Order Family Genus Cell density (cells L-1) (% )
Gymnodiniales Gymnodiniaceae – 209,644 53.9
– – 85,634 22.0
Dinoflagellate Dinophyceae Peridiniales Oxytoxaceae Oxytoxum 19,573 5.0
Peridiniaceae Scrippsiella 4,421 1.1
Prorocentrales Prorocentraceae Prorocentrum 5,793 1.5
Naviculales Naviculaceae Navicula 3,531 0.9
Diatom Bacillariophyceae
Bacillariales Bacillariaceae Fragilariopsis 3,295 0.8
Cryptophyta Cryptophyceae – – – 17,577 4.5
Haptophyta Prymnesiophyceae Phaeocystales Phaeocystaceae Phaeocystis 9,463 2.4
Viridiplantae Pyramimonadophyceae Pyramimonadales Pyramimonadaceae Pyramimonas 5,611 1.4
Table 3. Top 10 dominant phytoplankton taxa determined by light microscopy cell counting. “–” Indicates an
unidentified taxonomic level.
provide a favorable environment for siphonophores. In contrast, in 2016, six typhoons occurred in the survey area
during the survey period, including two remarkably strong typhoons (typhoons Chaba and Haima)49. Therefore,
this study presumes that the variation of marine environments caused by the disturbance of typhoons leads to
a decrease in siphonophore abundance and an increase in phytoplankton population, and that this result would
be reflected in the DNA compositions of the marine snow particles and gut contents of leptocephali.
The microscopic studies of leptocephalus gut contents that found the apparent presence of Labyrinthulo-
mycetes and suggested that they might be a possible food source for the European eel and other eel larvae in
the Sargasso S ea50 did not verify their presence in the gut contents genetically or by quantitative observations.
Presently, there is also no evidence available on the dietary importance of protists. This study may not have
accurately detected Labyrinthulomycetes because such studies require specific PCR primers for amplification
of their 18S rDNA sequences51. Although they were detected in small numbers in POM and gut contents in this
study, we may not have accurately detected species of importance of Labyrinthulomycetes as a food source for
eel leptocephali in the western North Pacific.
Observations of gut contents and stable isotope studies have suggested that marine snow detrital-type par-
ticles are a food source, but this requires further validation. Data confirming the digestibility and absorbability
of unprocessed zooplankton and/or phytoplankton (alive or shortly after death) by eel leptocephali are not
available52–54. Artificially cultured Japanese eel survived by eating small POM (53 and 25 µm) from s eawater22;
however, they died upon eating large POM (> 350 µm), strongly suggesting that relatively large zooplankton
and/or phytoplankton, specifically those with hard or sharp bodies, seriously damaged the digestive organs of
leptocephali. Smaller particles may therefore be of importance for these l arvae16, and this corresponds with the
food source known as marine snow detrital-type p articles23. Small spherical particles (2–40 µm in diameter) of
marine snow comprising polysaccharides and proteins within the aggregate is a common finding in both the gut
contents of anguilliform l eptocephali15,16,23,55 and environmental w ater16, suggesting that marine snow particles
originating from phytoplankton and cyanobacteria are a food source for the leptocephali16. Thus, food sources
of eel larvae in the marine environment are assumed to be small or soft marine snow particles in POM56. In this
study, the comparison of gut contents and POM indicated several differences, especially in dominant genera.
The existence of highly abundant genera only in gut contents strongly suggests that leptocephalus feeds selec-
tively on specific marine snow detrital-type particles, which can, such as in the present study, predominantly
contain dinoflagellates and soft organisms (e.g. cryptophyte and ciliophoran). The forward-pointing teeth are
well-designed to help squeeze particles into the oral c avity14,57 and also facilitate the expulsion of excess material
away from the mouth to avoid fouling of the t eeth58. The mouth structure of eel larvae, which is suitable for the
capture of small particles, supports the hypothesis of a selective marine snow d iet16. Current findings suggest
the importance of marine snow particles that are a mixture of principal dinoflagellates and other supplementary
phytoplankton and zooplankton materials13,14. Additionally, Prochlorococcus may be important as a food source
because they are present at high levels in the SCM. The cell membranes of Prochlorococcus are covered with
proteins59 and release m onosaccharides60, the extracellular exudates are composed of low-molecular-weight
compounds , and the extracellular vesicles contain rich nutrients such as lipids, proteins, and nucleic a cids62,63. In
61
seawater, it is known that transparent exopolymer particles (TEPs) exist and are mixed with a substantial amount
of protein-rich amorphous p articles64–66. Thus, leptocephali likely feed on the nutrient-rich soft marine snow
particles composed of substances derived from various organisms, which have been decomposed by bacteria67.
Our results are consistent with the low trophic position of the natural food of leptocephali estimated by stable
isotopic analysis of the nitrogen located between primary producers and primary consumers23.
The compositions of eel gut contents did not completely match that of the POM of seawater. The organis-
mal composition of POM in the marine environment differed from that of marine snow detrital-type particles
that were assumed to be the true food source for leptocephali. This may be explained by the difference that is
caused by selective feeding on soft and small particles of marine snow. It may also be explained by the eukary-
otic phytoplankton composition. Eukaryotic phytoplankton, excluding dinoflagellates, are mainly composed of
diatoms, cryptophytes, and haptophytes. This second most abundant group of organisms in the gut contents was
rarely observed in POM, although it was present at a relatively high abundance (ca. 15%) in total cell density
at the middle layer (100 m and SCM), as revealed by microscopic observation. These phytoplankton might be
Scientific Reports | (2021) 11:5488 | https://doi.org/10.1038/s41598-021-84532-y 10
Vol:.(1234567890)www.nature.com/scientificreports/
underestimated in the metagenomic analysis due to relatively low copy numbers of ribosomal RNA compared
to dinoflagellates68–70. Nevertheless, dinoflagellates exhibited the highest abundance in both the POM and gut
contents of leptocephali. Dinoflagellates may be one of the most important food sources for eel larvae in the
western North Pacific Ocean.
Oceanographic observations showed that the marine environments in which the leptocephali were distrib-
uted exhibited similar patterns horizontally but differed vertically among the following three layers: 10–50 m,
100 m–SCM, and 200 m. SCM was present at a depth of 82–140 m throughout our study area and it was observed
at the upper part of the thermocline corresponding to about 24 °C. These oceanological features were also sup-
ported by previous studies in the tropical and subtropical western Pacific O cean12,71. Under rearing conditions,
the optimal temperature for the early development of larvae72,73 and the most suitable temperature to ensure a
eformities74 in Japanese eel was reported to be 24–28 °C. The relationship between water temperature
lack of d
and otolith diameter for cultured Japanese eel larvae suggests that the mean ambient water temperature expe-
rienced by natural larvae during their first month after hatching is approximately 23°C72. The depth at which
Japanese eel preleptocephali (eel larvae at an early developmental stage) were distributed was estimated to be at
the SCM (~ 150 m in depth) and the upper part of the thermocline (temperatures of 25.5–27.3 °C), based on the
collection data and the oxygen stable isotope ratios in otolith aragonite of the preleptocephali75,76. The specific
gravities of Japanese eel larvae during their early feeding period were close to those of seawater at a subsurface
depth of 130 m in the North Equatorial Current region, such that their buoyancy would enable them to easily
adjust their depth to remain in the layer with the maximum food a vailability5.
POM, including the marine snow detrital-type particles hypothesized to be the food source of leptocephali, is
produced in the upper few hundred meters, including within the S CM77,78; it may often accumulate around the
pycnocline79. A high abundance of POM has been identified in the subsurface layer (100–200 m) in the subtropi-
cal western North Pacific Ocean16,22. A comparison of leptocephalus gut contents and the marine snow particles
in seawater using microscopic observations supports the hypothesis that leptocephali may efficiently feed on
marine snow particles within the SCM16. The results of the metagenomic analysis in this study showed that the
composition of seawater differed with water depth, and the composition of the SCM was similar to that of the
gut contents of eel larvae. Our results strongly suggest that eel larvae feed on food within the SCM. Conversely,
no clear geographical differences were observed in the composition of either leptocephalus gut contents or POM
of the seawater samples. The marine snow particles in POM at the SCM that are the diet of leptocephali may be
extensively distributed in a uniform manner across the entirety of the tropical and subtropical western North
Pacific. The SCM contains abundant dinoflagellates, and zooplankton and phytoplankton are major components
of the marine snow particles; therefore, marine snow particles may sufficiently support the growth of eel larvae.
Thus, the chlorophyll maximum at the thermocline may be advantageous for both the development and diet of
eel larvae.
We estimated the dietary components of several eel larvae species and the marine environment in the western
North Pacific. These results provide novel information that may aid in protecting and improving the natural
resources of the critically endangered Japanese eel and may lead to an improvement in its early survival during
aquaculture. In future research, we hope to clarify the actual food material consumed by eel larvae in the marine
environment by biogeochemical analyses and to determine the manner in which the diet of leptocephali is formed
through bio-chemical-physical processes in the oligotrophic ocean.
Methods
Ethics statement. The larval samples captured with plankton nets deployed from the research vessels were
dead on retrieval and sampled at this juncture. All plankton net operations were conducted in high seas outside
the exclusive economic zone. Therefore, the approval of coastal states was not required under the United Nations
Convention on the Law of the Sea (UNCLOS).
Oceanographic observations and collection of water samples. Measurements of conductivity-
temperature-depth (CTD) and chlorophyll fluorescence were conducted at 63 stations, in which a CTD instru-
ment attached to a sampling rosette containing Niskin bottles was lowered to 1,000 m. We used data from
temperature and salinity measured at 1-m intervals by CTD observation. SCM depth was determined on the
ship by noting the vertical profile of the chlorophyll fluorescence. Water samples for the analysis of nutrient
concentrations were collected at 38 stations using Niskin bottles at 12 standard discrete depths from 0 to 1,000 m
(Supplementary Table 1). The total chlorophyll concentrations were analyzed at the same 38 stations as nutri-
ents; however, samples were collected at six water depths shallower than 200 m (0, 10, 50, 100, and 200 m, and
the SCM), and the size-fractionated chlorophyll concentration (10, 3 and 0.2 μm) was measured only at the
SCM depth at 37 stations (Supplementary Table 1). Seawater samples of POM for metagenomic analysis were
obtained at nine stations at five standard discrete depths (10, 50, 100, and 200 m, and the SCM). In total, 1 L of
seawater was fractioned using 10-µm and 3-µm pore size nucleopore filters of 42 mm in diameter. After filtra-
tion, these filters were immediately stored in 1.5-mL Eppendorf tubes at − 60 °C and transferred to the labora-
tory. For evaluating large phytoplankton, 1-L seawater samples from nine stations at five depths (same as those
used for metagenomic analysis) were immediately fixed with acid Lugol solution (final concentration of 4%) and
stored at 4 °C until analysis. Samples were concentrated by reverse filtration through a 2-μm nucleopore filter.
In the concentrated samples (> 2 μm), phytoplankton were identified at the species level where possible follow-
ing the methods prescribed by Tomas and H asle80, and the phytoplankton cell densities (cells L
−1) were esti-
mated under a light microscope. Samples used for estimation of small phytoplankton were obtained at the same
standard discrete depths from three stations where large phytoplankton analysis was performed (Supplementary
Table 1). For small phytoplankton, water samples (1.5 mL) from three stations were fixed with paraformaldehyde
Scientific Reports | (2021) 11:5488 | https://doi.org/10.1038/s41598-021-84532-y 11
Vol.:(0123456789)www.nature.com/scientificreports/
(final concentration of 0.2%) for 5–10 min, frozen in liquid nitrogen, and counted on a flow cytometer (FCM)
equipped with a laser (excitation: 405 and 488 nm, standard filter set, NoyoCyte; ACEA Biosciences) following
the reported protocol81. The cells that possessed Chl-a without phycoerythrin (PE) were counted as picoeu-
karyotes, those that possessed both Chl-a and PE < 2 μm in size were counted as Synechococcus, and those that
possessed Divinyl Chl-a without PE were counted as Prochlorococcus.
Sampling and identification procedures for eel larva. An Isaacs–Kidd Midwater Trawl (IKMT) net
(8.7 m2 opening, 13 m long, 0.5 mm mesh, and canvas-made cod-end) was used to collect eel leptocephali.
Oblique tows from a depth of 200 m were performed at night in the western North Pacific on 29 September and
6 November 2016. Leptocephali were sorted and placed on a chilled Petri dish. A total of 75 leptocephali (Japa-
nese eel, A. japonica, 36; giant mottled eel, A. marmorata, 13; marine congrid eels, Gnathophis spp., 16; sawtooth
eels, Serrivomeridae, 10) gut contents were selected for analysis (Table 1 and details in Supplementary Table 2).
The body surface was rinsed several times using sterilized and refrigerated seawater and the rinsed leptocephali
were then placed on a sterilized Petri dish. The leptocephali were then immersed in sterilized and refrigerated
seawater, and their gut contents were squeezed out using an inoculating loop and pipette. The gut contents were
placed in separate 1.5-mL Eppendorf tubes, kept at − 60 °C, and transferred to the laboratory.
DNA extraction, library preparation, and MiSeq sequencing. DNA was extracted from the guts
of eel larvae and the filter samples of POM using the QuickGene DNA Tissue Kit S (KURABO, Osaka, Japan)
and the 5% Chelex buffer method82, respectively. To perform metagenomic analysis using the MiSeq 300PE
platform (Illumina, San Diego, California, USA), a set of universal primers to amplify the V7–9 hypervariable
regions of the 18S-rRNA gene were u sed83,84. Parallel paired-end sequencing on the MiSeq platform requires
PCR amplicons to be flanked by the following: (i) primer-binding sites for sequencing; (ii) dual-index (i.e., bar-
code) sequences; and (iii) adapter sequences for binding to the flow cells of the MiSeq.
We employed a two-step PCR approach to construct the paired-end libraries85. First and second-round PCRs
were conducted following Dzhembekova et al.84,85. A PhiX DNA spike-in control was mixed with the pooled DNA
library to improve the data quality of low-diversity samples, such as single PCR amplicons85. DNA concentrations
of the pooled library and the PhiX DNA were adjusted to 4 nM using the buffer EB (10 mM Tris–HCl, pH 8.5)
mixed at a ratio of 7:3.5 μL85. The 4-nM library was denatured with 5 μL of fresh 0.1 N N aOH85. Using the HT1
buffer (provided with the Illumina MiSeq v. 2 Reagent kit for 2 × 150 bp PE), the denatured library (10 μL; 2 nM)
was diluted to a final concentration of 12 pM for sequencing on the MiSeq p latform85.
Treatment processes and operational taxonomic unit picking. Nucleotide sequences were demul-
tiplexed depending on the 5′-multiplex identifier (MID) tag and primer sequences using the default format in
MiSeq. The sequences containing palindromic clips longer than 30 bp and homopolymers longer than 9 bp were
trimmed from the sequences at both ends. The 3′ tails with an average quality score of less than 30 at the end of
the last 25-bp window were also trimmed from each sequence. The 5′ and 3′ tails with an average quality score
of less than 20 at the end of the last window were also trimmed from each sequence. Sequences longer than
250 bp were truncated to 250 bp by trimming the 3′ tails. Trimmed sequences shorter than 200 bp were filtered
out. Demultiplexing and trimming were performed using Trimmomatic version 0.3586 (http://www.usadellab.
org/cms/?page=trimmomatic). The remaining sequences were merged into paired reads using Usearch version
8.0.1517 (http://www.drive5.com/usearch/). Further, singletons were removed and sequences were then aligned
using Clustal Omega v 1.2.0. (http://www.clustal.org/omega/). Multiple sequences were aligned with each other,
and data of the sequences that showed > 75% similarity in read positions were extracted. Filtering and a part
of the multiple alignment process were performed using the screen.seqs and filter.seqs commands in Mothur,
as described in the Miseq S OP87 (http://www.mothur.org.). Erroneous and chimeric sequences were detected
and removed using the pre.cluster (diffs = 4) and chimera.uchime (minh = 0.188; http://drive5.com/usearch/
manual/uchime_algo.html) commands in Mothur, respectively. Using the unique.seqs command of Mothur, the
same sequences were collected into operational taxonomic units (OTUs). The contig sequences were counted as
OTUs by count.seqs and used for the subsequent taxonomic identification analysis. Demultiplexed, filtered, but
untrimmed sequence data were deposited in the DDBJ Sequence Read Archive under accession no. PRJDB8891.
Taxonomic identification of the OTUs. Selected OTUs were then taxonomically identified. A subset
of nucleotide databases comprising sequences that satisfied the chosen conditions (described below) were pre-
pared for a BLAST search using the nucleotide (nt) database. One keyword was selected from among “ribo-
somal,” “rrna,” and “rdna,” but “protein” was not included in the title. For the taxonomy search, keywords
such as “metagenome,” “uncultured,” and “environmental” were not included. Sequences from GenBank IDs
retrieved from the nt database and downloaded from the NCBI FTP server were extracted on 22 March 2019
and used to construct a template sequence database. Subsequently, taxonomic identification of each OTU was
performed using a BLAST s earch89. The BLAST search was conducted using NCBI BLAST + 2.2.30 + 90 with the
default parameters, the same nucleotide subset as described above for the database, and all OTU-representative
sequences as the query. Taxonomic information was obtained from the BLAST hit with top bitscores for each
query sequence, and then the OTUs of the same top hit were merged. The removal of sequences containing
errors was imperfect after the successive MPS data treatment processes. Sequences containing different types of
errors derived from the original ones remained in the following analytical steps. Therefore, these sequences were
detected as unique OTUs with the same blast top hit name but different similarities. To avoid overestimation
of the OTUs, these artificial OTUs were merged into a single OTU with the greatest similarity score. Among
the sequences detected from all samples, we excluded the sequences of eels and Homo sapiens. Finally, 784 taxa
Scientific Reports | (2021) 11:5488 | https://doi.org/10.1038/s41598-021-84532-y 12
Vol:.(1234567890)www.nature.com/scientificreports/
within the taxonomic categories of kingdom, phylum or division, class, order, family, genus, and species were
determined by referring to WoRMS91.
Statistical analysis. Statistical analyses were conducted using R
92. Kruskal–Wallis rank-sum tests as analy-
ses of variance were used to determine significant differences in the mean values of five environmental factors
at five standard discrete depths. Then, Wilcoxon rank-sum tests with pairwise comparisons using Bonferroni-
adjusted p-values were used as post hoc tests between every two layers. In between the two eukaryotic com-
munity compositions (e.g., gut content vs POM of seawater), a two-sample test for equality of proportions was
statistically evaluated using the chi-square test without continuity correction using the stats package92. The vari-
ability in the eukaryotic community structure was examined using the Ward hierarchy clustering method based
on Bray–Curtis dissimilarity93. Before estimating the dissimilarity matrix, the community structure was trans-
formed into presence or absence data. PERMANOVA (permutations = 10,000) was used to statistically test the
differences in the community composition among clusters or water depths based on the dissimilarity m atrix94.
The relationships between the community structure and geographical distribution were statistically evaluated
using the Mantel test (permutations = 10,000, with Pearson’s correlation coefficient), which is a permutation
test to determine the correlation between two dissimilar distance matrices (community vs. latitude–longitude).
Cluster analysis, PERMANOVA, and the Mantel test were performed using the vegan package95. Differences in
the mean values of each pair of leptocephalus length clusters were determined using Wilcoxon’s rank-sum test
using the stats package92. p-values < 0.01 were considered significant.
Received: 8 January 2020; Accepted: 15 February 2021
References
1. Tsukamoto, K. Discovery of the spawning area for Japanese eel. Nature 356, 789–791 (1992).
2. Tsukamoto, K. Spawning of eels near a seamount. Nature 439, 929 (2006).
3. Chow, S. et al. Discovery of mature freshwater eels in the open ocean. Fish. Sci. 75, 257–259 (2009).
4. Kurogi, H. et al. First capture of post-spawning female of the Japanese eel Anguilla japonica at the southern West Mariana Ridge.
Fish. Sci. 77, 199–205 (2011).
5. Tsukamoto, K. et al. Positive buoyancy in eel leptocephali: an adaptation for life in the ocean surface layer. Mar. Biol. 156, 835–846
(2009).
6. Cheng, P. W. & Tzeng, W. N. Timing of metamorphosis and estuarine arrival across the dispersal range of the Japanese eel Anguilla
japonica. Mar. Ecol. Prog. Ser. 131, 87–96 (1996).
7. Chen, J. Z., Huang, S. L. & Han, Y. S. Impact of long-term habitat loss on the Japanese eel Anguilla japonica. Estuar. Coast. Shelf
Sci. 151, 361–369 (2014).
8. Tanaka, E. Stock assessment of Japanese eels using Japanese abundance indices. Fish. Sci. 80, 1129–1144 (2014).
9. Jacoby, D. & Gollock, M. Anguilla anguilla. The IUCN red list of threatened species, version 2014.2. IUCN 2014 e.T60344A45833138.
https://doi.org/10.1108/ICS-04-2017-0025 (2014).
10. Onda, H. et al. Vertical distribution and assemblage structure of leptocephali in the North Equatorial Current region of the western
Pacific. Mar. Ecol. Prog. Ser. 575, 119–136 (2017).
11. Saijo, Y., Iizuka, S. & Asaoka, O. Chlorophyll maxima in Kuroshio and adjacent area. Mar. Biol. 4, 190–196 (1969).
12. Furuya, K. Subsurface chlorophyll maximum in the tropical and subtropical western Pacific Ocean: Vertical profiles of phyto-
plankton biomass and its relationship with chlorophylla and particulate organic carbon. Mar. Biol. 107, 529–539 (1990).
13. Otake, T., Nogami, K. & Maruyama, K. Dissolved and particulate organic matter as possible food sources for eel leptocephali. Mar.
Ecol. Prog. Ser. 92, 27–34 (1993).
14. Mochioka, N. & Iwamizu, M. Diet of anguilloid larvae: Leptocephali feed selectively on larvacean houses and fecal pellets. Mar.
Biol. 125, 447–452 (1996).
15. Miller, M. J., Otake, T. & Aoyama, J. Observations of gut contents of leptocephali in the North Equatorial current and Tomini Bay
Indonesia. Coast. Mar. Sci. 35, 277–288 (2012).
16. Tomoda, T. et al. Observations of gut contents of anguilliform leptocephali collected in the western North Pacific. Nippon Suisan
Gakkaishi 84, 32–44 (2018).
17. Deibel, D., Parrish, C. C., Grønkjær, P., Munk, P. & GisselNielsen, T. Lipid class and fatty acid content of the leptocephalus larva
of tropical eels. Lipids 47, 623–634 (2012).
18. Liénart, C. et al. Geographic variation in stable isotopic and fatty acid composition of anguilliform leptocephali and particulate
organic matter in the South Pacific. Mar. Ecol. Prog. Ser. 544, 225–241 (2016).
19. Miller, M. J. et al. A low trophic position of Japanese eel larvae indicates feeding on marine snow. Biol. Lett. 9, 20120826 (2013).
20. Miyazaki, S. et al. Stable isotope analysis of two species of anguilliform leptocephali (Anguilla japonica and Ariosoma major) rela-
tive to their feeding depth in the North Equatorial Current region. Mar. Biol. 158, 2555–2564 (2011).
21. Chow, S. et al. Japanese eel Anguilla japonica do not assimilate nutrition during the oceanic spawning migration: evidence from
stable isotope analysis. Mar. Ecol. Prog. Ser. 402, 233–238 (2010).
22. Chow, S. et al. Onboard rearing attempts for the Japanese eel leptocephali using POM-enriched water collected in the Western
North Pacific. Aquat. Living Resour. 30, 1–7 (2017).
23. Miller, M. J., Hanel, R., Feunteun, E. & Tsukamoto, K. The food source of Sargasso Sea leptocephali. Mar. Biol. 167, 57 (2020).
24. Pompanon, F. et al. Who is eating what: Diet assessment using next generation sequencing. Mol. Ecol. 21, 1931–1950 (2012).
25. Wang, M. & Jeffs, A. G. Nutritional composition of potential zooplankton prey of spiny lobster larvae: a review. Rev. Aquac. 6,
270–299 (2014).
26. Ho, T. W., Hwang, J. S., Cheung, M. K., Kwan, H. S. & Wong, C. K. Dietary analysis on the shallow-water hydrothermal vent crab
Xenograpsus testudinatus using Illumina sequencing. Mar. Biol. 162, 1787–1798 (2015).
27. Chow, S. et al. Molecular diet analysis of Anguilliformes leptocephalus larvae collected in the western North Pacific. PLoS ONE
14, e0225610 (2019).
28. Riemann, L. et al. Qualitative assessment of the diet of European eel larvae in the Sargasso Sea resolved by DNA barcoding. Biol.
Lett. 6, 819–822 (2010).
Scientific Reports | (2021) 11:5488 | https://doi.org/10.1038/s41598-021-84532-y 13
Vol.:(0123456789)You can also read