Laboratory study of the collection efficiency of submicron aerosol particles by cloud droplets - Part I: Influence of relative humidity
←
→
Page content transcription
If your browser does not render page correctly, please read the page content below
Atmos. Chem. Phys., 21, 6945–6962, 2021
https://doi.org/10.5194/acp-21-6945-2021
© Author(s) 2021. This work is distributed under
the Creative Commons Attribution 4.0 License.

Laboratory study of the collection efficiency of submicron aerosol
particles by cloud droplets – Part I: Influence of relative humidity
Alexis Dépée1,2 , Pascal Lemaitre1 , Thomas Gelain1 , Marie Monier2,3 , and Andrea Flossmann2,3
1 Institut
        de Radioprotection et de Sûreté Nucléaire (IRSN), PSN-RES, SCA, Gif-sur-Yvette, 91192, France
2 Université
           Clermont Auvergne, Laboratoire de Météorologie Physique, Clermont-Ferrand, France
3 CNRS, INSU, UMR 6016, LaMP, Aubière, France

Correspondence: Pascal Lemaitre (pascal.lemaitre@irsn.fr)

Received: 6 August 2020 – Discussion started: 26 August 2020
Revised: 1 February 2021 – Accepted: 26 February 2021 – Published: 6 May 2021

Abstract. A new In-Cloud Aerosol Scavenging Experiment              1   Introduction
(In-CASE) has been conceived to measure the collection effi-
ciency (CE) of submicron aerosol particles by cloud droplets.       Every year, several billion tonnes of particulate matter are
In this setup, droplets fall at their terminal velocity through a   emitted in the atmosphere, originating mainly from oceans,
1 m high chamber in a laminar flow containing aerosol par-          soils, gas-to-particle conversion, evaporating clouds and
ticles. At the bottom of the In-CASE chamber, the droplet           from human activities (Jaenicke, 1993). During the last
train is separated from the aerosol particle flow – droplets are    decades, the life cycle of these aerosol particles (APs) has
collected in an impaction cup, whereas aerosol particles are        been a key topic in atmospheric science for many reasons.
deposited on a high-efficiency particulate air (HEPA) filter.       First, APs play a key role in weather and climate. They act
The collected droplets and the filter are then analysed by flu-     on cloud formation, and their chemical composition, size dis-
orescence spectrometry since the aerosol particles are atom-        tribution and number concentration affect the droplet size
ised from a sodium fluorescein salt solution (C20 H10 Na2 O5 ).     distributions and precipitation (Tao et al., 2012). They also
In-CASE fully controls all the parameters which affect the          have an impact on the cloud cover, which in turn modulates
CE – the droplets and aerosol particles size distributions are      albedo (Twomey et al., 1974) – influencing the Earth’s en-
monodispersed, the electric charges of droplets and aerosol         ergy budget. Moreover, anthropogenic APs have also been
particles are controlled, and the relative humidity is indi-        reported to impact human health (Dockery et al., 1992). In
rectly set via the chamber’s temperature. This novel In-CASE        fact, the Great Smog of London in 1952, one of the best-
setup is presented here as well as the first measurements           known related events, caused up to 12 000 deaths (Bell et
obtained to study the impact of relative humidity on CE.            al., 2004). Radioactive material released from a nuclear ac-
For this purpose, droplets and particles are electrically neu-      cident is another AP pollution hazard. Indeed, many studies
tralised. A droplet radius of 49.6 ± 1.3 µm has been consid-        revealed that radioactive material like caesium-137 isotopes
ered for six particle dry radii between 50 and 250 nm and           can attach to the atmospheric APs and were transported over
three relative humidity levels of 71.1 ± 1.3 %, 82.4 ± 1.4 %        long distances on a continental scale both after the Chernobyl
and 93.5 ± 0.9 %. These new CE measurements have been               (Devell et al., 1986; Jost et al., 1986; Pölläen et al., 1997) and
compared to theoretical models from literature which ade-           the Fukushima (Kaneyasu et al., 2012; Adachi et al., 2013)
quately describe the relative humidity influence on the mea-        nuclear accidents in 1986 and 2011, respectively. With a half-
sured CE.                                                           life of up to 10 years, caesium-137 can remain for decades in
                                                                    the atmosphere – following resuspension cycles of the atmo-
                                                                    spheric APs – and jeopardise both ecosystems and human
                                                                    health.

Published by Copernicus Publications on behalf of the European Geosciences Union.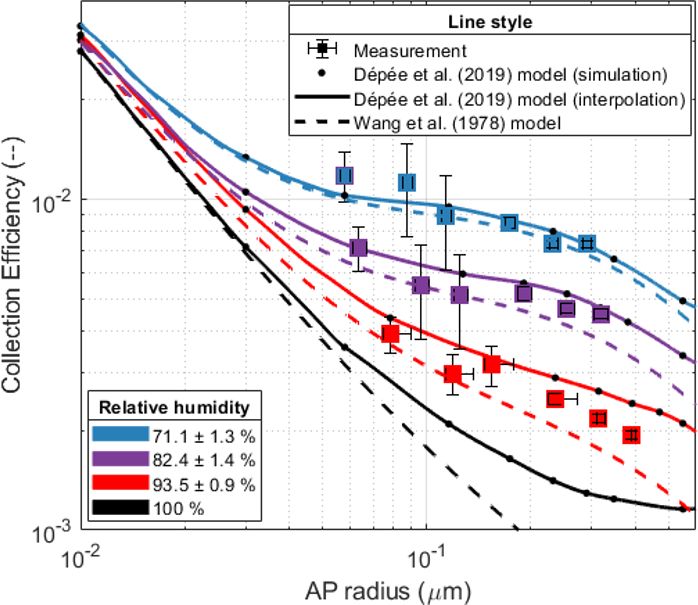
6946                                                                            A. Dépée et al.: Influence of relative humidity

   Thus, it is essential to understand the two mechanisms           the CE increase when evaporation occurs and decrease CE
which move atmospheric APs back to the ground. APs can              during condensation (due to a thermal equilibrium between
settle through many effects like gravity, wind, surface forces      the droplet and the air). Thermophoresis exists when a ther-
and turbulence. This is referred to as dry AP deposition.           mal gradient prevails between the air and the droplet. When
There is also the wet AP deposition due to the interactions         the relative humidity (RH) is below 100 %, the evaporat-
between APs and clouds or their precipitations. The present         ing droplet’s surface temperature (Td,s ) is colder than the
paper deals with the wet removal since, far away from the           bulk air temperature (Tair ). The average kinetic energy of air
source, it is the main mechanism involved in the AP scav-           molecules is then decreasing when approaching the droplet’s
enging (Jaenicke, 1993). Note that Flossmann (1998) numer-          surface. An AP is thus attracted by a thermophoretic force
ically showed that the wet deposition is mainly induced by          near the evaporating droplet (see Fig. 1f) caused by the asym-
the in-cloud AP collection since 70 % of the AP mass con-           metry in kinetic energy transferred during each collision.
tained in raindrops reaching the soil comes from the cloud.         Diffusiophoresis occurs in an environment where a gradient
This result is consistent with the environmental measure-           of vapour density in the air exists such as in the surround-
ments of Laguionie et al. (2014), who evaluated the cloud           ing of an evaporating droplet. In this case, water molecules
contribution up to 60 % in the wet AP deposition. The in-           diffuse toward the surrounding air while the air molecules
cloud AP scavenging is subdivided into two mechanisms –             diffuse toward the droplet surface. In clouds, since the water
AP activation to form cloud hydrometeors and AP collection          molar mass is lower than the air molar mass, there is an asym-
by clouds hydrometeors. The in-cloud AP collection is there-        metry in the momentum transferred to APs close to the evap-
fore a fundamental climate, weather and health issue. In most       orating droplet produced by collisions with the molecules
of current AP wet removal models – like DESCAM (Detailed            from the continuous phase. This diffusion tends to attract the
Scavenging Model, Flossmann, 1985) – the AP collection is           AP to the droplet. Nonetheless, in order to maintain a con-
described through a microphysical parameter called “collec-         stant air pressure at the droplet surface, a hydrodynamical
tion efficiency” (CE), which quantifies the ability of a droplet    flow directed toward the air is induced – this is the Stefan
to capture the APs present in its surroundings during its fall.     flow. The hydrodynamical drag induced by the Stefan flow
It is the ratio between the AP number (or mass) collected by        tends to repulse APs from an evaporating droplet. Diffusio-
the droplet over the AP number (or mass) within the volume          phoresis is the sum of the drag force produced by the Stefan
swept by the droplet for a given AP radius. Another equiv-          flow and the momentum transferred to APs (located in a dif-
alent definition is the ratio of the cross-sectional area inside    fusion boundary layer), due to the dissymmetry of molecular
which the AP trajectories are collected by the droplet over         weight. Note that the Stefan flow (repulsive around an evapo-
the cross-sectional area of the droplet.                            rating cloud droplet) is on average 5 times larger than the ad-
   Many microphysical effects influence this CE, and their          dition to the diffusion flows (attractive around an evaporating
contribution is mainly dependent on the AP size. To be col-         cloud droplet) as mentioned by Santachiara et al. (2012). So,
lected an AP has to deviate from the streamline around the          diffusiophoresis repulses APs from the evaporating droplet
falling droplet to make contact with it. The nanometric AP’s        (see Fig. 1d), which in turn decreases the CE. Finally, since
trajectory is affected by the collisions with air molecules –       the amplitude of the thermophoresis is on average twice as
referred to as the Brownian diffusion. It results in random         large as the diffusiophoresis (Tinsley et al., 2006), APs are
movement patterns (see Fig. 1a) which tend to increase the          ultimately attracted toward droplets in subsaturated air due to
CE when the AP radius decreases. For massive APs, there is          these phoretic effects (see Fig. 1e). Thus, the coupling of the
an increase in CE as they retain an inertia strong enough to        thermophoresis and diffusiophoresis increases the CE when
deviate significantly from the streamline when it curves and        the relative humidity decreases.
to move straight toward the droplet surface – known as iner-           The influence of the relative humidity on the CE is de-
tial impaction (see Fig. 1b). When considering intermediate         scribed by the well-known Wang et al. (1978) model, which
AP size, the CE goes through a minimum value called the             is used in many cloud models like DESCAM (Flossmann,
“Greenfield gap” (Greenfield, 1957) where the AP diffusion          1985). Since their model predicts an important contribution
and inertia are weaker. In this gap, other microphysical ef-        of thermophoresis and diffusiophoresis on the CE for cloud
fects can be involved to make the droplet encounter the AP,         droplet radii (A < 100 µm) and submicron AP radii, it is de-
like the interception for instance. It is the collection of APs     sirable to validate those theoretical CEs through experiments.
following a streamline that approaches the droplet within a         A review of available CE measurements can be found in
distance equivalent to the particle radii (a) – see Fig. 1c. Note   Ardon-Dryer et al. (2015). The only experimental study that
that the electrostatic forces can have a significant influence      tackles the influence of the relative humidity on the CE for
on the CE (Tinsley and Zhou, 2015; Dépée et al., 2019). This        cloud droplets is the one of Ardon-Dryer et al. (2015), which
effect will be discussed in a companion paper (Dépée et al.,        tested two levels of relative humidity of 15 % and 88 %.
2021) of this work.                                                 However, in their work they report that the measured electric
   There are also thermophoretic and diffusiophoretic effects       charge on the droplets were 400 ± 400 elementary charges,
which can influence the CE. In clouds, they shall favour            and on the APs they were 1 elementary charge. Therefore,

Atmos. Chem. Phys., 21, 6945–6962, 2021                                              https://doi.org/10.5194/acp-21-6945-2021
A. Dépée et al.: Influence of relative humidity 6947
the electrostatic forces should have had a significant influ- AP flow which leaves the chamber toward a high-efficiency
ence on the measured CE for the droplet radius considered particulate air (HEPA) filter.
(A ≈ 21.6 µm) as numerically shown by Tinsley and Zhou The relative humidity in the collision chamber is set
(2015). Furthermore, there are no similar measurements for through the temperature, with the latter being controlled via
other cloud droplet sizes either for high levels of relative hu- a cooling system. In the next sections, the In-CASE chamber
midity as found in cloud. as well as the droplets and AP characterisation are described.
The purpose of this work is to fill up the deficiency of data
in this area. Thus, a novel experiment has been developed in 2.2 In-CASE chamber
order to study the influence of the relative humidity on the
CE to assess the magnitude of the thermophoretic and dif- The In-CASE chamber (see Fig. 2) is subdivided into three
fusiophoretic processes. With this experiment, the influence stages – the injection head, the collision chamber and the In-
of electric charges can also be investigated, and this is the CASE chamber’s bottom part. These three parts will be de-
objective of the companion paper (Dépée et al., 2021). tailed in the next subsections.
After the introduction, the experimental setup is detailed,
while the experimental method to evaluate the CE and the 2.2.1 Injection head
uncertainties are described in Sect. 3. Section 4 is dedicated
The injection head is composed of two parts – the droplets
to the new CE measurements which are presented and com-
and the AP injection. The upper part is used to inject the
pared to theoretical data from the Wang et al. (1978) Eule-
droplets while the APs are injected in the second part about
rian model. Another comparison is made in the last section
10 cm below. This distance is required to measure the droplet
to the newer Lagrangian model of Dépée et al. (2019) since
size through the two facing windows (see Sect. 2.4.1) but also
it can model every microphysical effect involved in the AP
to let droplets decelerate and reach their terminal velocity.
collection by cloud droplets (like Brownian motion, inertial
The droplet train is injected through a housing made with
impaction and interception) and especially their coupling.
a 3D printer set at the top of the droplet injector (see Fig. 3).
Dépée et al. (2019) focused on the electrostatic forces but
This housing has been constructed to precisely place the
did not consider the thermophoresis and the diffusiophore-
droplet generator and the electrostatic inductor together. In-
sis. Here, we extend the Dépée et al. (2019) model by adding
deed, the electrostatic inductor has to keep the same posi-
these phoretic effects. Finally, this study experimentally val-
tion relative to the droplet generator to prevent changes in
idates the Dépée et al. (2019) model, which provides consis-
the electric field Eind , which in turn can disturb the droplet
tent theoretical CEs for a convenient incorporation in cloud
charge and stop the neutralisation (detailed in Sect. 2.4.2).
models, pollution models, climate models and so forth.
The APs are injected from the sides of the entire circum-
ference through a flat torus inlet. This injection principle is
based on the CLINCH experiment (CoLlision Ice Nucleation
2 Experimental setup CHamber, Ladino et al., 2011), which ensures a laminar flow
and a great spatial APs mixture in the collision chamber’s
2.1 Overview
inlet.
All measurements were conducted inside the In-Cloud 2.2.2 In-CASE bottom stage
Aerosol Scavenging Experiment (In-CASE). Figure 2 shows
the airflow diagram with the different parts of the experi- The CE is calculated from the AP mass collected by the
ment in order to study the relative humidity influence on the droplets during an experiment and the average AP mass con-
CE. The major In-CASE component is the collision chamber centration in the collision chamber. To obtain these quanti-
(Fig. 2) where a laminar flow containing APs interacts with a ties, the droplet train must be separated from the interstitial
train of droplets falling at terminal velocity. In this chamber, APs (which were not collected).
the droplet and AP size distributions are monodispersed, and
for this particular work the droplet and AP electric charges AP and droplet separation
are neutralised. Droplets are generated through a piezoelec-
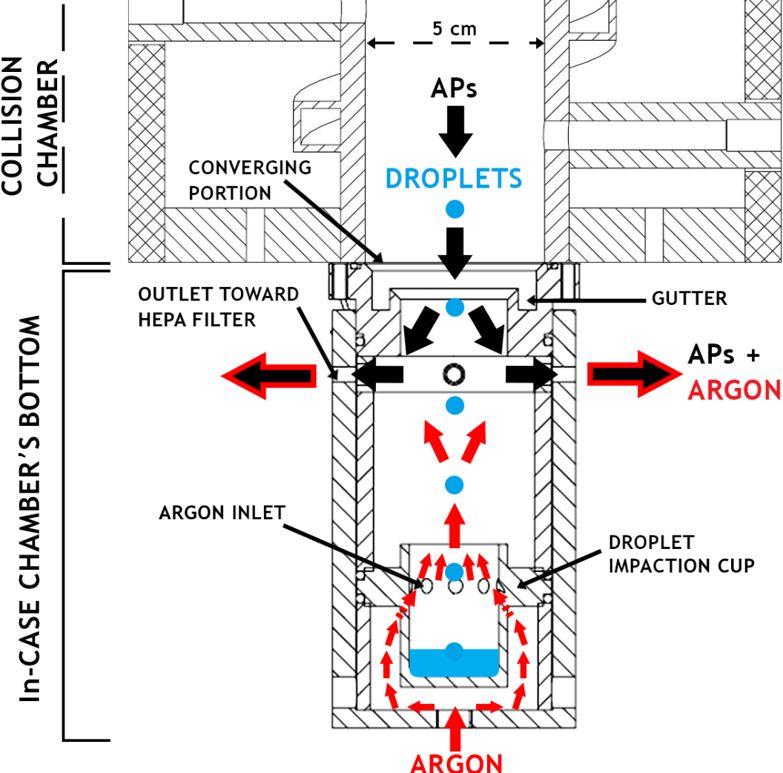
tric inductor and neutralised with an electrostatic inductor The system developed to separate the droplet train from the
(detailed in Sect. 2.4), and the radius is measured by optical AP flow is presented in Fig. 4. It is composed of a converg-
shadowgraphy with a strobe and a camera (brown, Fig. 2). In ing portion (from 5 to 3 cm in diameter) where a gutter is
Fig. 2, orange shows the AP generation (which is described inserted to prevent the water condensed on the wall from en-
in Sect. 2.3), black shows an exhaust used to evacuate the AP tering to the In-CASE chamber bottom. The APs are directly
flow rate surplus at the atomiser’s outlet, red shows an Argon vacuumed toward a HEPA filter (see Fig. 2) at the upper part
flow injected into the In-CASE chamber’s bottom part to sep- of the separator through four outlets while the droplets – con-
arate droplets from the AP flow (this is detailed in “AP and taining collected APs – are impacted into a cup at the sepa-
droplet separation” in Sect. 2.2.2) and purple indicates the rator’s lower part.
https://doi.org/10.5194/acp-21-6945-2021 Atmos. Chem. Phys., 21, 6945–6962, 2021
6948 A. Dépée et al.: Influence of relative humidity
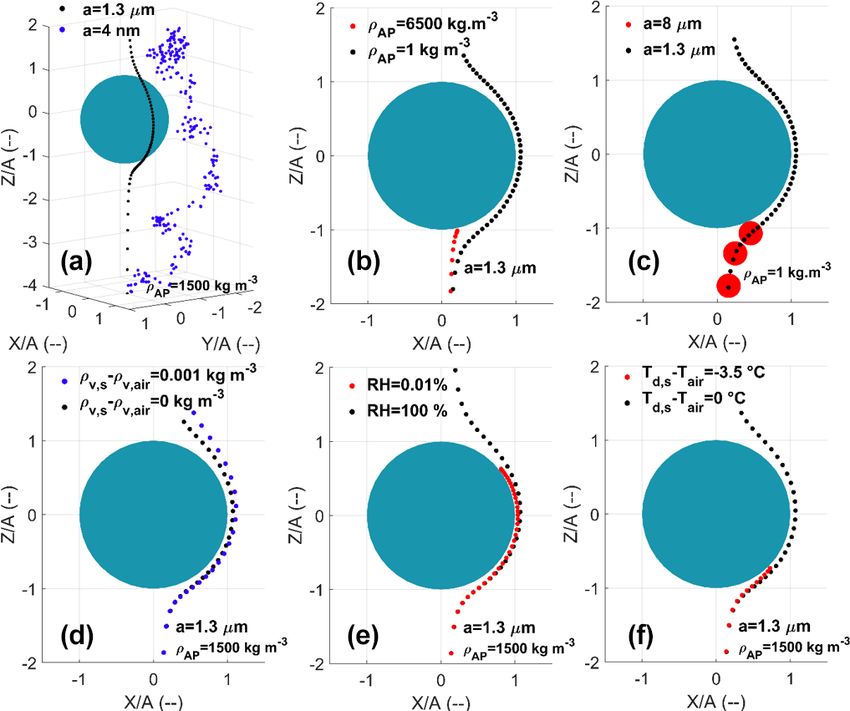
Figure 1. AP trajectories computed with the extended Dépée et al. (2019) model for a 50 µm droplet radius (A) and AP with various radii
(a) and densities (ρAP ). The air temperature (Tair ) and the air pressure (Pair ) are −17 ◦ C and 540 hPa respectively. The panels indicate the
effects of Brownian motion (a), inertial impact (b), interception (c), diffusiophoresis (d), combined thermophoresis and diffusiophoresis (e),
and thermophoresis (f). Red trajectories result in an AP collection. (d, f) The gradients are equivalent to a relative humidity of 0.01 % (when
there is no gradient the equivalent relative humidity is 100 %). ρv,s and ρv,air are the vapour densities at the droplet surface and in the bulk
air, respectively.
To prevent AP pollution in the droplet impaction cup, impaction cup, and no fluorescein was detected. Thus, no AP
a counterflow is injected below the In-CASE chamber and had settled on the droplet impaction cup during the experi-
passes through the droplet impaction cup from nine holes set ment.
on its entire circumference. Since the counterflow is injected The second test was to ensure that droplets were collected
at the laboratory temperature, and the AP downward flow is by the impaction cup. Then, In-CASE was again run like
colder, Argon – denser than the air – was selected to avoid a typical experiment except the flow passing through the
any Rayleigh–Taylor instability (Sharp, 1983). In-CASE chamber was clean air without any AP. Droplets
Argon is injected at 0.4 L min−1 . The diameter of the nine were tracked by adding sodium fluorescein salt in the wa-
holes is 4 mm, and the top of the droplet impaction cup is ter supplying the piezoelectric injector. Since the concentra-
2.5 cm. Thus, the upward Argon flow is injected at 5.9 and tion of sodium fluorescein salt in the water, the droplet gen-
1.4 cm s−1 , through the nine holes and the top of the im- eration frequency, the droplet size and the experiment time
paction cup, respectively. Because the droplet velocity is were known, the goal was to verify if the expected fluores-
about 25 cm s−1 (for the 50 µm droplet radius studied) and cein mass in the droplets and the actual measured fluorescein
the AP terminal velocity is less than 10−3 cm s−1 , APs can- mass were equal. After 5 h (= 450 000 injected droplets), a
not settle into the impaction cup, whereas droplets are im- discrepancy of 2 % between expected and measured fluores-
pacted without undue disruption. cein mass was obtained. Therefore, all droplets are consid-
ered impacted in the impaction cup.
Validation Finally, this indicates that the AP mass detected in the
droplet impaction cup after the experiment effectively results
The droplet and AP separation were verified with two tests. from collection by drops in the In-CASE collision chamber
First, In-CASE was run under standard experimental condi- and not from contamination from other sources.
tions except no droplets were generated. After 5 h of exper-
iment, a spectrometry analysis was performed in the droplet
Atmos. Chem. Phys., 21, 6945–6962, 2021 https://doi.org/10.5194/acp-21-6945-2021
A. Dépée et al.: Influence of relative humidity                                                                                   6949

Figure 2. In-CASE setup to study the influence of relative humidity.
                                                                        Figure 4. View of the In-CASE chamber’s bottom – AP and droplet
Colours represent different functions. Red represents upward Argon
                                                                        separation.
flow against AP pollution in the droplet impaction cup. Purple rep-
resents AP (and Argon) evacuation toward the HEPA filter. Orange
represents AP, generation, selection and neutralisation. Black repre-
sents surplus evacuation and differential mobility analyser (DMA)       top of the collision chamber. The pressure (Pair ), tempera-
flow rate control. Brown represents droplet radius measurement. All     ture (Tair ) and relative humidity (RH) are measured at the top
the key features of the setup are detailed in Table 2.                  and the bottom by sensors. To clean the chamber, water or
                                                                        compressed dried air is injected via a purge. Three sampling
                                                                        points are available but were not used for these experiments.
                                                                           The temperature and the relative humidity discrepancies
                                                                        between top and bottom were respectively less than 1 ◦ C and
                                                                        4 % in all the CE measurements – the mean values are then
                                                                        considered for both parameters.

                                                                        Thermodynamic conditions

                                                                        All the experiments were conducted at atmospheric pressure.
                                                                        To get comparable CE measurements, the temperature has
                                                                        been set to 0.58 ± 0.50 ◦ C – as constant as possible between
                                                                        experiments. Three levels of relative humidity (RH) were
                                                                        considered – 71.1 %, 82.4 % and 93.5 %. To increase the rel-
                                                                        ative humidity at a given collision chamber temperature, the
                                                                        temperature of the pure water in the humidifier (Fig. 2) was
                                                                        increased. The relative humidity level of 71.1 % was obtained
                                                                        by completely removing the humidifier to get the driest AP
Figure 3. View of the In-CASE chamber’s top with the injection          flow possible at the collision chamber’s inlet. At lab temper-
head where APs and droplets are injected into the collision chamber.    ature (about 22 ◦ C), the relative humidity of the dry AP flow
                                                                        ranged from 10 % to 20 % at the In-CASE chamber inlet.
                                                                           Note that the AP flow before the injection head is also ther-
2.2.3   Collision chamber                                               mally set to inject APs with the same temperature as in the
                                                                        collision chamber.
The collision chamber is a 1 m stainless steel cylinder with
an inner diameter of 5 cm (see Fig. 5). The collision cham-
ber’s temperature is controlled through a coolant which spi-
rally circulates outside the chamber, from the bottom to the

https://doi.org/10.5194/acp-21-6945-2021                                                 Atmos. Chem. Phys., 21, 6945–6962, 2021
6950                                                                            A. Dépée et al.: Influence of relative humidity

                                                                   Figure 6. Growth factor (GroF) as function of the given relative
                                                                   humidity (RH). Data points (dots) from Quérel et al. (2014) and fits
                                                                   (lines) with the kappa theory (Petters and Kreidenweis, 2007).

                                                                   to relative humidity levels below 90 %, the kappa theory de-
                                                                   scribed in Petters and Kreidenweis (2007) is used to extrapo-
                                                                   late to the required values. To fit the measurements of Quérel
                                                                   et al. (2014) with the kappa theory, only their data with a rel-
                                                                   ative humidity level less than 85 % were considered. Figure 6
                                                                   shows the AP growth factor related to the relative humidity
                                                                   for a kappa value of 0.23 and two extreme values of 0.2 and
                                                                   0.27 – fitting to the sodium fluorescein salt hygroscopicity.
Figure 5. In-CASE collision chamber – 2D section plane.               Thus, for relative humidity levels of 71.1 %, 82.4 % and
                                                                   93.5 % studied here, a dry AP radius of 50 nm selected by the
                                                                   differential mobility analyser (DMA) grows with a growth
Droplet evaporation                                                factor (GroF) of 1.16, 1.27 and 1.57, respectively. Conse-
                                                                   quently, the CEs measured are applied for size of respectively
The change in droplet radius due to evaporation in the col-        58.0, 63.5 and 78.5 nm AP radii.
lision chamber is calculated according to the Sect. 13.2              Note that the AP density is not the one of sodium fluores-
of Pruppacher and Klett (1997). The corresponding termi-           cein salt (ρfluorescein = 1580 kg m−3 ) since APs contain wa-
nal velocity (UA,∞ ≈ 25 cm s−1 ) is computed from Beard            ter. Indeed, the water density (ρwater ) should be considered in
(1976). The residence time of the droplet in the chamber           the AP density (ρAP ) calculation. At a given relative humid-
(≈ 4 s) is computed considering these two changes. Since the       ity (RH), the AP density inside the chamber is then deduced
droplet radius only decreases around 3 % by evaporation with       by Eq. (1):
the lower relative humidity considered in the experiments
(71.1 %), the droplet evaporation in the collision chamber is                     ρfluorescein + ρwater × GroF(RH)3 − 1

neglected.                                                         ρAP (RH) =                                              .    (1)
                                                                                                  GroF(RH)3
AP hygroscopicity                                                     Since the relative humidity after the dryer (see Fig. 2)
                                                                   ranges from 10 % to 20 %, the AP growth factor is less than
The APs are composed of pure sodium fluorescein salt,              1.02 (see Fig. 6) in the DMA. APs are then considered dry
which is a high hygroscopic chemical compound. The APs             when exiting the DMA.
inside the collision chamber then grow to reach their equilib-
rium size with the relative humidity (RH). In order to evalu-      2.3   AP generation
ate the increase in size by humidification, the AP growth fac-
tor (GroF) measured in Quérel et al. (2014) was considered.        APs are generated by the atomisation (atomiser, TSI 3076)
The growth factor is defined as the ratio of the size of the wet   of a sodium fluorescein salt solution (C20 H10 Na2 O5 ). This
AP over the size of the dry AP. Since their data are limited       molecule has been selected for its significant fluorescent

Atmos. Chem. Phys., 21, 6945–6962, 2021                                               https://doi.org/10.5194/acp-21-6945-2021
A. Dépée et al.: Influence of relative humidity                                                                               6951

properties, detectable at very low concentrations (down to        applied to evaluate the droplet radii in the recorded pictures.
10−10 g L−1 ). Once atomised, the fine droplets go through        An example is given in Fig. 8 (right) for a 49.7 µm droplet ra-
a dry diffuser to produce dry APs. In Fig. 7, two AP size         dius. Note that the size distributions of the droplets generated
distributions are presented for two different concentrations      by the piezoelectric injector are considered monodispersed
of the sodium fluorescein salt solution considered – 36 and       since the droplet size dispersion is very low (σ ∼ 1 %).
100 g L−1 – during the experiments. Those two size distri-
butions have been evaluated using a scanning mobility par-        2.4.2   Droplet charge neutralisation
ticle sizer (SMPS). It was observed that the size distribution
mode passes from 41 to 67.9 nm in radius when the concen-         It is well know that the piezoelectric droplet generator pro-
tration becomes 3 times larger. Since the geometric standard      duces highly electrically charged droplets. With a similar de-
deviation (σg ) is above 1.75, a differential mobility analyser   vice, Ardon-Dryer et al. (2015) measured up to 104 elemen-
(DMA; TSI 3080) is set between the atomiser and the In-           tary charges on the generated droplets. Since this paper fo-
CASE chamber to reduce the dispersion of the AP size dis-         cused only on the relative humidity influence, the droplets,
tribution. After exiting the DMA, the AP flow goes through        as well as APs, must be neutralised.
a low-energy X-ray neutraliser (< 9.5 keV, TSI 3088) so that         To do so, an electrostatic inductor was built following
the AP charge distribution entering the In-CASE chamber is        Reischl et al. (1977). Two parallel metal plates are placed at
similar to a Boltzmann distribution. After the neutralisation,    the droplet generator’s nozzle – this is the electrostatic induc-
the dry AP flow is humidified by a pure water container in        tor shown in Fig. 9 (labelled 1, left). One plate is connected
order to get high relative humidity in the collision chamber.     to a potential (Vind ) while the other is connected to the neu-
   Note that the DMA selects APs according to their elec-         tral potential – as presented in Fig. 9 – in order to induce
trical mobility – Z in Eq. (6) – assuming that only single        an electric field (Eind ∼102 –103 V m−1 ). Sodium chloride is
charged APs can leave the DMA. Actually, depending on the         added to the pure water that feeds the piezoelectric injector.
AP size distribution and the AP flow rate in the DMA, larger      According to the generated electric field polarity, the system
AP radii carrying multiple charges than the one considered        can selectively attract negative or positive ions toward the
can also be selected. Sometimes those multiple charged APs        nozzle where the droplet is formed. If Vind is positive, the
cannot be neglected as discussed in Sect. 3.2.                    negative chloride ions (Cl− ) migrate toward the nozzle and
                                                                  the positive sodium ions (Na+ ) are repulsed from the nozzle
2.4     Droplet characterisation                                  and inversely if the potential is negative. Following the elec-
                                                                  tric field amplitude – through Vind – the ion quantity can be
2.4.1    Droplet generation frequency and size                    set. This system can conclusively control the droplet charge.
         measurement                                              Note that the sodium chloride concentration has no effect on
                                                                  the principle of induction used here since the ion number is
The droplet generator used for these experiments is a piezo-      large enough for the entire experiment period (Reischl et al.,
electric injector provided by Microfab – the MJ-ABL-01            1977) – 3.3 g L−1 has been considered.
model with an internal diameter of 150 µm. This model                To evaluate the droplet charge and then neutralise the
has been used for its stability over time, since the exper-       droplets, an ex situ experiment has been conducted where
iments can last up to 5 h. This piezoelectric injector gen-       the droplet train passed through a capacitor (labelled 2,
erates droplets – at a given frequency – above their termi-       Fig. 9, left). One capacitor’s plate is connected to the neu-
nal velocity. The distance between two following droplets         tral, whereas the other is connected to a high potential (Vcap )
reduces when droplets fall away from the injector’s nozzle        – inducing an electric field (Ecap ∼105 –106 V m−1 ). A Fara-
since the droplet velocity decreases (see Fig. 8, left). It was   day cage surrounding the capacitor and a plate maintained at
emphasised during ex situ experiments that droplet gener-         a neutral potential are set in order to prevent the electric field
ation frequencies greater than 25 Hz induce droplet coales-       at the capacitor (Ecap ) from disturbing the electric field at
cence since the inter-droplet space becomes too short to pre-     the inductor (Eind ), which could change the droplet charge.
vent droplets from aerodynamically disturbing each other.         Finally, the potential Vind which electrically neutralises the
This agrees with Ardon-Dryer et al. (2015), who observed          droplet is found by selecting for the Vind value which min-
droplet coalescence for droplet generation frequency larger       imises the droplet train deflection.
than 30 Hz operating a similar piezoelectric injector. Thus,         Actually, this system can also be used to precisely evalu-
droplets were generated at 25 Hz in all experiments presented     ated the electric charges on the droplets (for both polarities);
in this current paper.                                            this method is applied and presented in Dépée et al. (2021).
   The droplet generator is placed at the top of the In-CASE         Note that the droplet charge induced by the piezoelectric
collision chamber, within an injection head (see Fig. 3). A       injector has been calculated to −8400 elementary charges –
few times during an experiment, droplet pictures are recorded     in line with Ardon-Dryer et al. (2015) using a similar genera-
by optical shadowgraphy through two facing windows in the         tor. Moreover, after the droplet neutralisation, an uncertainty
injection head (see Fig. 3). A circle Hough transform is then     of 600 elementary charges was estimated.

https://doi.org/10.5194/acp-21-6945-2021                                           Atmos. Chem. Phys., 21, 6945–6962, 2021
6952                                                                                  A. Dépée et al.: Influence of relative humidity

Figure 7. Two typical AP size distributions obtained with a SMPS at the atomiser’s outlet. The concentration of the sodium fluorescein salt
solution is 36 g L−1 (a) and 100 g L−1 (b). Dmax and D50 % are respectively the maximum diameter selected by the DMA and the cut-off
diameter of the impactor at the DMA’s inlet, at a given AP flow rate (0.6 L min−1 ).

Figure 8. (Left) Droplet train at the piezoelectric injector’s out-
let obtained by optical shadowgraphy – the droplet generating fre-      Figure 9. (Left) 1 – Electrostatic inductor set at the piezoelectric
quency is 200 Hz. (Right) A droplet picture obtained by optical         injector’s nozzle to electrically neutralise the droplets. 2 – Capacitor
shadowgraphy – the droplet radius and centre are detected through       used to analyse the droplet deviation caused by the electric field
a circle Hough transform (red cross and line).                          in the capacitor (Ecap ). (Right) Housing made with a 3D printer
                                                                        containing the piezoelectric injector and the electrostatic inductor,
                                                                        set in the injection head (see Fig. 3).
3     Data analysis

3.1    Definition of the collection efficiency
                                                                           Fd and 1t are respectively the droplet generation fre-
At the end of an experiment, the collection efficiency (CE) is          quency and the experiment duration – the product of those
calculated from Eq. (2):                                                two quantities is the number of droplets injected during an
                    mAP,d                                               experiment. Cm,AP is the mean AP mass concentration in the
CE(a, A, HR) =                  ,                              (2)      In-CASE collision chamber. Note that a is the AP dry radius
                  mAP,available
                                                                        corrected by the growth factor (GroF) which depends on the
where the AP mass collected by all droplets (mAP,d ) is di-             relative humidity (see “AP hygroscopicity” in Sect. 2.2.3).
rectly measured by spectrometry analysis in the droplet im-             Heff is the effective height of interaction between droplets
paction cup (see Fig. 4), while the mass of available APs in            and APs. Since the APs are also falling in the In-CASE colli-
the volume swept by the droplets (mAP,available ) is given by           sion chamber, this height is not the In-CASE collision cham-
Eq. (3):                                                                ber’s height (HIn-CASE ) but is equal to Eq. (4):

mAP,available = π (A + GroF(RH) × a)2 × Fd                                         UA,∞
× 1t × Heff × Cm,AP .                                          (3)      Heff =             HIn-CASE .                                       (4)
                                                                                 UA,∞ + VQ

Atmos. Chem. Phys., 21, 6945–6962, 2021                                                     https://doi.org/10.5194/acp-21-6945-2021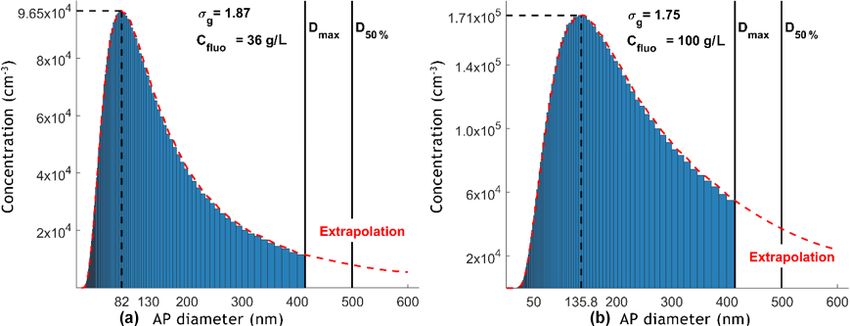
A. Dépée et al.: Influence of relative humidity                                                                                   6953

   However, as the droplet terminal velocity (UA,∞ ) is about      3.3     Uncertainty evaluations
25 cm s−1 and the maximum AP flow velocity (VQ ) consid-
ered in the In-CASE collision chamber during the experiment        3.3.1    AP radius uncertainty
is 5 mm s−1 (for an AP flow rate of 0.6 L min−1 ), these two
heights are thus considered equal (Heff ∼ HIn-CASE ).              The first AP radius uncertainty is related to the AP selec-
   In Eq. (3), the mean AP mass concentration in the In-           tion by the DMA. Nevertheless, this uncertainty has been
CASE collision chamber is estimated from the fluorescence          neglected since the spectral bandwidth of the DMA is quite
spectrometry analysis of the HEPA filter though Eq. (5):           small compared to the AP radius uncertainty addressed be-
                                                                   low.
               mAP,tot
Cm,AP =                   .                               (5)         Indeed, the only significant AP radius uncertainty results
          1t × QIn-CASE,c                                          from the effective AP radius inside the In-CASE collision
   QIn-CASE,c is the AP flow rate within the In-CASE colli-        chamber due to the hygroscopicity of the APs. For the rela-
sion chamber.                                                      tive humidity levels studied (71.1 %, 82.4 % or 93.5 %), the
                                                                   extreme relative humidity levels measured in all experiments
3.2   DMA selection – multiple charged AP’s principle              are considered – for 71.1 %, the minimum and maximum val-
                                                                   ues are 69.2 % and 73.4 %, respectively. As a reminder, the
As previously stated, the AP flow travels through a DMA to
                                                                   kappa value is assumed from the Quérel et al. (2014) data and
select the particles according to their electrical mobility (Z),
                                                                   ranges from 0.2 to 0.27 (see Fig. 6). The low uncertainty for
which is defined by Eq. (6):
                                                                   the AP radius is then evaluated by considering the minimum
       n e Cu                                                      growth factor (GroF) in Fig. 6 for the lower level of relative
Z=               ,                                          (6)
      6 π ηair a                                                   humidity measured and the lower kappa value determined –
where n, Cu and ηair are respectively the number of elemen-        respectively 69.2 % and 0.2. Similarly, for the same example
tary charges (e), the Cunningham correction coefficient and        (RH = 71.1 %), the high uncertainty for the AP radius is es-
the air dynamic viscosity (expressed here in poise).               timated by evaluating the maximum growth factor – for the
   Thus, for an AP radius selected by the DMA, all parti-          maximum level of relative humidity observed and the max-
cles with the same n C   u                                         imum kappa value assumed – respectively 73.4 % and 0.27.
                       a ratio are actually selected. For ex-
ample, when an AP with a radius of 50 nm is selected (sin-         In this example, for a dry AP radius of 50 nm selected by
gle charged), the AP radii of 75.8 nm (double charged) and         the DMA, its wet radius in the In-CASE collision chamber
98.2 nm (triple charged) will also be selected and progress        is likely to be 58 nm (GroF = 1.16), ranging from 56.5 nm
into the In-CASE collision chamber since they have the same        (GroF = 1.13) to 60 nm (GroF = 1.20) resulting from the re-
electrical mobility. In this paper, “multiple charged APs” re-     spective low and high uncertainties.
fer to the APs with the same electrical mobility as those with
                                                                   3.3.2    Uncertainty of the collection efficiency
single charge selected by the DMA.
   At the DMA’s inlet, an aerodynamic impactor is placed to        Since the method of CE evaluation differs in the presence of
prevent the heaviest APs from entering the DMA. Thus, for a        multiple charged APs, the uncertainty calculation is also dif-
given AP flow rate in the DMA, the multiple charged APs can        ferent depending on the situations. The method is described
be impacted at the DMA’s inlet and can then be neglected at        in Appendix B.
the DMA’s outlet. To evaluate this case, the cut-off radius of        When there are no multiple charged APs in the AP flow,
the impactor at the DMA’s inlet must be considered (referred       the CE is directly estimated through Eq. (3), which can be
to as D50 % /2). This radius is defined as the one where 50 %      rewritten as Eq. (7):
of the APs are impacted. The Table 1 shows this parameter
for every AP flow rate used during the experiment and for                                                mAP,d
                                                                   CE(a, A, RH) =
a given selected AP radius. The double charged AP radius                              π (A + GroF(RH) × a)2 × Nd × Heff × Cm,AP
with the same electrical mobility as the selected AP radius                          mAP,d
                                                                   ≈                                 ,                             (7)
(single charged) is also indicated – when this latter size is            π A2 × N   d × Heff × Cm,AP
large enough compared to the cut-off radius, it is assumed
                                                                   where Nd is the number of injected droplets during the ex-
that there is no contribution of the multiple charged APs in
                                                                   periment. The relative CE uncertainty (uCE ) is then evaluated
the CE measurement. This is the case for a selected AP radius
                                                                   according to Lira (2002) and summarised by Eq. (8),
of 200 or 250 nm where the AP size distribution at the DMA’s
outlet can be considered purely monodispersed.
                                                                         q
                                                                   uCE = u2A + u2Heff + u2Nd + u2mAP,d + u2Cm,AP ,            (8)
   However, for a selected AP radius of 50 or 150 nm, ac-
cording to Table 1, the multiple charged AP radii cannot be        with the following.
neglected. Different experiments were run to perform a de-
convolution of their respective contributions in the final CE        – The relative uncertainty related to the droplet radius
calculation. This method is presented in Appendix A.                   measurement (uA ), which is the ratio between the stan-

https://doi.org/10.5194/acp-21-6945-2021                                               Atmos. Chem. Phys., 21, 6945–6962, 2021
6954                                                                               A. Dépée et al.: Influence of relative humidity

Table 1. AP selection parameters.

                           Selected dry AP        Double charged     AP flow rate in    Cut-off radius of the
                           radius by the DMA        dry AP radius         the DMA            impactor at the
                           (single charged)         with the same                               DMA’s inlet
                                               electrical mobility                                (D50 % /2)
                           50 nm                         75.8 nm         0.6 L min−1                   213 nm
                           150 nm                       253.7 nm         0.6 L min−1                   213 nm
                           200 nm                       348.3 nm         0.6 L min−1                   213 nm
                           250 nm                       444.3 nm         0.4 L min−1                 268.5 nm

     dard deviation and the mean droplet radius on 200 pic-                 where the relative uncertainty of the detected AP mass
     tures obtained by optical shadowgraphy. This relative                  on the HEPA filter (umAP,tot ) depends on the one on
     uncertainty is about 1 %.                                              the fluorimeter (ufluorimeter ) and the one on the dilution
                                                                            (udilution ∼ 1 %). In fact, the spectrometry analysis is
  – The relative uncertainty of the effective height of inter-              performed by diluting the AP mass on the HEPA filter
    action between droplets and APs (uHeff ), which is 4 %.                 in a 100 mL ammonia water solution at the end of an ex-
    Indeed, it has been evaluated that a maximum of 4 cm is                 periment. The relative uncertainty of the AP flow rate in
    required to assure a good AP mixing at the injection in                 the In-CASE collision chamber (uQIn-CASE,c ) is given by
    the collision chamber of 1 m height (HIn-CASE ).                        the data sheet of the constructor – about 1 %. Note that
  – The relative uncertainty of the number of droplets (uNd )               the relative uncertainty on the experiment time (u1t ) is
    which can be correlated to the droplet number effec-                    neglected since the error is approximately 1 s on an ex-
    tively impacted on the droplet impaction cup. This rel-                 periment that can last more than 5 h.
    ative uncertainty was evaluated during the validation
    of AP and droplet train separation (“Validation” in
    Sect. 2.2.2) and is about 2 %.                                   4     Results and discussions

  – The relative uncertainty of the detected AP mass in              4.1    Extension of the Dépée et al. (2019) model
    the droplet impaction cup (umAP,d ), which takes into ac-
    count the relative uncertainty related to the spectrometry       In all experiments, the droplet charge is 0 ± 600 elementary
    analysis (ufluorimeter ) and the one caused by the dilution      charges with a radius of about 50 µm. Since the AP charge
    (udilution ), Eq. (9). Indeed, at the end of an experiment       distribution is similar to a Boltzmann distribution, an AP
    the water contained in the droplet impaction cup is dried        charge of more than 5 elementary charges is thus highly
    and the residual AP mass is then dissolved in 2 mL vol-          unlikely in the radius range considered in the experiments.
    ume of ammonia water.                                            Moreover, Dépée et al. (2019) numerically evaluated the con-
                q                                                    tribution of the electrostatic forces on the CE for a droplet
    umAP,d = u2fluorimeter + u2dilution ,                   (9)      of 50 µm radius with −1000 elementary charges and 5 ele-
                                                                     mentary charges on the AP. For these extreme values, they
     where udilution is estimated at 1 % while ufluorimeter is       calculate an increase in the CE due to the electrostatic forces
     the main source of uncertainty. In fact, when the mass          by 42 % and 22 % for an AP radius of 50 and 300 nm, re-
     of AP collected by the droplet is close to the detection        spectively. Close to these two AP radii, a rise of the CE by a
     limit of the fluorimeter (about 10−15 kg in the droplet         factor of 3 and 4, respectively, is observed when the relative
     sample volume analysed), ufluorimeter is up to 30 %.            humidity goes from 93.5 ± 0.9 % to 71.1 ± 1.3 % (Fig. 10).
                                                                     Consequently, it is assumed that the contribution of the ther-
  – The relative uncertainty of the mean AP mass con-
                                                                     mophoresis and the diffusiophoresis is of first order in the
    centration in the In-CASE collision chamber (uCm,AP )
                                                                     measurements and the electrostatic forces can be neglected
    which can be evaluated, according to Eq. (5), by
                                                                     in the observed increase in CE.
    Eq. (10):
                                                                        To extend the Dépée et al. (2019) model for the ther-
              q                                                      mophoretic (F th ) and diffusiophoretic forces (F df ), the re-
    uCm,AP = u2mAP,tot + u2QIn-CASE,c + u21t
                                                                     sulting velocity at the AP location (U ∗f @p ) given by the au-
                                                                     thors (in Eq. 6) is replaced by Eq. (11):
       q
     ≈ u2mAP,tot + u2QIn-CASE,c
              q                                                                                      τAP
                                                                     U f @AP ∗ (t) = U f @AP (t) +

    umAP,tot = u2fluorimeter + u2dilution ,        (10)                                                  F buoy + F df + F th ,   (11)
                                                                                                     mAP

Atmos. Chem. Phys., 21, 6945–6962, 2021                                                 https://doi.org/10.5194/acp-21-6945-2021
A. Dépée et al.: Influence of relative humidity 6955
where F buoy is the buoyancy force, U f @AP is the fluid veloc- levels of relative humidity – Tair = 0.26, 0.27 and 1.2 ◦ C –
ity at the AP location, τAP is the AP relaxation time and mAP A = 49.3, 50.8 and 48.8 µm – from the lowest to the high-
is the AP mass. The thermophoresis and the diffusiophoresis est, respectively. For RH = 100 %, these parameters are those
which are given by Brock (1962) and Waldmann and Schmitt from Table 2.
(1966), respectively, are summarised in Eq. (12): Regarding the experimental results, it can be noted that the
influence of the relative humidity via the thermophoresis and
z
(1)
}| { diffusiophoresis contribution on the CE is of first order. For
0,74Dv Mair (ρv,air − ρv,s )fv the larger AP radii studied, the CE increases by a factor of 4
F df = −6π ηair a Cu Mwater ρair × ur
Ar ∗2 when the relative humidity passes from 93.5 % to 71.1 % –
filling up the Greenfield gap as the models predict. A slight
12π ηair a (kair + 2, 5kAP Kn) kair
F th = − decline of the contribution of these two phoretic effects is ob-
5Pair (1 + 3Kn) (2kair + kAP + 5kAP Kn) served when the AP radius decreases – with the previous fac-
(T air − Td,s )fh
tor of 4 reducing to a factor of 3 for the smaller AP radii and
ur ,
× ∗2
| Ar
{z } for the same relative humidity range (from 93.5 % to 71.1 %).
(2) Although this decrease is small, it is in line with the theory.
(12) Indeed, when the AP radius decreases the contribution of the
Brownian motion on the CE increases and starts dominating
with ur the unit vector in the radial direction from the droplet over the thermophoretic and the diffusiophoretic forces. Con-
centre to the AP centre, r ∗ the distance between the AP and sequently, the influence of the relative humidity on the CE is
droplet centres normalised by the droplet radius A, Dv the negligible for nanometric AP radii.
diffusivity of vapour, Kn the Knudsen number, Mair and Moreover, the impact of the AP size is lower than the in-
Mwater the respective air and water molar masses, and kair and fluence of the relative humidity for the experimental condi-
kAP the respective air and AP thermal conductivities. Note tions considered. Indeed, between the larger and the smaller
that the thermal conductivity of the sodium fluorescein salt is AP radii, the CE is only increased by a factor of 1.61, 1.59
considered for kAP – equal to 0.43 m kg s−3 K−1 (Al-Azzawi and 2.03 for the respective relative humidity levels of 71.1 %,
and Owen, 1984). 82.4 % and 93.5 %. A decrease in the AP size effect on the
In Eq. (12), the terms (1) and (2) represent the gradient CE is noticeable when the thermophoresis and the diffusio-
of vapour density and the thermal gradient in the air, re- phoresis contributions intensify – in other words when the
spectively. These two gradients are computed under the as- relative humidity declines. This observation is in line with
sumption that the temperature and vapour density profiles the modelling of the CE when a threshold is more and more
are spherically symmetric around the droplet (Wang et al., visible as the relative humidity decreases for the submicron
1978). Because the droplet is falling in the air, fv and fh – AP radii studied.
which are the ventilation coefficients for the vapour and the Finally, for the AP sizes and the droplet radius studied,
heat respectively (Beard and Pruppacher, 1971) – correct the both models describe relatively well the observed CE vari-
gradients since the profiles are actually disturbed by the air- ations when changing relative humidity. For the two low-
flow. est levels of relative humidity (71.1 % and 82.4 %), the CE
modelling is really close between both models since the ther-
4.2 Collection efficiency measurements and analysis mophoresis and diffusiophoresis dominate the influence on
the CE. Nevertheless, some significant discrepancies appear
In Fig. 10, the CEs are presented for the three levels of for the highest relative humidity (93.5 %), where the Dépée
relative humidity studied – 71.1 %, 82.4 % and 93.5 % – et al. (2019) extended model gives higher CE values. These
and six dry AP radii ranging from 50 to 250 nm. The nu- differences result from the Wang et al. (1978) model, which
merical values are presented in Table 3. As a reminder, does not consider dynamic effects such as AP inertia, AP
all experiments were conducted with an air temperature of weight and interception, in contrast to the extended model of
0.58 ± 0.50 ◦ C at the atmospheric pressure, the AP charge Dépée et al. (2019), which offers a complete description of
distribution is similar to a Boltzmann distribution and the the microphysical effects involved in clouds.
droplet charge is 0 ± 600 elementary charges. The droplet ra-
dius is 49.6±1.3 µm. The key features of the experiments are
summarised in Table 2. The measurements are compared to 5 Conclusions
computed efficiencies using the models described in Wang
et al. (1978) (dashed lines) as well as the extended version In-CASE (In-Cloud Aerosol Scavenging Experiment) was
of Dépée et al. (2019) (solid lines). Note that the experi- built to conduct a set of experiments quantifying the contri-
mental conditions vary a little for the CE measurements at a bution of any microphysics effects involved in the AP collec-
given relative humidity level. For the modelling, air temper- tion by falling cloud droplets. For this purpose, all parame-
ature and droplet radius are then the mean values of the three ters influencing the collection efficiency (CE) are controlled
https://doi.org/10.5194/acp-21-6945-2021 Atmos. Chem. Phys., 21, 6945–6962, 20216956 A. Dépée et al.: Influence of relative humidity
Table 2. Key features of the In-CASE setup.
Feature Numerical value
Collision chamber’s parameters
Height of the collision chamber (HIn-CASE ) 1m
Distance between droplet injection and AP injection ≈ 10 cm
Diameter of the collision chamber 5 cm
Impaction cup diameter 2.5 cm
AP flow rate in the collision chamber (QIn-CASE, c ) 0.4 or 0.6 L min−1 (following the selected AP radius)
Flow velocity in the collision chamber (VQ ) 3.4 or 5.1 mm s−1 (following the selected AP radius)
Flow rate of the upward Argon at the inlet of AP/droplet separator 0.4 L min−1
Flow rate of the upward Argon in the impaction cup 1.4 cm s−1
AP and Argon flow rate at the outlet of In-CASE chamber (toward 0.8 or 1 L min−1 (following the selected AP radius)
the HEPA filter)
Air pressure in the collision chamber (Pair ) 1 atm
Temperature in the collision chamber (Tair ) 0.58 ± 0.50 ◦ C
Relative humidity in the collision chamber (RH) 71.1 ± 1.3 %, 82.4 ± 1.4 % or 93.5 ± 0.9 %
Duration of experiments (1t) From 3 to 6 h (related to the expected AP mass in droplets)
AP’s parameters
Selected dry AP radius during experiment (a) 50, 150, 200 or 250 nm
Dry AP radii considered for the CE evaluation (AP charge at the 50 (single charged), 75.8 (double charged), 98.2 (triple charged), 150
DMA’s outlet) (single charged), 200 (single charged) and 250 nm (single or double
charged)
Growth factor of the APs (GroF) 1.16, 1.27 or 1.57
Density of sodium fluorescein (ρfluorescein ) 1580 kg m−3
Density of the wet APs (ρAP ) 1372, 1283 or 1150 kg m−3
AP terminal velocity ≤ 10−3 cm s−1 (equal to 8 × 10⁻⁴ cm s−1 for the larger selected dry AP
radius 250 nm)
AP residence time in the collision chamber ≈ 200 or 300 s (following the selected AP radius)
Total AP concentration (single and multiple charged at the From 5 × 104 cm−3 (for a selected dry AP radius of 50 nm) to 6 ×
DMA’s outlet) 103 cm−3 (for a selected dry AP radius of 250 nm)
AP charge (q) distribution Similar to Boltzmann distribution
Droplet’s parameters
Droplet radius (A) 49.6 ± 1.3 µm
Droplet generation frequency (Fd ) 25 Hz
Droplet terminal velocity (UA,∞ ) ≈ 25 cm s−1
Number of injected droplets during experiments (Nd ) From 270 000 to 540 000 (related to the expected AP mass in droplets)
Observed distance between two successive droplets ≈ 9 mm ≈ 180 droplet radii
Droplet residence time in the collision chamber ≈ 4s
Droplet charge before neutralisation (Q) −8400 elementary charges
Droplet charge after neutralisation (Q) 0 ± 600 elementary charges
Droplet evaporation between the injection and the end of ≈ 3 %, ≈ 2 % or ≈ 0.6 % for the three levels of relative humidity
the collision chamber considered
Sodium chloride concentration in the pure water 3.3 g L−1
Atmos. Chem. Phys., 21, 6945–6962, 2021 https://doi.org/10.5194/acp-21-6945-2021A. Dépée et al.: Influence of relative humidity 6957
Table 3. CE measurements for the three levels of relative humidity (RH) and the wet AP radii (awet ). The droplet radius is 49.6 ± 1.3 µm.
RH = 3.5 % RH = 82.4 % RH = 71.1 %
awet (nm) CE (–) awet (nm) CE (–) awet (nm) CE (–)
79 3.92 × 10⁻³ 64 7.15 × 10⁻³ 58 1.18 × 10⁻²
119 2.98 × 10⁻³ 96 5.52 × 10⁻³ 88 1.12 × 10⁻²
154 3.17 × 10⁻³ 125 5.16 × 10⁻³ 114 8.94 × 10⁻³
235 2.48 × 10⁻³ 191 5.20 × 10⁻³ 174 8.50 × 10⁻³
314 2.18 × 10⁻³ 254 4.69 × 10⁻³ 232 7.31 × 10⁻³
393 1.93 × 10⁻³ 318 4.51 × 10⁻³ 290 7.32 × 10⁻³
ied by Ardon-Dryer et al. (2015). Here, three levels of rela-
tive humidity were investigated – 71.1 %, 82.4 % and 93.5 %
– which are typical in-cloud conditions.
From the measurements obtained, it is clear that the rel-
ative humidity – through the thermophoretic and diffusio-
phoretic forces – significantly impacts the CE. Indeed, an in-
crease by a factor of 4 was observed for the CE when the rel-
ative humidity level declines from 93.5 % to 71.1 %. Thus, it
is quite important to consider these effects in the cloud model
since the levels of relative humidity are comparable to those
used in this study. It was also shown that for the AP size con-
sidered in the present study, the impact of the AP size on the
CE is a second-order dependency. In fact, only a doubling of
the CE was highlighted – for a relative humidity of 93.5 %
Figure 10. CE measurements for three levels of relative humidity – from the larger to the smaller AP radius considered. This
– 71.1 %, 82.4 % and 93.5 % – compared to the extended model impact of the AP size decreased when the influence of the
of Dépée et al. (2019) (solid lines) and the Wang et al. (1978) relative humidity increases.
model (dashed line). Squares are the CE measurements summarised The CEs computed with the well-established model of
in Table 3. For the modelling, air temperature and droplet radius Wang et al. (1978) as well as the new Lagrangian model de-
are then the mean values of the three levels of relative humidity – scribed in Dépée et al. (2019) and extended to phoretic ef-
Tair = 0.26, 0.27 and 1.2 ◦ C – A = 49.3, 50.8 and 48.8 µm – from fects were compared to the measurements. The agreement
the lowest to the highest, respectively. For RH = 100 %, the param- was good. Nevertheless, significant discrepancies between
eters are those from Table 2. both models were revealed for high relative humidity (in sub-
saturated air) where the relative humidity influence is weak.
This can be attributed to the fact that the model of Wang
– i.e. the AP and droplet sizes, the AP and droplet electric et al. (1978) disregards some microphysics effects such as
charges, and the relative humidity. AP weight, AP inertia and interception which have a signifi-
This study focused on the influence of relative humidity cant contribution near the Greenfield gap (Greenfield, 1957).
since the literature lacks baseline data validating the the- Thus, the extended Lagrangian model of Dépée et al. (2019)
oretical models of CE implemented in cloud, climate and offers a more appropriate estimation of the CE.
pollution models. Indeed, only the work of Ardon-Dryer In this study, the electrostatic effects were not considered.
et al. (2015) is dedicated to investigate the CE variation However, Dépée et al. (2019) have shown an impact of sev-
for two levels of relative humidity and cloud droplet sizes eral orders of magnitude on the CE, especially considering
(A ≤ 100 µm). Nevertheless, for the droplet radius consid- the electric charges of cloud droplets and radioactive APs.
ered, the authors conclude that the electrostatic forces could Then, it is essential to investigate the AP collection by clouds
have played a key role on their CE measurements, since the due to the electrostatic forces – referred to as “electroscav-
APs and droplets are charged, however slightly. enging”. Up to now, the analytical expression of the electro-
In the new measured CE dataset that is presented here, the static forces – based on the image charge theory developed by
APs and droplets are neutralised. There is no significant re- Jackson (1999) – has never been experimentally validated or
maining electrostatic effect considering the maximum resid- at least emphasised. Consequently, In-CASE was also used
ual AP and droplet charges for the droplet radius examined to study the influence of the droplet and AP charge on CE
(A = 49.6±1.3 µm), which is twice as larger as the one stud- which is addressed in a second paper (Dépée et al., 2021).
https://doi.org/10.5194/acp-21-6945-2021 Atmos. Chem. Phys., 21, 6945–6962, 2021You can also read