Influence of solar activity changes on European rainfall - Eike
←
→
Page content transcription
If your browser does not render page correctly, please read the page content below
Influence of solar activity changes on European rainfall
                          Ludger Laurenza, Horst-Joachim Ludeckeb, Sebastian Luningc,1

a Independent Researcher, Münster, Germany
b University of Applied Sciences HTW, Saarbrücken, Germany
c Institute for Hydrography, Geoecology and Climate Sciences, Hauptstraße 47, 6315, Ägeri, Switzerland

      Non layout-version of Laurenz et al., 2019, Journal of Atmospheric and Solar-Terrestrial
                                    Physics 185 (2019) 29-42

Abstract
European hydroclimate shows a high degree of variability on every time scale. The variability is controlled by
natural processes such as Atlantic ocean cycles, changes in solar activity, volcanic eruptions and
anthropogenicfactors. This contribution concentrates on the solar influence on European precipitation, a
relationship which has been documented by a large body of published case studies. Here we are concentrating
on the period 1901–2015 for which we compare sunspot data with monthly precipitation series of 39 European
countries by calculating Pearson correlation coefficients for a multi-year cross-correlation window. The
coefficients have been mapped out across Europe with the aim to identify areas in which solar activity may
have influenced precipitation. Results show that February precipitation in Central and Western Europe yields
the strongest solar response with coefficients reaching up to +0.61. Rainfall in June–July is equally co-driven by
solar activity changes, whereby the solar-influenced zone of rainfall shifts from the British Isles towards Eastern
Europe during the course of summer. Other months with noteworthy solar responses are April, May and
December. On a decadal scale, the correlation between precipitation and solar activity in central Europe
appears to be mostly positive, both statistically and by visual curve comparison. Yet, best positive correlations
coefficients of February, June, July and December are typically reached when the solar signal lags rainfall by
1.5–2 years. Taking into account cause and effect, it is suspected that increases in Central European rainfall are
actually triggered by the solar minimum some 3–4 years before the rainfall month, rather than the lagging solar
maximum. Similar lags of a few years occur between solar activity and the solar-synchronized North Atlantic
Oscillation (NAO) due to memory effects in the Atlantic. The literature review demonstrates that most
multidecadal studies from Central Europe encountered a negative correlation between solar activity and
rainfall, probably because short time lags of a few years are negligible on timescales beyond the 11 year solar
Schwabe cycle. Flood frequency typically increases during times of low solar activity associated with NAO-
conditions and more frequent blocking.

1. Introduction

European hydroclimate shows a high degree of variability on diverse time scales, reaching from daily
to millennial (e.g. Linderholm et al., 2018; Magny, 2004; Markonis et al., 2018; Zveryaev and Allan,
2010). This variability in rainfall, floods and droughts is thought to be controlled by natural processes
such as Atlantic ocean cycles (e.g. Hurrell and van Loon, 1997; Trigo et al., 2004), changes in solar
activity (e.g. Czymzik et al., 2016b) and volcanic eruptions (e.g. Rao et al., 2017), as well as by
anthropogenic factors (e.g. Maraun, 2013). A robust understanding of natural precipitation drivers is
necessary in order to reliably distinguish their effects from anthropogenic influences. This is
particularly important for climate models which need to take all possible forcing factors qualitatively

1
    Corresponding author. E-mail addresses: moluedecke@t-online.de (H.-J. Ludecke), luening@ifhgk.org (S. Luning).
1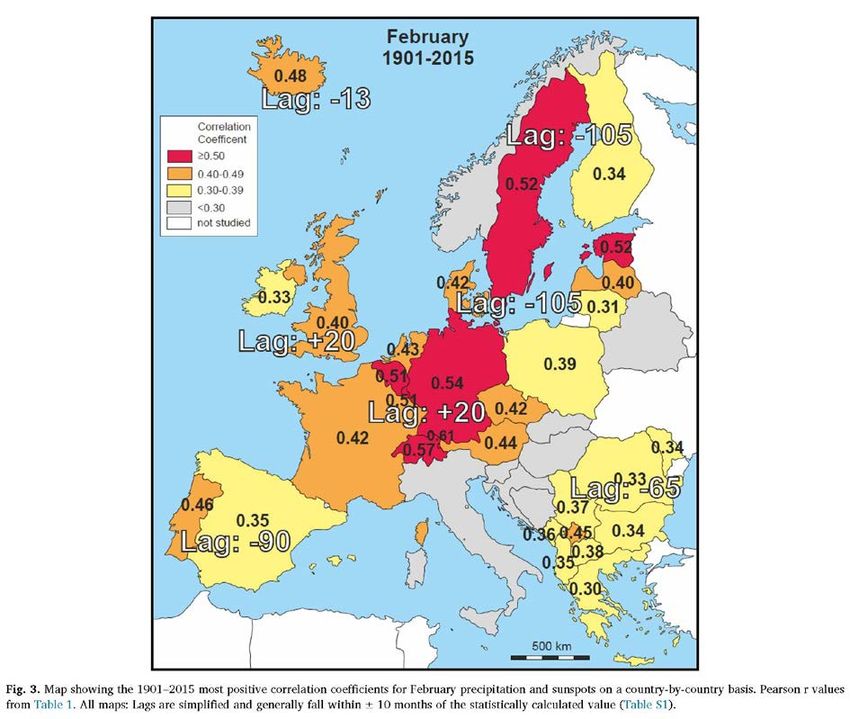
and quantitatively into account in order to continuously improve their hindcast and forecast
performances (Bothe et al., 2018; DeAngelis et al., 2015; Hoerling et al., 2009). In this contribution
we are concentrating on the potential influence of solar activity changes on European rainfall. In the
first part, we are reviewing the existing literature on the subject, focussing on regional trends, time
lags and methodologies. In the second part of this paper we are comparing regional European rainfall
series of the past 115 years with solar activity indices by means of statistical analyses. The objective
is to test for possible correlations on yearly, seasonal and monthly resolutions.

2. Solar influence on European rainfall
Various papers have suggested a solar influence on European rainfall. Here we are reviewing this
evidence, regionally grouped for western, northern, eastern and southern Europe. The studies use
modern rainfall and river discharge data, as well as palaeoclimate proxies for wetlands humidity and
river floods. Time scales reach from the solar Schwabe cycle (11 years) to the solar Hallstatt cycle
(2300 years).

2.1. Western Europe
The solar Schwabe cycle appears to play a major role for summer flooding in the European Alps. The
flood frequency of River Ammer in the Bavarian Alpine Foreland typically increases during intervals of
reduced solar activity. Significant correlations have been identified between late spring/summer
discharge data of the last 90 years and solar activity (Czymzik et al., 2016b). Interestingly, the solar
influence on hydroclimate appears somewhat delayed, as the flood record lags the solar signal by 2–
3 years. The 11 years solar cycle was also found in a cross-spectral analysis of summer floods in
Switzerland of the past 200 years (Peña et al., 2015). As in River Ammer, flooding was more frequent
during solar activity minima. Nonlinear spectral analysis of Holocene varves in a Westeifel crater lake
of Holzmaar (western Germany) also yielded a Schwabe cycle periodicity (Negendank et al., 1997;
Vos et al., 1997, 2004), even though it is unclear whether hydroclimate or temperature changes are
the main climatic driver. Solar-driven changes in discharge of river Rhine at Basel were suggested by
Franke and Bechteler (1969) involving alternating phase shifts and 2–3 years time lags. Vines (1985)
proposed various periodicities for European rainfall, including Schwabe and Hale (22 years) cyclicity.
  Solar influence on European hydroclimate has been also reported on a centennial to multi-
centennial scale comprising of the Gleissberg (80–100 years) and Suess – de Vries (210 years) solar
cycles. In the northern and central Alps, multidecadal summer flood-prone periods typically occurred
when solar activity was reduced. Varve studies in the Bavarian Lake Ammersee for the past 450 years
document an increase in spring and summer floods during the Sporer, Maunder, and Dalton solar
minima of the Little Ice Age (LIA) (Czymzik et al., 2010). Holocene summer flood frequency in the
Central Alps is pulsed by Gleissberg and Suess – de Vries solar periodicities, as evidenced in lake
sedimentary cores in Switzerland and northern Italy (Rabadan and Schulte, 2014; Schulte et al., 2015;
Wirth et al., 2013b). In an analysis of historical floods in Switzerland of the past 200 years, Peña et al.
(2015) identified a clear Gleissberg cyclicity. All Swiss studies agree that summer flood frequency was
higher during solar activity minima. Nevertheless, regional differences between the Northern and
Southern Alps have been observed and need to be taken into account (Pena et al., 2015; Wirth et al.,
2013b). Gleissberg and Suess-de Vries solar periodicities have been documented in Holocene
2
hydroclimate reconstructions studying lake and wetlands cores in Germany (Czymzik et al., 2016a;
Negendank et al., 1997; Vos et al., 1997), the Netherlands (Blaauw et al., 2004), UK (Macklin et al.,
2005; Mauquoy et al., 2002, 2004; Swindles et al., 2007b, 2012) and Ireland (Blackford and
Chambers, 1995; Stolze et al., 2013). In most cases, wet periods fall into low solar activity phases. In
contrast, Nurtaev (2015) suggested a positive correlation between sunspots and river Rhine
discharge for the past 100 years.
    Solar activity appears to also play a role for rainfall in Western Europe on even longer time scales,
namely through the solar cycles of 500 years and the millennial-scale 1000 years (Eddy) and 2300
years (Hallstatt) periodicities. These cycles were documented for flood histories in southern Germany
(Czymzik et al., 2013) and Switzerland (Schulte et al., 2009; Wirth et al., 2013b), lake levels in
Switzerland and France (Magny, 1993, 2004), and wetlands humidity changes in the UK and Denmark
(Mauquoy et al., 2008; Swindles et al., 2007b, 2010, 2012). Time lags for full hydroclimate response
of up to 50 years have been reported by Mauquoy et al. (2008). More humid conditions typically
prevailed during phases of low solar activity. A particularly wet and cold episode occurred in Western
Europe during the so-called 2.8 kyr BP event, the Homeric Minimum, a phase of low solar activity
that took place around 2800 years ago and persisted for more than 150 years (e.g. Bond et al., 2001).
The associated dramatic increase in humidity has been documented in Germany (Martin-Puertas et
al., 2012), the Netherlands (Kilian et al., 1995; van Geel et al., 2014; van Geel and Mauquoy, 2010;
Van Geel et al., 1997) and the UK (Swindles et al., 2007a).
   Solar activity also affects wind regimes in Central Europe. Schwander et al. (2017) analysed
weather types for the past 250 years and found fewer days with westerly and west south-westerly
flow over Central Europe under low solar activity, hereby northerly and easterly flow types increased.
The blocking frequency between Iceland and Scandinavia increases during solar minima and Central
European temperatures cool. Notably, model simulations are still not able to reproduce this imprint
of the 11-year solar cycle on the tropospheric weather of the region (Schwander et al., 2017).

2.2. Northern Europe
The phase relationship between solar activity and precipitation appears to be regionally
differentiated in northern Europe. Studies from southern and central Sweden document a marked
increase in precipitation and floods during the 2.8 kyr BP grand solar minimum (Labuhn et al., 2018;
Mellstrom et al., 2015). In northern Sweden, however, summer rainfall increases in high solar activity
phases, as documented by Kokfelt and Muscheler (2013) for the past 1000 years in a lake
sedimentary core. Rainfall was reduced during the Wolf, Sporer and Maunder solar minima. Kokfelt
and Muscheler (2013) also compared the sunspot cycle with a long instrumental series of summer
precipitation at the Abisko Scientific Research Station in northern Sweden for the past 100 years.
Whilst the first half of the series 1920–1960 lacked a robust link, the second half 1960–2000 yielded
statistically significant correlations. As in the multi-centennial reconstruction, the amount of summer
precipitation increased during periods with higher solar activity. In Latvia, Hajian and Movahed
(2010) presented a comparison of sunspots and discharge of the river Daugava. The authors
identified a cyclical element in the river flow that showed some similarities with solar activity
although with a periodicity closer to the solar Hale cycle (22 years).

3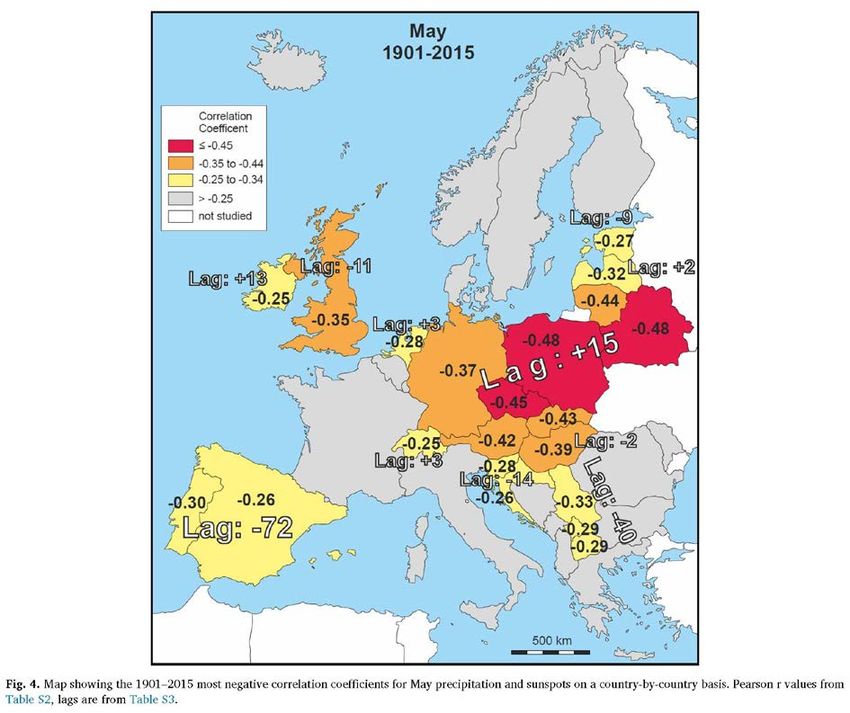
2.3. Eastern Europe
A shift towards a wetter and colder climate in association with the 2.8 kyr solar minimum was
described by Speranza et al. (2003) for the Czech Republic. Discharge of Elbe River at Děčin in the
northern Czech Republic shows alternating correlations with sunspots during the period 1850–1960
(Franke and Bechteler, 1969). Nurtaev (2015) compared Danube River discharge with solar activity
for the past 100 years and found an inverse correlation, with higher flow rates during weak solar
phases. Ducic et al. (2007) tested various combinations of solar and lower Danube discharge
parameters in the Romanian-Serbian segment and found the best correlations between flow index
and latitude of sunspots. Mares et al. (2016) studied the same lower Danube discharge data and
found maximum spring and summer flow rates about 2–3 years after solar Schwabe minima. The
geomagnetic index aa as solar proxy produced the best results. Dobrica et al. (2017) analysed the
power spectrum of the lower Danube discharge and identified periods that are linked to the solar
Schwabe and Hale cycles and their multiples. Lamy et al. (2006) studied the Holocene discharge
history of Sakarya River which represents Anatolia's longest river. Maximum discharge was found to
be associated with periods of reduced solar activity, similar as in the case of the Danube.

2.4. Southern Europe
Variability in Italian precipitation and floods is controlled by the North Atlantic Oscillation (NAO) and
solar activity (Brunetti et al., 2000; Wirth et al., 2013a). Zanchettin et al. (2008) analysed Po River
discharge and northern Italian regional precipitation data and found that wet and dry periods
alternate in accordance with polarized sunspot cycles, i.e. solar Hale cycles. Solar forcing is assumed
to take place via the solar-forced NAO. Positive (negative) NAO anomalies are associated with
comparatively lower (higher) Po River discharges (Zanchettin et al., 2008). The strength of solar
activity is thought to modulate the connection between the NAO and Po River discharges.
Landscheidt (2000) in response to Tomasino and Valle (2000) pointed to phase shifts in the solar
influence on Po River discharge over the past 100 years. Based on the observed patterns, Tomasino
et al. (2004) suggested that Po River discharge may be predictable based on solar activity
periodicities. Periodicities associated with the Schwabe solar cycle and the NAO have also been
reported from sedimentary cores in the Gulf of Taranto located at the distal end of the Po-river
discharge plume (Chen et al., 2011; Cini Castagnoli et al., 2002). Notably, Summer precipitation
trends have been anti-correlated in northern and southern Italy during the past 150 years (Brunetti
et al., 2000).
   Climate reconstructions for the past 2000 years in Lake Ledro in the Italian Southern Alps found an
increase in flooding during phases of low solar activity, namely in the Dalton, Sporer, Maunder, and
Wolf Minima (Vanniere et al., 2013; Wirth et al., 2013a). The northern Italian rivers Tiber, Adige and
Po show a maximum in flooding frequency during the Sporer Minimum (Camuffo and Enzi, 1995;
Glaser et al., 2010). Tiber and Adige experienced another flooding maximum at the onset of the
Maunder Minimum (Glaser et al., 2010). In Iberia, the relationship between floods and solar activity
is opposite to that in Italy. Reconstructions from Spain for the last 1000 years show a decrease of
flood frequency during solar minima in late summer and autumn (Barrera-Escoda and Llasat, 2015;
Corella et al., 2014; Glaser et al., 2010; Moreno et al., 2008; Vaquero, 2004). Smith et al. (2016)
documented millennial-scale hydroclimatic cycles from a northern Spanish cave which appear to be
linked to a cyclicity that Bond et al. (2001) associated with solar activity changes.

4
2.5. Complexity of the solar signal
The literature review shows that the solar influence on European precipitation follows certain
patterns, yet in a complex way. The correlation coefficients between hydroclimate and solar activity
keep changing on regional and temporal scales (Le Mouel et al., 2009). Regional differences occur
and reflect the dominance of different atmospheric regimes resulting in opposite solar effects.
Typical time lags of a few years point to delayed climatic response due to the inertia of the oceans
which play an important additional role for variability in European rainfall. Once fully understood, the
lags may offer seasonal rain forecasts. Solar effects on precipitation have been observed on time
scales ranging from Schwabe (11 years) to Hallstatt (2300 years) cycles and also differ for separate
seasons and months. The coupling between solar activity and rainfall is variable and includes periods
with stronger and other periods with weaker correlation.

3. Material and methods
3.1. Data
In order to test for possible correlations between rainfall and solar activity, monthly precipitation
data for 39 European countries covering the period 1901–2015 was downloaded from the Climate
Change      Knowledge     Portal which is operated by                the     World Bank       Group
(http://sdwebx.worldbank.org/climateportal/). This gridded historical dataset is derived from
observational data and has been produced by the Climatic Research Unit (CRU) of the University of
East Anglia, reformatted by the International Water Management Institute. The CRU dataset shows
reasonably consistent interannual variability compared to other gauge-based precipitation datasets,
namely those from the Global Precipitation Climatology Centre (GPCC) and the University of
Delaware (UDEL), even though with deviations in magnitudes of up to about 100mm (Sun et al.,
2018). In order to extend the rainfall record into the 19th and 18th centuries, three additional long
term data series were included in the analysis. The Stockholm data set reaches back to 1786 and was
sourced from the Swedish Meteorological and Hydrological Institute (http://opendata-download-
metobs.smhi.se/explore/). A historical precipitation series from Paris covers the period 1804–1919,
kindly provided by Meteo-France. This series contained minor (< 2%) data gaps which were filled by
interpolation. The Edinburgh series covers the period 1785–2002 and was sourced from the UK Met
Office National Meteorological Archive. The sunspot data is based on Sunspot Number Version 2.0
from the Royal Observatory of Belgium in Brussels, Sunspot Index and Long-term Solar Observations
(http://www.sidc.be/silso/datafiles), (Clette et al., 2015).

3.2. Statistical processing
Both the monthly precipitation and sunspot data were smoothed using a Savitzky-Golay Filter (SGF).
the SGF is a method of filtering thedata for increasing the signal-to-noise ratio. The fundamental
method is mathematical convolution (Riley et al., 2006) by fitting successive sub sets of close-by data
points with a polynomial by the linear least squares method (Luo et al., 2005; Savitzky and Golay,
1964). In most cases, SGF gives better results than smoothing by a simple moving average (SMA).
Supplement Figs. S20–21 visualize the SGF applied on a graph of this paper by comparing it with the
unfiltered data and with a simple moving average of width 3 (SMA). The SGF used here, generally,
has a frame size of 11 and a polynom order of 5 for both precipitation and sunspots.

5
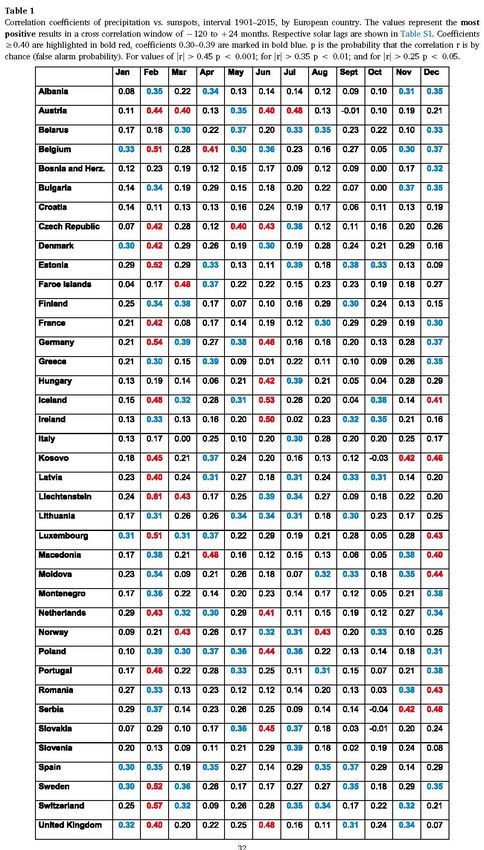
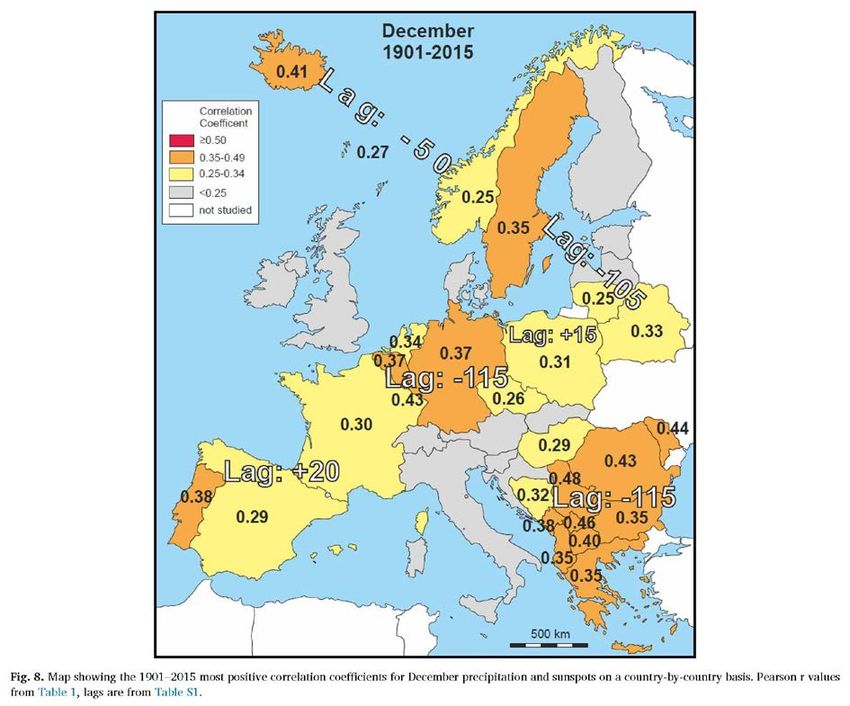
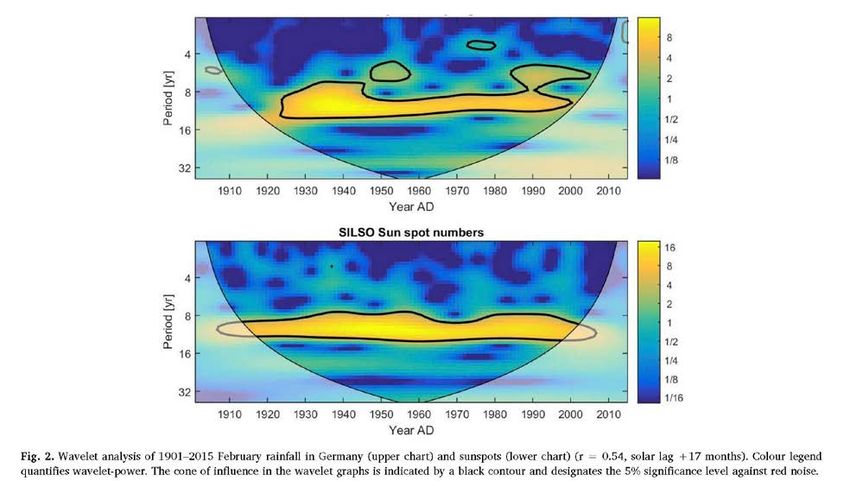
Monthly precipitation per country and sunspots were compared by calculating Pearson correlation
coefficients. In order to allow for lead/lag relationships, a cross correlation window of −120 to +24
months was chosen. While the rainfall was kept stable, the solar signal preceding the rainfall by up to
120 months (negative solar lag, i.e. lead) or postdating the rainfall by up to 24 months (positive solar
lag) was shifted onto the rain series. The coefficient of the most positive correlation in this window
was recorded, together with the solar lag in full months (Table 1 and S1; see illustrated time series
for all countries in Supplement Figs. S1 and S2). In a parallel exercise, the most negative correlation
coefficients and their respective lag were recorded for a slightly shortened cross correlation window
of −80 and + 24 months (Tables S2 and S3). Window shortening was empirically found necessary in
order to obtain more consistent results. Selected rainfall series were studied by means of wavelet
analysis (Grinsted et al., 2004).
   In order to ascertain the statistical confidence of the Pearson correlation r between precipitation
and Sunspot time series over 1901 to 2015, we assumed the null hypothesis that r is caused by
chance. We evaluated this assumption by Monte Carlo simulation (MC) (Mazhdrakov et al., 2018)
based on surrogate records of the same Hurst exponent H as the European precipitation time series.
We evaluated H by the detrended fluctuation analysis of the European country precipitations
(Kantelhardt et al., 2001) with the result of H≈0.6, which means only weak autocorrelation (white
noise as H=0.5). H≈0.6 was also found by J. W. Kantelhardt for worldwide precipitation time series
(Kantelhardt, 2004). In the MC simulation 10,000 surrogates replaced the real monthly precipitation
time series. Both for the surrogates and the sunspot number series the same Savitzky-Golay filter of
frame size 11 and polynom order 5 was used. The surrogates were generated by a standard method
(Turcotte, 1997). As a result, we found the following probabilities p for the null hypothesis: For values
of |r|>0.45 p < 0.001, for |r|>0.35 p < 0.01, and for |r|>0.25 p < 0.05.

4. Results
The correlation between monthly precipitation and sunspots of the period 1901–2015 shows
significant regional and seasonal variability (Tables 1 and S2). Pearson coefficients vary from 0.61
(Liechtenstein, February) to −0.53 (Estonia, February), representing correlations ranging from
moderate positive to moderate negative. The best positive correlations occur during February when
7 out of the 39 countries achieve coefficients of 0.50 or better (Tables 1 and 2). February also shows
the best negative correlations, although with slightly weaker strength than the positive correlations
(Tables 2 and S2). Significant parts of Europe yield moderate to low positive correlations during the
months of April, June, July and December (Tables 1 and 2). The month of May differs because the
best coefficients are negative correlations, with 9 countries showing r values of −0.35 and better
(Tables 2 and S2). The remaining six months (January, March, August, September, October,
November) show weaker coefficients, suggesting somewhat reduced solar influence on precipitation
during these times. The results of all months were mapped out in order to see if regional patterns
can be identified. The months with the best results are illustrated here in the main paper (Figs. 3, 4,
6–8), and the remaining months are contained in the Supplement (Figs. S3–S9).
4.1. January
January precipitation variability is only weakly correlated with solar activity. Regions with low
correlation strengths are scattered across Europe, namely eastern Scandinavia, the southern North
Sea countries, Spain, Switzerland and parts of the Balkans (Fig. S3).

6
7
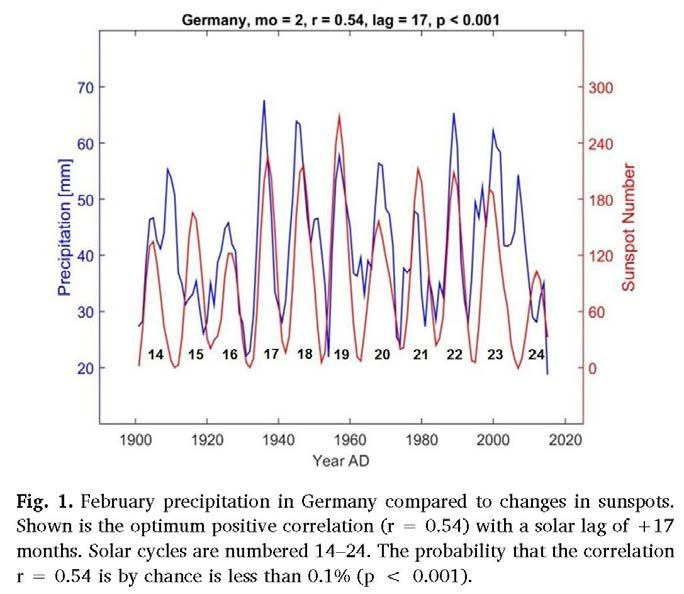
4.2. February
Of all months, February yields the best correlations between precipitation and solar activity.
Germany, Luxemburg, Belgium, Liechtenstein, Switzerland, Estonia and Sweden all show coefficients
of 0.51–0.61 suggesting moderate correlation. Visual inspection of the temporal development (Fig. 1,
S1, S2) suggests that the 11 year Schwabe solar cycle is well represented in the variability of
precipitation. This is particular the case during the period from the mid 1920s to the mid 2000s for
which the Pearson correlation values would be even higher.
  A wavelet analysis of Germany's February precipitation confirms the presence of a ∼11 year cycle
period from the mid 1920s to the mid 2000s (Fig. 2). The cycle appears to be weaker in the 1-2
decades before and after this period.

8
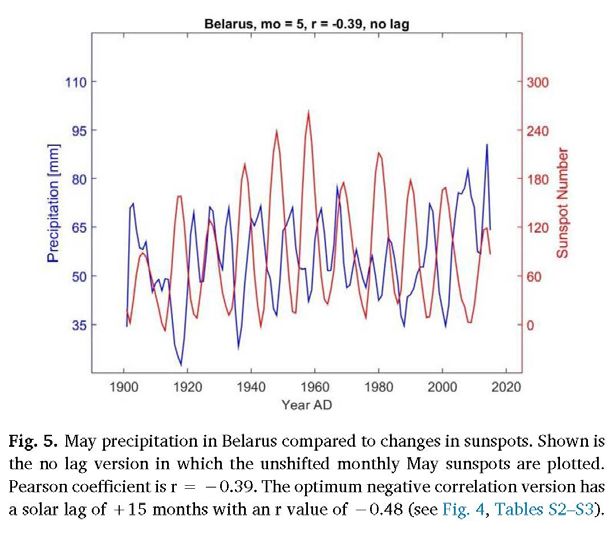
The February correlation sweetspot forms part of a southwest- northeast trending belt stretching
from Switzerland to Sweden, characterized by moderate correlation strength (Fig. 3). Slightly weaker
but still significant correlations occur in SW and NW Europe as well as in parts of the Balkans.
February precipitation in a northeast-trending corridor from the Adriatic Sea to Belarus appears to
lack solar influence as Pearson coefficients are statistically insignificant (Fig. 3). Notably, the lag of
the optimum correlations changes across Europe. Optimum lag values are +20 months in central
Western Europe, −105 months in Sweden and Estonia, and −65 months on the Balkans (Fig. 3),
illustrating systematic phase shifts across the continent.

4.3. March
March precipitation shows a significant solar response in a belt reaching from Austria to Scandinavia
where a low to moderate correlation strength with r values of 0.36–0.43 is achieved (Fig. S4).
Southern Europe, France and the British Isles lack any indication for solar influence on rainfall. The
best coefficients are reached at solar lags of −100 to −110.
4.4. April
During the month of April, low to moderate correlations are developed in parts of Central Europe,
SW Europe and Greece (Fig. S5). Low correlations are identified in a N-S corridor stretching from Italy
to Scandinavia. About half of Europe lacks evidence for solar influence on April rain, which includes
for example the British Isles, France, Finland and central Eastern Europe.
4.5. May
The month of May differs from most other months because the best correlations are characterized
by negative coefficients. The best coefficients are reached in a belt from the Czech Republic to
Belarus with r values of up to −0.48 (Fig. 4). Significant correlations also exist in neighbouring
countries, although slightly weaker. The lag of the best correlations is +15 months, indicating a
9
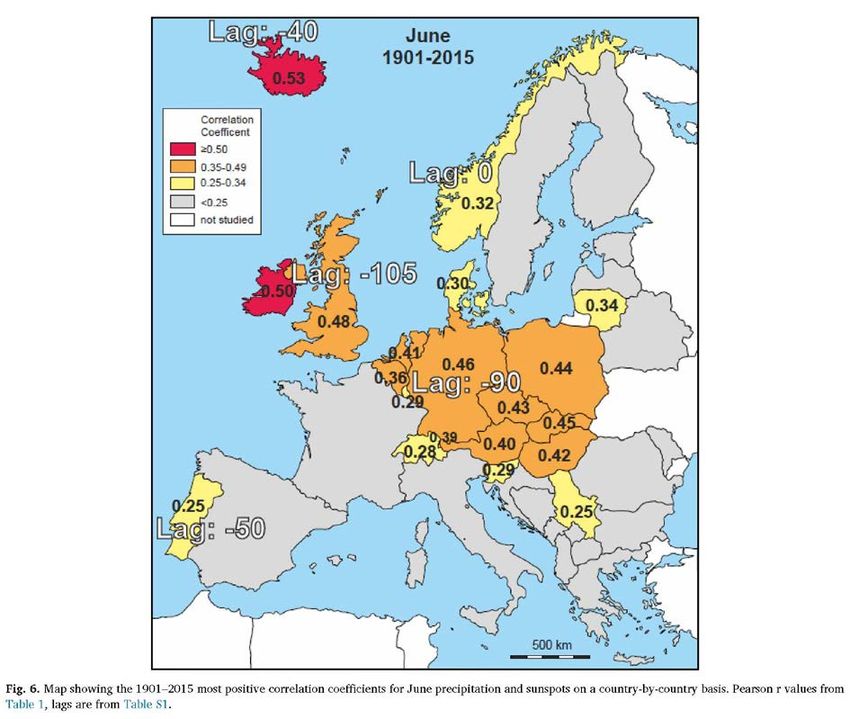
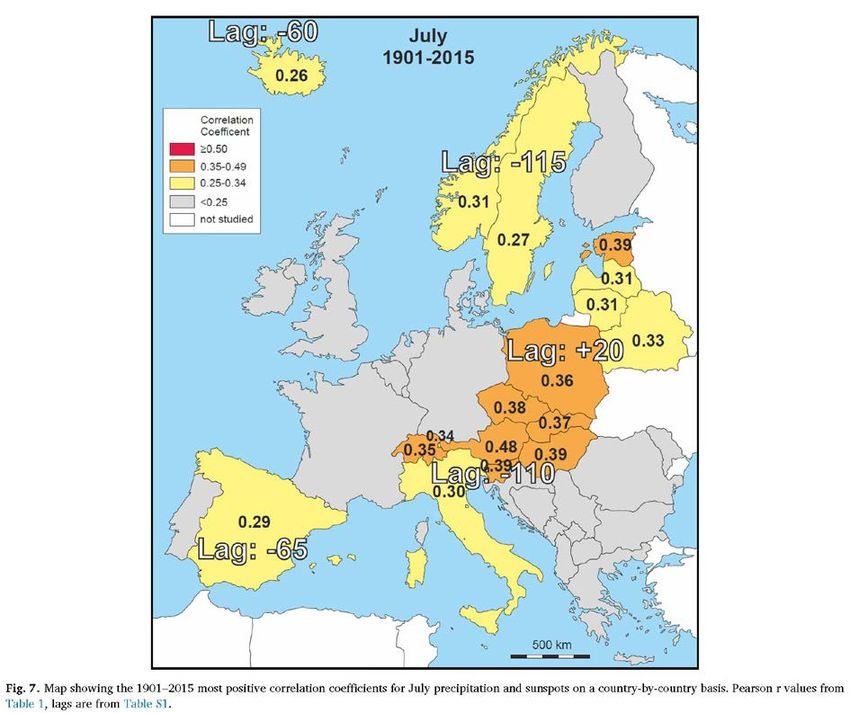
general anticorrelation of May rain solar activity in this region, which is also confirmed by visual
inspection of the development of the Belarus times series (no lag version, Fig. 5).
4.6. June
The best June correlations occur in NW Europe with r values of 0.50 and better in Ireland and Iceland
(Fig. 6). Moderate to low Pearson coefficients are also recorded in a belt reaching from the UK
westwards into central Eastern Europe, with a typical solar lag of about −90 months, i.e. the sun
leading rainfall by 7.5 years for a positive correlation. Rainfall in southern Europe and eastern
Scandinavia appears to generally lack solar influence in June.
4.7. July
The zone of solar-influenced rainfall mapped for June gradually weakens during the course of
summer. In July, only the eastern European sector shows moderate to low coefficients while the
western sector loses its solar influence altogether (Fig. 7). 4.8. August to October During the months
of August to October, correlations of low and occasionally low to moderate strengths occur in
Scandinavia and the Baltic states as well as in SW Europe and France (Figs. S6–S8). The majority of
Central and Eastern Europe lack any solar influence. Lags differ between the regions. 4.9. November
and December Compared to previous months, the regional correlation patterns fully change during
November. The best correlations are now achieved in the eastern Balkans and western Black Sea
regions with r values ≥ 0.35 (Fig. S9). In subsequent December, solar influence further strengthens
and regionally expands across many parts of Europe. Besides the Balkans, coefficients of moderate to
low strengths also occur in Iceland, Sweden, Germany, Benelux and Portugal (Fig. 8).

4.10. Historical precipitation series
Analysis of the gridded historical CRU dataset covers the past 115 years and shows that solar
influence on European rainfall affects certain regions during certain months during certain
multidecadal time periods. In the case of February and central Europe, it was shown that the solar
signature is only distinctly present from the mid 1920s to the mid 2000s. In order to verify if the solar
influence on precipitation also existed during the 19th century, long time series of individual stations
or station composites are needed, as European gridded data are not available. Observational
precipitation data are available e.g. for Edinburgh, Stockholm and Paris. The historical Edinburgh
rainfall series 1785–2002 reaches its best correlation during the month of February with a Pearson r
value of +0.35 and a lag of −103 months (Table S4). This matches quite well with the r value of +0.40
calculated for the UK rainfall series 1901–2015 (Table 1). Visual inspection of the historical Edinburgh
time series (Fig. S16) as well as the wavelet graphs (Fig. S19) shows that the series contains particular
periods in which the correlation breaks down such as in the early and mid 19th Century, apparently
partly associated with phase shifts. A better coupling between February rain in Edinburgh and solar
activity is observed during the second half of the 19th Century and most of the 20th Century.
   Similar discontinuous relationships are seen in the historical precipitation series of Paris and
Stockholm (Figs. S17–S19) which demonstrates the complexity of the long term development.

10
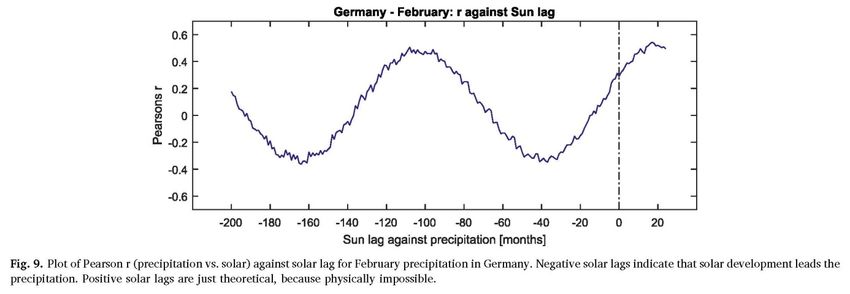
4.11. Time lags
In order to identify the best positive and negative correlation coefficients, the sunspot series is
progressively shifted against the precipitation series, the latter being kept stable. The cross
correlation window encompasses −120 to +24 months, i.e. the solar signal precedes the rainfall by up
to 120 months (negative solar lag, i.e. lead) or postdates the rainfall by up to 24 months. When
plotting the r values against the solar lag for individual monthly country precipitation series, the
result is an oscillating curve, with the extreme values represented by the most positive and most
negative correlation coefficients. The period of the oscillation corresponds to one ∼11 year Schwabe
solar cycle, whilst the minimum and maximum values are offset by about half a Schwabe cycle. Fig. 9
shows such a plot of r against sun lag for February rain in Germany. The best positive r values are
achieved at solar lag times of −110 to −95 and again at +10 to +20 months. The maxima are about
one solar Schwabe cycle apart from each other (11 years = 132 months). The most negative Pearson r
values plot in the range of −50 to −35 months, representing a lead time for the solar minimum of 50
to 35 months (=3–4 years) before an increase in rainfall occurs. In the case of February precipitation
of Germany, the best positive correlations (r +0.54, lag +17 months) are numerically better than the
best negative correlations (r −0.35, lag −37 months) (Tables 1, S1-S3). Notably, in other cases, the
reverse is true. February rain in the UK for example has a best positive correlation of r = +0.40 (lag
+16 months), whilst the most negative correlation of r = −0.47 (lag −53 months) indicates a better

11
12
correlation strength (Figs. 3 and S11; Tables 1, S1-S3). Another good example is February rain of
Estonia in which the best positive correlation (r = +0.52, lag −108 months) is very similar to the best
negative correlation (r = −0.53, lag −41) (Fig. S11, Tables 1, S1-S3). Notably, the best positive
correlation in Estonia is not achieved at low positive lags (like in Germany and the UK) but one solar
cycle back, with the solar peak leading rainfall by 9 years (Table S1). The solar minimum leads peak
February rainfall in Estonia by about three and a half years. The solar lag of the best correlations was
schematically mapped in Figs. 3, 4, 6-8, S3-S9. Specific regions consisting of clusters of several
countries typically share a similar lag. Systematic shifts in the lag occur across the European
continent. Taking the example of February rain, the region stretching from the British Isles across
Central Europe to the Baltic Sea area shares a similar lag (Fig. 3). The recorded lag values of −105 and
+ 20 months both correspond to the same relationship, i.e. they refer to successive maxima in the ‘r
against solar lag’ plot. The two maxima are offset by one solar Schwabe cycle, whereby the best
positive coefficients are mathematically reached in some cases in the high negative and sometimes in
the low positive peak, without any greater statistical difference. In contrast, the solar lag for the best
positive correlations on the Balkans is around −65 months (Fig. 3), therefore is phase-shifted against
the lag in northern Europe by 40 months (∼3years) (Fig. S10). Negative r values of February
precipitation in Greece (r=−0.43, lag −1 month; Tables S2 and S3) document better correlation
strength than the positive coefficients (r = +0.30, lag −57 months; Tables 1 and S1). This implies a
classical inverse relationship between solar activity and February rain in Greece and some other parts
of the Balkans.

5. Discussion
The 11 year solar Schwabe “heartbeat” is clearly identifiable in the European precipitation series
during certain months, as already suggested by Vines (1985). Regions, strength and solar leads/lags
of optimum correlations change across Europe throughout the course of the year, pointing to a
complex relationship of solar effects on European precipitation. A better empirical and genetic
understanding of these relationships opens up the chance for valuable predictions of precipitation on
a regional and seasonal basis.

5.1. February
The best Pearson coefficients of precipitation and sunspots occur in central Western Europe, Sweden
and Estonia with r values of ≥0.50. The respective solar lags are +20 and −105 months, which are
separated by about one solar Schwabe cycle (~132 months), therefore corresponding to the same
solar phase. It is clear that positive solar lags do not make any logical sense, because rainfall cannot
influence solar activity. Therefore, the only real possibility for a positive link between solar activity
and precipitation would be a lag of −105 months. This would mean that a solar maximum would
trigger a precipitation maximum nearly 9 years later. It is unclear how such a long delay could be
explained and transported in the climate system, even though it is not entirely impossible. We
therefore favour the possibility that actually the solar minimum triggers the precipitation maximum
in this region during February. The solar lags for the most negative r values is −50 to −35 months,
meaning that the inverse rainfall effect would take place about 4-3 years after the solar trigger.

13
This would also explain why most studies from Western and Central Europe on various time scales
have found generally higher rainfall and flood activity associated with low (rather than high) solar
activity

(e.g. Czymzik et al., 2016a; Mauquoy et al., 2004; Negendank et al., 1997; Swindles et al., 2012; Vos
et al., 1997). Other authors have already noted such lead/lag relationships in which the solar trigger
led hydroclimate by a few years (e.g. Czymzik et al., 2016b; Franke and Bechteler, 1969; Mares et al.,
2016; Schwander et al., 2017). This may be particularly noteworthy for multidecdal flood maxima
which may be best explained by the more abundant blocking events during phases of low solar
activity (Czymzik et al., 2016a; Rimbu et al., 2017; Schwander et al., 2017). A similar time lag was
described for the quasi-decadal NAO variability which is synchronized by the solar Schwabe cycle
(Thieblemont et al., 2015). NAO+ (NAO-) typically lags the solar maximum (minimum) by a few years,
possibly due to accumulation and memory effects in the Atlantic (Andrews et al., 2015; Gray et al.,
2013, 2016; Ma et al., 2018; Roy et al., 2016; Scaife et al., 2013; Sfică et al., 2015; Sjolte et al., 2018;
Thieblemont et al., 2015; Zhou et al., 2014). Processes in the atmosphere are too fast-paced and
cannot provide significant time lags (Andrews et al., 2015). Regardless of the exact trigger
mechanisms, visual inspection of the unshifted times series of sunspots and February precipitation in
Germany and neighbouring countries suggests a generally positive relationship between the two
14
parameters (Figs. 1 and S1). This is because the zero time lag line in the r-against-lag diagram plots
closer to the Pearson r maximum than to the minimum (Fig. 9). Empirically, this means more
precipitation during times of higher solar activity, even though peak precipitation occurs 20 months

before the Schwabe maximum. The area of maximum solar influence on precipitation is located in
central and western Europe which is significantly affected by the westerlies that typically transport
rain to the region. During low solar activity winters, westerlies are reported to be weaker and occur
less often in central Europe (Ineson et al., 2011; Schwander et al., 2017), because intense and long
lasting winter blocking events become more frequent, disrupting the westerly winds (Barriopedro et
al., 2008; Lockwood et al., 2010). The solar effect may fade out towards Eastern Europe because cold
continental arctic conditions prevail here in winter (Fig. 3). During times of high solar activity, the
westerlies are stronger, more persistent and less interrupted by blockings, bringing increased
amounts of rain to central Europe. Long-term trends of solar activity and the North Atlantic
Oscillation (NAO) were mostly in-phase since 1940, implying that low and high solar activity were
typically associated with NAO- and NAO + conditions, respectively (Gray et al., 2013; Scaife et al.,
2013; Thieblemont et al., 2015). During NAO- conditions, the westerly storm belt typically shifts
southwards to southern Europe, leading to increased amounts of rain there, whilst resulting in
reduced precipitation in central Europe (Morley et al., 2014; Wirth et al., 2013b). Correspondingly,

15
the westerly storm belt hits central Europe during NAO + conditions, bringing increased amounts of
rain there. The phase relationship between solar and precipitation maxima is not entirely stable. In
the case of central Europe, the best correlations exist from the 1920s to the mid 2000s (Figs. 1 and
2). Phase shifts occur before and after this interval. This interval of best correlations corresponds

16
generally to the maximum of the solar Gleissberg cycle (70–100 years) when multidecadal trends of
NAO and solar activity run in parallel and are positively correlated (van Loon et al., 2012) (Fig. S22).
During Gleissberg Minima, however, the two trends are opposite and are negatively correlated. The
reasons for these phase reversals in correlation are still unclear and may be due to equator to pole
temperature gradients (van Loon et al., 2012), or in the solar dynamo fields (Georgieva et al., 2012).
The variable relationship between solar forcing and NAO has also been discussed by Sjolte et al.
(2018). As the detailed processes involved in solar forcing of European hydroclimate are still poorly
understood, the influence of the solar magnetic and geomagnetic fields has to be included in the
lead/lag considerations. Notably, cosmic ray variations seen by neutron monitors lag sunspot number
variations by up to 14 months in odd numbered cycles, whilst only by 2 months in even numbered
cycles (Hathaway, 2015). The search for cause-effect is further complicated by the fact that some
hydrological processes, e.g. European extreme precipitation, are influenced by the preceding
wintertime NAO with time lags of one, two and three seasons (Tabari and Willems, 2018). This points
to multiyear chains of coupled lags, linking the solar signal with ocean cycles and subsequently with
the final hydroclimatic effect.

5.2. May
May rainfall responds very differently to the solar signal than in the preceding and subsequent
months (February–July). The best Pearson r values are negative and occur in northeastern Europe
(Czech Republic, Poland, Belarus) with a typical solar lag of +15 months (Fig. S13). High solar activity
commonly results in low precipitation, a relationship that is well illustrated in the unshifted and
shifted May time series of e.g. Belarus (Figs. 5 and S2). The exact meteorological reasons for this
shortterm phase shift in May are unclear.

5.3. Summer months
June and July are typically the wettest months in Central Europe. As the summer develops, the area
of solar influence on precipitation gradually migrates from the British Isles southeastwards via
Germany into SE Central Europe (Figs. 6 and 7). High solar activity appears to push rain-bearing
westerlies gradually deeper into Eastern Europe. By August, the solar-influenced rain belt reaches its
most easterly position and is restricted to Belarus (r=0.35) and Moldova (r=0.32) (Table 1, Fig. S6).
Drought conditions in June/July 2018 in Germany support the observed relationship. Rainfall reached
only 50–60% of the long term normal, coinciding with a solar activity minimum regime of solar cycle
24. Likewise, June 2018 in England and Wales ranked within the top five driest Junes on record with
figures dating back to 1910.

5.4. December
Increased solar activity appears to mildly stimulate precipitation in a southwest-northeast trending
corridor reaching from Iberia to Belarus (Fig. 8). This effect could be related to rain-bearing
southwesterly winds from the Atlantic, which may be stronger when the sun is more active. Notably
for Iberia, the December effect at first sight appears to deviate from the general link of reduced solar
activity, negative NAO and increased precipitation which dominates for most of the rest of the cold
season in Iberia (Hurrell et al., 2003; Vicente-Serrano et al., 2011). Considering that the NAO lags the
17
solar Schwabe signal by up to half a solar cycle, the relationship may in fact be true here as well. The
solar influence on the Balkan in December is still poorly understood and may be unrelated to the
westerlies.

5.5. Mid-term forecasting potential
The near-cyclical nature of the ∼11 years solar Schwabe cycle andthe empirically identified lead/lag
relationships with precipitation open up opportunities for improved mid-term prognoses that could
be valuable for agricultural purposes, flood risk preparedness and other fields of human activity. An
example is the anomalously low precipitation recorded in Germany during February 2018 (17.8 mm),
representing only 36% of the long term average (DWD, 2018). The anomaly occurred exactly four
years after an early 2014 activity spike in solar activity, associated with the maximum of the 24th
solar cycle (Fig. S14). A closer look at the development 2000–2018 points to a possible pattern. For
example, a similar solar activity spike during 2011 was followed by another very dry February in
Germany (2015), again a delay of 4 years (Fig. S14). In contrast, the very wet year 2016 was preceded
by relatively lower solar activity in 2012. The observations fit with the hypothesis of a negative
correlation between solar activity and February rain in Central Europe, whereby the precipitation
effect is delayed by up to 50 months (solar lag=−50). It may also be worth experimenting with rolling
averages of solar activity rather than specific monthly values, in order to adjust for significant solar
variability in certain years. Whilst February yields the best correlation coefficients in Europe,
precipitation of other months also shows a clear link to solar variability, even though of weaker
coupling. In Central Europe and parts of Scandinavia, the months of March, April, June and July show
a correlation and phase pattern that has similarities with February. As these months comprise a
significant part of the agricultural growing season, which in Germany lasts from March to October,
any forecasting potential has economic significance. In Iberia, the months of February, April, August
and December show noteworthy correlations that could be used to develop mid-term forecasts. On
the Balkans, the months of February, April, November and December look most promising. The
negative r coefficient of r=−0.43 for Greece with a negligible lag (Tables S2 and S3) suggests an
inverse relationship between February rain and solar activity in that country. If the empirically
identified relationship stays stable, February precipitation in Greece is expected to be reduced during
2019–2023 because of the expected development of the solar minimum associated with the
transition between solar cycles 24 and 25. In this contribution we focus on the link between solar
activity and precipitation. Nevertheless, other important mechanisms play a major role in controlling
variability of European hydroclimate. Future research will have to fully integrate the solar results
with the known influence of the NAO and the Atlantic Multidecadal Oscillation (AMO). Despite the
temporal and spatial complexity, some systematic patterns begin to emerge that may help to
eventually understand the meteorological mechanisms behind these hydroclimatic changes. Non-
linear responses and phase shifts complicate the picture. Considering that large amounts of
observational data are now available, it may be worth considering artificial intelligence and machine
learning techniques (e.g. Jones, 2017) to get a full view of the dependencies and possible processes
included in the variability of European precipitation.

18
6. Conclusions
European hydroclimate shows a high degree of variability on every time scale. The variability is
controlled by natural processes such as Atlantic ocean cycles, changes in solar activity, volcanic
activity and anthropogenic factors. This contribution concentrates on the solar influence on
European precipitation, which has been documented by a large body of published case studies. We
are concentrating on the period 1901–2015 for which we compare monthly precipitation series of 39
European countries with sunspot data by calculating Pearson correlation coefficients for a multi-year
cross-correlation window. The results have been mapped out across the continent in order to
identify areas in which solar activity may have influenced precipitation. February precipitation in
Central and Western Europe shows the strongest solar response with coefficients reaching up to
+0.61. Rainfall in June–July is also co-driven by solar activity changes, whereby the solar-influenced
zone of rainfall gradually migrates from the British Isles southeastwards via Germany into SE Central
Europe. On a decadal scale, the correlation between precipitation and solar activity in central Europe
during these months appears to be positive, both statistically and by visual curve comparison. Yet,
best positive correlations coefficients of February, June, July and December are typically reached
when the solar signal lags rainfall by 1.5–2 years. Honouring cause and effect, it is suspected that
increases in rainfall are actually triggered by the solar minimum some 3–4 years before the rainfall
month. Lags of a few years also occur between solar activity and the solar-synchronized-NAO,
possibly due to memory effects in the Atlantic. A lag in rainfall relative to the solar signal may open
up new possibilities for forecasts, likely with enormous economic significance. The literature review
demonstrates that most multidecadal studies from Central Europe encountered a negative
correlation between solar activity and rainfall, probably because short time lags of a few years are
negligible on timescales beyond the 11 year solar Schwabe cycle. Flood frequency typically increases
during times of low solar activity associated with negative NAO conditions and more frequent
blocking. The Alps form the southern limit of the Central European solar-driven rainfall region
because solar/rain relationships in the southern Alps appear to flip (Pena et al., 2015; Rabadan and
Schulte, 2014). Future research on the solar influence on European rainfall may also have to consider
possible effects of the 22 year solar Hale cycle, which represents a full magnetic cycle after two
Schwabe magnetic polarity reversals (Dobrica et al., 2017; Zanchettin et al., 2008).

Acknowledgements
We thank Josef Kowatsch, Steven Michelbach and Frank Bosse for valuable discussions. We are
grateful to Denis Fourgassie (Meteo-France), Mark Beswick (Met Office National Meteorological
Archive) and Hans Bengtsson (Swedish Meteorological and Hydrological Institute, SMHI) for providing
long historical rainfall series for Paris, Edinburgh and Stockholm. The vectorised Europe base map in
this paper was sourced from www.d-maps.com, a useful service for which we are thankful. We are
extremely grateful to the anonymous reviewers whose valuable comments stimulated us to expand
our study and include some important additional aspects.

Appendix A. Supplementary data
Supplementary data to this article can be found online at
https://doi.org/10.1016/j.jastp.2019.01.012.

19
References
Andrews, M.B., Knight, J.R., Gray, L.J., 2015. A simulated lagged response of the North Atlantic Oscillation to the solar cycle
over the period 1960–2009. Environ. Res. Lett. 10 (5), 054022.

Barrera-Escoda, A., Llasat, M.C., 2015. Evolving flood patterns in a Mediterranean region (1301–2012) and climatic factors –
the case of Catalonia. Hydrol. Earth Syst. Sci. 19 (1), 465–483.

Barriopedro, D., Garcia-Herrera, R., Huth, R., 2008. Solar modulation of Northern Hemisphere winter blocking. J. Geophys.
Res.: Atmosphere 113, D14.

Blaauw, M., van Geel, B., van der Plicht, J., 2004. Solar forcing of climatic change during the mid-Holocene: indications from
raised bogs in The Netherlands. Holocene 14 (1), 35–44.

Blackford, J.J., Chambers, F.M., 1995. Proxy climate record for the last 1000 years from Irish blanket peat and a possible link
to solar variability. Earth Planet. Sci. Lett. 133 (1), 145–150.

Bond, G., Kromer, B., Beer, J., Muscheler, R., Evans, M.N., Showers, W., Hoffmann, S., Lotti-Bond, R., Hajdas, I., Bonani, G.,
2001. Persistent solar influence on North Atlantic climate during the Holocene. Science 294, 2130–2136.

Bothe, O., Wagner, S., Zorita, E., 2018. Inconsistencies between observed, reconstructed, and simulated precipitation over
the British Isles during the last 350 years. Clim. Past Discuss 1–28 2018.

Brunetti, M., Maugeri, M., Nanni, T., 2000. Variations of temperature and precipitation in Italy from 1866 to 1995. Theor.
Appl. Climatol. 65 (3), 165–174.

Camuffo, D., Enzi, S., 1995. Climatic features during the Sporer and Maunda minima. In: Frenzel, B. (Ed.), Solar Output and
Climate during the Holocene, Paleoclimate Research, Special Issue 16. Fischer Verlag, Stuttgart, pp. 105–125.

Chen, L., Zonneveld, K.A.F., Versteegh, G.J.M., 2011. Short term climate variability during “Roman classical period” in the
eastern mediterranean. Quat. Sci. Rev. 30 (27–28), 3880–3891.

Cini Castagnoli, G., Bonino, G., Taricco, C., Bernasconi, S.M., 2002. Solar radiation variability in the last 1400 years recorded
in the carbon isotope ratio of a mediterranean sea core. Adv. Space Res. 29 (12), 1989–1994.

Clette, F., Svalgaard, L., Vaquero, J.M., Cliver, E.W., 2015. Revisiting the sunspot number. In: Balogh, A., Hudson, H.,
Petrovay, K., von Steiger, R. (Eds.), The Solar Activity Cycle: Physical Causes and Consequences. Springer, New York, NY, pp.
35–103 New York.

Corella, J.P., Benito, G., Rodriguez-Lloveras, X., Brauer, A., Valero-Garces, B.L., 2014. Annually-resolved lake record of
extreme hydro-meteorological events since AD 1347 in NE Iberian Peninsula. Quat. Sci. Rev. 93, 77–90.

Czymzik, M., Brauer, A., Dulski, P., Plessen, B., Naumann, R., von Grafenstein, U., Scheffler, R., 2013. Orbital and solar
forcing of shifts in Mid- to Late Holocene flood intensity from varved sediments of pre-alpine Lake Ammersee (southern
Germany). Quat. Sci. Rev. 61, 96–110.

Czymzik, M., Dreibrodt, S., Feeser, I., Adolphi, F., Brauer, A., 2016a. Mid-Holocene humid periods reconstructed from calcite
varves of the Lake Woserin sediment record (north-eastern Germany). Holocene 26 (6), 935–946.

Czymzik, M., Dulski, P., Plessen, B., von Grafenstein, U., Naumann, R., Brauer, A., 2010. A 450 year record of spring‐summer
flood layers in annually laminated sediments from Lake Ammersee (southern Germany). Water Resour. Res. 46 (11).

Czymzik, M., Muscheler, R., Brauer, A., 2016b. Solar modulation of flood frequency in central Europe during spring and
summer on interannual to multi-centennial timescales. Clim. Past 12 (3), 799–805.

DeAngelis, A.M., Qu, X., Zelinka, M.D., Hall, A., 2015. An observational radiative constraint on hydrologic cycle
intensification. Nature 528, 249.

Dobrica, V., Demetrescu, C., Mares, I., Mares, C., 2017. Long-term Evolution of the Lower Danube Discharge and
Corresponding Climate Variations: Solar Signature Imprint: Theoretical and Applied Climatology.

Ducic, V., Lukovic, J., Nikolova, N., 2007. Possible connection between Danube river discharge variability and solar activity.
Bull. Serbian Geograph. Soc. 1, 31–38.

DWD,      2018.      The    weather     in   Germany       in    February    2018.                    https://www.dwd.de/DE/
presse/pressemitteilungen/DE/2018/20180227_deutschlandwetter_februar_news.html.

20
Franke, P.G., Bechteler, W., 1969. Relation between Sunspots and Discharge: the Use of Analog and Digital Computers in
Hydrology: Proceedings of the Tucson Symposium. pp. 527–530.

Georgieva, K., Kirov, B., Koucka Knižova, P., Mošna, Z., Kouba, D., Asenovska, Y., 2012. Solar influences on atmospheric
circulation. J. Atmos. Sol. Terr. Phys. 90–91, 15–25.

Glaser, R., Riemann, D., Schonbein, J., Barriendos, M., Brazdil, R., Bertolin, C., Camuffo, D., Deutsch, M., Dobrovolny, P., van
Engelen, A., Enzi, S., Haličkova, M., Koenig, S.J., Kotyza, O., Limanowka, D., Mackova, J., Sghedoni, M., Martin, B.,
Himmelsbach, I., 2010. The variability of European floods since AD 1500. Climatic Change 101 (1), 235–256.

Gray, L.J., Scaife, A.A., Mitchell, D.M., Osprey, S., Ineson, S., Hardiman, S., Butchart, N., Knight, J., Sutton, R., Kodera, K.,
2013. A lagged response to the 11 year solar cycle in observed winter Atlantic/European weather patterns. 13. J. Geophys.
Res.: Atmosphere 118 (24), 405–413 420.

Gray, L.J., Woollings, T.J., Andrews, M., Knight, J., 2016. Eleven‐year solar cycle signal in the NAO and Atlantic/European
blocking. Q. J. R. Meteorol. Soc. 142 (698), 1890–1903.

Grinsted, A., Moore, J.C., Jevrejeva, S., 2004. Application of the cross wavelet transform and wavelet coherence to
geophysical time series. Nonlinear Process Geophys. 11 (5/6), 561–566.

Hajian, S., Movahed, M.S., 2010. Multifractal Detrended Cross-Correlation Analysis of sunspot numbers and river flow
fluctuations. Phys. Stat. Mech. Appl. 389 (21), 4942–4957.

Hathaway, D.H., 2015. The solar cycle. Living Rev. Sol. Phys. 12 (1), 4.

Hoerling, M., Eischeid, J., Perlwitz, J., 2009. Regional precipitation trends: distinguishing natural variability from
anthropogenic forcing. J. Clim. 23 (8), 2131–2145.

Hurrell, J.W., Kushnir, Y., Ottersen, G., Visbek, M., 2003. An overview of the north Atlantic oscillation. In: In: Hurrell, J.W.,
Kushnir, Y., Ottersen, G., Visbeck, M. (Eds.), The North Atlantic Oscillation: Climatic Significance and Environmental Impact,
vol 134. American Geophysical Union, Geophysical Monograph Series, pp. 1–35.

Hurrell, J.W., van Loon, H., 1997. Decadal variations in climate associated with the north Atlantic oscillation. Climatic
Change 36 (3), 301–326.

Ineson, S., Scaife, A.A., Knight, J.R., Manners, J.C., Dunstone, N.J., Gray, L.J., Haigh, J.D., 2011. Solar forcing of winter climate
variability in the Northern Hemisphere. Nat. Geosci. 4, 753–757.

Jones, N., 2017. How machine learning could help to improve climate forecasts. Nature 548, 379–380.

Kantelhardt, J.W., 2004. Fluktuationen in Komplexen Systemen. Habilitation Thesis. Justus-Liebig-University Giesen, pp. 217.
http://www.physik.uni-halle.de/Fachgruppen/kantel/habil.pdf.

Kantelhardt, J.W., Koscielny-Bunde, E., Rego, H.H.A., Havlin, S., Bunde, A., 2001. Detecting long-range correlations with
detrended fluctuation analysis. Phys. Stat. Mech. Appl. 295 (3), 441–454.

Kilian, M.R., Van der Plicht, J., Van Geel, B., 1995. Dating raised bogs: new aspects of AMS 14C wiggle matching, a reservoir
effect and climatic change. Quat. Sci. Rev. 14 (10), 959–966.

Kokfelt, U., Muscheler, R., 2013. Solar forcing of climate during the last millennium recorded in lake sediments from
northern Sweden. Holocene 23 (3).

Labuhn, I., Hammarlund, D., Chapron, E., Czymzik, M., Dumoulin, J.-P., Nilsson, A., Regnier, E., Robygd, J., von Grafenstein,
U., 2018. Holocene hydroclimate variability in central Scandinavia inferred from flood layers in contourite drift deposits in
lake Storsjon. Quaternary 1 (1), 2.

Lamy, F., Arz, H.W., Bond, G.C., Bahr, A., Patzold, J., 2006. Multicentennial-scale hydrological changes in the Black Sea and
northern red sea during the Holocene and the arctic/North Atlantic oscillation. Paleoceanography 21 (1) n/a-n/a.

Landscheidt, T., 2000. River Po discharges and cycles of solar activity. Hydrol. Sci. J. 45 (3), 491–493.

Le Mouel, J.-L., Blanter, E., Shnirman, M., Courtillot, V., 2009. Evidence for solar forcing in variability of temperatures and
pressures in Europe. J. Atmos. Sol. Terr. Phys. 71 (12), 1309–1321.

Linderholm, H.W., Nicolle, M., Francus, P., Gajewski, K., Helama, S., Korhola, A., Solomina, O., Yu, Z., Zhang, P., D'Andrea,
W.J., Debret, M., Divine, D.V., Gunnarson, B.E., Loader, N.J., Massei, N., Seftigen, K., Thomas, E.K., Werner, J., Andersson, S.,

21
Berntsson, A., Luoto, T.P., Nevalainen, L., Saarni, S., Valiranta, M., 2018. Arctic hydroclimate variability during the last 2000
years: current understanding and research challenges. Clim. Past 14 (4), 473–514.

Lockwood, M., Harrison, R.G., Woollings, T., Solanki, S.K., 2010. Are cold winters in Europe associated with low solar
activity? Environ. Res. Lett. 5, 1–7.

Luo, J., Ying, K., He, P., Bai, J., 2005. Properties of Savitzky–golay digital differentiators. Digit. Signal Process. 15 (2), 122–
136.

Ma, H., Chen, H., Gray, L., Zhou, L., Li, X., Wang, R., Zhu, S., 2018. Changing response of the North Atlantic/European winter
climate to the 11 year solar cycle. Environ. Res. Lett. 13 (3), 034007.

Macklin, M.G., Johnstone, E., Lewin, J., 2005. Pervasive and long-term forcing of Holocene river instability and flooding in
Great Britain by centennial-scale climate change. Holocene 15 (7), 937–943.

Magny, M., 1993. Solar influences on Holocene climatic changes illustrated by correlations between past lake-level
fluctuations and the atmospheric 14C record. Quat. Res. 40, 1–9.

Magny, M., 2004. Holocene climate variability as reflected by mid-European lake-level fluctuations andits probable impact
on prehistoric human settlements. Quat. Int. 113, 65–79.

Maraun, D., 2013. When will trends in European mean and heavy daily precipitation emerge? Environ. Res. Lett. 8 (1),
014004.

Mares, I., Dobrica, V., Demetrescu, C., Mares, C., 2016. Hydrological response in the Danube lower basin to some internal
and external climate forcing factors: Hydrol. Earth Syst. Sci. Data 1–24 2016.

Markonis, Y., Hanel, M., Maca, P., Kysely, J., Cook, E.R., 2018. Persistent multi-scale fluctuations shift European
hydroclimate to its millennial boundaries. Nat. Commun. 9 (1), 1767.

Martin-Puertas, C., Matthes, K., Brauer, A., Muscheler, R., Hansen, F., Petrick, C., Aldahan, A., Possnert, G., Geel, B. v., 2012.
Regional atmospheric circulation shifts induced by a grand solar minimum. Nat. Geosci. https://doi.org/10.1038/ngeo1460.

Mauquoy, D., Engelkes, T., Groot, M.H.M., Markesteijn, F., Oudejans, M.G., van der Plicht, J., van Geel, B., 2002. High-
resolution records of late-Holocene climate change and carbon accumulation in two north-west European ombrotrophic
peat bogs. Palaeogeogr. Palaeoclimatol. Palaeoecol. 186 (3), 275–310.

Mauquoy, D., van Geel, B., Blaauw, M., Speranza, A., van der Plicht, J., 2004. Changes in solar activity and Holocene climatic
shifts derived from 14C wiggle-match dated peat deposits. Holocene 14 (1), 45–52.

Mauquoy, D., Yeloff, D., Van Geel, B., Charman, D.J., Blundell, A., 2008. Two decadally resolved records from north‐west
European peat bogs show rapid climate changes associated with solar variability during the mid–late Holocene. J. Quat. Sci.
23 (8), 745–763.

Mazhdrakov, M., Benov, D., Valkanov, N., 2018. The Monte Carlo Method: Engineering Applications. ACMO Academic Press,
Sofia, pp. 235.

Mellstrom, A., van der Putten, N., Muscheler, R., de Jong, R., Bjorck, S., 2015. A shift towards wetter and windier conditions
in southern Sweden around the prominent solar minimum 2750 cal a BP. J. Quat. Sci. 30 (3), 235–244.

Moreno, A., Valero-Garces, B.L., Gonzalez-Samperiz, P., Rico, M., 2008. Flood response to rainfall variability during the last
2000 years inferred from the Taravilla Lake record (Central Iberian Range, Spain). J. Paleolimnol. 40 (3), 943–961.

Morley, A., Rosenthal, Y., deMenocal, P., 2014. Ocean-atmosphere climate shift during the mid-to-late Holocene transition.
Earth Planet. Sci. Lett. 388, 18–26.

Negendank, J.F.W., Zolitschka, B., Rein, B., Brauer, A., Bruchmann, C., Sanchez, A., Vos, H., 1997. Varve chronology and solar
variability in lake Holzmaar (eifel, Germany), Bulletin de la Societe belge de Geologie 106, 53–61.

Nurtaev, B., 2015. Influence of climate variability on large rivers runoff. Proc. IAHS 371, 211–214.

Peña, J.C., Schulte, L., Badoux, A., Barriendos, M., Barrera-Escoda, A., 2015. Influence of solar forcing, climate variability and
modes of low-frequency atmospheric variability on summer floods in Switzerland: Hydrol. Earth Syst. Sci. 19 (9), 3807–3827.

Rabadan, J.C.P., Schulte, L., 2014. Effects of solar activity and climate variability on large floods in Switzerland. Boletin de la
Asociacion de Geografos Espanoles 65, 469–475.

22
You can also read