Potential changes in the connectivity of marine protected areas driven by extreme ocean warming
←
→
Page content transcription
If your browser does not render page correctly, please read the page content below
www.nature.com/scientificreports
OPEN Potential changes
in the connectivity of marine
protected areas driven by extreme
ocean warming
Luciana Shigihara Lima1*, Douglas Francisco Marcolino Gherardi1, Luciano Ponzi Pezzi1,
Leilane Gonçalves dos Passos2,3, Clarissa Akemi Kajiya Endo4,5 & Juan Pablo Quimbayo6
Projected future climate scenarios anticipate a warmer tropical ocean and changes in surface currents
that will likely influence the survival of marine organisms and the connectivity of marine protected
areas (MPAs) networks. We simulated the regional effects of climate change on the demographic
connectivity of parrotfishes in nine MPAs in the South Atlantic through downscaling of the
HadGEM2-ES Earth System Model running the RCP 8.5 greenhouse gas trajectory. Results indicate
a tropicalization scenario over the tropical southwest Atlantic following an increase of sea surface
temperature (SST) between 1.8 and 4.5 °C and changes in mean surface currents between − 0.6 to
0.5 m s−1 relative to present conditions. High mortality rates will reduce demographic connectivity
and increase the isolation of oceanic islands. The simulation of organismal response to ocean warming
shows that acclimation can significantly improve (p < 0.001) particle survival, promoting connectivity
and tropicalization of MPAs, with potential impacts on their functional integrity and long-term
resilience.
Marine protected areas (MPAs) are important elements of conservation policy that aim to promote connectiv-
ity between the populations they support (hereafter referred to as MPA connectivity) and to maintain trophic
webs under disturbance r egimes1–3. Herbivorous reef fishes, such as parrotfishes, can be a key component in this
process, since they are responsible for modulating the composition and standing biomass of algal assemblages,
and for helping in the replenishment and potential recovery of coral populations2, 4–6. Individuals of the Spari-
soma genus found in the southwestern tropical Atlantic have a diet based primarily on detritus and macroalgae,
representing an important group responsible for the transfer of nutrients and energy from primary producers to
higher trophic l evels7. Several tropical reef fishes live in the limit of their thermal tolerance and can travel long
distances, ocean warming can result in an expansion or shift of larval dispersal into higher latitudes8. Changes
in this sense can lead to disturbances in local ecological network structures and disruption of the functional
integrity of reef ecosystems9, 10. For example, parrotfishes are ectotherms, and their rates of biochemical and
cellular processes are governed mainly by environmental temperature. Therefore, large positive anomalies in
ocean temperature will intensify their metabolic demand and change both their geographical distribution, as
well as trophic interactions8. Considering the climate warming over the tropics above the current biological
tolerance, individuals capable of changing their physiological limits across generations through acclimation
(including parrotfishes) will also influence how reef fishes respond with shifts in environmental conditions and
spatial distribution10, 11. In this sense, some studies have proposed that species with wide geographic distribu-
tion will have higher potential for acclimation than species with narrow distribution, since they probably have
higher plasticity in thermal tolerance12, 13. For instance, tropical wrasses that live in small tropical areas exhibited
mitochondrial and cardiac failure with elevated temperature and therefore may be most vulnerable to the impact
of rising sea surface temperature (SST)14. Conversely, those species that exhibited thermal acclimation are less
1
Laboratory of Ocean and Atmosphere Studies (LOA), Earth Observation and Geoinformatics Division, National
Institute for Space Research (INPE), São José dos Campos, SP, Brazil. 2Geophysical Institute and Bjerknes Centre
for Climate Research, University of Bergen, P.O. Box 7803, 5020 Bergen, Norway. 3Nansen Environmental and
Remote Sensing Center, Bergen, Norway. 4Institute of Marine Research, P.O. Box 1870 Nordnes, 5817 Bergen,
Norway. 5Centre for Ecological and Evolutionary Synthesis (CEES), Department of Biosciences, University of Oslo,
P.O. Box 1066 Blindern, 0316 Oslo, Norway. 6Centro de Biologia Marinha (CEBIMar), Universidade de São Paulo,
São Sebastião 11612‑109, Brazil. *email: luciana.lima@inpe.br
Scientific Reports | (2021) 11:10339 | https://doi.org/10.1038/s41598-021-89192-6 1
Vol.:(0123456789)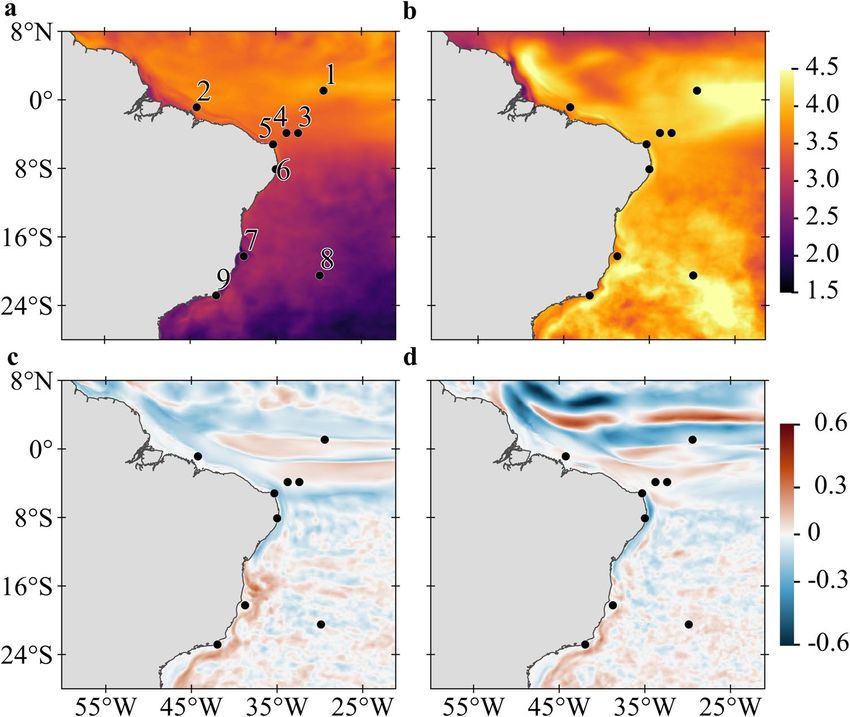
www.nature.com/scientificreports/
vulnerable but can have high energetic cost and variation in their life-history traits that influence negatively the
maintenance of their populations. To our knowledge, there are no published records on the capacity of parrotfish
to acclimate as a response to ocean warming but there is growing evidence that this may occur in tropical reef
fishes both as non-genetic parental effects or as genetically induced reproductive p lasticity13, 15.
The Representative Concentration Pathway (RCP) are different scenarios for greenhouse gas concentration
proposed by the Intergovernmental Panel on Climate Change (IPCC). The RCP provides different representa-
tions of climate considering radiative f orcing16. The RCP 8.5, an extreme warming scenario, projects that 81%
of terrestrial and 37% of marine assemblages will have at least one species exposed to unprecedented high mean
annual temperatures before 2100, and the percentages can be even more significant in the tropics17. Despite the
controversy around the likelihood of this so-called business-as-usual emission t rajectory18, the RCP 8.5 can be
used as a worst-case scenario for which important outcomes, and their seasonal and interannual variability,
should be considered in exploratory research for a high-risk future for the ecosystem. Using the RCP 8.5 sce-
nario also helps to compare systems response globally as it has been the most used in studies trying to predict
ecological impacts in marine ecosystems under climate c hange19. The projected global mean increase in SST
around 0.035 °C year-1 will cause the community safety margin in tropical MPAs, defined as the inherent buffer
against warming based on the thermal sensitivity of the biologic community, to be exceeded by 2 0509. As a result,
adverse impacts are expected for tropical species living close to their maximum thermal tolerance, especially in
isolated marine reserves such as those in oceanic islands of the south Atlantic20.
The Target eleven of the Convention on Biological Diversity highlights the importance of MPAs, and recom-
mends the increase in open ocean protected sites that are ecologically representative and spatially integrated into
more extensive networks21. The establishment of broader seascape networks can ensure proper ecological and
demographic connectivity as well as adaptation to climate c hange22. Therefore, the integration of MPAs through
demographic connectivity in the future needs to be assessed, considering different organisms responses to ocean
warming. Furthermore, it should include mechanisms involving thermal tolerance and adaptation of individu-
als and changes in the atmosphere and surface ocean d ynamics12, 22. For instance, warmer waters may not only
increase the mortality of individuals but also accelerate the development of fish larvae, causing a reduction in
pelagic larval duration (PLD)23–25. It will also directly affect the productivity capacity and energy flow within
food webs26. Shifts in the timing and output of reproduction, premature reef-seeking larval behaviour, increase
in self-recruitment and reduction in the magnitude of demographic connectivity are also expected to occur27, 28.
Another significant consequence of ocean warming is the redistribution of species caused by increased coloniza-
tion of warm-adapted species in subtropical s ites29, 30. Alterations in biological behaviour are especially evident in
transition zones, where both tropical and temperate species overlap and changes in SST are more pronounced8.
Empirical studies have shown that the arrival of typical tropical herbivorous fishes into subtropical sites promotes
new trophic interactions and alters the structure of kelp forests, resulting in a process known as t ropicalization8.
The influence of ocean warming on MPA connectivity should also consider the fact that some organisms will
be able to increase their thermal tolerance and maintain growth and swimming ability by epigenetic inherit-
ance. Experiments with a tropical reef fish involving the rearing of siblings of the damselfish Acanthochromis
polyacanthus have shown that it is capable of transgenerational metabolic acclimation (including egg clutches)
and it can adapt to an increase of up to + 3 °C in S ST13, 15, 31. This has been taken as evidence that acclimation of
tropical reef fishes may happen in time scales shorter than the rate of ocean water warming induced by anthro-
pogenic climate change. Nevertheless, assuming that thermal preference can drive fish behaviour before ocean
temperature raises, reef fishes may migrate to colder areas before they develop acclimation32, 33.
In this study, we combine a dynamical downscaling using an eddy resolving ocean model and a individual
based model set with the biological characteristics of the widely distributed reef fish genus Sparisoma spp. to
investigate the potential impacts of future ocean warming on the demographic connectivity of MPAs in the
southwestern tropical Atlantic. This reef fish group represents an important component of tropical reefs, due to
their functional roles in bioerosion, sediment production and biomass control of m acroalgae6. We complement
our analysis determining the connectivity of MPAs for an alternative reef fish acclimation scenario. Here, we took
recent evidences of transgenerational acclimation found in a tropical reef fish (Acanthochromis polyacanthus)
as indication of the acclimation potential of Sparisoma eggs and larvae. We assume that this mechanism can be
reasonably generalised to other reef fishes and their propagules considering that even small changes in water
temperature (+ 1.5 °C) can directly influence the thermal tolerance of o ffsprings13, 15.
Results
Projected changes over the tropical Atlantic. The study region covers most of the Southwestern
Atlantic, including the Brazilian coast and four oceanic islands, representing all federal MPAs with reefs in the
tropical Brazilian exclusive economic zone (Fig. 1). Parrotfish spawning and recruitment were simulated to
compute the connectivity of five sites on the continental shelf: Manuel Luís (ML), Recifes de Corais (RC), Costa
dos Corais (CC), Abrolhos (AB) and Arraial do Cabo and Cabo Frio region (CF) and four oceanic islands: Atol
das Rocas (AR), Fernando de Noronha Archipelago (FN), São Pedro e São Paulo Archipelago (SPSP) and Mar-
tim Vaz e Trindade Archipelago (TR) (details in Supplementary Fig. 1). We sought to identify potential changes
in ocean temperature and current velocity in these sites that could influence survival rates and alter dispersion
dynamics28, 29, 34, leading to new spatial arrangement of habitats35. The impacts of these potential changes were
evaluated in two different biophysical simulations, a non-acclimated scenario assuming present-day thermal
tolerance of Sparisoma (24 to 30 °C) and an acclimated scenario where eggs and larvae are able to adapt to an
increase of up to + 3 °C in S ST13, 15, 31.
Based on this premise, we compared present and future ocean states by dynamically downscaling the worst-
case (extreme) RCP 8.5 ocean warming scenario produced by the Earth System Model (ESM) HadGEM2-ES,
Scientific Reports | (2021) 11:10339 | https://doi.org/10.1038/s41598-021-89192-6 2
Vol:.(1234567890)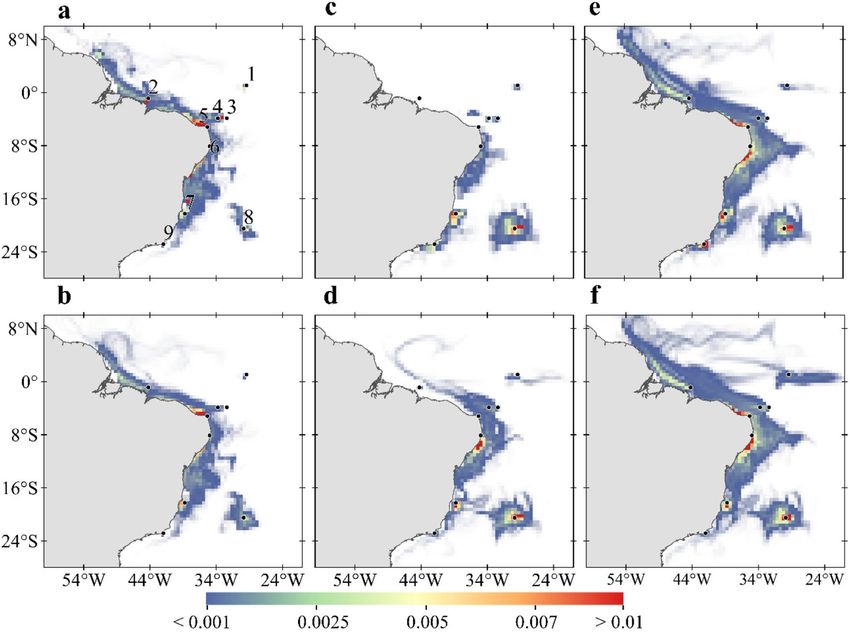
www.nature.com/scientificreports/
Figure 1. Differences between future (RCP8.5, 2092–2099) and historic (1997–2004) simulations for SST and
current magnitude averaged for the ocean upper 100 m layer. (a) Summer (JFM) and (b) Winter (JAS) for SST
(°C); larger differences of temperature between simulations are shown in yellow tones and smaller differences in
purple tones. (c) Summer (JFM) and (d) Winter (JAS) for current magnitude (m s −1); red tones indicate current
strengthening and blue tones indicate current weakening. Black dots represent MPA locations: (1) São Pedro
e São Paulo Archipelago (SPSP); (2) Manuel Luís (ML); (3) Fernando de Noronha Archipelago (FN); (4) Atol
das Rocas (AR); (5) Recifes de Corais (RC); (6) Costa dos Corais (CC); (7) Abrolhos (AB); (8) Martim Vaz e
Trindade Archipelago (TR); and (9) Arraial do Cabo and Cabo Frio region (CF). Created with Matlab R2019a
(www.mathworks.com) and QGIS-3.4 (https://www.qgis.org).
available from the Coupled Model Intercomparison Project 5 (CMIP5). Ocean downscaling was computed
using the Regional Ocean Model System (ROMS, version 3.7)36 for the period of 1997–2005 and 2092–2100,
representing historical and extreme warming scenario, respectively. The dynamical downscaling has the objective
of producing regional simulations with a high horizontal resolution (approximately 9.3 km) forced with a low-
resolution ESM (208 km × 139 km at the equator). This allows the ocean model to resolve mesoscale processes
such as eddies, that are important for the dispersal and recruitment of fish eggs and larvae37, 38. The atmospheric
forcing and ocean boundary conditions used in both simulations come from the HadGEM2-ES model39, ensem-
ble r2i1p1 (Supplementary Table 1), and included river discharge. The inherent uncertainties involved in using
low-resolution ESM data to produce high-resolution local information were assessed by downscaling the his-
torical scenario and comparing the results with observations. This configuration allows for an indirect accuracy
assessment of model downscaling of future extreme ocean warming. For that purpose, the historical simulation
was compared with satellite SST from the Operational Sea Surface Temperature and Sea Ice Analysis (OSTIA)40
and surface currents from the Simple Ocean Data Assimilation (SODA, version 3.4.2)41.
The impacts of climate change on the seasonal SSTs of the tropical southwest Atlantic point to an overall
surface warming (relative to the historical scenario) between 1.8 and 4.5 °C in most of the equatorial region
(Fig. 1a,b). This warming will be lower during the austral summer in open ocean regions south of 5° S and over
the shelf south of 15° S (Fig. 1a). These values contrast with more widespread warming ranging from 3.5 to 4.5 °C
during the austral winter with higher values at the equator and along with the core of the Brazil Current (BC,
see Supplementary Fig. 2 for currents position) offshore the continental shelf (Fig. 1b). Our simulations agree
with previous studies which suggest that the BC is intensifying and shifting southwards due to a poleward shift
of near-surface ocean w ind42, 43. The dynamical downscaling also points to marked changes in surface current
velocities in the extreme ocean warming scenario with intense surface flow changes occurring between 5°S and
8°N (Fig. 1c,d). The NBC retroflection is expected to become weaker (− 0.6 m s−1) than today and the northern
branch of the South Equatorial Current (nSEC) stronger (0.5 m s−1).
Scientific Reports | (2021) 11:10339 | https://doi.org/10.1038/s41598-021-89192-6 3
Vol.:(0123456789)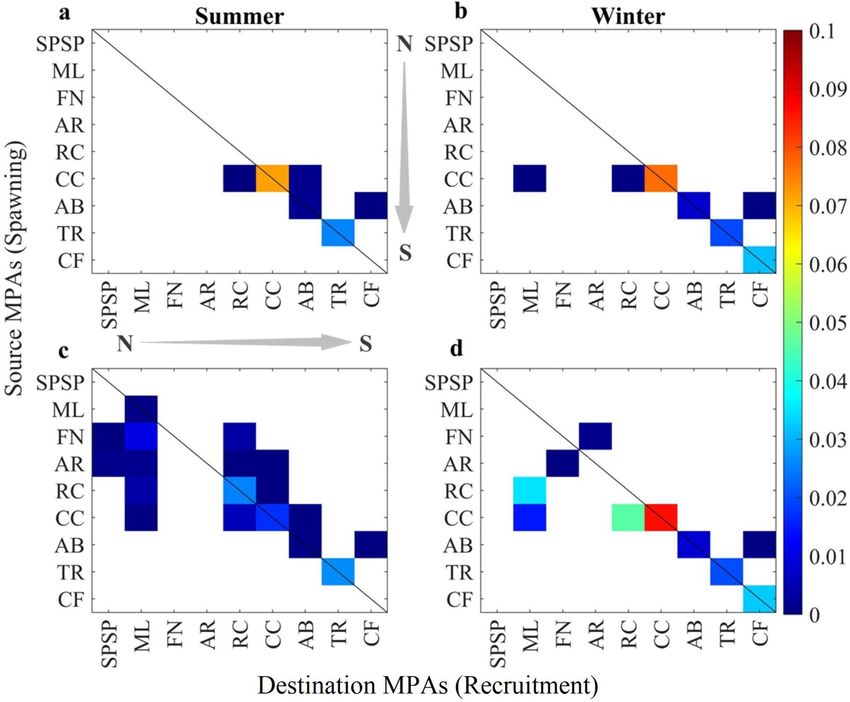
www.nature.com/scientificreports/
Figure 2. Boxplots of the average distances travelled by larvae for the summer (a) and winter (b) experiments
for historical (2008–2015)44 (dark blue) and RCP 8.5 (2092–2099), considering non acclimated (+ 0 °C) (light
blue), and acclimated (+ 3 °C) (turquoise) Sparisoma eggs and larvae. Red crosses represent the outliers of
boxplots. Spawning (MPA) sites are: São Pedro and São Paulo Archipelago (SPSP), Parcel do Manuel Luis (ML),
Fernando de Noronha Archipelago (FN), Atol das Rocas (AR), Recife dos Corais (RC), Costa dos Corais (CC),
Abrolhos (AB), Trindade and Martim Vaz islands (TR), and Cabo Frio (CF). Created with Matlab R2019a
(www.mathworks.com).
We compared the average distances travelled by larvae that were still alive at the end of historical44, non-
acclimated and acclimated (this study) simulations (Fig. 2) to assess the influence of changes in ocean circulation
on connectivities. Non-acclimated larvae released within the nSEC domain (sites 1,3 and 4 in Fig. 1 and SPSP,
FN and AR, respectively, in Fig. 2a) are expected to travel shorter distances under RCP 8.5 than today but accli-
mated larvae will eventually travel distances comparable to the historical simulation during the summer (SPSP
and AR in Fig. 2a). As the NBC retroflection becomes weaker in the future, both non-acclimated and acclimated
larvae released in site 2 will travel shorter distances (ML in Fig. 2). We also show that between 5° S and 10° S
the North Brazil Subcurrent (NBSC) will become weaker (− 0.4 m s-1) than today and the NBC will get stronger
(around 0.2 m s−1) to the north of 5° S45. For sites 5 and 6 located in the NBSC, larvae will disperse for shorter
distances in the future (RC and CC in Fig. 2) with the exception of acclimated larvae released in 6 during the
summer (RC in Fig. 2a). The BC, flowing to the south, is also expected to become more intense (especially in
the summer) southwards of 15° S (0.2–0.3 m s−1) (Fig. 1c). However, shelf flow will become slower (blue tones
in Fig. 1c,d) and non-acclimated larvae released in site 7 is expected to travel shorter distances under RCP 8.5
than they experience today (AB in Fig. 2, note that no larvae survived in site 9 during historical simulations).
The offshore island of TR (site 8 in Fig. 1) is located in a region of the southwest Atlantic where minimal changes
is surface flow are expected for the RCP 8.5 scenario and the average distance travelled by larvae is likely to
remain similar to today (TR in Fig. 2). The consequences of the heterogeneous spatial and seasonal warming
and current patterns in the tropical Atlantic to total particle mortality and MPAs connectivity will be assessed
in detail in the “Discussion” section.
Egg and larvae mortality under extreme ocean warming. We simulated fish spawning, egg and lar-
val dispersal and settlement in all MPAs considering the impacts of temperature and surface flow on mortality
(lethal temperature and advection, respectivelly), for non-acclimated and acclimated eggs and larvae, assuming
a maximum + 3 °C known thermal tolerance46 relative to present day. The lagrangian transport was computed
using the model Ichthyop (version 3.347) forced with hourly ocean conditions produced by the ocean (ROMS)
downscaling of the RCP 8.5 scenario (Supplementary Fig. 3). Despite the coarse horizontal resolution of the
native model (HadGEM2-ES, see “Methods”), the downscaling procedure resolved the ocean mesoscale dynam-
ics to a resolution of approximately 9.3 km, consistent with the size of MPAs. The reef fish used in simulations
is the grazer parrotfish of the genus Sparisoma that is widely distributed in reef areas along the Brazilian coast
and oceanic islands48. The biological characteristics of Sparisoma necessary to run all simulations were obtained
from the literature (Supplementary Table 2). A total of 70,000 eggs were released and advected for 60 days every
summer (Jan–Feb) and winter (Jul–Aug), from 2092 to 2099, with quantities proportionally distributed among
MPAs according to their size. We computed mortality due to lethal temperature (either high or low), and to
Scientific Reports | (2021) 11:10339 | https://doi.org/10.1038/s41598-021-89192-6 4
Vol:.(1234567890)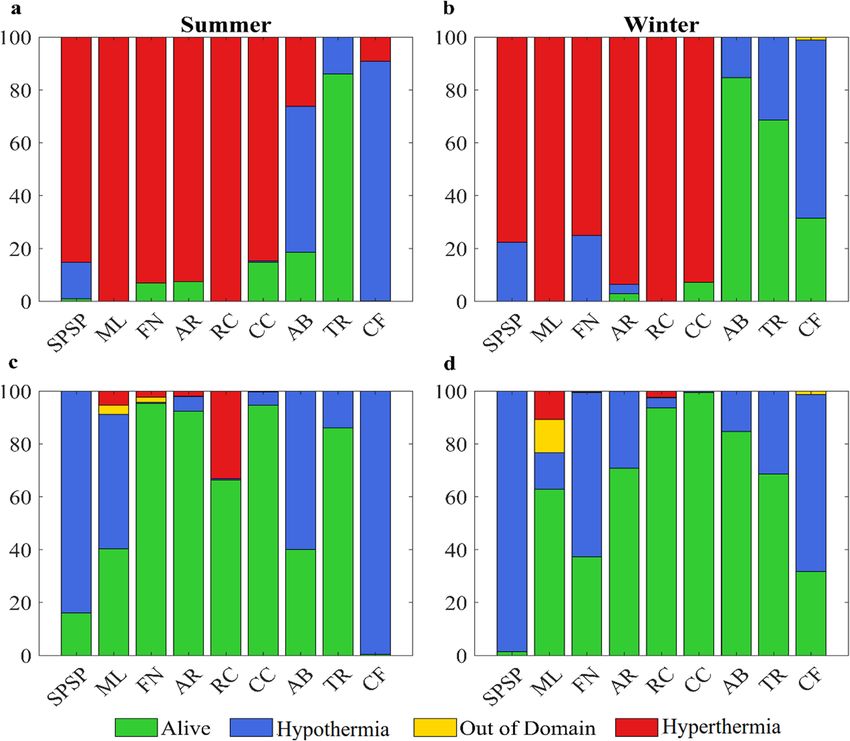
www.nature.com/scientificreports/
Figure 3. Proportion of particles spawned in each MPA that were alive or dead by hypothermia, hyperthermia
or advected out of the domain at the end of simulations. (a) summer and (b) winter non-acclimated simulations
(thermal tolerance between 24 and 30 °C); (c) summer and (d) winter acclimated simulations (thermal tolerance
between 24 and 33 °C). Created with Matlab R2019a (www.mathworks.com).
particle advection outside the model domain, with their sum representing the total mortality (%). We have not
considered the recent increase in MPA area determined for São Pedro e São Paulo Archipelago and Trindade
Archipelago49, because it has not added new reef/hard substrate that could be used for recruitment.
Average temperatures for future climate change scenario in MPAs are 3 °C higher during the summer and
4 °C during the winter relative to the reference historical scenario (1997 to 2004). Lethal high temperature
(hyperthermia) was the leading cause of mortality for non-acclimated particles in future scenarios (Fig. 3a,b),
killing over 80% of the eggs in the first hours after spawning. In some MPAs, such as the northernmost ML and
the more coastal RC, all eggs died after spawning both during the summer and winter. Mortality by lethal low
temperature (hypothermia) also occurred in simulations. However, it was generally confined to the southernmost
MPAs and in the equatorial SPSP, which is exposed to negative SST anomalies of the equatorial cold tongue. It
should be noted that the lethal temperature range used here is comparable across Sparisoma species (see refer-
ences used in Supp. Table 2). Mortality by advection of particles outside the model domain was close to zero but
slightly higher in the acclimated simulations.
Increased tolerance to warmer ocean conditions in the acclimation simulations (Fig. 3c,d) led to lower mor-
talities and lowered interannual variability (not shown). The proximity to strong currents of the northernmost
reefs of ML and high particle survival contributed to increasing the likelihood of a particle to leave the model
domain. During the summer (winter), acclimation allowed the survival of 40.3% (62.9%) in ML and 66.3%
(93.6%) in RC, contrasting with the complete die-off observed in the non-acclimated simulations. Acclimation
in the southernmost protected coastal areas of AB and CF only marginally enhanced survival (around 2%).
Total mortalities were significantly different between the acclimated and non-acclimated experiments (p < 0.001
by Kruskal–Wallis test), but differences between summer vs winter for the same thermal tolerance were not
significant.
Anticipated changes in demographic connectivity of MPAs. The demographic connectivity of
MPAs was computed as the probability that a particle leaving one site will be retained in the same site or reach a
Scientific Reports | (2021) 11:10339 | https://doi.org/10.1038/s41598-021-89192-6 5
Vol.:(0123456789)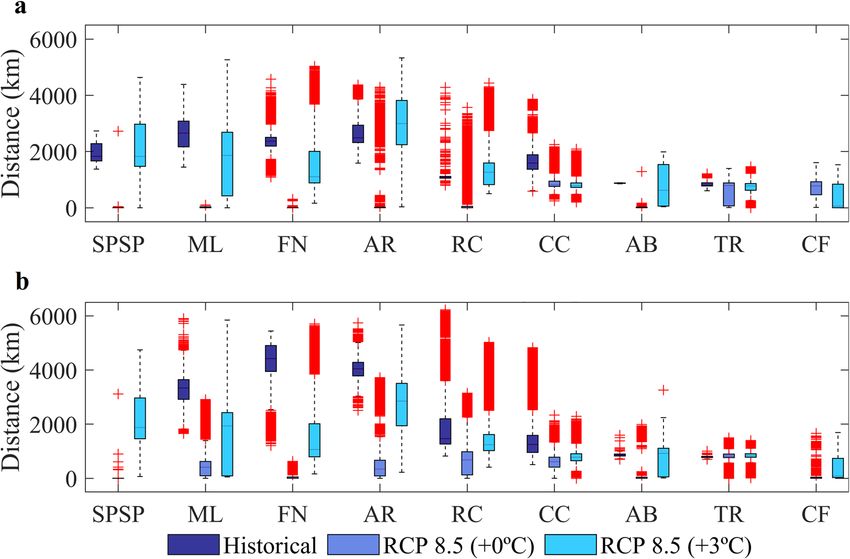
www.nature.com/scientificreports/
Figure 4. Seasonal Transition Probability Matrices (TPM) between source and recipient MPAs representing
their demographic connectivity. Values along the diagonal black line indicate the probability of local retention
of each MPA. Summer and winter connectivity are shown for non-acclimated (a,b) and acclimated (c,d) climate
change simulations. Created with Matlab R2019a (www.mathworks.com).
different one within its life span in the plankton (the pelagic larval duration, PLD). Larval recruitment and local
retention rates were calculated for every summer and winter of each year and are summarised in the transition
probability matrices (TPMs) shown in Fig. 4 (see “Methods” for details). Mortality caused by ocean warming has
a strong influence on connectivity and will be higher without acclimation, especially in the egg phase. In some
MPAs (ML, FN, AR, and RC), extreme die-offs will impede recruitment and their demographic connectivity. So,
the closer an MPA is to the equator, the less connected it will be with the rest of the network (Fig. 4a,b).
The survival of eggs and larvae caused by acclimation will enhance the connectivity of MPAs in the northern
half of the Southwestern Atlantic (Fig. 4c,d). Summer spawning will be especiallyimportant for the northern-
most site of ML as it will receive larvae from FN and AR oceanic islands and the coastal reefs of RC and CC.
An essential feature of the acclimation scenario is that the oceanic islands of FN and AR will become sources
of larvae for coastal MPAs at the centre of the network such as RC and CC during the summer but not during
the winter. It is also clear that CC will play a considerable role as a source of propagules for both southern and
northern MPAs of RC and ML, respectively. Self-seeding induced by local retention (diagonal lines in Fig. 4)
will be an important process for the maintenance of local populations of Sparisoma in the future for most coastal
MPAs even without acclimation. Local retention is highest for CC and the southernmost CF in most scenarios,
particularly during the winter.
Discussion
Our study presents the potential impacts of global warming on the connectivity of a large network of MPAs
extending along 4300 km in the Southwestern Atlantic. By not running simulations for mitigated emissions (e.g.,
RCP 4.5) we deliberately focus on the expected consequences of a worst-case (extreme) scenario. The changes
reported here should, therefore, be viewed as a possible representation of the impact of some anthropogenic fac-
tors that influencing on the connectivity of MPAs. These impacts are anticipated by simulations on a biophysical
modelling scheme integrating organismal (biological and behavioural) responses and the physical environment
using a high-resolution ocean model. The main expected impact is a possible range expansion of Sparisoma
Scientific Reports | (2021) 11:10339 | https://doi.org/10.1038/s41598-021-89192-6 6
Vol:.(1234567890)www.nature.com/scientificreports/
dispersion towards subtropical reef environments facilitated by increasing directional agreement between ocean
currents and temperature g radients50, 51. Seasonal changes in ocean temperature and surface currents generated
by our ocean downscaling (Fig. 1) agrees with other CMIP5 projections of a stronger-than-present offshore
BC alongside a weaker flow over the shelf south of 15°S and a weaker NBSC to the north45. Our downscaling
experiments also revealed that seasonal warming will be largest during the winter (Fig. 1b), reducing mortality
by hypothermia in CC, AB, TR and CF (also impacting total mortality, see below) seen in historical (2008–2015)
simulations44. This differential seasonal warming usually goes undetected when SSTs are averaged over the region.
Different latitudinal mortality rates will enhance the isolation of island and coastal MPAs to the north (com-
pare Fig. 5a,b and c,d), especially in the summer, caused by higher equatorward mortality resulting from ocean
warming. Summer SSTs under climate change scenario will be warmer than today and above the tolerance
threshold for Sparisoma in most MPAs, except for the southernmost sites (Supplementary Fig. 4). Results of
biophysical simulations may vary depending on the numerical model used,but errors and biases of our ocean
model (Supp. Fig. 5–8) are well constrained and within the range of variation of the biological model and do
not compromise our interpretations. Besides, despite known SST biases in the tropical Atlantic, our results are
in line with other climate models capturing the dominant seasonal variability52.
Ocean warming will cause higher total mortality of eggs and larvae of parrotfishes in northernmost MPAs
(mostly in ML, FN, AR, RC and CC) compared with modelled present-day (historical simulation) results
obtained from a different study using the same simulation a pproach44 (Supplementary Fig. 9). Note that for the
southern MPAs of AB, CF and TR, simulated mortalities are higher today, in this case, caused by hypothermia,
than our projection for the RCP 8.5 scenario. This future increase in larval survival will favour the tropicaliza-
tion of the southernmost MPAs by a combination of mortality reduction of eggs and larvae contributing to local
retention and a north–south connection of CC-AB (summer only) and AB-CF (summer and winter, Fig. 4a,b).
We can infer from our results how larval mortality, reproductive timing, and changes in hydrodynamics will
impact the effectiveness of MPA networks in the future53, 54. Note that the biological impact of future changes
is limited to fish survival (i.e., mortality) and fisiological changes were not directly simulated, although we did
include the possibility of acclimation. Without acclimation, total mortality for summer spawning will be higher
than today for most MPAs, but much lower during the winter for the southern AB and CF (Supp. Figure 9b),
probably impairing summertime spawning and limiting the reproductive season to winter. Six out of nine MPAs
are in the warmest tropical sites, where local loss is unlikely to be r eplaced55. We show that connectivity under a
warmer tropical Atlantic will not only shift southwards, but it will also increase local retention at these southern
MPAs (Fig. 4a,b). This finding contrasts with the low present-day demographic connectivity and local retention
in these MPAs determined for Sparisoma44. Annual recruitment rates under RCP 8.5 conditions (Supplementary
Fig. 10) will be reduced by one order of magnitude compared to present-day simulations. However, the number
of MPAs with local retention (calculated in the same way as self-recruitment in44) will increase (Supplemen-
tary Fig. 11) from a maximum of two sites today (CC and TR) to four (CC, AB, TR and CF) in the future. This
increase in local retention is the result of an increase in larval survival in AB and CF due to warmer conditions
compared to simulations carried out for present conditions (see Fig. 2 in44) and weaker coastal flow (Fig. 1c,d).
During the summer, acclimation will potentially increase the island-to-shelf demographic connectivity,
between the oceanic islands of FN, AR and ML in the northern shelf. A southerly oriented pathway will also
connect the islands FN and AR with the coastal RC and CC, forming another important island/shelf network
(Fig. 4c). This connectivity of acclimated propagules spawned at FN and AR with ML may be related to an
increase in survival (Supplementary Fig. 9) and the likelyhood of entering the stronger nSEC under RCP 8.5
scenario. During the winter, the FN-AR connection with the coastal RC and CC sites will be lost due to higher
mortalities (Supp. Figure 9b) and the seasonal southward migration of the sSEC bifurcation. Our simulations
show a general pattern characterized by a consistent southward shift of connectivity under severe ocean warm-
ing relative to t oday44. Without acclimation, the potential spatial distribution of particles in the future will be
shifted southwards during the summer, because of excessive mortality at lower latitudes (e.g., ML and RC). This
is highlighted by the spatial distribution of surviving larvae that shows a tendency for isolation of oceanic islands
and coastal MPAs during the summer, with northernmost (1, 2, 3 and 4 in Fig. 5c) and southernmost MPAs (7, 8
and 9 in Fig. 5c) disconnected from the central region. Connectivity will also shift towards the south compared to
the present-day. However, the spatial distribution of non-acclimated larvae during the winter is not as fragmented
(see Fig. 5d). Without acclimation, there is a risk that connectivity of tropical MPAs in the south Atlantic could be
further reduced or even lost under a climate change scenario. For coastal areas, larval dispersion patterns suggest
that increasing the extent of protected recruitment areas or adapting MPAs boundaries could minimize this loss.
We have shown that ocean warming may cause detectable changes in MPA connectivity, including the reduc-
tion in the incidence of fish larvae at northernmost MPAs, isolation of oceanic islands and a connectivity shift
of the network towards the south (Fig. 5a to d). On the other hand, acclimation will not only allow high particle
survival but also enhance their spatial distribution and increase their incidence in tropical and southern MPAs
(Fig. 5e,f). Another critical difference between present-day connectivity and those simulated for a warmer ocean
is an increase of local retention for both non-acclimated and acclimated reef fish propagules. Both low mortality
and weaker shelf currents play a role in the increase of local retention in coastal MPAs such as CC, AB and CF
for the RCP 8.5 simulations. Note that in these sites eggs and larvae will tend to travel shorter distances com-
pared to those in more energetic sites like FN and AR (See Fig. 2). One of the most fragile MPA is TR because,
as today, local retention is the only source of recruits (site8 in Fig. 5). The high concentration of larvae around
TR seen in Fig. 5 suggests that local retention may be influenced by the physical interaction of the flow with the
Vitória-Trindade seamount chain reducing local advection. These features are adequately represented in the
eddy-resolving (high horizontal resolution) model used in the dynamical downscaling of the RCP 8.5 scenario.
Scientific Reports | (2021) 11:10339 | https://doi.org/10.1038/s41598-021-89192-6 7
Vol.:(0123456789)www.nature.com/scientificreports/
Figure 5. Spatial distribution of total surviving larvae during all experiments. (a) Summer and (b) winter based
on present-day simulation (2008 to 2015). (c) Summer and (d) winter for RCP 8.5 (2092 to 2100) considering
present-day thermal tolerance. (e) Summer and (f) winter considering acclimation of + 3 °C in RCP 8.5 scenario.
Warm colours represent regions with the highest density of larvae along the simulations. Black dots represent
MPA locations as in Fig. 1. Created with Matlab R2019a (www.mathworks.com) and QGIS-3.4 (https://www.
qgis.org).
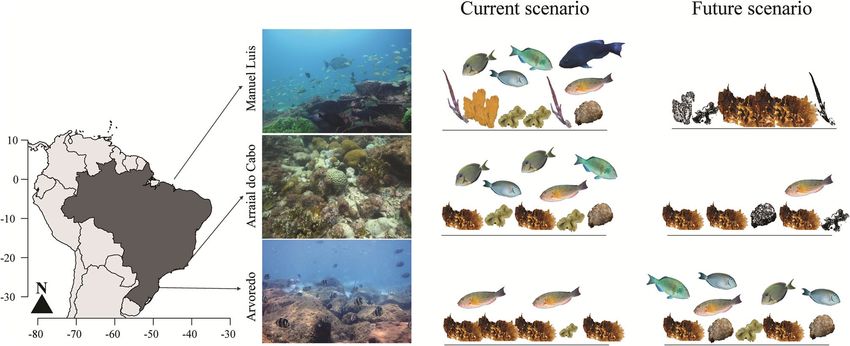
Figure 6. Climate-change induced tropicalization of subtropical and temperate reefs. Schematic representation
of the projected changes in reef ecosystems of the western south Atlantic (first column) caused by tropicalization.
The second and third columns depict the present-day higher biomass of herbivore reef fish in the t ropics56 and
higher macroalgae and turf algae biomass in the subtropic and temperate s ites57. The future climate change
scenario is depicted in the fourth column with an increase of algal cover in tropical reefs as a response to greater
mortality of grazers and reduced grazing pressure. Subtropical to temperate reefs will display higher grazer fish
biomass and lower dominance of macroalgae. Created with Adobe Illustrator-2020 (https://www.adobe.com/).
Scientific Reports | (2021) 11:10339 | https://doi.org/10.1038/s41598-021-89192-6 8
Vol:.(1234567890)www.nature.com/scientificreports/
MPA Area (km2) Number of released particles Coordinates Number of cells in grid model
SPSP 125.6 2133 0°54′N, 29°18′W 4
ML 1257.6 8530 0°55′N, 44°20′W 16
FN 447.2 4247 3°51′S, 32°29′W 8
AR 308.7 2123 3°51′S, 33°48′W 4
RC 1507.4 7932 5°13′S, 35°18′W 17
CC 3995.4 21,298 9°12′S, 35°13′W 48
AB 992.4 4824 17°59′S, 38°39′W 10
TR 2299.9 11,221 20°30′S, 29°04′W 24
CF 1616.6 7692 22°53′S, 41°6′W 23
Table 1. Areas of each MPA used in this study, which the number of released particles launched from each,
and the coordinates of the centroid in each location. SPSP, São Pedro and São Paulo Archipelago; ML, Manuel
Luís Parcel; FN, Fernando de Noronha Archipelago; AR, Atol das Rocas; RC, Recife de Corais; CC, Costa de
Corais; AB, Abrolhos; TR, Trindade and Martim Vaz Archipelago; CF, Cabo Frio.
Tropical MPAs around the world are likely to become increasingly exposed to extreme thermal conditions and
future conservation decisions will demand the understanding of complex biophysical interactions. The interplay
of temperature-induced reef fish mortality and regional ocean circulation suggests that connectivity may become
seriously compromised in low latitude habitats but enhanced in temperate ones. The poleward movement of reef
fauna under global warming driven by the search for suitable thermal environments may occur concomitantly
with acclimation due to transgeneracional metabolic a cclimation13, 33. The fact that the same reef fish species
can be found today living at different latitudes and temperature regimes (e.g., S. radians, 33°N–30°S) suggests
that acclimation over two or more generations may become an important adaptation to ocean warming in the
future. The tropicalization of subtropical and temperate MPAs raises significant concerns about their functional
integrity and long-term resilience since the arrival of warm species has the potential to alter ecological network
structure and lead to a complete ecosystem transformation (Fig. 6). In this regard, the major losses of marine
diversity and biomass of herbivores fishes in the tropics and gains in subtropical areas suggest that these will
experience substantial species turnover and homogenization.
Methods
Hydrodynamical model. The regional ocean downscaling seeks to combine large-scale atmospheric
features and global climate variability from Earth System Models (ESMs) with smaller-scale local conditions,
especially mesoscale ocean activity, resolved in high-resolution regional models. Along this process temporal,
horizontal and vertical resolutions from ESMs are numerically interpolated to a higher resolution grid. We used
both historical simulation and RCP 8.5 projections from the Earth System Model HadGEM2-ES from CMIP5,
ensemble r2i1p1 (available at https://esgf-data.dkrz.de/projects/esgf-dkrz/39) as our source of global climate
variability. This ensemble was chosen because it provides all the atmospheric and ocean variables required by
the ocean model (see Supplementary Table 1) to run the downscaled experiments (initial, forcing and boundary
conditions) and has been used in the region with good r esults58, 59. The historical simulations were used to assess
the likely root mean square error and bias of the RCP 8.5 ocean downscaling experiment. The atmospheric reso-
lution of the forcing variables is 1.875° × 1.25° with 38 vertical levels and an ocean resolution of 1° (increasing
to 1/3° at the equator), with 40 vertical levels39. The forcing and ocean boundary conditions were applied to the
Regional Ocean Modelling System (ROMS, version 3.7) developed by Rutgers36 for the dynamical downscaling.
The ocean grid domain of the downscaling simulations is bounded at 10° N–30° S and 20° W–70° W with a
horizontal resolution of 1/12° (approximately 9.3 km) and 30 vertical sigma levels. Hourly outputs of the down-
scaling experiment at each grid point and depth layer were stored every year for January–February (summer)
and July–August (winter), to be used in the biological simulations. Air-sea fluxes were calculated using the bulk
parameterization60, 61, and the open boundary conditions were defined according to the previous work62. A
Flather-type condition was applied for the barotropic mode, the free surface, and the mixing of turbulent kinetic
energy (TKE). The Chapman-implicit boundary condition was applied to the closed boundaries. The baroclinic
mode and the inertial passive tracers used a combination of radiation and nudging63 and the vertical mixing
parameterization was the K-profile turbulence closure64. The model atmosphere was forced with HadGEM2-ES
outputs, every six hours by surface forcing parameters and monthly by ocean boundary components. The list of
these parameters is listed in Supplementary Table 1.
Two main simulations were performed, one called historical that was run from 1997 to 2004 and another
called RCP 8.5 that spans the period between 2090 and 2100 (Supplementary Table 3). Results from historical
simulation were compared with SST from Operational Sea Surface Temperature and Sea Ice Analysis (OSTIA,
fi ce.com/data/OSTIA40) and vertical temperature profiles from Prediction and
available at http://ghrsst-pp.metof
Research Moored Array in the Tropical Atlantic buoys (PIRATA) (available at https://www.pmel.noaa.gov/tao/
drupal/disdel/, Supplementary Fig. 12)65, surface currents from the Simple Ocean Data Assimilation (SODA,
version 3.4.2, available at https://www.atmos.umd.edu/~ocean/index_files/soda3.4.2_mn_download_b.htm)41.
Differences between RCP 8.5 and historical simulations were calculated to characterize the main hydrodynamical
Scientific Reports | (2021) 11:10339 | https://doi.org/10.1038/s41598-021-89192-6 9
Vol.:(0123456789)www.nature.com/scientificreports/
changes between them (Fig. 1). The dynamical downscaling solutions were compared with observations by
computing the Root Mean Square Error (RMSE) (Supplementary Figs. 6, 8) and bias (Supplementary Figs. 5, 7):
1
n
RMSE = (XROMS − Xobs )2 (1)
N i=1
1 n
Bias = (XROMS − Xobs ) (2)
N i=1
Hourly outputs of austral summer (January–February) and winter (July–August) from RCP 8.5 (2092–2100)
were stored to be used as an input for the biological simulations (Supplementary Fig. 3).
Egg and larval transport. Egg and larval dispersion and settlement into MPAs of the reef fish genus Spari-
soma (Scaridae) were simulated for a non-acclimated scenario assuming present-day thermal tolerance (24 to
30 °C) and an acclimated scenario where eggs and larvae are able to adapt to an increase of up to + 3 °C in SST.
Simulations were performed using the Lagrangian advection model ICHTHYOP (version 3.3)47 based on hourly
fields forcing conditions produced by the RCP 8.5 (2092–2100). This genus is found in the majority of reef areas
along the Brazilian coast and islands20, although not always as a stable population. A total of 70,000 eggs were
released and advected for 60 days in each experiment. The quantity launched for each MPA was proportionally
distributed according to their size (Table 1). The recent increase in the MPA area determined for São Pedro e São
Paulo Archipelago and Trindade49 was not considered as it did not result in an increase of reef substrate neces-
sary for fish spawning and recruitment66.
Spawning can happen at any time during the year but tends to concentrate during summer and winter, and
eggs are released in the first meters of the water column67. Therefore, in our simulations, spawning occurred
yearly, both in summer (January and February) and winter (July and August) from 1997 to 2004 and from 2092
to 2100. The egg phase duration was set to 24 h, and egg density is 0.0089 g cm−3, following68. Each simulation
had a duration of 60 days, equivalent to the average PLD found for this g enus69. Particles were propagated over
time using Runge–Kutta 4th Order scheme70 with a time step of 1 h.
Recruitment was computed as the total number of larvae inside an MPA with larvae considered competent
to recruit only at the end of each simulation (Eq. 3). Local Retention (LR) represents the number of particles
spawned in an MPA that remained in the same MPA (Eq. 4)44.
t cij + t cii
Rt,i = (3)
t Ns
cii
LRt,i = t (4)
t Ni
where t is the integration of time for each simulation; cij represents the larvae spawned in MPA i that were
recruited in MPA j; Ns is the total number of eggs spawned in all MPAs; cii is the number of particles spawned
in MPA i that were recruited in the same MPA; Ni is the number of eggs spawned in MPA i.
The transition probability matrices (TPM), or simply connectivity matrices, were calculated to indicate
the probability of a particle spawned in site i (source) to recruit in j (sink) or remain in i, at time t53, 71. A
Kruskal–Wallis test was used to identify significant variabilty in mortalities among seasons and between the
acclimated and non-acclimated simulations. The likelihood of larvae to cross each grid cell of the domain shown
in Fig. 4 was estimated using the kernel density estimation m ethod72, assembling all years of each simulated
scenario. Lower survivorship tends to inflate the probability density so, to make these maps comparable, the final
probabilities were scaled by giving more weight to simulations with larger numbers of living particles.
Data availability
All data needed to evaluate the conclusions in the paper are present in the paper and the Supplementary Materi-
als. Additional data related to this paper may be requested from the authors.
Received: 30 September 2020; Accepted: 21 April 2021
References
1. Selig, E. R., Casey, K. S. & Bruno, J. F. Temperature-driven coral decline: the role of marine protected areas. Glob. Chang. Biol. 18,
1561–1570 (2012).
2. Mumby, P. J., Wolff, N. H., Bozec, Y. M., Chollett, I. & Halloran, P. Operationalizing the resilience of coral reefs in an era of climate
change. Conserv. Lett. 7, 176–187 (2014).
3. Bellwood, D. R., Hughes, T. P., Folke, C. & Nyström, M. Confronting the coral reef crisis. Nature 429, 827–833 (2004).
4. Hughes, T. P. et al. Phase shifts, herbivory, and the resilience of coral reefs to climate change. Curr. Biol. 17, 360–365 (2007).
5. Burkepile, D. E. et al. Species-specific patterns in corallivory and spongivory among Caribbean parrotfishes. Coral Reefs 38, 417–423
(2019).
6. Bonaldo, R., Hoey, A. & Bellwood, D. The Ecosystem Roles of Parrotfishes on Tropical Reefs. In Oceanography and Marine Biology:
An Annual Review 81–132 (2014). https://doi.org/10.1201/b17143-3.
7. Mendes, T. C., Ferreira, C. E. L. & Clements, K. D. Discordance between diet analysis and dietary macronutrient content in four
nominally herbivorous fishes from the Southwestern Atlantic. Mar. Biol. 165, 180 (2018).
Scientific Reports | (2021) 11:10339 | https://doi.org/10.1038/s41598-021-89192-6 10
Vol:.(1234567890)www.nature.com/scientificreports/
8. Vergés, A., Doropoulos, C., Malcolm, H. A., Skye, M. & Garcia-pizá, M. Long-term empirical evidence of ocean warming leading to
tropicalization of fish communities, increased herbivory, and loss of kelp. PNAS https://doi.org/10.1073/pnas.1610725113 (2016).
9. Bruno, J. F. et al. Climate change threatens the world’s marine protected areas. Nat. Clim. Chang. 8, 499–503 (2018).
10. Pinsky, M. L., Selden, R. L. & Kitchel, Z. J. Climate-driven shifts in marine species ranges: scaling from organisms to communities.
Ann. Rev. Mar. Sci. https://doi.org/10.1146/annurev-marine-010419-010916 (2020).
11. Mora, C. et al. The projected timing of climate departure from recent variability. Nature 502, 183–187 (2013).
12. Munday, P. L., Jones, G. P., Pratchett, M. S. & Williams, A. J. Climate change and the future for coral reef fishes. Fish Fish. 9, 261–285
(2008).
13. Veilleux, H. D. & Donelson, J. M. Reproductive gene expression in a coral reef fish exposed to increasing temperature across
generations. Conserv. Physiol. 6, 1–12 (2018).
14. Iftikar, F. I., MacDonald, J. R., Baker, D. W., Renshaw, G. M. C. & Hickey, A. J. R. Could thermal sensitivity of mitochondria deter-
mine species distribution in a changing climate?. J. Exp. Biol. 217, 2348–2357 (2014).
15. Donelson, J. M., Munday, P. L., McCormick, M. I. & Pitcher, C. R. Rapid transgenerational acclimation of a tropical reef fish to
climate change. Nat. Clim. Chang. 2, 30–32 (2012).
16. van Vuuren, D. P. et al. The representative concentration pathways: an overview. Clim. Change 109, 5–31 (2011).
17. Trisos, C. H., Merow, C. & Pigot, A. L. The projected timing of abrupt ecological disruption from climate change. Nature 580,
496–501 (2020).
18. Hausfather, Z. & Peters, G. P. Emissions—the ‘business as usual’ story is misleading. Nature 577, 618–620 (2020).
19. Freer, J. J., Partridge, J. C., Tarling, G. A., Collins, M. A. & Genner, M. J. Predicting ecological responses in a changing ocean: the
effects of future climate uncertainty. Mar. Biol. 165, 7 (2018).
20. Floeter, S. R. et al. Atlantic reef fish biogeography and evolution. J. Biogeogr. 35, 22–47 (2008).
21. Diversity, C. B. Target 11: Protected areas increased and improved. Quick Guides for the Aichi Biodiversity Targets (2011).
22. Hughes, T. P. et al. Coral reefs in the Anthropocene. Nature 546, 82–90 (2017).
23. McLeod, I. M. et al. Latitudinal variation in larval development of coral reef fishes: implications of a warming ocean. Mar. Ecol.
Prog. Ser. 521, 129–141 (2015).
24. Sponaugle, S., Grorud-Colvert, K. & Pinkard, D. Temperature-mediated variation in early life history traits and recruitment success
of the coral reef fish Thalassoma bifasciatum in the Florida Keys. Mar. Ecol. Prog. Ser. 308, 1–15 (2006).
25. Sponaugle, S., Boulay, J. & Rankin, T. Growth- and size-selective mortality in pelagic l arvae of a common reef fish. Aquat. Biol. 13,
263–273 (2011).
26. Barneche, D. R., Jahn, M. & Seebacher, F. Warming increases the cost of growth in a model vertebrate. Funct. Ecol. https://doi.org/
10.1111/1365-2435.13348 (2019).
27. Munday, P. L., Kingsford, M. J., O’Callaghan, M. & Donelson, J. M. Elevated temperature restricts growth potential of the coral
reef fish Acanthochromis polyacanthus. Coral Reefs 27, 927–931 (2008).
28. Munday, P. L. et al. Climate change and coral reef connectivity. Coral Reefs 28, 379–395 (2009).
29. Molinos, J. G. et al. Climate velocity and the future global redistribution of marine biodiversity. Nat. Clim. Chang. 6, 83–88 (2016).
30. Twiname, S. et al. A cross-scale framework to support a mechanistic understanding and modelling of marine climate-driven spe-
cies redistribution, from individuals to communities. Ecography (Cop). https://doi.org/10.1111/ecog.04996 (2020).
31. Donelson, J. M., McCormick, M. I., Booth, D. J. & Munday, P. L. Reproductive acclimation to increased water temperature in a
tropical reef fish. PLoS ONE 9, e97223 (2014).
32. Sunday, J. M., Bates, A. E. & Dulvy, N. K. Thermal tolerance and the global redistribution of animals. Nat. Clim. Chang. 2, 686–690
(2012).
33. Habary, A., Johansen, J. L., Nay, T. J., Steffensen, J. F. & Rummer, J. L. Adapt, move or die—how will tropical coral reef fishes cope
with ocean warming?. Glob. Chang. Biol. 23, 566–577 (2017).
34. Brito-Morales, I. et al. Climate velocity reveals increasing exposure of deep-ocean biodiversity to future warming. Nat. Clim. Chang.
10, 576–581 (2020).
35. Gerber, L. R., Mancha-Cisneros, M. D. M., O’Connor, M. I. & Selig, E. R. Climate change impacts on connectivity in the ocean:
Implications for conservation. Ecosphere 5, art33 (2014).
36. Shchepetkin, A. F. & McWilliams, J. C. The regional oceanic modeling system (ROMS): a split-explicit, free-surface, topography-
following-coordinate oceanic model. Ocean Model 9, 347–404 (2005).
37. Berenshtein, I. et al. Biophysical simulations support schooling behavior of fish larvae throughout ontogeny. Front. Mar. Sci. 5,
1–12 (2018).
38. IOCCG. Remote sensing in fisheries and aquaculture. and Aquaculture. , IOCCG,. http://w ww.i occg.o
rg/r eport s/r eport 8.p
df (2009).
39. Jones, C. D. et al. The HadGEM2-ES implementation of CMIP5 centennial simulations. Geosci. Model Dev. 4, 543–570 (2011).
40. Donlon, C. J. et al. The operational sea surface temperature and sea ice analysis (OSTIA) system. Remote Sens. Environ. 116,
140–158 (2012).
41. Carton, J. A., Chepurin, G. A. & Chen, L. SODA3: a new ocean climate reanalysis. J. Clim. 31, 6967–6983 (2018).
42. Franco, B. C. et al. Climate change impacts on the atmospheric circulation, ocean, and fisheries in the southwest South Atlantic
Ocean: a review. Clim. Change https://doi.org/10.1007/s10584-020-02783-6 (2020).
43. Yang, H. et al. Intensification and poleward shift of subtropical western boundary currents in a warming climate. J. Geophys. Res.
Ocean 121, 4928–4945 (2016).
44. Endo, C. A. K., Gherardi, D. F. M., Pezzi, L. P. & Lima, L. N. Low connectivity compromises the conservation of reef fishes by
marine protected areas in the tropical South Atlantic. Sci. Rep. 9, 1–11 (2019).
45. Pontes, G. M. et al. Projected changes to South Atlantic boundary currents and confluence region in the CMIP5 models: the role
of wind and deep ocean changes. Environ. Res. Lett. 11, 094013 (2016).
46. Donelson, J. M., Munday, P. L., Mccormick, M. I. & Nilsson, G. E. Acclimation to predicted ocean warming through developmental
plasticity in a tropical reef fish. Glob. Chang. Biol. 17, 1712–1719 (2011).
47. Lett, C. et al. A Lagrangian tool for modelling ichthyoplankton dynamics. Environ. Model. Softw. 23, 1210–1214 (2008).
48. Pinheiro, H. T. et al. South-western Atlantic reef fishes: Zoogeographical patterns and ecological drivers reveal a secondary bio-
diversity centre in the Atlantic Ocean. Divers. Distrib. 24, 951–965 (2018).
49. Giglio, V. J. et al. Large and remote marine protected areas in the South Atlantic Ocean are flawed and raise concerns: Comments
on Soares and Lucas (2018). Mar. Policy 96, 13–17 (2018).
50. Garciá Molinos, J., Burrows, M. T. & Poloczanska, E. S. Ocean currents modify the coupling between climate change and biogeo-
graphical shifts. Sci. Rep. 7, 1–9 (2017).
51. Inagaki, K. Y., Pennino, M. G., Floeter, S. R., Hay, M. E. & Longo, G. O. Trophic interactions will expand geographically but be less
intense as oceans warm. Glob. Chang. Biol. 26, 6805–6812 (2020).
52. Brierley, C. & Wainer, I. Inter-annual variability in the tropical Atlantic from the Last Glacial Maximum into future climate projec-
tions simulated by CMIP5/PMIP3. Clim. Past 14, 1377–1390 (2018).
53. Andrello, M., Mouillot, D., Somot, S., Thuiller, W. & Manel, S. Additive effects of climate change on connectivity between marine
protected areas and larval supply to fished areas. Divers. Distrib. 21, 139–150 (2015).
54. Carr, M. H. et al. The central importance of ecological spatial connectivity to effective coastal marine protected areas and to meet-
ing the challenges of climate change in the marine environment. Aquat. Conserv. Mar. Freshw. Ecosyst. 27, 6–29 (2017).
Scientific Reports | (2021) 11:10339 | https://doi.org/10.1038/s41598-021-89192-6 11
Vol.:(0123456789)www.nature.com/scientificreports/
55. Stuart-Smith, R. D., Edgar, G. J., Barrett, N. S., Kininmonth, S. J. & Bates, A. E. Thermal biases and vulnerability to warming in
the world’s marine fauna. Nature 528, 88–92 (2015).
56. Morais, R. A., Ferreira, C. E. L. & Floeter, S. R. Spatial patterns of fish standing biomass across Brazilian reefs. J. Fish Biol. 91,
1642–1667 (2017).
57. Aued, A. W. et al. Large-scale patterns of benthic marine communities in the Brazilian province. PLoS ONE 13, 1–15 (2018).
58. Toste, R., Assad, L. P. D. F. & Landau, L. Downscaling of the global HadGEM2-ES results to model the future and present-day
ocean conditions of the southeastern Brazilian continental shelf. Clim. Dyn. 0, 1–17 (2017).
59. Bopp, L. et al. Multiple stressors of ocean ecosystems in the 21st century : projections with CMIP5 models. Biogeosciences 10,
6225–6245 (2013).
60. Fairall, C. W. et al. Cool-skin and warm-layer effects on sea surface temperature. J. Geophys. Res. Ocean 101, 1295–1308 (1996).
61. Fairall, C. W., Bradley, E. F., Hare, J. E., Grachev, A. A. & Edson, J. B. Bulk parameterization of air-sea fluxes: updates and verifica-
tion for the COARE algorithm. J. Clim. 16, 571–591 (2003).
62. Lima, L. N., Pezzi, L. P., Penny, S. G. & Tanajura, C. A. S. An investigation of ocean model uncertainties through ensemble forecast
experiments in the Southwest Atlantic Ocean. J. Geophys. Res. Ocean. 124, 432–452 (2019).
63. Marchesiello, P., McWilliams, J. C. & Shchepetkin, A. Open boundary conditions for long-term integration of regional oceanic
models. Ocean Model 3, 1–20 (2001).
64. Large, W. G., McWilliams, J. C. & Doney, S. C. Oceanic vertical mixing: a review and a model with a nonlocal boundary layer
parameterization. Rev. Geophys. 32, 363 (1994).
65. Foltz, G. R., Schmid, C. & Lumpkin, R. An enhanced PIRATA dataset for tropical Atlantic Ocean-atmosphere research. J. Clim.
31, 1499–1524 (2018).
66. Booth, D. J., Beretta, G. A., Brown, L. & Figueira, W. F. Predicting success of range-expanding coral reef fish in temperate habitats
using temperature-abundance relationships. Front. Mar. Sci. 5, (2018).
67. Molina-ureña, H. Towards an Ecosystem Approach for Non-Target Reef Fishes: Habitat Uses and Population Dynamics of South
Florida Parrotfishes (Perciformes: Scaridae). (Open Access Dissertations 237, 2009).
68. Robertson, D. R. Egg size in relation to fertilization dynamics in free-spawning tropical reef fishes. Oecologia 108, 95–104 (1996).
69. Robertson, D. R. et al. Mechanisms of speciation and faunal enrichment in Atlantic parrotfishes. Mol. Phylogenet. Evol. 40, 795–807
(2006).
70. Islam, M. A. A comparative study on numerical solutions of initial value problems (IVP) for ordinary differential equations (ODE)
with Euler and Runge Kutta methods. Am. J. Comput. Math. 05, 393–404 (2015).
71. D’Agostini, A., Gherardi, D. F. M. & Pezzi, L. P. Connectivity of marine protected areas and its relation with total kinetic energy.
PLoS ONE 10, 1–19 (2015).
72. Mitarai, S., Siegel, D. A., Watson, J. R., Dong, C. & McWilliams, J. C. Quantifying connectivity in the coastal ocean with application
to the Southern California Bight. J. Geophys. Res. 114, C10026 (2009).
Acknowledgements
We thank Luiz E. O. C. Aragão for thoughtful discussions and Mainara B. Gouveia for helping with Figure 5. We
thank Chris Jones from Mett Office, for the HadGEM2-ES outputs ensemble r2i1p1. All the simulations used
the Kerana cluster at CPTEC/INPE, that is also funded by the Brazilian agencies CNPq, CAPES and FAPERGS
to the following projects: (i) Atlantic Modeling and Observation System (CNPq/PROANTAR 443013/2018-7);
(ii) National Institute for Science and Technology of the Cryosphere (CNPq 704222/2009 + FAPERGS 17/2551-
0000518-0). This study was carried out under the project "Programa de Monitoramento de Longa Duração das
Comunidades Recifais de Ilhas Oceânicas" – PELD/ILOC (CNPq/CAPES/FAPs/BC-Fundo Newton, 15/2016).
CNPq funds L.P.P. through a CNPq Scientific Productivity Fellow (CNPq/304858/2019-6). L.S.L. received sup-
port from by the Coordenação de Aperfeiçoamento de Pessoal de Nível Superior – Brasil (CAPES) – Finance
Code 001.
Author contributions
L.S.L., D.F.M.G. conceived and designed the experiments, L.S.L. and L.G.P. conducted the hydrodynamical
experiments, L.S.L. and C.A.K.E. conducted the biological experiments, L.S.L., D.F.M.G., L.P.P., L.G.P., C.A.K.E.
and J.P.Q. analysed the results and wrote the paper. All author reviewed the manuscript.
Competing interests
The authors declare no competing interests.
Additional information
Supplementary Information The online version contains supplementary material available at https://doi.org/
10.1038/s41598-021-89192-6.
Correspondence and requests for materials should be addressed to L.S.L.
Reprints and permissions information is available at www.nature.com/reprints.
Publisher’s note Springer Nature remains neutral with regard to jurisdictional claims in published maps and
institutional affiliations.
Open Access This article is licensed under a Creative Commons Attribution 4.0 International
License, which permits use, sharing, adaptation, distribution and reproduction in any medium or
format, as long as you give appropriate credit to the original author(s) and the source, provide a link to the
Creative Commons licence, and indicate if changes were made. The images or other third party material in this
article are included in the article’s Creative Commons licence, unless indicated otherwise in a credit line to the
material. If material is not included in the article’s Creative Commons licence and your intended use is not
permitted by statutory regulation or exceeds the permitted use, you will need to obtain permission directly from
the copyright holder. To view a copy of this licence, visit http://creativecommons.org/licenses/by/4.0/.
© The Author(s) 2021
Scientific Reports | (2021) 11:10339 | https://doi.org/10.1038/s41598-021-89192-6 12
Vol:.(1234567890)You can also read