Weather and Climate Extremes - DigitalCommons@USU
←
→
Page content transcription
If your browser does not render page correctly, please read the page content below
Weather and Climate Extremes 34 (2021) 100368
Contents lists available at ScienceDirect
Weather and Climate Extremes
journal homepage: www.elsevier.com/locate/wace
Simulating the storm environment responsible for Nepal’s first
observed tornado
Jonathan David Douglas Meyer a, b, *, Binod Pokharel a, b, c, Robert R. Gillies a, b
a
Department of Plants, Soils, and Climate, Utah State University, Logan, UT, USA
b
Utah Climate Center, Utah State University, Logan, UT, USA
c
Central Department of Hydrology and Meteorology, Tribhuvan University, Kathmandu, Nepal
A R T I C L E I N F O A B S T R A C T
Keywords: A high-resolution numerical forecast model was used to simulate the meteorological conditions leading up to the
Tornado March 31st, 2019 severe weather event that produced Nepal’s first-ever observed tornado. The sparse meteo
Nepal rologic observations in the region capturing the storm environment limit the ability to anticipate another similar
WRF Model
situation should the particular set of conditions present themselves again. This study presents a multifaced view
of the storm environment through 1) a synoptic perspective provided by the Global Data Assimilation System
(GDAS) reanalysis dataset and 2) a trio of progressively higher resolution one-way nested simulations (12
km–4km–1km) driven by GDAS boundary conditions to more closely examine the storm-scale environment.
GDAS data and numerical simulations revealed moderately strong instability throughout the region with CAPE
values between 1000 and 2000 J kg− 1 K− 1 and lifted index values between − 4 and − 7. Vertical wind profiles
featuring little directional shear and moderate velocity shear yielded shear-based convective indices that sug
gested slight potential for rotating supercell thunderstorms. Within this environment, the 1-km simulation
produced strong, rotating convection in nearly the same location and at nearly the same time as the observed
tornadic storm. Lastly, an assessment of the limited number of observed historical tornadic events in the region
showed that with amply convective available potential energy, the 2019 Nepal tornado environment stood out
for the limited vertical directional wind shear present.
1. Introduction and background tornadoes across Bengal, 18 of which killed 10 people or more, while
Goldar et al. (2001) documented 36 possible spring tornadoes between
On March 31st, 2019, an extreme and unprecedented convective 1890 and 2000 over West Bengal, 14 of which killed 10 people or more.
scenario unfolded in the Bara and Parsa districts of south-central Nepal Rosoff and Hindman (2002) studied the deadly severe weather outbreak,
where thunderstorms brought strong winds and hail to the mostly rural which brought deadly tornadoes to the region and severe non-tornadic
landscape. While severe weather in this region is not itself unprece storms throughout Nepal including a well-documented Mt. Everest
dented (Nepal specifically experiences elevated rates of thunderstorms storm that took the lives of eight climbers. Unfortunately, Nepal (and the
and windstorms during the pre-monsoon months of March–May; Aryal, surrounding region in general) has a limited observational network;
2018; Mäkelä et al., 2014), the March 31st event was headlined by the Nepal specifically lacks weather RADAR coverage and has only a single
country’s first-ever recorded tornado; resulting in 30 fatalities, 1150 upper-air sounding. To better study the underlying storm environment,
injuries, and 2890 families becoming homeless (Report on Bara Parsa more recent tornadic events in the region over the last few decades have
Tornado, 2019; hereafter referred to as BPT Report). Fig. 1a shows some been studied through high-resolution numerical modeling (Litta et al.,
of the damage a rural community sustained from the storm. 2010; Litta et al., 2012; Das et al., 2015). Bikos et al. (2016) conducted
Although this is the country’s first-observed tornado, the lower high-resolution numerical simulations of ten high-impact tornadic
elevation Indian-Bangladesh region to the southeast of Nepal has events in Bangladesh and found that similar to U.S. tornadic storms,
experienced infrequent tornadic storms. Historical accounts starting Bangladesh storms were characterized by relatively high instability and
1835 studied by Peterson and Mehta (1981) documented 51 possible sufficient deep-layer vertical wind shear.
* Corresponding author. Department of Plants, Soils, and Climate, Utah State University, Logan, UT, USA.
E-mail address: jon.meyer@usu.edu (J.D.D. Meyer).
https://doi.org/10.1016/j.wace.2021.100368
Received 27 January 2021; Received in revised form 13 May 2021; Accepted 5 August 2021
Available online 12 August 2021
2212-0947/Published by Elsevier B.V. This is an open access article under the CC BY license (http://creativecommons.org/licenses/by/4.0/).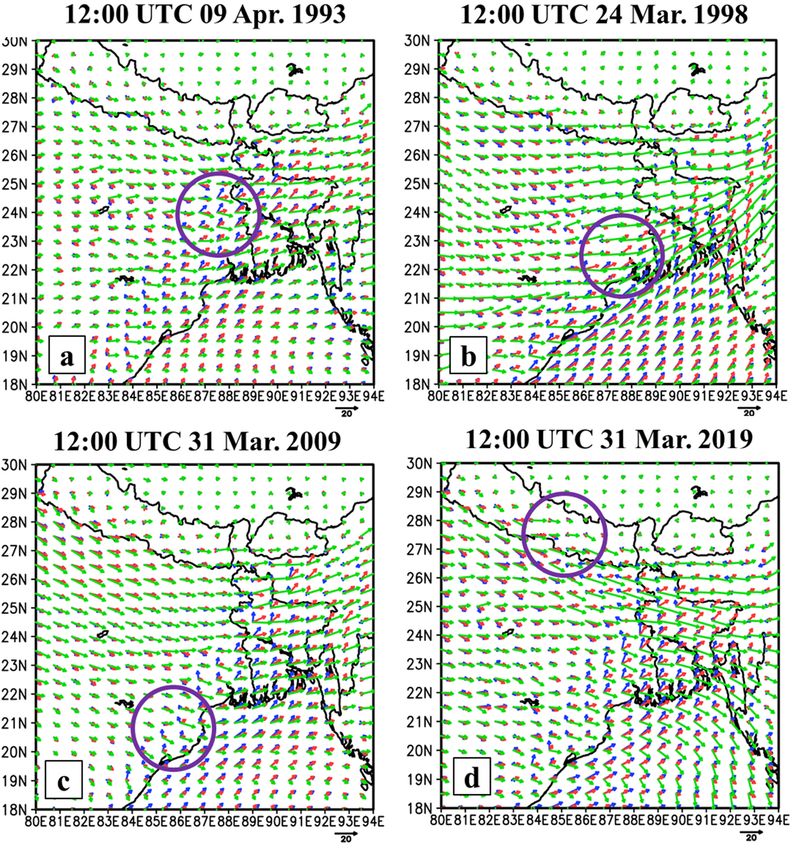
J.D.D. Meyer et al. Weather and Climate Extremes 34 (2021) 100368
meteorological information was available to investigate the background
storm environment or the storms themselves. In fact, it was not until the
April 5th damage survey and concurrent personal witness interviews
outlined in the BPT report before the question of whether the event’s
damaging winds were tornadic or straight-line in nature was conclu
sively addressed.
Initial satellite imagery and ground-based surveys revealed a 90-km-
long damage path (Mallapaty, 2019) with a width that ranged from 200
m to 750 m (BPT report, 2019). Fig. 1b shows a visible satellite image of
the storm damage path. The collection of witness reports and CCTV
timestamps suggested an average propagation speed of the tornado of
approximately 34 km/h (BPT report, 2019). Structural damage in
dicators based on the Enhanced Fujita Scale (WSEC, 2004) estimated
wind speeds between 180 km/h (112 mph) and 265 km/h (165 mph),
which is equivalent to an EF2-EF3 tornado.
With ample ground-based evidence outlined in the BPT report, little
doubt is left that the March 31st event was indeed the first recorded
tornado in Nepal’s history. Understandably, the Nepalese government
dedicated a section of the BPT report to outlining planned improvements
to forecaster training and situational awareness to better anticipate such
conditions should they develop again. However, the lack of knowledge
on the pre-storm environment or the storm morphology drives a need to
ascertain more information on atmospheric conditions; specifically, the
thermodynamic and vertical wind shear profiles and any mesoscale in
teractions with the region’s complex terrain. Adding to this body of
regional modeling examination of severe storm environments, this study
uses a high-resolution numerical model to simulate Nepal’s storm
environment to better understand the conditions present.
Fig. 1. (a) damage photo from a rural village in Nepal taken from Khatri (2019)
Through an evaluation of coarse global reanalysis data, this study
and (b) reproduction of the visible satellite image and damage path from
compliments the large-scale atmospheric conditions outlined in the BPT
Fig. 1.2 of the Bara-Parsa Tornado Report.
report. The bigger question pertaining to the previously unresolved
small-scale conditions leading up to the storm, and whether these in
In the wake of the March 2019 storm, the region’s limited observa
gredients were supportive of supercell thunderstorms were addressed
tion and instrumentation infrastructure initially clouded the ability of
with a high-resolution, convective resolving numerical model. The
meteorologists to comprehensively evaluate the event. At the time of the
purpose of this study and the numerical simulation is to document with
event, Nepal had no Doppler radar coverage; however, the country has
finer detail the storm environment and resulting convective storm
since installed a lone weather radar site in Western Nepal. In addition to
morphology. Through this level of scrutiny, it is also our hope to sup
a sparse network of surface observing stations, the country’s sole
plement the BPT report’s goals of guiding forecaster training and
rawinsonde vertical profiling site located in the central Nepal capital
operational situational awareness.
city of Kathmandu did capture a 00 UTC morning sounding, but the
A discussion of the data used to assess the meteorological conditions
afternoon 12 UTC sounding was not measured. Outside of satellite
as well as those used to drive the numerical model are provided in
remote sensing and the limited ground-based observations, very little
Fig. 2. WRF one-way nested model domains with the model-resolved topography included. Domain grid spacing is 12-km, 4-km, and 1-km, respectively.
2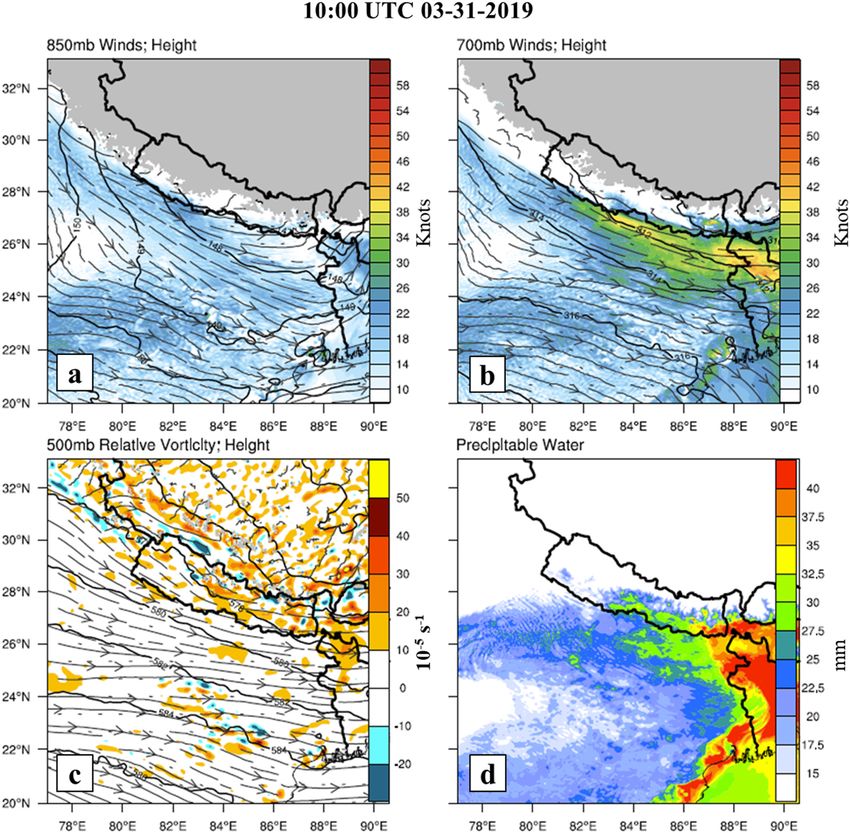
J.D.D. Meyer et al. Weather and Climate Extremes 34 (2021) 100368
Fig. 3. 12:00 UTC 31st March (a) 200-hPa winds (knots; color fill) and geopotential height (m; contours); (b) 500-hPa vorticity (10− 5 s− 1; color fill) and geopotential
height (m; contours); 700-hPa temperature (◦ F; dashed red lines), geopotential height (m; contours) and wind speed (knots; color fill); (d) MSLP (hPa; contour), Pwat
(mm; color fill). (For interpretation of the references to color in this figure legend, the reader is referred to the Web version of this article.)
Section 2 while the model configuration is provided in Section 3. An first-order observations in Nepal, a great deal of dynamical interpolation
overview of the synoptic pre-storm environment including the thermo goes into describing the region’s conditions.
dynamic conditions is discussed in Section 4. Analysis of the simulated
storm environment is provided in Section 5 with an examination of the 2.2. Upper air soundings
storm morphology presented in Section 6. A comparison of the 2019
Nepal conditions with past tornadic events in the surrounding region is Upper-air balloon (rawinsonde) soundings provide valuable insight
presented in Section 7 before the final discussion and concluding re into the storm-defining thermodynamic and vertical wind shear envi
marks provided in Section 8. ronment. Unfortunately, throughout all of Nepal, only a single rawin
sonde profile at the capital city of Kathmandu is measured. In fact, the
2. Data region in general suffers from a limited network of rawinsonde mea
surements with the closest soundings launched in the northern Indian
This section will provide a brief overview of the available meteoro cities of Gorahkpur and Patna (Fig. 2b). A further limitation to diag
logical observations pertinent to the discussions and analysis presented nosing the vertical structure of the atmosphere is that while the common
within this paper. For a more exhaustive overview of the available ob practice in upper-air networks dictates twice-daily measurements (~00
servations, we direct the reader to the BPT report. UTC and 12 UTC), the region’s trio of soundings are only measured once
per day at ~00 UTC. The timing of these balloon releases falls more than
2.1. Global data assimilating system 12 h before the severe weather event developed as well as before day
time heating modifies the boundary layer.
The Global Data Assimilation System (GDAS) is an observation
assimilation platform developed by the National Center for Environ 3. Model configuration
mental Prediction (NCEP) to blend surface observations, balloon data,
wind profiler data, aircraft reports, buoy observations, radar observa Given the lack of meteorologic observations and the extensive
tions, and satellite observations onto a 0.25◦ by 0.25◦ 3-dimensional extrapolation of Nepal’s conditions within global reanalysis products,
grid. For this study, GDAS data acted as the initial and lateral bound numerical modeling is necessary to describe in sufficient detail the
ary conditions for the numerical simulations and also provided context highly nuanced meteorological conditions over Nepal. This study em
for the meteorological conditions on that day. Because of the lack of ploys the Weather Research and Forecasting (WRF) model (Skamarock
3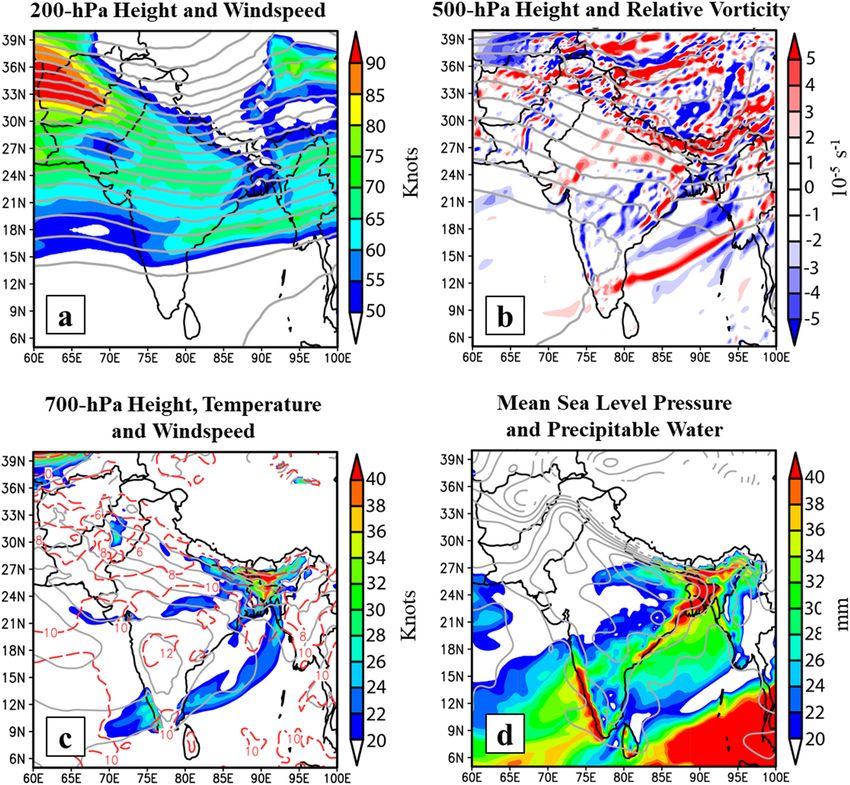
J.D.D. Meyer et al. Weather and Climate Extremes 34 (2021) 100368
1
Fig. 4. 12:00 UTC convective indices captured by GDAS data with (a) Convective Available Potential Energy (CAPE; J Kg− K− 1), (b) Convective Inhibition (CIN; J
Kg− 1 K− 1), and (c) Storm Relative Helicity (m2 s− 2).
et al., 2008) to dynamically downscale the GDAS forcing data. WRF’s 3.2. Model physics
ability to customize the domain and model physics is ideal to simulate
the unique nature of the convective environment and the region’s Model physics employed by this study are consistent across all three
complex terrain. To capture the full diurnal evolution of the storm domains with the exception of the Kain Fritsch cumulus parameteriza
environment, 24-h WRF simulations were initialized 18 UTC March tion (Kain, 2004), which is turned off in the convective permitting 4-km
30th, 2019 and completed 18 UTC, March 31st. and 1-km domains. With a focus that this study should help inform the
Nepalese forecasting community, many of the model physics options
3.1. Domain design here follow what is operationally run by the North American Mesoscale
(NAM) model, which shares the same underlying dynamics engine as
To properly downscale the GDAS data, this study used a trio of do WRF. WRF Microphysics employed the WSM 6-class graupel scheme
main’s nested within each other to gradually scale down to the necessary (Hong and Lim, 2006), Mellor–Yamada Nakanishi Niino (MYNN) Level
convective-resolving resolutions. Fig. 2 illustrates the placement of these 2.5 scheme (Nakanishi and Niino, 2009) for planetary boundary layer,
three domains, which employ one-way nesting to scale from 12-km, 4- RRTMG radiation schemes for both longwave and shortwave (Iacono
km, and 1-km grid spacing, respectively. Also indicated in Fig. 2b is the et al., 2008), the Unified Noah Land Surface Model (Tewari et al., 2004)
path of the observed tornado (red line) and three surrounding cities and the Eta Similarity Scheme (Janjic, 1994) for the surface layer
where upper-air rawinsondes are deployed. physics.
Given the weak synoptic forcing on this day and the complex terrain
in the immediate vicinity, one-way nesting was chosen based on findings 4. GDAS pre-storm environment
by Soriano et al.,( 2004) that showed one-way nesting can outperform
two-way nesting under these conditions. 52 vertical layers were used for The large-scale atmospheric conditions preceding the convective
all domains. The outermost domain is driven with the six-hourly GDAS event are first explored with the coarse-resolution GDAS data. This
data. Three-hourly output from domain 1 is used to drive the 4-km analysis serves to 1) document the large-scale background conditions
domain 2, where 30-min output is in-turn used to drive the innermost present for the convective event and 2) provide background context for
1-km domain. 15-minute output from the 1-km domain provides a useful the subsequent exploration of the simulated environment provided by
assessment of the evolution of the storm environment. the high-resolution WRF domains discussed in Section 5.
Fig. 3 shows the upper-air conditions for 12:00 UTC, March 31st (just
before the severe weather outbreak) An upper-level shortwave trough is
located immediately upstream of Nepal (Fig. 3a). While the strongest jet
4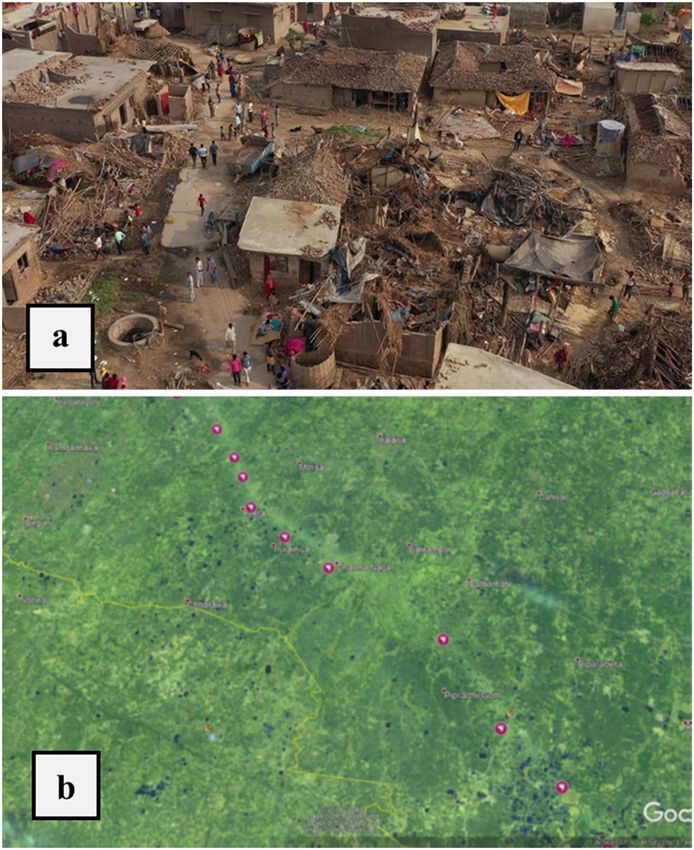
J.D.D. Meyer et al. Weather and Climate Extremes 34 (2021) 100368
Fig. 5. Model simulated surface and upper-air conditions from the intermediate 4 km domain of (a) 850-hPa winds (knots; color fill), streamlines and geopotential
height (meters; contours), (b) 700-hPa streamlines and geopotential height (meters; contours), (c) 500-hPa relative vorticity (10− 5 s− 1; color fill) and geopotential
height (meters; contour), and (d) precipitable water (mm; color fill). (For interpretation of the references to color in this figure legend, the reader is referred to the
Web version of this article.)
stream winds are associated with a super-geostrophic jet streak rotating Fig. 4a) describes the measure of tropospheric instability, with CAPE
over Iran and Afghanistan, weaker jet stream winds generally less than values of 2500 J kg− 1 considered strong
indicates the shortwave trough has shifted downstream of Nepal, instability. The Nepalese region exhibits moderate instability with CAPE
although cyclonic vorticity is still advecting over Nepal ahead of a values between 1000 J kg− 1 and 2000 J kg− 1. Convective Inhibition
smaller shortwave propagating through the upstream side of the main (CIN; Fig. 4b) describes the measure of thermodynamic resistance that
shortwave trough. The advection of this cyclonic vorticity serves as a an air parcel must overcome before the parcel can take advantage of the
potential convective trigger mechanism given the right underlying static profile’s CAPE. Over the region of interest, GDAS data shows a modest
stability. At 700-hPa (Fig. 3c), a prevailing northwesterly wind field is convective cap with CIN values between 20 J kg− 1 and 100 J kg− 1.
directed perpendicular to the terrain gradient, which contributes to the Assessing the wind shear over the lower 3 km of the atmosphere, Storm
presence of regional cyclonic curvature. Given the indicated tempera Relative Helicity (SRH; Davies-Jones et al. (1990)) provides a general
ture gradient, the orientation of the 700-hPa wind field and the presence assessment of the atmosphere’s potential for cyclonic updraft rotation in
of a low-level jet is likely associated with a thermal wind enhancement right-moving supercells. Generally, SRH values greater than 100 m− 2
to the synoptic circulation. The horizontal shear associated with the s− 2, like those found in the region of interest, are considered favorable
region’s terrain and thermal wind could play a role in the generation of for tornadic storms; we note, however, that there are no clear bound
helicity and reinforce rotating updrafts in a storm. At the surface aries of SRH between tornadic and non-tornadic storms.
(Fig. 3d), a low-pressure center is found to the southwest of Nepal and is Overall, favorable large-scale fluid dynamics and vertical thermo
driving a weak southeasterly circulation that in additional to insinuating dynamic ingredients were found leading up to the convective event. The
low-level directional wind shear, is also acting to draw a tongue of elevated humidity and temperature profile created a thermodynamically
elevated precipitable water (Pwat) into the Nepal lowlands. unstable situation with high CAPE and low CIN values while low-level
Fig. 4 shows a collection of convective indices for the 12:00 UTC, wind shear indicated helicity was co-located with the convective envi
March 31st GDAS data. Convective Available Potential Energy (CAPE; ronment. In addition to the buoyant atmosphere, the presence of mid-
5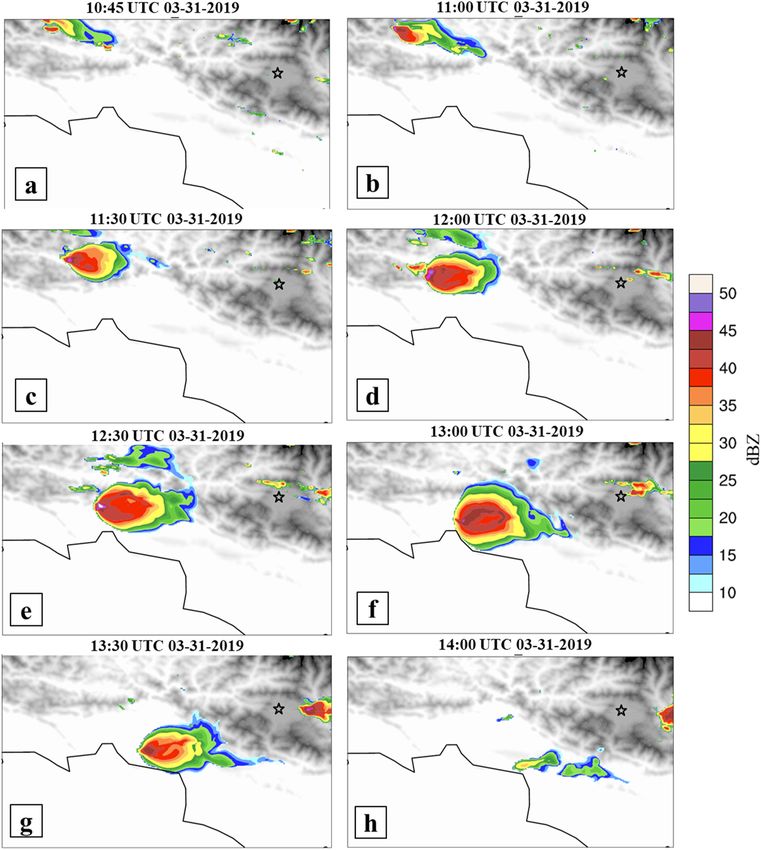
J.D.D. Meyer et al. Weather and Climate Extremes 34 (2021) 100368
shortwave, elevated Pwat values on the order of 20–30 mm are found
throughout the southern and central Nepalese lowlands; spatial and
magnitude values of this moisture plume agree with the GDAS data.
5.2. Pre-storm thermodynamic environment
To evaluate the WRF model’s ability to reproduce observed condi
tions, Fig. 6 provides a timeseries of the simulated conditions versus the
surface weather observations nearest to the observed storm. Observa
tions recorded at the Tribhuvan International Airport located in Kath
mandu, Nepal (black lines; geographic location indicated in Fig. 2b) are
compared with the nearest WRF model gridpoint from both the inter
mediate 4-km domain (red lines) and the innermost 1-km domain (blue
lines). We note that Kathmandu is nearly 100-km away from the path of
the observed tornado, so observed storm conditions at the Tribhuvan
International Airport are not expected to be associated with the super
cell thunderstorm that spawned the severe weather. With that,
comparing the observations of temperature and dewpoint temperature
in Fig. 6a validates the model’s ability to closely match the pre-storm
temperature environment while exhibiting a dry dewpoint tempera
ture bias of ~3–5 ◦ C. Coincident with the development of the observed
tornadic storm impacting to the south and west of Kathmandu, a rapid
drop in temperature and dewpoint temperature at around 12:30 UTC
indicates the passage of a storm’s surface cold pool. Observed increasing
wind speeds (knots) between 06:00 UTC and 12:00 UTC shown in Fig. 6b
were also well captured by the WRF model domains, however the model
does not reflect the peak gusts observed from 09:00 UTC to 13:00 UTC. A
more co-located comparison with the impacted Bara-Parsa region would
Fig. 6. Comparison of surface weather station observations from the Kath be preferable to test the skill of the WRF model, however, no such ob
mandu Airport (black) and the nearest WRF model gridpoint from domain 2
servations were available at the time of this study.
(red) and domain 3 (blue). Temperature (◦ C; solid line) and dewpoint tem
For the Patna and Gorakhpur, India and Kathmandu, Nepal locations
perature (◦ C; dashed line) are shown in (a) with wind speed (knots) shown in
(b). (For interpretation of the references to color in this figure legend, the
(Fig. 2b), Fig. 7 compares observed 00 UTC March 31st rawinsonde
reader is referred to the Web version of this article.) soundings (solid lines) of temperature (black), dewpoint temperature
(blue), and wind barbs with the 4 km domain’s simulated profiles
(dashed lines) from the nearest model gridpoint. Positive CAPE trajec
level cyclonic vorticity advection and an upstream upper-level short
tories were computed based on the most unstable air parcel and are
wave trough translating overhead also provided convective trigger
plotted in red (no red line indicates the profile has no CAPE). Addi
mechanisms in the Nepal region.
tionally, wind hodographs are presented in the upper right corner of
each Skew-T to compare the vertical profile of wind shear.
5. WRF model simulations
Outside of near-surface conditions, modeled atmospheric profiles
strongly agree with the observed rawinsonde profiles. 00 UTC is ~ 6am
This section presents an analysis of the mesoscale environment
LST, so each of the three locations exhibit a well-developed nocturnal
simulated by the WRF model when driven by the aforementioned large-
surface temperature inversion along with a fairly humid profile of
scale GDAS conditions. To address what mesoscale conditions were
dewpoints temperatures. Greatest discrepancies between the modeled
likely present for the event, the 4-km domain is evaluated as it provides a
and observed profiles are found right at the surface, where the modeled
sufficiently high-resolution representation of the regional Nepal storm
profiles exhibited cold and dry biases at each location. While the
environment. The higher resolution 1-km domain provides enough fi
modeled temperature profiles quickly converge towards the observed
delity to address questions surrounding basic storm type and
profile above the surface, low-level humidity remains slightly dry-biased
morphology that develops as a result of the convective environment.
through the low- and middle-levels for the higher elevation Kathmandu
While the observed storms occurred roughly 13–14 UTC (7–8pm LST),
location (corroborating the dry biases found in the surface station
the subsequent analysis assesses the pre-storm afternoon environment
comparison [Fig. 6]). The lower elevation Patna and Gorakhpur
by focusing on roughly the peak daytime heating conditions at 10 UTC
soundings exhibit a slightly elevated dewpoint profile above ~700-hPa.
(4pm LST) March 31st.
Despite a fairly similar overall profile of environmental temperature
and dewpoint temperature, the sensitivity of an air parcel’s adiabatic
5.1. Pre-storm mesoscale environment trajectory to surface conditions where the cold and dry modeled biases
(specifically the dry bias) results in modeled CAPE values that appears to
We begin by assessing the near-surface to mid-level atmosphere to be much less convectively favorable. Herein lies one significant disad
examine the state of the boundary layer winds and thermodynamic vantage of there being no 12 UTC sounding as we are unable to evaluate
properties immediately before convective triggering. Fig. 5 shows the model biases in buoyancy during daytime heating when the surface
presence of the low-level jet at 700-hPa (Fig. 5b) oriented parallel to the boundary layer has been turbulently mixed. However, given the con
Himalayan terrain with the northernmost edge of the jet overlying the sistency between observed and modeled profiles immediately above the
India-Nepal border. The core of this low-level jet exhibits speeds surface, we are confident that the modeled buoyancy leading up to the
approaching 40 knots along with slight cyclonic curvature. Just as was event would be more comparable to the actual atmosphere than the
shown in the GDAS data (Fig. 3) a mid-level shortwave disturbance is nocturnal CAPE values would indicate. A fourth Skew-T is shown in
present in the WRF simulations (Fig. 5c). As a result, modest positive Fig. 7d, which represents a 10 UTC pre-storm WRF simulated profile
vorticity advection is translating through central Nepal. Underneath the simulated near the observed storm track. Positive CAPE of nearly 2000 J
6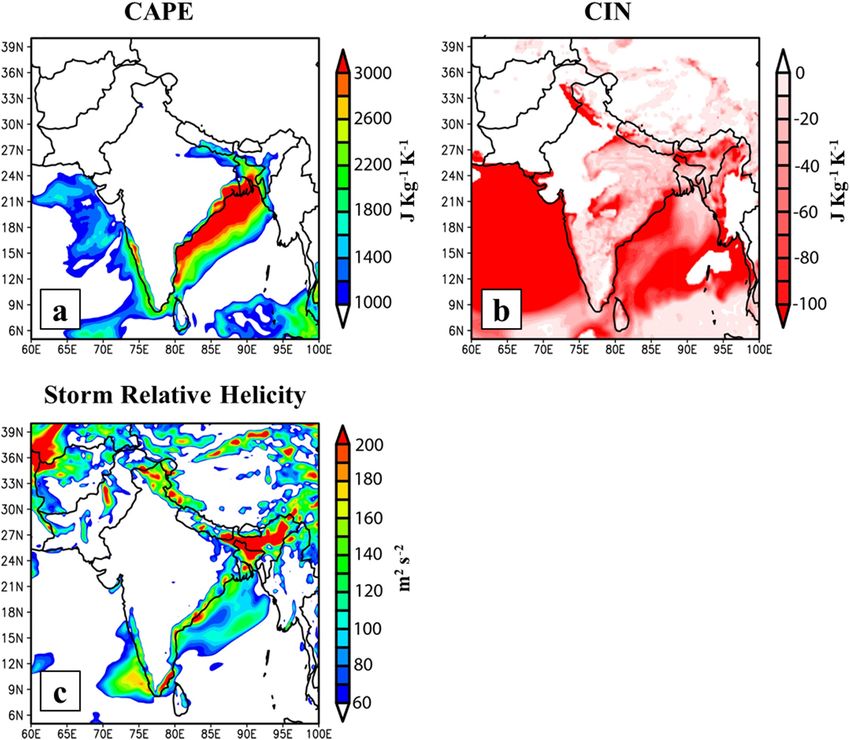
J.D.D. Meyer et al. Weather and Climate Extremes 34 (2021) 100368
Fig. 7. Comparison between 00:00 UTC March 31st rawinsonde observations (solid lines) of temperature (black) and dewpoint temperature (blue) and the nearest
simulated WRF gridpoint (dashed lines) for (a) Patna, India, (b) Gorakhpur, India, and (c) Kathmandu, Nepal balloon sites. A hodograph is included in the upper right
corner which illustrates the vertical profile of the observations (solid) and WRF (dashed) wind speed and directions. A fourth Skew-T (d) shows the WRF simulated
pre-storm environment (10:00 UTC) near the observed storm track. The positive CAPE trajectory is noted with the dashed red line. (For interpretation of the ref
erences to color in this figure legend, the reader is referred to the Web version of this article.)
1
kg− K− 1 was simulated and is shown with the red dashed line. 5.3. Simulated convective indices
Regarding the vertical wind profile, the state of directional and ve
locity shear is critical in the evaluation of the atmosphere’s proclivity Convective indices are commonly referenced in operational fore
towards tornadic thunderstorms. We note that each of the profiles are casting as they provide an expedited assessment of the potential
dominated by mostly northwesterly velocity shear with a small degree of convective storm types the environment of buoyancy and vertical wind
near-surface directional shear present in the observed profiles and lesser shear could support. Storm type thresholds are rough approximations
so in modeled profiles (increasingly so by the 10 UTC profile (Fig. 7d). based on empirical relationships with observed storms outcomes and it
Again, the greatest model discrepancies are found under the nocturnal is important to note that, as pointed out by Doswell and Schultz (2006),
surface inversion which experience significant modification during the use of many diagnostic convective indices in operational forecasting
daytime heating as evidenced by the nearly dry adiabatic lapse rate may or may not be suitable or representative of physical processes and as
within the simulated surface convectively mixed layer shown in Fig. 7d. such, may provide little value in predicting realized storm types (e.g.
Monteverdi et al., 2003). Given Nepal’s unique terrain and high surface
7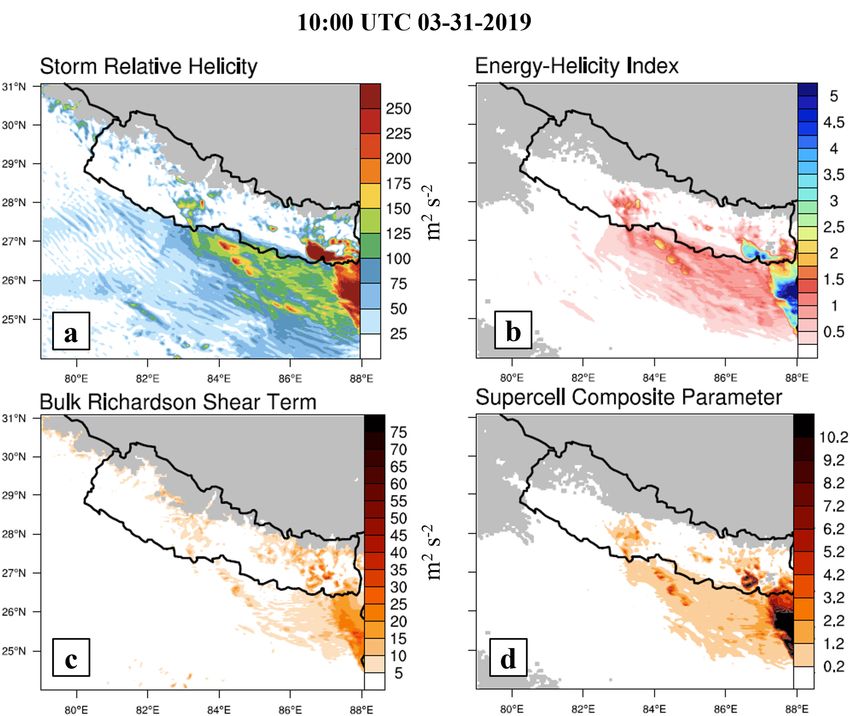
J.D.D. Meyer et al. Weather and Climate Extremes 34 (2021) 100368
1
Fig. 8. 10:00 UTC model-simulated convective indices of a) Convective Available Potential Energy (CAPE; J Kg− K− 1), b) Convective Inhibition (CIN; J Kg− 1
K− 1,
and c) Lifted Index.
elevation, this caveat is especially relevant when referencing convective (Fig. 5b). While the optimal shear characteristics are not found where
indices to diagnose potential storm types. However, for the purpose of the observed tornado occurred, SRH values in central Nepal were found
this study, the comparative baseline provided by convective indices af to peak around 150 m2 s− 2, which falls on the lower end of favorable
fords a sufficient approach to address the questions of 1) what degree of values for tornadic storms.
static stability was present, 2) what was the nature of the vertical EHI is designed to capture the observed relationship between high
directional and velocity wind shear profiles, and 3) was the collective CAPE and SRH values during tornadic storms. Again, while no specific
buoyancy and shear environment favorable or unfavorable of supercell boundary exists for delineating tornadic vs. non-tornadic storms, just
thunderstorms? like SRH values, central Nepal’s ~1–1.5 EHI values are interpreted to
Our assessment of these questions begins with Fig. 8, which com indicate the buoyancy and shear terms are weakly balanced and favor
pares the 10 UTC (4pm LST) buoyancy-based indices of CAPE, CIN, and able for weak tornadic storms. Much like EHI, the Bulk Richardson
Lifted Index (LI; Galway, 1956). LI values describes the degree of number (BRN) is a dimensionless ratio assessing buoyancy and shear.
mid-level instability by comparing the environmental temperature at The denominator of the BRN equation shown in Fig. 9c represents the
500-hPa with the temperature an air parcel (in our case a mixed layer speed shear between the surface wind and the 0–6 km layer mean wind.
averaged over the lowest 1-km) adiabatically lifted to 500-hPa would Because the point of this parameter is to diagnose the differential ver
have. Lifted indices of − 1 to − 4 are generally indicative of marginal tical torquing forces applied to a storm’s updraft by wind shear, the wind
instability, − 5 to − 7 for large instability and < − 8 considered extreme profile over such a deep layer is typically first weighted based on a
instability. Moderate instability is shown over central Nepal with CAPE column-normalized air density profile before the mean layer wind speed
values of ~1000–2000 J kg− 1 K− 1 and LI values ranging between − 3 and is calculated; doing so better captures the differential profile of mo
− 6. While CIN values earlier in the day suggests a capping inversion was mentum an updraft is subjected to. BRS values above 35–40 m2 s− 2 have
present (not shown), by the later afternoon 10 UTC hour, little to no CIN been associated with tornadic storms (Stensrud et al., 1997) and central
is present meaning there would be little convective resistance should a Nepal exhibits values approaching the lower range of supercell favor
convective trigger occur. ability. We note that if density weighting is not applied to the wind
To assess the degree of wind shear, Fig. 9 presents simulated SRH, the profile, a much greater amount of BRS well into the range of expected
Energy-Helicity index (EHI; Davies, 1993), the Bulk Richardson Number supercells was present in central Nepal.
shear term (BRS; Weisman and Klemp, 1982; Droegemeier et al., 1993), Finally, the SCP parameter (Fig. 9d) distills multiple convective
and the Supercell Convective Parameter (SCP; Thompson et al., 2003). indices to attempt to quantify the co-location of both tornadically-
With the exception of a local pocket in central Nepal, pre-storm shear favorable CAPE, SRH, and BRS regions. Each parameter is normalized
parameters are not meaningfully large regarding supercell favorability. to supercell “threshold” values. Empirical studies show that SCP values
However, a region of more favorably large shear parameters is found just above ~2 are sufficient for weak tornadic storms. In the Nepal region,
south of Nepal; collocated with the presence of the low-level jet core small pre-storm SCP values were simulated. SCP values tend to be on the
8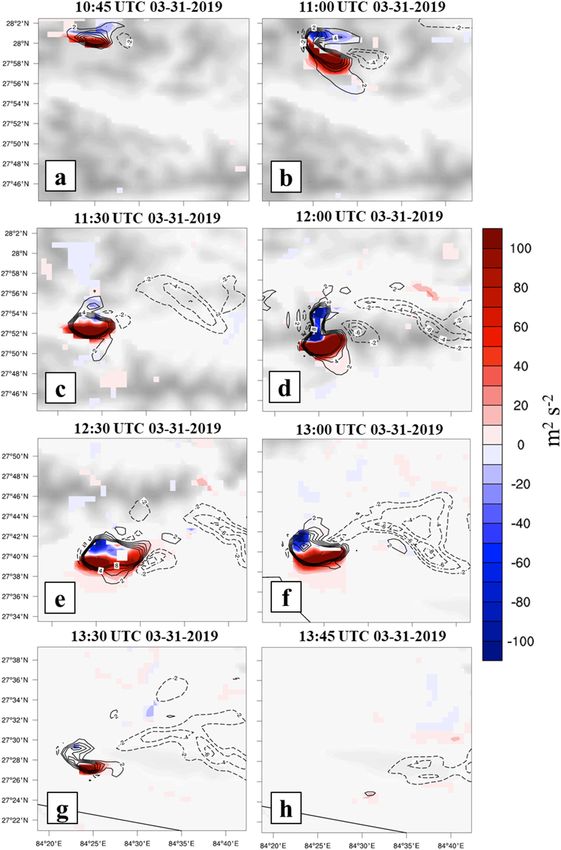
J.D.D. Meyer et al. Weather and Climate Extremes 34 (2021) 100368
Fig. 9. Same as Fig. 8, but for shear-based convective indices of a) Storm Relative Helicity (SRH; m2 s− 2), b) Energy Helicity Index (EHI), c) Bulk Richardson Number
shear term (m2 s− 2) and d) Supercell Composite Parameter (SCP).
low side of supercell favorability at best, likely a result of the limited previous convection and the departure from the mean layer wind vector,
shear. We note that convective activity associated with the severe the south-southeasterly storm motions of Fig. 10’s storm are more
weather outbreak does exist with much higher SCP and shear values as characteristic of a right-moving supercell (Bunkers et al., 2000). The
the near-storm wind field contains much greater low-level shear (not storm maintained peak intensity for roughly an hour between 12 UTC
shown). and 13 UTC with maximum reflectivity values greater than 50 dBZ
Collectively, the buoyancy-based convective indices (CAPE, CIN, LI) associated with the storm’s updraft. The storm sustained intense
portray a pre-storm environment supportive of strong convection while reflectivity values before dissipating between 13:45 UTC and 14:00
the wind profile and the shear-based SRH index portrays an environment UTC. Compared to the observed storm track and timing, the simulated
dominated by moderate velocity shear compared to limited near-surface storm’s lifecycle is remarkably similar. Observations in the BPT Report
directional shear. Despite the limited directional shear, composite suggest the tornado occurred during the late stage of the storm’s life
indices such as EHI and SCP the co-location of instability and wind shear cycle, so while the peak intensity of the simulated storm occurred
together weakly favors rotating thunderstorms. approximately an hour before the observed event, the simulated storm
was still substantial during the tornadic 13:00–14:00 UTC window.
6. Simulated storm analysis While the storm track’s most intense duration was located roughly 50
miles upstream of the observed event, the storm motions are comparable
Given the unstable nature of the atmosphere, scattered, multicellular between the observed and the simulated storm as well as the damage
convection was present over the Himalayan foothills throughout the path.
daytime (not shown). Storm motions throughout the day follow the To address the question of whether the simulated convection
mean-layer wind vector oriented roughly east-southeasterly. The scat exhibited rotation and was capable of producing a tornado, Fig. 11
tered convection dissipated during the midafternoon hours; replaced by shows the 1-km innermost domain’s simulated 500-hPa vertical velocity
an isolated, more intense thunderstorm that triggered over the lip of the (solid and dashed contour lines; m s− 1) and updraft helicity (color filled
Himalayan terrain. Simulated maximum “composite” radar reflectivity contours; m2 s− 2). Updraft helicity describes the measure of rotation in
(dBZ) provided in Fig. 10 shows the evolution and movement of the storm updrafts by integrating the product of the updraft velocity and the
strong, isolated thunderstorm through the innermost (1 km) WRF vertical component of vorticity over the 2-km to 5-km layer; with values
domain. Compared with the earlier multicell convection, Fig. 10’s storm typically ranging between 25 and 250 m2 s− 2 for tornadic storms (Kain
motions exhibit a more south-easterly storm motion as the storm prop et al., 2008). Storm updrafts and downdrafts are delineated with solid
agated down over the central Nepal lowlands. The deviation from and dashed contours lines, respectively. From the storm’s early stages,
9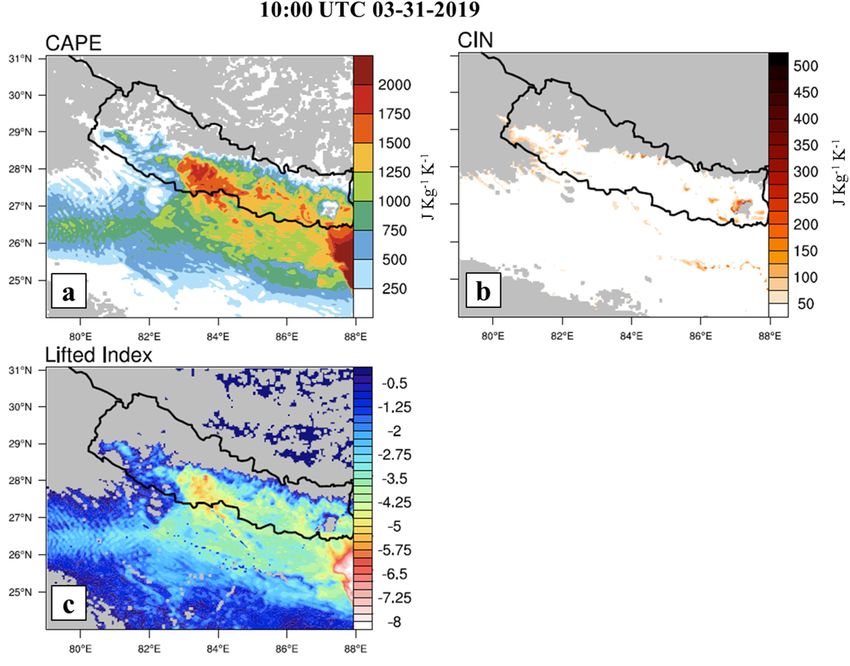
J.D.D. Meyer et al. Weather and Climate Extremes 34 (2021) 100368
Fig. 10. Model simulated max composite reflectivity (dBZ) from the innermost 1-km WRF domain. Terrain is provided with gray shading, while Kathmandu, Nepal is
indicated with the star marker for reference.
mesocyclone rotation in the isolated updraft is apparent while a forward environment with the region’s most recent tornadic storms over the past
flank downdraft forms and matures between 11:00 and 11:30 UTC. A thirty years (Litta et al., 2010; Litta et al., 2012; Das et al., 2015). Fig. 12
strong inflow notch for the updraft is also present during the early presents wind vectors from ERA-5 reanalysis (Hersbach et al., 2020) for
stages. Hints of a minor 500-mb rear-flank downdraft (RFD) are shown three previous documented tornadic storms in the region for April 09,
between 12:00 UTC and 13:00 UTC with a more apparent RFD captured 1993 (a), March 24, 1998 (b), March 31, 2009 (c) and the March 31,
in 700-mb vertical motions on the order of 2 m s− 1 (not shown) by 13:00 2019 Nepal case (d). The 925-hPa (blue), 700-hPa (red) and 500-hPa
UTC. Between 11:30 UTC and 12:30 UTC the storm structure begins to (green) wind vectors approximate the nature of each event’s low and
evolve and exhibit the morphology of a mature supercell thunderstorm mid-level wind shear profiles. In addition to the more inland
(Klemp et al., 1981; Moller et al., 1994; Davies-Jones et al., 2001). By geographical position and higher elevation, what sets the 2019 case
1300 UTC, the storm’s updraft and downdraft structure is that of a apart from these past events is the lack of low-level directional wind
prototypical supercell thunderstorm with a “v-notch” structure to the shear. While we have shown the 2019 event occurred under a more
forward flank downdraft and a hook-echo appearance to vertical ve uni-directional wind profile (Fig. 7), Fig. 12 highlights the more sig
locity analogous to that commonly found in supercell radar signatures. nificant near-surface directional wind shear in each of the past events. In
Between 13:30 UTC and 13:45 UTC, the simulated storm’s helicity each past event, southerly to southwesterly low-level winds existed
began to dissipate with the updraft entirely dissipated by 13:45 UTC. underneath westerly mid-level winds. The veering wind profile is more
typical for an environment supportive of supercell thunderstorms
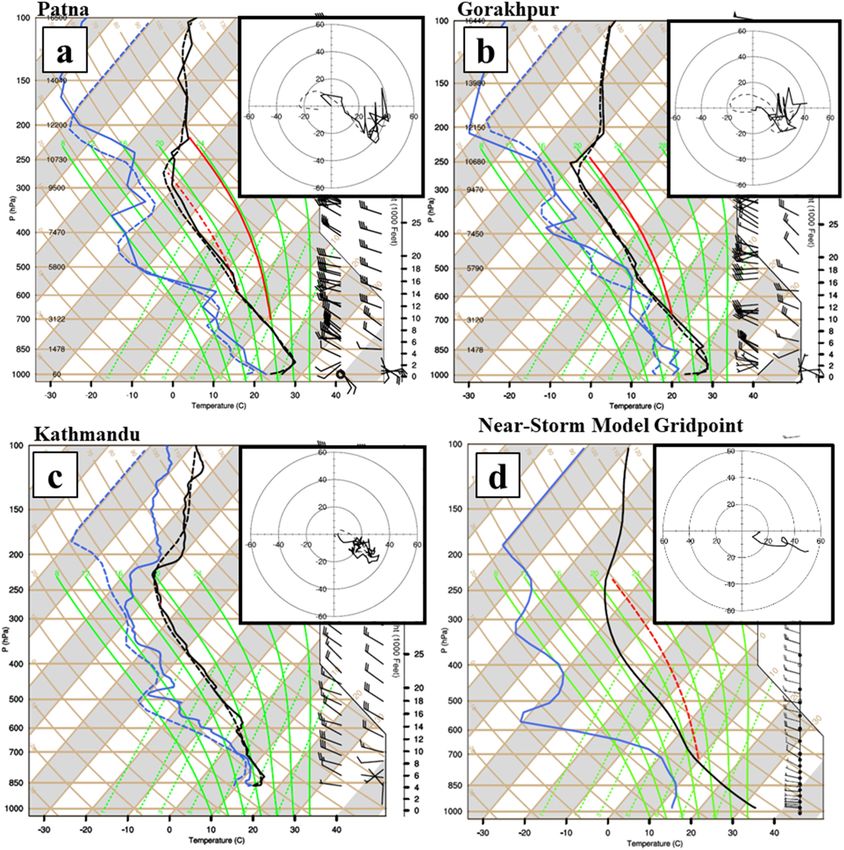
7. Historical comparison with past tornadic events making the lack of such a profile in the 2019 Nepal event more unique.
We also note that each of the three previous cases are located coin
This section serves to briefly compare the 2019 tornadic storm cidental with an onshore flow of a humid maritime air mass. While the
10J.D.D. Meyer et al. Weather and Climate Extremes 34 (2021) 100368
Fig. 11. 1-km innermost model domain simulated updraft helicity (color fill; m2 s− 2), vertical velocity (contour lines; m s− 1) and topography (gray shading). Storm
updrafts and downdrafts are shown with solid and dashed contour lines, respectively. (For interpretation of the references to color in this figure legend, the reader is
referred to the Web version of this article.)
2019 Nepal event’s environment did have a strong low-level jet but also in contrast of general tornadic storm environments where low-
advancing into Bangladesh similar to the past events, the environment level shear is considered as one of the most important ingredients for an
over south-central Nepal was far removed from this feature and would environment to produce rotating supercell thunderstorms.
not be impacted by the source of high low-level humidity and directional
wind shear. 8. Discussion and conclusion
While any tornadic event will feature a background environment
with elevated thermodynamic instability (i.e., high CAPE), the com To understand the undocumented small-scale conditions leading up
parison presented here shows just how unique 2019 Nepal event’s wind to Nepal’s first-observed tornadic event, this study employed a high-
profile was in contrast with the region’s historical tornadic outbreaks resolution, convective-resolving numerical model to ask the question
11J.D.D. Meyer et al. Weather and Climate Extremes 34 (2021) 100368
Fig. 12. Comparison of ERA-5 wind vectors at 925-hPa (blue), 700-hPa (red) and 500-hPa (green) for three historical cases and the 2019 Nepal tornado event. Purple
circles represent the approximate region where the tornadic activity was observed. (For interpretation of the references to color in this figure legend, the reader is
referred to the Web version of this article.)
of 1) what were the mesoscale meteorological conditions leading up to downdraft structure resembling a classic supercell thunderstorm sug
the severe weather and 2) were those conditions favorable for a tornadic gesting that the environment was indeed capable of producing supercell
supercell? The purpose of this study was not only to document the storm thunderstorms. Given convective indices indicated the potential for
environment at resolutions beyond coarse-resolution gridded reanalysis strong convection alongside shear-based metrics showing weak favor
datasets, but to question whether a supercell storm could be simulated ability for supercell thunderstorms suggests that such extreme severe
under these conditions. In that, we hope to serve future operational weather, while rare, have the potential to be anticipated in the future.
forecaster’s anticipation of such an extreme severe weather scenario. While additionally operational tools and training are being implemented
The synopsis of atmospheric conditions showed both a convectively by Nepal’s Department of Hydrology and Meteorology (DHM, BPT
favorable atmosphere and one that featured sufficient convective trigger report), the success of this study to simulate the severe weather event
mechanisms. Buoyancy- and shear-based convective indices presented highlights the benefit of a regional, high-resolution operational fore
evidence for weak to moderate supercell conditions although we reit casting model. We emphasize that operational modeling domains are
erate that convective indices and storm-type thresholds are empirical in typically far more computationally constrained than numerical case
nature, are not quantitative, and are not grounded in a specific physical studies such as what was presented here. While 1-km high-resolution
mechanism. As such, the use of convective indices and stated storm-type domains such as the one used for this study’s innermost domain are
thresholds documented in the literature to diagnose potential storm unrealistic for operational purposes, we have shown that the more
types in such a meteorologically-nuanced region like Nepal should be operationally feasible 4-km domain is capable of simulating the in
considered relative with malleable thresholds for expected storm types. gredients necessary to anticipate severe convective environments. Such
The accuracy of the storm timing and location with respect to ob resolution domains (or better) are already in operational use at conti
servations lend credibility that the simulated environment match that of nental scales (e.g. National Center for Environmental Prediction’s 3-km
the actual storm environment. Updraft helicity and vertical velocity of High-Resolution Rapid Refresh [Benjamin et al., 2016] and North
the simulated storm showed a strongly rotating updraft and an updraft/ American Mesoscale-3km domains [NAM technical report, 2017]).
12J.D.D. Meyer et al. Weather and Climate Extremes 34 (2021) 100368
In the wake of this study, future work cataloging the climatology of Droegemeier, K.K., Lazarus, S.M., Davies-Jones, R., 1993. The influence of helicity on
numerically simulated convective storms. Mon. Weather Rev. 121 (7), 2005–2029.
similar storm environments (whether tornado reports occurred or not)
Galway, J.G., 1956. The lifted index as a predictor of latent instability. Bull. Am.
would be useful to provide historical context for just how unique this Meteorol. Soc. 43, 528–529.
specific event was and to frame the scenarios leading to the type of storm Goldar, R.N., Banerjee, S.K., Debnath, G.C., 2001. Tornado in India and neighborhood
environments that have produced the rare tornadic events. We have and its predictability. Regional Met. Centre, Alipore, Kolkata. Issued by Office of the
Additional Director General of Meteorology (Research), Meteorological Office of
shown that the 2019 Nepal tornado occurred under less-than-typical India Meteorological Department, Pune, India.
directional wind shear when compared to the collection of recent Hersbach, H., Bell, B., Berrisford, P., Co-authors, 2020. The ERA5 global reanalysis. Q. J.
regional tornadic events. How rare such a convective and wind profile R. Meteorol. Soc. 146, 1999–2049. https://doi.org/10.1002/qj.3803.
Hong, S.-Y., Lim, J.-O.J., 2006. The WRF single–moment 6–class microphysics scheme
environment would be contextually useful when developing future (WSM6). J. Kor. Meteor. Soc. 42, 129–151.
forecasting training. Furthermore, numerical downscaling of a collec Iacono, M.J., Delamere, J.S., Mlawer, E.J., Shephard, M.W., Clough, S.A., Collins, W.D.,
tion of these historic events would provide additional context on how 2008. Radiative forcing by long–lived greenhouse gases: calculations with the AER
radiative transfer models. J. Geophys. Res. 113, D13103. https://doi.org/10.1029/
likely (or unlikely) these convective situations are to produce supercell 2008JD009944.
thunderstorms. While outside of the scope of this study’s purpose, the Janjic, Z.I., 1994. The step-mountain Eta coordinate model: Further developments of the
storm’s lifecycle which began over the Himalayan highlands before convection, viscous layer, and turbulence closure schemes. Monthly Weather Review
122, 927–945. https://doi.org/10.1175/1520-0493(1994)1222.0.CO;2.
present a unique situation for an even higher resolution numerical study Kain, J.S., 2004. The Kain–Fritsch Convective Parameterization: An Update. Journal of
to address the question of whether the local-scale terrain interactions Applied Meteorology 43 (1), 170–181. https://doi.org/10.1175/1520-0450(2004)
0432.0.CO;2.
influenced the storm dynamics in a way that enhanced the environ
Kain, J.S., Weiss, S.J., Bright, D.R., Baldwin, M.E., Levit, J.J., Carbin, G.W., Schwartz, C.
mental conditions and ultimately led to tornadogenesis. S., Weisman, M.L., Droegemeier, K.K., Weber, D.B., Thomas, K.W., 2008. Some
practical considerations regarding horizontal resolution in the first generation of
operational convection-allowing NWP. Weather Forecast. 23 (5), 931–952.
Author statement
Khatri, P.P., 2019. Had Tornado Hit Bara-Parsa, Southern Nepal? Meteorologists Are Not
Sure. https://nepal24hours.com/had-tornado-hit-bara-parsa-southern-nepal- meteo
Jonathan Meyer: Modeling, Methodology, Analysis, Writing- Orig rologists-are-not-sure/. (Accessed 26 January 2021).
inal draft preparation and revision process. Binod Pokharel: Methodol Klemp, J.B., Wilhelmson, R.B., Ray, P.S., 1981. Observed and numerically simulated
structure of a mature supercell thunderstorm. J. Atmos. Sci. 38 (8), 1558–1580.
ogy, Analysis, Observational Data Acquisition Writing- Reviewing and Litta, A.J., Mohanty, U.C., Bhan, S.C., 2010. Numerical simulation of a tornado over
Editing. Robert Gillies: Writing- Reviewing and Editing. Ludhiana (India) using WRF-NMM model. Meteorol. Appl. 17, 64–75.
Litta, A.J., Mohanty, U.C., Kiran Prasad, S., Mohapatra, M., Tyagi, A., Sahu, S.C., 2012.
Simulation of tornado over Orissa (India) on March 31, 2009, using WRF–NMM
Declaration of competing interest model. Nat. Hazards 61, 1219–1242. https://doi.org/10.1007/s11069-011-9979-1,
2012.
Mäkelä, A., Shrestha, R., Kark, R., 2014. Thunderstorm characteristics in Nepal during
The authors declare that they have no known competing financial
the pre- monsoon season 2012. Atmos. Res. 137, 91–99. https://doi.org/10.1016/j.
interests or personal relationships that could have appeared to influence atmosres.2013.09.012.
the work reported in this paper. Mallapaty, S., 2019. Nepali scientists record country’s first tornado. Nature. https://doi.
org/10.1038/d41586-019-01159-w online.
Moller, A.R., Doswell III, C.A., Foster, M.P., Woodall, G.R., 1994. The operational
Acknowledgements recognition of supercell thunderstorm environments and storm structures. Weather
Forecast. 9 (3), 327–347.
The authors wish to acknowledge the Utah Agricultural Experiment Monteverdi, J.P., Doswell III, C.A., Lipari, G.S., 2003. Shear parameter thresholds for
forecasting tornadic thunderstorms in north-ern and central California. Weather
Station support under grant number #9509. The authors also wish to Forecast. 18, 357–370.
acknowledge contributions made during the analysis and manuscript Nakanishi, M., Niino, H., 2009. Development of an improved turbulence closure model
preparation by Dr. Shih-Yu (Simon) Wang of Utah State University’s for the atmospheric boundary layer. J. Meteor. Soc. Jpn. 87, 895–912. https://doi.
org/10.2151/jmsj.87.895.
Dept. of Plants, Soils, and Climate. We acknowledge and appreciate the NAM. Technical report: National centers for environmental prediction environmental
observation datasets provided by Barun Paudel from the Department of modeling center. Accessed online April 2021. https://www.emc.ncep.noaa.gov
Hydrology and Meteorology in Nepal. We also thank the valuable con /mmb/mmbpll/misc/NAM_2017.pdf.
Peterson, P.E., Mehta, K.C., 1981. Climatology of tornadoes of India and Bangladesh.
tributions made by the anonymous reviewers and the journal editor. Arch. Met. Geoph. Biocl., Ser. B 29, 345–356. https://doi.org/10.1007/
BF02263310.
References Report on Bara Parsa Tornado, 2019. Government of Nepal Department of Hydrology
and Meteorology. Accessed online. http://www.smallearth.org.np/wp- content/uplo
ads/2019/04/Report-on-Bara-Parsa-Tornado.pdf.
Aryal, D., 2018. Pre-monsoon thunderstorm in Nepal. Int. J. Rural Dev. Environ. Health
Rosoff, Y.N., Hindman, E.E., 2002. Mt. Everest, 10 May 1996: study of a high elevation
Res. 2 (3), 39–45. https://doi.org/10.22161/ijreh.2.3.5.
thunderstorm. In: 10th Conf. on Mountain Meteorology, vols. 17–21. American
Benjamin, S.G., et al., 2016. A North American hourly assimilation and model forecast
Meteorological Society, Park City, USA, 6.
cycle: the Rapid Refresh. Mon. Weather Rev. 144, 1669–1694. https://doi.org/
Skamarock, W.C., Klemp, J.B., Dudhia, J., Gill, D.O., Barker, D., Duda, M.G., Huang, X.-
10.1175/MWR-D-15-0242.1.
Y., Wang, W., Powers, J.G., 2008. A Description of the Advanced Research WRF
Bikos, D., Finch, J., Case, J.L., 2016. The environment associated with significant
Version 3 (No. NCAR/TN-475+STR). University Corporation for Atmospheric
tornadoes in Bangladesh. Atmos. Res. 167, 183–195.
Research. https://doi.org/10.5065/D68S4MVH.
Bunkers, M.J., Klimowski, B.A., Zeitler, J.W., Thompson, R.L., Weisman, M.L., 2000.
Soriano, C, Jorba, O, Baldasano, J.M., 2004. One-Way Nesting Versus Two-Way Nesting:
Predicting supercell motion using a new hodograph technique. Weather Forecast. 15,
Does It Really Make a Difference? In: Borrego, C, Schayes, G (Eds.), Air Pollution
61–79.
Modeling and Its Application, XV. Springer, Boston, MA, pp. 177–185.
Das, M.K., Das, S., Chowdhury, M.A.M., Karmakar, S., 2015. Simulation of tornado over
Stensrud, D.J., Cortinas Jr., J.V., Brooks, H.E., 1997. Discriminating between tornadic
Brahmanbaria on 22 March 2013 using Doppler weather radar and WRF model.
and nontornadic thunderstorms using mesoscale model output. Weather Forecast. 12
Geomatics, Natural Hazards and Risk 7 (5), 1–23. https://doi.org/10.1080/
(3), 613–632.
19475705.2015.1115432.
Tewari, M., Chen, F., Wang, W., Dudhia, J., LeMone, M.A., Mitchell, K., Ek, M.,
Davies, J.M., 1993. Hourly helicity, instability, and EHI in forecasting supercell
Gayno, G., Wegiel, J., Cuenca, R.H., 2004. Implementation and verification of the
tornadoes. In: Preprints, 17th Conf. On Severe Local Storms. Amer. Meteor. Soc., St.
unified NOAH land surface model in the WRF model. In: 20th Conference on
Louis, MO, pp. 107–111.
Weather Analysis and Forecasting/16th Conference on Numerical Weather
Davies-Jones, R.P., Burgess, D.W., Foster, M., 1990. Test of helicity as a tornado forecast
Prediction, pp. 11–15.
parameter. In: Preprints, 16th Conf. On severe local storms, Kananaskis Park, AB,
Canada. Amer. Meteor. Soc., pp. 588–592
Davies-Jones, R., Trapp, R.J., Bluestein, H.B., 2001. Tornadoes and tornadic storms. In:
Doswell, C.A. (Ed.), Severe Convective Storms. Meteorological Monographs.
American Meteorological Society, Boston, MA. https://doi.org/10.1007/978-1-
935704-06-5_5.
Doswell III, C.A., Schultz, D.M., 2006. On the use of indices and parameters in forecasting
severe storms. Electron. J. Severe Storms Meteor. 1 (3), 1–22.
13J.D.D. Meyer et al. Weather and Climate Extremes 34 (2021) 100368
Thompson, R.L., Edwards, R., Hart, J.A., Elmore, K.L., Markowski, P., 2003. Close WSEC, 2004. A recommendation for an ENHANCED FUJITA SCALE (EF-Scale). Wind
proximity soundings within supercell environments obtained from the Rapid Update Science and Engineering Center. Texas Tech University (June) Available at: https://
Cycle. Weather Forecast. 18, 1243–1261. www.spc.noaa.gov/faq/tornado/ef-ttu.pdf. (Accessed 25 January 2021).
Weisman, M.L., Klemp, J.B., 1982. The dependence of numerically simulated convective
storms on vertical wind shear and buoyancy. Mon. Weather Rev. 110, 504–520.
14You can also read