Activity and stability of nanosized SAPO-34 in the reaction of methanol to olefins - PROYECTO FINAL MÁSTER QUÍMICA SOSTENIBLE Presentado por: ...
←
→
Page content transcription
If your browser does not render page correctly, please read the page content below

Activity and stability of nanosized
SAPO-34 in the reaction of methanol to
                olefins

 PROYECTO FINAL MÁSTER QUÍMICA SOSTENIBLE

            Presentado por: Zhibin Li

                  Dirigido por:
           Prof. Avelino Corma Canós
          Dr. Joaquín Martínez Triguero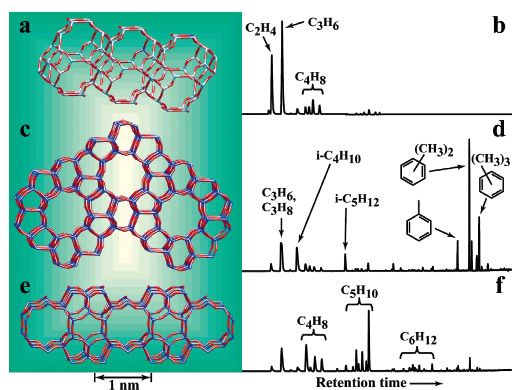
Acknowledgements

First I offer my sincerest gratitude to my supervisors, Professor Avelino Corma and Doctor Joaquin Martinez,
who have supported me throughout my thesis with their patience and knowledge. Without their help, I would
not finish the master study.

And I also want to thank Professor Jihong Yu from my home university Jilin University. Professors Yu and
Avelino offer me the opportunity to study in ITQ, and also for their support.

Thanks for the help from the people in ITQ, they give me a lot of help not only in my study and but also in the
daily life.

I thank China Scholarship Council (CSC) for supporting me throughout all my studies in Spain, which offer
me the grant to finish my Ph D.

Finally I want to thank my parents and my wife for their support and encourage.
Index
 1. Introduction ..................................................................................................................................1

      1.1 Zeolites...................................................................................................................................1

      1.2 Methanol to olefin (MTO) .....................................................................................................3

      1.3 Mechanism of MTO ...............................................................................................................4

      1.4 Objective of the study and precedents ...................................................................................9

 2   .Experimental ........................................................................................................................... 13
      2.1 Synthesis of materials ......................................................................................................... 13

      2.2 Characterization .................................................................................................................. 14

      2.3 Methanol to Olefin test ....................................................................................................... 15

 3 Results and discussion ............................................................................................................... 16

      3.1 XRD and Microscopy ......................................................................................................... 16

      3.2 N2 Adsorption ..................................................................................................................... 23

      3.4 FTIR and CO Adsorption .................................................................................................... 29

      3.5 Methanol to hydrocarbons activity...................................................................................... 33

      3.6 Stabilization of nanoSAPO-34 by hydrothermal treatment ................................................ 41

 4. Conclusions ............................................................................................................................... 45

 5. References ................................................................................................................................. 46
1. Introduction
1.1 Zeolites
Zeolites are a kind of porous material, which are widely used in industry, such as
oil cracking and fine chemistry because of the remarkable properties of activity and
selectivity.[1]
Zeolites have a unique system of channels and cavities, which make them
different with other materials[2]. Their structures are built with the tetrahedral units
TO4 (T= Si, Al), which are in a three-dimensional array, and the tetrahedral units are
connect with a common oxygen atom. From the IUPAC, a classification can be done
for three types because of the pore sizes: micropores: (2.0 nm≥dp), mesopores:
2.0nm< dp≤d 50 nm, macropores: dp > 50 nm.
But zeolites obtained from natural can’t be used directly, the reasons are as below:
(1) they always contain other impurity phases (2) chemistry composition changes (3)
not optimize the properties in catalysis application.[3]. Barrer and Milton got the first
synthesized zeolite in the lab in 1950s, and since then scientists have got more than
200 kinds of zeolite frameworks from synthesis[4].
Fig 1 Examples of micro-, meso-, and macroporous materials, showing pore size domains and typical
1pore size distributions[2].
One of the unique properties of zeolites is the selectivity in the chemistry
reactions and can be described as below[5]:
Reactant-Shape Selectivity
When there are more than two reactants in the reactions, only the one whose size
is smaller than zeolites pores can be allowed to entry the molecular channels, this
kind of selectivity is called reactant-shape selectivity, as show in Fig 2[5]
Product-Shape Selectivity
When the reactions start, there may be different thermodynamically feasible
products, but the potential products whose size is larger cannot diffuse from the
molecular pores, this kind of selectivity is called Product-Shape Selectivity, as show
in Figure 2
Transition-State Shape Selectivity
When the micropore channel used as a confined reactor, it can impose steric
geometry restriction on the transitions state, this kind of selectivity is called
Product-Shape Selectivity, as show in Figure 2 ,whose selectivity mostly depend not
on crystal size or activity but on zeolite structure and pore diameter. Some newly
studies show that electronic factor may play a important affection in shape-selective
products, and they proposed a new concept named restricted-electronic
transition-state selectivity [6, 7].
In 1962, faujasites (zeolites X and Y) were introduced to industry as the catalyst
for fluid catalytic cracking (FCC) of heavy petroleum distillate, and it showed more
activity and yield to compare with the catalyst used before in this process, this
remarkable result attended more and more attention to the zeolites synthesis and its
application in catalysis reactions[8]. Nowadays zeolites catalysts have been wildly
used in fields of fine chemistry, agriculture, ion-exchange, and oil cracking, some of
them are very important processes for our daily life.
2Fig 2 Three types of shape-selective catalytic reactions with representative examples: reactant-shape
selectivity in the alcohol dehydration reactions; product shape selectivity in toluene methylation
reactions; transition-state-shape selectivity in m-xylene disproportionation (transmethylation)
reactions
1.2 Methanol to olefin (MTO)
Methanol to olefin is an important processes in industry for obtaining ethylene
and propylene. It was discovered by the people from Mobil Central research when
they tried to find new ways to get more gasoline from methanol and isobutene in
1970s [9]. Since then, a lot of researchers in world took their attention on the MTO
studies. This process has not only economic but also scientific meaning to do more
studies [10, 11], and also methanol can be processed catalytically to gasoline
(methanol-to-gasoline, MTG), depending on operation conditions. Compared with
the current ethylene and propylene production process such as steaming cracking of
NGL and naphtha or other light fractions of petroleum, MTO offer a wider yield of
ethylene and propylene to supply market needs. And at the same time methanol can
be obtained from other sources of carbon-containing materials such as biomass and
3natural gas, which is not easy to transform to conversion to ethylene and propylene
directly [12, 13].
Fig. 3 Gasoline and distillate production via methanol and Mobil’s ZSM-5 technology
1.3 Mechanism of MTO
The mechanism of MTO has been studied by plenty of scientists. According to
the literature, the reaction can be divided to five stages[14]. First step is the
equilibration among methanol dimethyl ether and water. Second, it is often called
kinetic induction period on the fresh catalyst, which precedes high yield of
hydrocarbon formed from methanol and dimethyl ether. The third, which is most
important step, is the formation of initial hydrocarbon product. But about this part,
there are so many questions to be answered: what is the first carbon product and how
does it form? To answer this question, different scientist proposed more than 20
distinct mechanisms in these 40 years[11].
In figure 4 a and b, are the mechanism proposed by some researcher summary
from the literatures, some of them thought CH3+ or carbine: CH2 was formed when
methanol was activated on the catalyst, each of them is shown in Fig. 4 a and b. And
also some mechanisms which proposed methanol convert to a carbon-carbon bond
species directly were summarized. Few free radical mechanisms also can be seen in
the figure (shown in Fig 4 c).
4Fig 4 several of the classical “direct” mechanisms for the conversion of methanol/dimethyl ether to
olefins (or a direct precursor) shown in highly abbreviated or conflated form: (a) A pathway showing a
carbenium ion alkylating dimethyl ether to form a carbonium ion. (b) One of several proposed carbene
pathways. (c) An abbreviation of one of several free radical routes. SO2 is an unspecified surface
radical species. (d) An alkoxy chain growth process occurring on a framework site. (e) One of the
proposed mechanisms featuring CO, showing a role for transition-metal impurities. (f) An abbreviated
oxonium-ylide route.[14]
Bound methoxy (methoxonium) species[15, 16] can be formed when methanol
react with zeolite acid sites, but this kind of chain growth process for alkoxy(shown
in Fig 4 d) has never been obtained in the experiments. And also one of the proposed
mechanism thought the intermediate or cocatalyst in methanol conversion may be
CO (shown in Fig 4 e), because small amount of CO appeared in the MTO and MTG
reactors in the product gas. When CO was introduced to the reaction, there are no
13 12
changes in reaction rate. To compare when label CO was mixed with CH3OH,
there is no 13C was found in the hydrocarbon products. There is no explanation about
5the kinetic induction period in all of the above direct mechanisms. The reason may be
the difficulty to find this and some researchers thought maybe there is a relatively
inefficient direct mechanism functioned as “induction reaction “. And after the
induction reaction, there may be more efficient auto catalysis reactions by olefin
chain growth and cracking[17].
To more easily explain the primary product in the MTO reaction, the
hydrocarbon pool routes have been proposed. The feature of this mechanism is that
primary olefinic products and original hydrocarbon was got by a sequence of steps
from the methanol reacted with entrained hydrocarbon species. There are some
hydrocarbon pool ideas summarized in Figure 5[14]. In 1982 Mole and
co-workers[18] and Langner[19] proposed an insightful MTO mechanism which led
to a resolution of the MTO mechanism. (shown in figure 5 a and b )
Fig 5 Early proposals that have significantly shaped current thinking about the hydrocarbon pool
mechanism in MTO catalysis. (a) Mole’s 1983 mechanism of methylbenzene side-chain alkylation. (b)
An abbreviated account of Langner’s explanation for the dramatic effect of cyclohexanol and other
co-feeds of reducing the kinetic induction period. (c) Kolboe’s early phenomenological hydrocarbon
pool mechanism for MTO catalysis. (d) The paring reaction in highly abbreviated form.
6Kolboe proposed that olefins were formed from methanol reacting with a
hydrocarbon pool of intermediates [20-22]as shown in Figure 5 c and his model was
influenced by the earlier work.
Sullivan and co-workers [23] published a paper in 1961, in which he proposed
“paring reaction”, this also rich the thinking of the MTO reaction mechanism right
now.
And finally, in the last years it was shown that olefins are also part of the
hydrocarbon pool, in which methanol alkylation of adsorbed C3+ olefins, with
subsequent cracking are an important source of olefins as products in zeolite ZSM-5
and also in SAPO-34. Then, the combination of the aromatic and the olefin-based
hydrocarbon pool is called the “dual cycle mechanism”[24-26].
Fig 6. Dual cycle concept for the conversion of methanol on ZSM-5 (from ref [26]).
The fourth stage of methanol conversion catalysis is the conversion the primary
olefin product to other hydrocarbons by the secondary reaction[14].And this kind of
reaction is determined by zeolite acid strength ,crystallite size ,catalyst topology and
acid site density, space velocity and other process condition.
7Fig 7 Three of the methanol conversion catalysts discussed in this contribution and GC-MS total ion
chromatograms illustrating product selectivity on these materials: (a) The CHA topology of the
silico-aluminophosphate catalyst HSAPO-34. (b) The products of methanol conversion on HSAPO-34.
(c) The MFI structure of the aluminosilicate zeolite HZSM-5. (d) The products of methanol conversion
on HZSM-5. (e) The FER topology of H-Ferrierite. (f) The products of methanol conversion on MTO
catalysis on H-Ferrierite. Each experiment used 300 mg of catalyst operated at 723 K, and products
μ
were sampled 1.5 s following pulsed introduction of 10.2 L of methanol[14].
Figure 7 shows different structures for catalysts in MTO reaction and the
corresponding products obtained by GC at 723 K. Fig 7 a SAPO-34 with chabazite
(CHA) structure features pore sizes 0.38 X 0.38nm, through which only small
hydrocarbon can diffuse. For example benzene is too large to go out the cage, which
can explain in Fig 7 b the main product are ethylene and propylene, small amount of
butanes and very little of linear alkanes. Fig6c the aluminosilicate zeolite ZSM-5
with the MFI structure whose pore size 0.55 X 0.51nm , a little larger 10MR zeolite
compared with 8MR zeolite SAPO-34.And also from the Fig 7d we can see that the
main product of ZSM-5 are methylbenzenes and light alkanes especially isobutane
and isopentane and also olefins. Fig 7e the aluminosilicate zeolite Ferrierite with the
FER structure pore sizes 0.54 X 0.42nm, which has similar acid strength with ZSM-5
8and different structure. And from the Fig 7f we can see that the difference of
structures result in different product distributions, the main product of FER are
almost entirely olefins, especially butenes and pentenes.
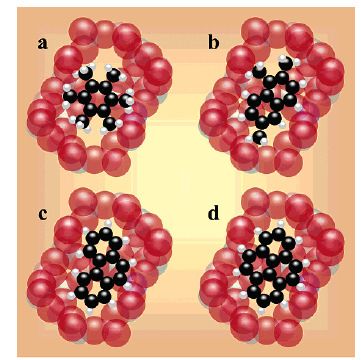
Fig.8 Molecular view of MTO catalyst deactivation shown for the specific case of HSAPO-34. (a)
Hexamethylbenzene and other methylbenzenes are present in a few percent of cages in an active MTO
catalyst. (b) With increasing time on stream, some of the methylbenzenes age into methylnaphthalenes.
(c) Further aging to pheananthrene causes a loss of MTO activity in HSAPO-34. (d) The largest ring
system to form in HSAPO-34 is pyrene[27, 28].
The fifth and final steps of MTO are catalyst deactivation. With time on stream,
methylnaphthalenes (Figure 8b) are formed from methylbenzenes (Figure 8a)[27].
And then phenanthrene pyrene and the largest aromatic ring system will be
accommodated in the catalyst’ nanocages[28], until the polycyclic aromatics
occupied the significant fraction of the cages which lead to mass transport of
reactants and products reduce in the end. The used catalyst can be regenerated by
calcined in air for few hours.
1.4 Objective of the study and precedents
Since the recent rise of oil prices and the need to reduce greenhouse emissions,
9the transformation of methanol and other biomass-derived alcohols to hydrocarbons
has became of renewed interest.
Alcohols can be converted to gasoline range hydrocarbons or short olefins
depending mainly on the nature of the catalyst used. Among the short olefins,
propylene has shown a growing demand in the past years mainly for the
polypropylene industry. Catalyst based on zeolites ZSM-5 and the
silicoaluminophosphate SAPO-34 are being industrially used for the conversion of
methanol.
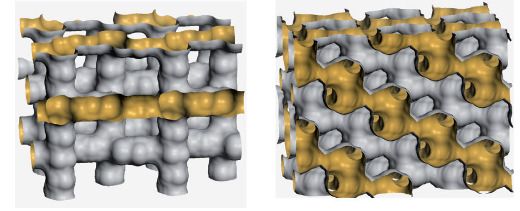
Fig. 9 Shape and connection of the internal surface to the two zeolites that are in industrial
use: H-ZSM-5 (left) and H-SAPO-34 (right). Both materials have a three-dimensional
channel structure, but the shape is very different. The surface in H-ZSM-5 is best described
as interconnected tubes, while H-SAPO-34 has larger cavities with narrow connections[29].
The main differences in the performance of the 10MR zeolite ZSM-5 and the
8MR SAPO-34 are selectivity and deactivation by coke. ZSM-5 can be synthesized
with low amount of framework aluminum in order to decrease the yield to aromatics
and increase propylene; in addition, the MFI structure presents a tridimensional
structure in which crossing channels do not create cages big enough to trap aromatic
compounds that otherwise would act as coke precursors deactivating the catalyst. As
a result, lifetime is reported to be higher than 500h. On the other hand, SAPO-34 of
CHA structure defined by 8MR channels with cages in which aromatics are trapped,
presents a faster deactivation increasing the number of regeneration cycles. However,
the selectivity to olefins is higher for SAPO-34 than for ZSM-5 and it can be tuned to
change the C2/C3 ratio[30].
10In the recent years other different materials have shown interesting properties as
catalyst for methanol to olefins but none have been used in a commercial scale.
SSZ-13, the analogue zeolitic CHA structure has been studied [31, 32] but
deactivates faster than SAPO-34. Other 8MR zeolites and SAPO’s studied have been
SAPO-17, ERI, LTA, UFI [33] and RUB-13[34]. All zeolitic structures showed
higher deactivation rate than CHA, due to the higher size of the cavities.
While selectivity can be tuned to propylene when using SAPO-34 by changes in
catalyst and process, extending lifetime as much as possible would greatly increase
the profitability of the process. A great effort has been done in the case of ZSM-5, in
which lifetime has been extended by increasing mesoporosity while preserving the
micropore, that is designing hierarchical structures. It has been done by several ways:
desilication, nanosheets of ZSM-5 or co-templating (carbon black and other
organics). Some methods have been shown more efficient than others because it has
been shown that when internal defects are developed, deactivation is enhanced. In
summary it was shown that when diffusion of reactants and products is facilitated,
coking is slowed and lifetime increased. A similar result was obtained when small or
nanosized particles of ZSM-5 have been synthesized in which intraparticle
mesoporosity is very high by itself [35].
When similar methods of developing mesoporosity have been translated to
SAPO-34 and other 8MR zeolites, the expected increase in lifetime was not always
attained. Sommer et al, could not improve lifetime of SSZ-13 by basic treatments.
However, the addition of co-templates like amines or surfactants did obtain an
increase in mesoporosity and lifetime for SSZ-13 (Wu SC-0.14 FEZA 2011) and
SAPO-34 [36]. And recently, different methods of synthesis have reduced the
particle size of SAPO-34 until nanometer scale, with a comparable improvement in
lifetime. Dry gel synthesis methods have been studied by a lot of scientists [37, 38].
Also the uses of combinations of different SDA for the synthesis of SAPO-34 have
been investigated with the objective to enhance lifetime. Lee et al [39] found that a
combination of TEAOH and morpholine reduced the size of the crystals and then,
lifetime increased. Wang [40] also studied the combination of TEA and TEAOH with
11an improvement in lifetime, and very recently Alvaro-Muñoz et al. [41] compared
different SDA and remarked the importance of high external surface, smaller crystal
size and high acidity for the lifetime of SAPO-34.
Once it is clear the benefit of a higher external surface in the lifetime of SAPO-34
for the MTO reaction, it can be easily achieved by synthesis of nanosize SAPO-34
samples in which the contribution of the external to the total surface is very important.
However, the stability of nanosized SAPO-34 could be a concern. Moreover, it is
known that the structure of silicoaluminophosphates is affected by hydration because
the Al-O-P bonds are easily hydrolizable [42], and in the case of sapo-34 its stability
depends on the template used. In fact SAPO-34 synthesized with morpholine as SDA
it is known to deteriorate irreversibly after long-term hydration [43, 44]. In order to
increase the long-term stability of SAPO-34 based catalysts researchers from
ExxonMobil found that the reversible treatment with NH3 increased the
hydrothermal stability of SAPO-34 [44] and other post-synthesis treatments are
claimed to protect or increase the stability by chemisorption with nitrogenated
compounds as ammonia, amines or others ([45], [46], [47] ). Besides, it was claimed
that the treatment of activated SAPO-34 with steam also increases the hydrothermal
stability [48].
In this work we have synthesized nanosized samples of SAPO-34 following the
method of Yu et al [49] and have studied the activity, lifetime and selectivity in the
reaction of methanol to olefins. In addition, we have studied the evolution of the
stability for storage of nano sized SAPO-34 at room atmosphere. We have compared
the catalytic performance and stability of nanoSAPO-34 with other sample of
SAPO-34 synthesized by conventional hydrothermal methods using a mixture of
morpholine and TEAOH as structure directing agents, which has been reported to
give also small crystal size [39]. Finally, we have studied the influence of the steam
treatment in the hydrothermal stability and lifetime of both samples.
122.
.Experimental
2.1 Synthesis of materials
Nano SAPO-34
SAPO-34 was synthesized by following the procedure reported by Lin et al [50].
by microwave heating in a program. The composition of the synthesis gel was 1.0
Al(OPri)3 : 2.0 H3PO4 : 2.0 TEAOH : 0.3 SiO2 : 30 H2O, Al(OPri)3.Normally,
isopropoxide Al(OPri)3 was firstly mixed with TEAOH solution (35 wt%, Aldrich)
and deionized water at room temperature until dissolved completely. Silica source
[tetraethylorthosilicate (TEOS)] was then added and stirred for 2 h. Finally,
phosphoric acid (85 wt% in water) was dispersed slowly into the above solution. The
reaction mixture was further stirred for 1 h and then transferred into a Teflon
autoclave. The crystallization was conducted in a microwave oven (Milestone
ETHOS-D) with pre-programmed heating profiles at 180℃ for 1 h. The product was
separated by high speed centrifugation, washed thoroughly with deionized water and
ethanol, and then dried overnight at 50 ℃ . The as-synthesized crystals were
calcinated at 550℃ in air for 6 h to remove the template molecules. This sample will
be called NanoSAPO-34.
Standard SAPO-34
For comparison purposes, other sample of SAPO-34 was synthesized following
hydrothermal conventional method, with a mixture of morpholine and TEAOH 1:1
mol/mol as SDA with a gel composition of 1 Al2O3 : 1.06P2O5 : 1.08 SiO2 : 2.09R :
66 H2O. First distilled water mix with phosphoric acid and then psedoboehmite
(Merck 85%) was added slowly with stirring into this solution and stir thoroughly for
7 hours, this called solution A. Fumed silica (Degussa Aerosil-200 99% SiO2) and
morpholine (Aldrich 99% C4H9O) mix thoroughly with water, this called solution B.
Add B drop wise to A with stirring and stir thoroughly for 7 hours, and then move to
150 mL Teflon-lined autoclave 200℃ for 24 hours
13Nano SAPO 1.0 Al(OPri)3 : 2.0 H3PO4 : 2.0TEAOH : 0.3 SiO2 : 30 H2O
Standard 1 Al2O3 : 1.06P2O5 : 1.08 SiO2 : 2.09R : 66H2O.
The ICP tests results were as below:
Nano Si/Al 0.54 Si 3.4 mmol/g
Standard Si/Al 0.3 Si 0.82mmol/g
2.2 Characterization
The samples were measured by X-ray powder diffraction (XRD) on a Panalytical
CUBIX diffract meter with monochromatic CuKα1,2 radiation (λ=1.5406, 1.5444 Å;
Kα2 / Kα1 intensity ratio=0.5)
The morphology and particle size were characterized by scanning electron
microscope (SEM, JEOL JSM-6300). The samples were placed on a carbon film.
Elemental composition was determined by inductively coupled plasma atomic
absorption spectroscopy (ICP-OES) using a Varian 715-ES.
Transmission electron microscopy requires that the fraction of the incident beam
of electrons is transmitted through the sample, so that the thickness of samples must
be thin enough to allow this. Scanning electron microscopy has a resolution of
5-15nm, while the transmission is 0.2-0.5nm.
Sample preparation consisted of dispersion the samples in a solvent (ethanol)
using ultrasound. A drop of this dispersion was placed on grid coverage. The
microscope used was a Philips EM400
The BET surfaces were measured by N2 adsorption and desorption at 77 k, pore
volume and distribution of the pore volume in solids using various models. And the
machine used for N2 adsorption and desorption was ASAP 2000 automatic
equipment.
Low-temperature infrared spectroscopic (FTIR) experiments were performed in
a Bio-Rad FTS-40A spectrometer using, respectively, a homemade stainless steel
cell and a quartz cell fitted with KRS-5 windows, both connected to a vacuum dosing
system. Before each experiment, the catalysts were pressed into self-supported
14wafers (5–10 mg/cm2) degassed under vacuum (ca. 10−5 mbar) at 673 K and then
cooled down to RT under vacuum. For low-temperature CO adsorption experiments,
the samples were cooled to 77 K followed by CO dosing at increasing pressure
(0.4–8.5 mbar) and recording the IR spectrum after each dosage. After CO dosing,
the samples were evacuated and the spectra collected.
TPD experiments employed a Micromeritics 2900 apparatus. A calcined sample
(100 mg) was activated by heating to 400ºC for 2 h in an oxygen flow and for 2 h in
argon flow. Subsequently, the samples were cooled to 176ºC, and NH3 was adsorbed.
The NH3 desorption was monitored with a quadrupole mass spectrometer (Balzers,
Thermo Star GSD 300T) while the temperature of the sample was ramped at 10ºC
min-1 in helium flow. Total ammonia adsorption was measured by repeated injection
of calibrated amounts of ammonia at 176ºC until saturation. Ammonia desorption
was recorded by means of the mass 15, because this band suffers less interference
from the water desorbed by the sample.
2.3 Methanol to Olefin test
The catalyst was made to 0.2-0.4 mm particle size, and mix with 2 g quartz
(Fluka), and then was put into a bed reactor. The methanol was bubbled with a
nitrogen flow of 19 mL/min, the WHSV was about 7 h-1. The catalyst was first
activated by nitrogen flow of 80 mL/min for 1 h at 540℃, and then the temperature
down to reaction condition 400℃. Each experiment was analyzed by an online gas
chromatograph (VARIAN 450 GC, Pona and Al2O3 capillary columns, TCD and FID
detectors). After reaction, the catalyst was regenerated at 540ºC in 80ml of air for 3h.
and the reaction was done again.
15Fig 10 The scheme of methanol to olefin reaction system
3 Results and discussion
3.1 XRD and Microscopy
The XRD results of nano and standard SAPO-34 samples are shown in Figure 11
and 12 after exposure to air in room conditions for several days in which moisture of
air is in contact with the samples. From the Fig. 11 (A) the samples of nano-SAPO-34
present as expected, a diffraction pattern with very low resolution similar to that
reported by Lin et al [49], due to the small size of the crystals and there is no clear
indication of any decrease in intensity after exposition at room conditions, even the
samples were put in the lab for 40 days. To test the hydrothermal stability, we have
treated the samples with 100% steam at 700 ºC for 5h. And the XRD result was
shown in Fig. 11 (B). This time we can see the little changes in intensity for the
steaming Nano SAPO-34, and main peaks were still the same with that calcined
Nano one.
The standard SAPO-34 of large crystal size shows a diffraction pattern more
intense and also there was no modification after several days of exposure to moisture
from the Fig 12 (A). The standard steaming of SAPO-34 samples also reduced the
intensity of the XRD peaks. From the point of view of XRD the structure of both
16Nano and Standard SAPO-34 is not strong affected during neither the storage nor the
steaming treatment. However, the broadening of the peaks in the diffraction pattern
of nano SAPO-34 due to the small size of crystal does not allow to appreciate large
changes in crystallinity.
(B)
(A) e
d
Intensity (a.u.)
Intensity(a.u>) b
c
b
a
a
5 10 15 20 25 30 35 40
5 10 15 20 25 30 35 40
2θ 2θ
Fig.11 (A) XRD of nano SAPO-34 a) 1day b) 7days c) 14days d) 21days e) 42days of storage at
room atmosphere after calcined
(B) a) Steamed Nano SAPO-34 b) nano SAPO-34
(A)
(B)
b
c
b
a
a
5 10 15 20 25 30 35 40 5 10 15 20 25 30 35 40
2θ 2θ
Fig.12 (A)XRD of standard SAPO-34 a) 1dayb) 21days c) 42 of storage at room atmosphere after
calcined
; (B) a) steamed Standard SAPO-34 b) Standard SAPO-34
Fig.13 shows the SEM and TEM images of Nano SAPO-34 prepared by
17microwave heating and the Standard SAPO-34. The sample Nano-SAPO-34 shows
spherical aggregates of 150-300 nm formed by smaller crystals of around 20-50 nm,
while standard SAPO-34 presents cubic crystals about 300-600 nm. The smaller
dimensions of the crystals of Nano SAPO-34 agree with the broad XRD peaks
showed in Figure 12, and the size of standard SAPO-34 is in agreement with the
examples reported by Lee et al[39], in which SAPO-34 synthesized with the same
mixture 1:1 of morpholine and TEAOH also presented crystal size in sub-micrometer
range.
Fig.13 (A) SEM of Nano SAPO-34 Fig.13 (B) SEM of Standard SAPO-34
100 nm
Fig.13 (C) TEM of Nano SAPO-34
223.2 N2 Adsorption
Textural properties of samples are shown in Table 1. Nano SAPO-34 shows very
high external surface area due to the small size of the crystals. After contact with
ambient moisture for several days, the micropore volume steadily decreases while
external surface area seems not to be affected, but after 28 days later the BET surface
seemed to be changed from 613.2 to 560.5 m2/g, and also the micropore volume
reduce to 0.1815 cm3/g. On the contrary, standard-SAPO34 presents an initial lower
external surface area and BET, which does not seem to be affected after 2 months of
moisture exposure, maybe the conclusion could be like that, in the room condition
the BET surface of Standard SAPO-34were more stable than Nano one. And the
reason maybe the Nano particle crystal samples would have some amorphous part
with days increased which block the channels for N2 adsorption and desorption.
Table 1 N2 Adsorption of Nano SAPO-34
BET t-plot Exter MPV Meso Volu
sample
(m2/g) ( m2/g) (cm3/g) (cm3/g)
Nano SAPO-1day 646.1 230.5 0.2032 0.2087
Nano SAPO-7days 639.3 226.3 0.2019 0.2058
Nano SAPO-21days 616.3 223.6 0.1920 0.2004
Nano SAPO-28days 613.2 223.9 0.1904 0.2011
Nano SAPO-42days 560.5 182.0 0.1815 0.3273
Nano SAPO-107day 535.5 223.3 0.1527 0.1979
Steaming Nano SAPO 1 days 490.3 162.6 0.1604 0.1816
Steaming Nano SAPO 50 days 488.1 160.2 0.1606 0.1852
Steaming Nano SAPO 65 days 490.9 162.8 0.1607 0.1932
23After steaming at 700 ºC for 5 hours, both of Nano SAPO-34 and standard one
presented a reduction in micropore volume and external surface, but the steaming
Nano one’s values are yet higher than those of standard SAPO-34, and values are
more stable compared the Nano one. Even after 65 days of storage at room
conditions, the value were almost the same. The external surface of standard
SAPO-34 was not affected by steaming and micropore volume is slightly reduced.
Table 2 N2 Adsorption of Standard SAPO-34
BET t-plot Exter MPV Meso Volu
Sample
(m2/g) ( m2/g) (cm3/g) (cm3/g)
Standard SAPO 5 days 450.0 63.03 0.1903 0.1105
Standard SAPO 29 days 462.6 62.48 0.1966 0.1147
Standard SAPO 44days 462.9 64.78 0.1957 0.1114
Steaming Standard SAPO-2days 432.0 67.72 0.1791 0.1099
Steaming Standard SAPO-54days 404.1 60.43 0.1695 0.1135
Steaming Standard SAPO-62days 429.8 67.50 0.1782 0.1135
The corresponding spectra are given in Fig.14. Calcined nano SAPO-34 shows
an intense peak at 36 ppm followed by other signals at -11 and -14 ppm, that
corresponds to tetracoordinated aluminum in local structures of Al(PO)4, and octa
and pent coordinated aluminum coordinated, respectively [42]. After 7 days of
storage, the signal at 14 ppm continuously increased indicating hydration of Al(PO)4
species [42, 51], while the signal of tetracoordinate aluminum is shifted to -41 ppm.
The shifting of the tetrahedral signal could be attributed to a distortion of the
framework due to the hydration of the structure [52]. The standard SAPO-34 sample
shows the same signals, with lower intensity of octahedral aluminum possibly due to
a lower effect of hydration that is accompanied with a lower shifting of the
tetrahedral signal at 36 ppm. When both samples are submitted to steaming at 700 ºC,
the spectrum similar with signals at 40, -11 and -14, but the intensity of octahedral
24aluminum is lower for nanoSAPO-34.
27
Al NMR
(A)
41 -14 f
e
d
c
b
36
a
-11
80 60 40 20 0 -20 -40 -60
ppm
27
Al NMR
(B)
41 -14
d
36
c
b
-11
a
80 60 40 20 0 -20 -40 -60 -80
ppm
Fig.14 (A) 27Al NMR of nano SAPO-34 a) 1dayb) 7days c) 14days d) 21days e) 42days f) steamed
nano SAPO-34 (B) standard SAPO-34 a) 21 day b) 32 days c) 40 days d) steamed standard SAPO-34
3.3.2 28Si NMR
The 28Si NMR spectrum of nano and standard SAPO-34 is shown in Figure 15.
This technique is useful to study the mechanism of silicon incorporation in the
framework of AlPO4. In silicialuminophosphates, silicon is incorporated following
two different mechanisms, SM2 in which a single Si substitutes a single P atom, or
SM3 in which two Si atoms substitutes two neighbors’ Al and P atoms [53, 54]. Nano
SAPO-34 shows a broad signal formed by components at -89, -95, -100, -105 and
-110 ppm, that corresponds to Si(OAl)4, Si(OAl)3, Si(OAl)2, Si(OAl)1 and Si(0Al)
25respectively [52, 54-56]. The incorporation of silicon through SM2 generates
Si(OAl)4 groups while mechanism SM3 generates the others. Thus, there is an
important participation of the SM3 mechanism substitution together with SM2 for
nanoSAPO-34. It has been reported that the contribution of mechanism SM3 in
SAPO-34 depends on the proportion of silicon was high in the gel composition [41,
57, 58].However, conventional hydrothermal synthesis performed with TEAOH as
SDA and higher amount of silicon has been reported to produce SAPO-34 samples in
which substitution mechanism is preferentially SM2. Thus, synthesis performed by
microwave heating could induce more incorporation of silicon through mechanism
SM3, in which two silicon atoms replaces an Al and P pair.
After 7 days of hydration, the signal at -95 ppm corresponding to Si(OAl)3
decreases and a broad small band around -78 to -85 appears. This broad band has
been assigned to Q1, Q2 and Q3 entities [43], Si(OAl)4 disordered [42] or Si located
at the edge of a Si domain [59]. In any case, this band has been reported to be
enhanced by cross-polarization [43, 59], that suggests that are defect sites created by
hydration and hydrolysis. Therefore, it appears that Si(OAl)3 species are first
affected by hydrolysis creating groups Si(OAl)(3-x)(SiOH)x. At increasing time of
hydration the band corresponding to defects increases at expenses of the bands -89 to
-99 ppm. It is important to note that silicon species incorporated by SM3 mechanism
are first affected by hydrolysis, because their associated Brönsted acid sites are
stronger than those generated by single Si incorporation (SM2). In fact, recently
Katada et al. [60] studied different SAPO-34 and determined that samples with less
isolated Si presented weaker Brönsted acidity and attributed the stronger acidity to
the presence of distorted structure including SiO2 islands or defects. Other authors,
[55, 61] in the line of the contribution of Barthomeuf [62] assign the higher acidity to
the presence of silicon islands in which acid sites are generated in its borders.
Consequently, in our case for nanoSAPO-34 the silicon species first affected by
hydrolysis are those that generated stronger acid sites and then, the overall acidity
should be decreased by hydrolysis and its strength shifted to milder acidities.
The standard SAPO-34 sample shows sharper signals of 28Si NMR at the same
26positions that Nano SAPO-34, with higher intensity of the signals at -105 and -110
corresponding to Si(OAl)1 and Si(0Al) due to its higher silicon content. However,
the changes after several days of hydration are slower. After 32 days of hydration the
signal at -95 ppm corresponding to Si(OAl)3 starts to decrease, and only after 40
days, the signal of defects from -78 to -85 ppm are visible. Again, the standard
SAPO-34 is shown less sensitive to hydrolysis than nanoSAPO-34.
After steaming at 700 ºC, some slight differences appear comparing with the
hydrated samples. In the case of steamed-nanoSAPO-34, comparing with the sample
hydrated 43 days, the steaming treatment caused an increase in the intensity of the
signals at -100 to -110 corresponding to Si in SiO2 islands while the signals
corresponding to single silicon Si4Si and Si in the border of SiO2 islands Si3Al1Si
have decreased. In the case of the standard SAPO-34 the effect of steaming is a small
broadening of the signal, and the profile is very similar to that of the sample hydrated
for 40 days. It is important to notice that when steaming nano SAPO-34, the signals
at Si4Al and Si3Al1Si decreased with no proportional increase of defects. It suggests
that with the presence of steam this two silicon species migrate to silicon islands
without the appearance of defects.
2728 28
Si NMR Si NMR
(A) f (B)
e d
-89 -99
d -85
-78 c
-85
-78 c -110
-95-105
b
b
-95
-89 -100
-110
-105
a a
-70 -80 -90 -100 -110 -120 -130 -70 -80 -90 -100 -110 -120 -130
ppm ppm
28
Fig.15 (A) Si NMR of nano SAPO-34 a) 1day b) 7days c) 14days d) 21days e) 42days f) steamed nano
SAPO-34 (B) standard SAPO-34 a) 21 day b) 32 days c) 40 days d) steamed standard SAPO-34
3.3.3 31P NMR
The 31P NMR spectra (Fig 16) for fresh nanoSAPO-34 shows an asymmetrical
signal at -30 ppm corresponding to tetrahedral P(OAl)4. After 7 days of hydration
other signal at -16 ppm appeared corresponding to P atoms coordinated with water
molecules in form of species P(OAl)x(H2O)y [42, 63, 64]. The relative intensity of
the signal at -16ppm increased continuously even up to 42 days of hydration and
correlates well with the increase in the octahedral signal of Al NMR at -12 ppm
which was assigned to the hydration of the Al(PO)4 species. In the case of the
standard SAPO-34 sample, the only signal that appears is the corresponding to
tetrahedral phosphorus at -30 ppm up to 40 days of hydration. After steaming, both
samples present signals at -30 and -16 ppm, the latter caused by hydration with the
steam being more intense in the case of steamed-nanosapo-34.
2831
P NMR
(A)
f
e
d
c
-16 -30 b
a
0 -5 -10 -15 -20 -25 -30 -35 -40 -45
ppm
31
P NMR
(B) d
-16
c
b
-30
a
0 -5 -10 -15 -20 -25 -30 -35 -40 -45
ppm
Fig.16 (A) 31P NMR of Nano SAPO-34 a) 1day b) 7days c) 14days d) 21days e) 42days f) steamed Nano
SAPO-34 (B) standard SAPO-34 a) 21 day b) 32 days c) 40 days d) steamed Standard SAPO-34
3.4 FTIR and CO Adsorption
The FTIR spectrum of nanoSAPO-34 in the hydroxyl region is shown in Fig.
17-20. The sample nanoSAPO-34 shows characteristic signals at 3600 and 3630 cm-1
corresponding to low and high-frequency Brönsted OH groups, 3745 and 3678 cm-1
corresponding to external Si-OH and P-OH groups respectively, and other small
signals at 3796 and 3770 cm-1 referred in the literature as OH groups linked to
tetrahedral Al [65, 66] . The relatively high intensity of these latter two bands must
be assigned to the high external surface of the sample. In addition, there is a broad
band centered around 3400-3500 cm-1 which should correspond to Si-OH and P-OH
29groups interacting through H-bonds, as reported for high silica CHA zeolites [67]
and mesoporous AlPO [68]. After days of hydration this broad band increases in
intensity indicating that defects are being developed. In addition, the band at 3678
cm-1 corresponding to P-OH groups also increases due to the irreversible hydrolysis
of the Al-O-P bonds.
The adsorption of CO at low temperatures has been used to characterize the
strength of the acid sites of SAPO-34. In the case of the sample of nanoSAPO-34, the
bands corresponding to HF and LF Brönsted acid sites are shifted upon progressive
adsorption and interaction with CO to a broad band around 3200-3500 cm-1 and are
in agreement with that reported in the literature [55, 69]. In addition, two other bands
in the CO-stretching area appear at 2171 and 2140 cm-1, corresponding to CO
interacting with Brönsted acid sites and physisorbed condensed CO respectively [69].
The broad band around 3200-3500 cm-1 is composed of a main signal at 3364 cm-1
and a shoulder at 3474 cm-1. These signals have been assigned to CO interacting with
HF and LF hydroxyls and, in agreement with the contribution of Martins et al [55],
other overlapped signal appear at 3280 cm-1 if a deconvolution of the broad band is
performed. Due to its larger shift, this overlapped band at 3280 cm-1 has been
assigned to CO interacting with acid sites corresponding to Si in the borders of the
silicon islands, with an acidity of higher strength. As shown above in the analysis of
Si-NMR spectra, after days of hydration of nanoSAPO-34 it was also expected to see
a decrease of those sites of higher strength if they are related to Si(3Si1Al). However,
the fitting process for deconvolution of the overlapped bands showed a contribution
of around 10% of the overall area of the broad band, being almost impossible to
distinguish if there is a decrease in these sites due to hydrolysis and transformation in
defects. In addition, the signal at 2171cm-1 due to CO adsorption on acid site after the
first phase of CO.
The FTIR of nanoSAPO-34 steamed sample is very similar to the parent sample,
with a decrease in the intensity of the broad band 3200-3500 cm-1 corresponding to
Si-OH and P-OH groups interacting through H-bonds.
In summary, from the analysis of FTIR of adsorbed CO, it has not been possible
30to see difference in acid strength of nano SAPO-34 samples at different time of
storage. Possible, CO is too basic for measuring small differences in acid strength or
after several pulses of CO the average of the signal does not show changes in wave
number that could be an indication of different acid strength.
3630
3600
1day
14 day
3678
7day
21day
3745
3701
3771
3795
4000 3800 3600 3400 3200 3000
-1
cm
Figure 17. FTIR in the OH range of nanoSAPO-34 after storage at room environment.
3364 1day
14 day
7day
3629 3474 21day
3280
4000 3800 3600 3400 3200 3000
-1
cm
Fig.18. FTIR in the OH stretching range of fresh nano SAPO-34 after sequential pulses of CO
adsorption. Spectra substracted from the original free of CO.
312171
1day
14 day
7day
21day
2140
2240 2220 2200 2180 2160 2140 2120 2100 2080
-1
cm
Fig.19. FTIR on the CO stretching after the initial CO adsorption on nanoSAPO-34 after storage at room
environment for 1, 7, 14 and 21 days.
2171
1day
14 day
7day
21day
2140
2240 2220 2200 2180 2160 2140 2120 2100 2080
-1
cm
Fig. 20. FTIR on the CO stretching after several pulses of CO adsorption on nanoSAPO-34 after storage
at room environment for 1, 7, 14 and 21 days.
32Table 3 NH3 Temperature program desorption
Nano steaming steaming
standard(mmolNH3
Days SAPO(mmolNH3 days Nano(mmolNH3 standard(mmolNH3
g-1 zeolite)
g-1 zeolite) g-1 zeolite) g-1 zeolite)
1 1.02907991 28 0.971424 0.530717411 0.733139
3 1.02814732 40 0.951022
30 0.8602308
43 0.71852054
60 0.89214866
3.5 Methanol to hydrocarbons activity
The activity of nano and standard SAPO-34 is shown in Figures 21-22 at
WHSV=7h-1. It is important to note the higher lifetime of nanoSAPO-34. In addition,
in the case of nanoSAPO-34, lifetime changes with the time of storage. First, it
increases until maximum life after 14 days of storage and then decreases
continuously. Standard SAPO-34 showed always a lower lifetime than that of
nanoSAPO-34, and seems to stabilize after 42 days of storage
Nano SAPO
100
80
methanol conversion
Nano SAPO 1day
60
Nano SAPO 7days
Nano SAPO 14days
40
Nano SAPO 21days
20 Nano SAPO 45days
Nano SAPO 93days
0
0 100 200 300 400
t(min)
Fig.21 MTO reactions on different nano SAPO-34 after calcinations, have been exposed to room
atmosphere froe 1up to 93 days.
33100
Standard SAPO
80
methanol conversion
standard SAPO 1day
60
standard SAPO 31days
standard SAPO-42days
40
20
0
0 50 100 150 200 250 300 350
t(min)
Fig.22 MTO reactions on different standard SAPO-34 after calcinations, have been exposed to room
atmosphere from 1 up to 42 days.
Kinetics
In order to rationalize the different behavior of activity for the samples of
SAPO-34, we have performed a kinetic analysis following the model proposed for
Janssens[70, 71] for modeling the deactivation of ZSM-5 in the conversion of
methanol to gasoline. Jannsens proposes that conversion of methanol to
hydrocarbons on zeolites can be modeled just by using two parameters, the rate
constant and the deactivation coefficient, assuming a first order of reaction and a
deactivation rate proportional to the conversion. Also by following this methodology,
half lifetime and charge capacity of methanol can easily be estimated.
The model proposed by Janssens considers deactivation as an effective decrease
of contact time, and agrees with a “non selective deactivation” of the reaction, in
which the successive steps from reactants to products are affected by deactivation at
the same rate and can be modelized by a single parameter. It has been shown true for
the oligomerization of olefins and also the reaction of methanol to gasoline in
ZSM-5[72, 73]. However, the reaction of methanol to olefins on SAPO-34 was
shown as “selective deactivation” by Chen et al [74, 75]. In our case, the fitting of the
34conversion of methanol + dimethylether lumped for both SAPO-34
SAPO is surprisingly as
good as shown in the literature in the case of ZSM-5,
ZSM 5, suggesting that also in this case
a “single event kinetics model” can be used as in the case of SAPO-34.
SAPO
Fig. 22 Yields of C2, C3, C4 and C5+ in MeOH on nanosapo-34
34 (21 days aged) at different spatial times
(7, 11, 15 h-1)
1) at 400 ºC
In addition, the selectivity at three different spatial times were compared in
Figure 20 and it was shown that basically selectivity is very similar at constant
conversion and not depends on spatial time. So, also in SAPO-34
SAPO as in the case of
ZSM-5,
5, deactivation can be considered as a decrease of contact time that at the end is
the same as a decrease in the amount of active catalyst during the time of the reaction.
Then, by fitting
ing the following model (X: conversion, tau: spatial time gcat/mol h,
a deactivation constant, K kinetic rate constant), parameters found are shown in table
4.
Table.4 K and a value of all the samples
Sample: Nano SAPO-34
SAPO
days k a
1 45.14 0.001235
357 38.92 0.0009065
14 39.98 0.0006918
28 30.87 0.0007847
45 33.15 0.0009251
93 28.63 0.002291
Sample: Standard SAPO-34
days k a
1 26.77 0.001317
32 18.87 0.002332
41 21.36 0.002241
It can be seen that the initial kinetic rate constant is much higher for
nanoSAPO-34 than for the standard sample. It agrees with the smaller size of the
crystals of nanoSAPO-34, since methanol reaction on eight member ring zeolites is
diffusion controlled, higher external surface will greatly increase initial activity. And
taking into account that both samples presented similar acidity measured by
ammonia TPD, the kinetic rate constant obtained must be directly related to the
number of accessible sites close to the surface of the catalyst. Indeed, after exposure
to room atmosphere the kinetic rate constant steadily decreases in both nano and
standard SAPO-34. The initial deactivation constant is similar for both catalysts.
However its behavior after exposure to room atmosphere is different. In the case of
nanosapo-34, the deactivation constant strongly decreases up to 14 days and then
increases, while for standard SAPO-34 it continuously increases. The long-term
increase in the deactivation constant could be due to the presence of defects created
by the irreversible hydrolysis of the structure, as shown above by FTIR and NMR
that could accelerate deactivation by adsorption of coke precursors. In fact, a higher
deactivation and shorter lifetime was reported in the case of zeolite ZSM-5, in which
the creation of internal silanol nests by carbon templating induced higher
deactivation in the MTH reaction [76, 77]. On the other hand, the short-term decrease
in the deactivation constant until the 14th day of exposure for nanoSAPO-34 could
be attributed to the hydrolysis of the Si-O-Al groups at the border of the silicon
islands shown before by NMR. These acid sites are believed to present acidity close
36to those of zeolites and then, and then, will promote coking faster than single silicon
sites in SAPO-34. Their disappearance by hydrolysis will enhance lifetime.
Therefore, by selective hydrolysis of Si-O-Al bonds corresponding to strongest acid
sites, the remaining acidity resulted in a catalyst with lower deactivation and longer
lifetime.
Selectivity and thermodynamic equilibrium of olefins
When wt% yields and selectivity to olefins are plotted vs. conversion (Figure 23,
24), in general, selectivity is constant when conversion is not complete and changes
continuously in case of full conversion. As a consequence, the C2/C3 ratio tends to
increase with time on stream (Figure 26). It was already described by many authors.
In fact, Chen et al. [78] showed that ethylene selectivity increased with increasing
coke and proposed that coke has an effect of effective reduction of void volume of
the cavities modifying the transition-shape selectivity through the formation of
smaller molecules. On the other hand Dahl [79] and Barger [30] proposed that is
product shape selectivity which controls product distribution and that higher
ethylene selectivity is due to a faster diffusion of the shorter ethylene vs. the longer
propene through 8MR windows. The latter proposition was supported by Hereijgers
et al. [80] which by means of isotopic switch experiments with C13-marked
methanol, presented hexamethylbenzene as the most active intermediate for the
MTO reaction, even for the strong deactivated catalyst, that is independent of the
amount of coke formed. However, if an easier diffusion of ethene were the main
factor affecting the ratio C2/C3 with time on stream, it should be greatly affected by
the size of the crystal of SAPO-34 by inducing higher C2/C3 values in case of larger
crystals. When looking into the C2/C3 ratio of nano and standard SAPO-34, just the
trend is the opposite. C2/C3 is higher for nanoSAPO-34 and increases with TOS,
when as the samples are aged at room conditions, the overall ratio decreases. This
effect must be related more in terms of acid strength than on diffusion. In fact, Song
et al. [81] reported that selectivity of ethylene was favoured by methylbenzenes
trapped in the cages with lower number methyl groups, while propylene is favoured
37when the number is higher of methyl groups, and Arstad et al. [82] showed that the
formation of ethylene from either hexa or tetramethylbnezene reaction center is
energetically less favoured than propylene. So, it can be deduced that stronger
acidities should induce higher C2/C3 ratios. In the case of fresh nanoSAPO-34, the
presence of acid sites corresponding to Si in the border of silicon islands, could
present higher strength and be the reason of the higher C2/C3 ratio, and when the
number of these sites is reduced by hydrolysis at room atmosphere, the C2/C3 ratio
drops sensibly.
On the other hand, the variation of the C2/C3 ratio with Time on Stream is
restricted to the analysis in which conversion is close to 100% and it seems logical to
think that thermodymamic equilibrium of olefins should occur and have a strong
effect on selectivity.
38Fig 24 the selectivity of Nano SAPO-34 in different days
Fig 25 the selectivity of standard SAPO-34 in different days
In figure 24 and table 5, initial and steady-state selectivity are compared with
thermodynamic values calculated including or not branched C4 and C5 olefins. It is
important to notice the branched olefins obtained in the case of nano-SAPO-34 that
must be attributed to the presence of higher amount of external surface area. In fact,
39including branched olefins in the thermodynamic calculations leads to a different
distribution of equilibrium, with lower amounts of C2-C3 olefins. In fact, the initial
distribution of olefin in both SAPO-34 correlates with the different equilibrium
distribution with the exception of ethylene, that is not surprising taking into account
that in the transformation of different olefins, ethylene is very difficult to activate or
protonate comparing with longer olefins. A similar result was obtained by Zhou et al
[71] showing that the rate of conversion of ethylene on sapo-34 is much lower than
propene and butane. In summary, at the start of the reaction, after the induction
period, the olefins formed at the top of the bed are transformed in the fresh catalyst
towards the equilibrium distribution, and in the case of nanosapo-34 with higher
external surface, olefins can isomerize and branched C4 and C5 appear as products.
As the deactivation front moves from the catalyst bed to the bottom, less fresh
catalyst remains until breakthrough of conversion below 100 wt%, from where the
selectivity reaches a steady-state, less affected by interconversion of olefins and
approaching the original selectivity of the hydrocarbon pool. Therefore, while
conversion during MTO reaction on SAPO-34 is close to 100%, that is the working
parameter for the industrial unit, the selectivity to olefins is strongly affected by
thermodynamical distribution. In addition, the differences in C2/C3 ratio after
exposition to moisture, and also the comparison with the values obtained with the
larger-sized Standard sapo-34 do not correlate with an easier diffusion of ethene vs.
propene. Moreover, this result is more in agreement with “transition shape selectivity
effect” in which higher amount distribution of products is affected by different acid
properties of the catalyst and not to a “product shape selectivity” in which coking
reduces the size of the cages and hinders diffusion of products.
Table.5. Initial and steady-state distribution of olefins in the conversion of Methanol to
Olefins at 400ºC, WHSV 7h-1 on standard SAPO-34(1day) and nanoSAPO-34(14days).
Thermodynamic equilibrium at P=0.04bar
Thermodynamic
Standard SAPO-34 Nano SAPO-34
equilibrium
Linear Linear+Branched Initial olefin Initial olefin
Steady-state Steady-state
olefins olefins distribution distribution
40Ethene 17.8 15 30.3 35 24.5 30.5
Propene 47.8 38.3 43.7 42 35.5 36.6
Butenes 28.2 26.8 19.7 15 24.6 20.8
Pentenes 6.2 19.9 7.3 5 13.4 10.6
Fig 26. C2/C3 ratio in different days for nano and standard SAPO-34
SAPO
3.6 Stabilization of nanoSAPO-34
nanoSAPO by hydrothermal treatment
The activity of nanoSAPO-34
nanoSAPO 34 measured in terms of lifetime or charge capacity
has been shown higher than standard SAPO-34
SAPO 34 due to its smaller crystal size.
However, its stability is lower after exposure to moisture at room conditions. In this
part we will show how its activity can be stabilized by steaming at different
temperatures.
Steaming of samples was done at 400, 500 600 and 700 ºC
C for 5 h and were tested
in the MTO reaction at the same condition than before. From
rom Fig.27-30
Fig.2 it can be seen
thatt when Nano SAPOs were treated with steam, the activity in MTO was still better
than that of standard SAPO-34,
SAPO 34, especially the sample steamed at 700ºC. If kinetic
rate and deactivation parameter are compared for the steamed samples (Table 6),
steaming causess a decrease in kinetic rate constant (K). It agrees with an effective
41reduction of acidity of the samples with steaming, and an increase in an amorphous
phase. The deactivation parameter (a) presents values similar to those of the fresh
nano SAPO-34. It is important to notice that the sample steamed at 700ºC is stable
after more than 60 days of exposure to moisture. At lower temperate of steaming,
kinetic rates are higher with similar values of deactivation parameters. However the
stability is lower after exposure to moisture.
In contrast, steaming of standard SAPO-34 at 700ºC strongly reduced lifetime. In
addition kinetics analysis showed a strong increase in the deactivation parameter.
Therefore, the optimum temperature for an effective stabilization of nanosapo-34
by steaming is 700ºC. From characterization results, this stabilization effect must be
related to the migration of single silicon and silicon in the border of the islands with
the result of growing these islands with no increase in the population of defects. This
migration must have been catalyzed by the presence of water during the steaming,
while the decreases in defects (mainly Si-OH groups) are due to annihilation to
Si-O-Si and water at high temperature. The decrease in Si in the border of the islands
must be produced by combination of different smaller Si islands in single ones.
Steaming nano SAPO-700℃
℃
100
80
methanol conversion
steaming nano SAPO 7days
60
steaming nano SAPO 53days
40 steaming nano SAPO-62days
20
0
0 50 100 150 200 250 300 350
t(min)
42You can also read