Bright and photostable chemigenetic indicators for extended in vivo voltage imaging
←
→
Page content transcription
If your browser does not render page correctly, please read the page content below
REPORTS

                                                                                                                Cite as: A. S. Abdelfattah et al., Science
                                                                                                                       10.1126/science.aav6416 (2019).

Bright and photostable chemigenetic indicators for
extended in vivo voltage imaging
Ahmed S. Abdelfattah1*, Takashi Kawashima1*†, Amrita Singh1,2, Ondrej Novak1,3, Hui Liu1,
Yichun Shuai1, Yi-Chieh Huang4, Luke Campagnola5, Stephanie C. Seeman5, Jianing Yu1,
Jihong Zheng1, Jonathan B. Grimm1, Ronak Patel1, Johannes Friedrich6,7,8, Brett D. Mensh1,
Liam Paninski6,7, John J. Macklin1, Gabe J. Murphy5, Kaspar Podgorski1, Bei-Jung Lin4,
Tsai-Wen Chen4, Glenn C. Turner1, Zhe Liu1, Minoru Koyama1, Karel Svoboda1, Misha B. Ahrens1‡,
Luke D. Lavis1‡, Eric R. Schreiter1‡§
1
 Janelia Research Campus, Howard Hughes Medical Institute, Ashburn, VA 20147, USA. 2Solomon H. Snyder Department of Neuroscience, Johns Hopkins
University, Baltimore, MD 21205, USA. 3Department of Auditory Neuroscience, Institute of Experimental Medicine, Academy of Sciences of the Czech Republic,
Prague, Czech Republic. 4Institute of Neuroscience, National Yang-Ming University, Taipei 112, Taiwan. 5Allen Institute for Brain Science, Seattle, WA 98109,

                                                                                                                                                                Downloaded from http://science.sciencemag.org/ on August 1, 2019
USA. 6Department of Statistics and Center for Theoretical Neuroscience, Columbia University, New York, NY 10027, USA. 7Department of Neuroscience and
Grossman Center for the Statistics of Mind, Columbia University, New York, NY 10027, USA. 8Center for Computational Biology, Flatiron Institute, New York, NY
10010, USA.
*These authors contributed equally to this work.
†Present address: Department of Neurobiology, Weizmann Institute of Science, Rehovot, Israel.
‡These authors contributed equally to this work.
§Corresponding author. Email: schreitere@janelia.hhmi.org

Imaging changes in membrane potential using genetically encoded fluorescent voltage indicators (GEVIs)
has great potential for monitoring neuronal activity with high spatial and temporal resolution. Brightness
and photostability of fluorescent proteins and rhodopsins have limited the utility of existing GEVIs. We
engineered a novel GEVI, “Voltron”, that utilizes bright and photostable synthetic dyes instead of protein-
based fluorophores, extending the combined duration of imaging and number of neurons imaged
simultaneously by more than tenfold relative to existing GEVIs. We used Voltron for in vivo voltage
imaging in mice, zebrafish, and fruit flies. In mouse cortex, Voltron allowed single-trial recording of
spikes and subthreshold voltage signals from dozens of neurons simultaneously, over 15 min of
continuous imaging. In larval zebrafish, Voltron enabled the precise correlation of spike timing with
behavior.

Animal behavior is produced by patterns of neuronal activi-                      rhodopsins (6–8) or fluorescent proteins (FPs) (9–13). These
ty that span a wide range of spatial and temporal scales. To                     fluorophores lack the brightness and photostability to allow
understand how neural circuits mediate behavior thus re-                         in vivo voltage imaging from large fields of view over time
quires high-speed recording from ensembles of neurons for                        scales of many behavioral events, precluding the millisec-
long periods of time. Although the activity of large numbers                     ond-timescale analysis of neural circuits. Improved rhoda-
of neurons can now be routinely recorded using genetically                       mine dyes such as the Janelia Fluor® (JF) dyes enable use in
encoded calcium indicators (GECIs) (1), the slow kinetics of                     complex biological experiments because of their high
calcium signals complicate the measurement of action po-                         brightness and photostability (14), compatibility with self-
tentials, and sub-threshold voltage signals are missed entire-                   labeling protein tags (15, 16), and the ability to traverse the
ly (1–3). Voltage imaging using genetically encoded voltage                      blood-brain barrier for in vivo delivery (17). We describe a
indicators (GEVIs) can overcome these challenges, enabling                       “chemigenetic”, or hybrid protein-small molecule, GEVI
imaging of fast spikes and subthreshold dynamics in genet-                       scaffold that we call Voltron, which irreversibly binds these
ically defined neurons (4, 5). The high imaging speed and                        synthetic fluorophore dyes. Voltron provides an increased
excitation intensity required for voltage imaging, combined                      photon yield that enables in vivo imaging of neuronal spik-
with the smaller volume of the cellular membrane, place                          ing and subthreshold voltage signals in model organisms
increased demands on voltage indicators relative to GECIs.                       with order-of-magnitude improvement in the number of
Extant GEVIs rely on fluorescence from either microbial                          neurons imaged simultaneously over substantially longer

First release: 1 August 2019                                       www.sciencemag.org              (Page numbers not final at time of first release) 1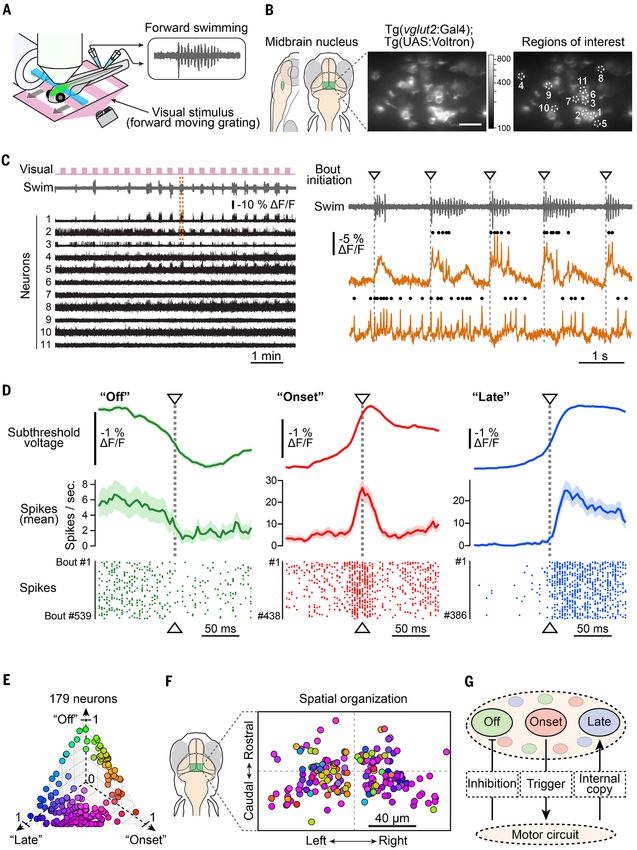
durations.                                                         ensemble measurements (Fig. 1H, tables S4 and S5, and figs.
     Our design for a chemigenetic voltage indicator com-          S14 and S15) as well as in single-molecule assays, in which
bines a voltage-sensitive microbial rhodopsin domain (6, 7,        photobleaching times were 8-fold longer for Voltron549 than
11) with a dye-capture protein domain (Fig. 1A) that irrevers-     those of Ace2N-mNeon (Fig. 1I). Overall, the improved
ibly binds a synthetic fluorophore dye ligand (14, 15) (Fig.       brightness and photostability of Voltron increased the pho-
1B), analogous to previously reported voltage indicators that      ton yield by at least 10-fold in neurons over existing GEVIs
use fluorescent proteins (10, 11, 18). Transmembrane-              that rely on fluorescence from FPs.
voltage-dependent changes in the absorption spectrum (6,                In vivo, Voltron could be reliably expressed and labeled
19) of the rhodopsin domain of Voltron reversibly modulate         with dye in mice, larval zebrafish, and adult fruit flies (Figs.
the degree of fluorescence quenching of the nearby bound           1 to 4 and figs. S16 to S19 and S21 to S45). Simultaneous in
dye through Förster resonance energy transfer (FRET). We           vivo electrophysiology and Voltron imaging in each of these
investigated the modularity of this approach, finding that         organisms confirmed the detection of individual action po-
three different rhodopsin domains, QuasAr1 (7), QuasAr2            tentials (Fig. 1, J and K, and figs. S17 to S19). For imaging in
(7), and Ace2N (11, 20), modulated the fluorescence of the         the mouse brain, we used a variant of Voltron appended
rhodamine dye Janelia Fluor® 549 (JF549) after binding to          with a 63 amino acid sequence from the rat potassium

                                                                                                                                        Downloaded from http://science.sciencemag.org/ on August 1, 2019
either HaloTag (15) or SNAP-tag (21) dye-capture protein           channel Kv2.1 that restricts expression to the membrane of
domains (figs. S1 to S8). Removing a small number of amino         the cell body and proximal dendrites (24, 25) (Voltron-ST,
acid residues at the junction of the rhodopsin and self-           fig. S20). The rapid kinetics of Voltron525-ST allowed clear
labeling tag domains increased the amplitude of fluorescent        observation of action potentials in fast-spiking parvalbumin-
voltage signals (fig. S1), presumably by decreasing average        expressing interneurons in the CA1 region of mouse hippo-
distance and thus increasing FRET efficiency between the           campus (Fig. 2, A to G, and fig. S21). We measured the ori-
dye and rhodopsin retinal cofactor. The configuration              entation tuning of the spiking and subthreshold responses
providing the best signal-to-noise ratio for spikes was Ace2N      of cortical layer 2/3 pyramidal neurons in mouse primary
fused to HaloTag with five amino acids removed at their            visual cortex in response to the mouse observing directional
junction (Fig. 1, A and B, and fig. S2), hereafter referred to     movement of light and dark stripes, a benchmark for new
as Voltron.                                                        indicators (1, 11) (Fig. 2, H to L, and figs. S22 to S24), and
     We tested several Voltron-dye combinations in cultured        confirmed that spiking activity showed sharper orientation
rat neurons and acute mouse brain slices with high-speed           selectivity than did subthreshold voltage signals (26). We
imaging and simultaneous whole-cell patch clamp electro-           extended the imaging period over several consecutive weeks
physiology (Fig. 1C, figs. S6 and S9 to S13, and tables S1 and     by injecting additional JF525 HaloTag ligand prior to each
S2). Voltron could detect neuronal action potentials and           imaging session (Fig. 2, J to L, and fig. S24).
sub-threshold potential changes with a variety of JF dye                Next, we attempted to image larger areas containing
ligands with emission maxima between 520 nm and 660 nm             more neurons for longer times in vivo in mouse cortex (Fig.
using fluorescence imaging with one-photon excitation (Fig.        3). By widefield microscopy at illumination intensities be-
1, C to E, and fig. S6), but was not compatible with two-          tween 3 and 20 mW/mm2, we could clearly identify and dis-
photon imaging, as described previously for rhodopsin-             tinguish action potentials from nearby neurons throughout
containing GEVIs (22, 23). Voltron bound to JF525                  15 min of continuous imaging (SNR = 5.3 during the first
(Voltron525) exhibited the highest sensitivity, giving a fluo-     minute, 4.4 during final minute); (Fig. 3, B to E). We ex-
rescence change of –23 ± 1% ΔF/F0 for a voltage step from –        panded the field-of-view to include dozens of cortical inter-
70 mV to +30 mV (Fig. 1E and fig. S9); Voltron549 showed           neurons labeled with Voltron525-ST in a transgenic mouse
similar sensitivity. Voltron525 responded to voltage steps         line (NDNF-Cre) (27), while imaging at 400 Hz (Fig. 3, F and
with submillisecond on and off time constants (table S3 and        G, and figs. S25 to S42). Overall, we imaged a total of 449
fig. S10). We compared the brightness and photostability of        neurons (12 fields of view in 3 mice), demonstrating routine
Voltron in neuronal cultures with those of two other fluo-         voltage imaging of populations of neurons in superficial
rescent protein-based GEVIs: Ace2N-mNeon (11) and                  mouse cortex (Fig. 3G and figs. S25 to S42). This scale of in
ASAP2f (13). Both Voltron525 and Voltron549 were brighter          vivo voltage imaging enabled analysis of membrane poten-
than Ace2N-mNeon (3–4-fold) and ASAP2f (16–18-fold) (Fig.          tial correlations between many neuron pairs (fig. S26).
1F) in cell culture. This difference did not result from differ-        We used Voltron to image behaving zebrafish larvae,
ences in expression; we compared the brightness of                 which respond to visual input with fast, directed swim bouts
Voltron549 and Ace2N-mNeon at the single-molecule level            that are tailored to the details of the stimulus (28). We
and observed a similar 3–4-fold brightness difference (Fig.        sought to uncover how this sensory-to-motor transformation
1G). Voltron525 and Voltron549 were also more photostable in       unfolds in neuronal populations at fine timescales that are

First release: 1 August 2019                           www.sciencemag.org       (Page numbers not final at time of first release)   2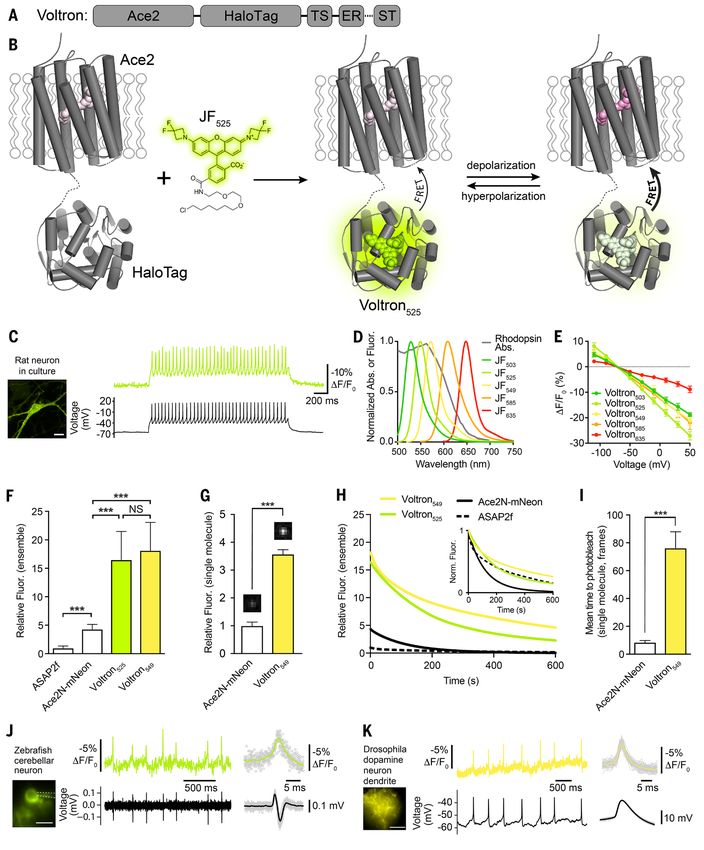
inaccessible with calcium imaging. We verified that Voltron     (14). However, previous attempts to create hybrid protein-
could detect action potentials and subthreshold voltage sig-    small molecule indicators by various approaches have not
nals in live zebrafish after labeling with several different    been successful for in vivo imaging (30). We engineered a
colors of dye ligands (figs. S17 and S43). We then used         modular sensor scaffold in which the targeting and sensor
Voltron525 to monitor neural activity during swim bouts in-     domains are genetically encoded and only the fluorophore
duced by visual motion (Fig. 4A). We recorded Voltron sig-      and its protein-binding anchor are synthetic. The resulting
nals from 179 neurons across 43 fish in a motor-sensory         chemigenetic indicator, Voltron, exhibits increased photon
nucleus in the tegmental area of the midbrain (Fig. 4B and      output, enabling in vivo voltage imaging of many more neu-
fig. S44), yielding data on subthreshold membrane voltage       rons over longer times—approximately 102 more neuron-
modulation as well as automatically-detected spike times        minutes than other sensors. This improvement enables im-
(Fig. 4C and fig. S45). We found neuron populations with        aging experiments that can help reveal how the precise elec-
different temporal activity patterns, including neurons         trical dynamics of neuronal populations orchestrate
whose firing rate increased ~1 s before the fish started        behavior over different time scales.
swimming (fig. S44, B and C, “Ramp”), neurons whose firing
rate was suppressed each time the fish swam (Fig. 4D,

                                                                                                                                                               Downloaded from http://science.sciencemag.org/ on August 1, 2019
                                                                REFERENCES AND NOTES
“Off”), and neurons that fired each time the fish swam (Fig.    1. T. W. Chen, T. J. Wardill, Y. Sun, S. R. Pulver, S. L. Renninger, A. Baohan, E. R.
4D, “Onset” and “Late”). Of the latter types, some fired just       Schreiter, R. A. Kerr, M. B. Orger, V. Jayaraman, L. L. Looger, K. Svoboda, D. S.
before swimming (~20 ms before swim onset, “Onset”) and             Kim, Ultrasensitive fluorescent proteins for imaging neuronal activity. Nature
others fired just after swimming (~10 ms after swim onset,          499, 295–300 (2013). doi:10.1038/nature12354 Medline
“Late”). There was a change in subthreshold voltage that        2. K. Svoboda, W. Denk, D. Kleinfeld, D. W. Tank, In vivo dendritic calcium dynamics
                                                                    in neocortical pyramidal neurons. Nature 385, 161–165 (1997).
preceded these firing-rate changes by tens of milliseconds
                                                                    doi:10.1038/385161a0 Medline
(Fig. 4D and fig. S44D). The neuron types were spatially in-
                                                                3. V. Emiliani, A. E. Cohen, K. Deisseroth, M. Häusser, All-optical interrogation of
termingled within this midbrain nucleus (Fig. 4, E and F).          neural circuits. J. Neurosci. 35, 13917–13926 (2015).
The existence of neurons that fired before swimming and             doi:10.1523/JNEUROSCI.2916-15.2015 Medline
neurons that fired after swimming may indicate that this        4. Y. Xu, P. Zou, A. E. Cohen, Voltage imaging with genetically encoded indicators.
nucleus both partakes in the generation of swim bouts and           Curr. Opin. Chem. Biol. 39, 1–10 (2017). doi:10.1016/j.cbpa.2017.04.005 Medline
is influenced by the motor output (Fig. 4G). Thus, Voltron      5. M. Z. Lin, M. J. Schnitzer, Genetically encoded indicators of neuronal activity. Nat.
allows for the dissection of population motor coding and            Neurosci. 19, 1142–1153 (2016). doi:10.1038/nn.4359 Medline
sensorimotor integration circuits in ways that neither sin-     6. J. M. Kralj, A. D. Douglass, D. R. Hochbaum, D. Maclaurin, A. E. Cohen, Optical
                                                                     recording of action potentials in mammalian neurons using a microbial
gle-cell electrophysiology nor population calcium imaging
                                                                     rhodopsin. Nat. Methods 9, 90–95 (2011). doi:10.1038/nmeth.1782 Medline
can.
                                                                7. D. R. Hochbaum, Y. Zhao, S. L. Farhi, N. Klapoetke, C. A. Werley, V. Kapoor, P. Zou,
     We tested Voltron in adult Drosophila in vivo by ex-           J. M. Kralj, D. Maclaurin, N. Smedemark-Margulies, J. L. Saulnier, G. L. Boulting,
pressing the protein in a pair of dopaminergic neurons, one         C. Straub, Y. K. Cho, M. Melkonian, G. K.-S. Wong, D. J. Harrison, V. N. Murthy, B.
in each brain hemisphere, which innervate a single com-             L. Sabatini, E. S. Boyden, R. E. Campbell, A. E. Cohen, All-optical
partment in the mushroom body. We detected strong spik-             electrophysiology in mammalian neurons using engineered microbial
                                                                    rhodopsins. Nat. Methods 11, 825–833 (2014). doi:10.1038/nmeth.3000
ing signals from axons and dendrites of these neurons with          Medline
Voltron549 (Fig. 1K and fig. S18). The fluorescence signals     8. Y. Adam, J. J. Kim, S. Lou, Y. Zhao, M. E. Xie, D. Brinks, H. Wu, M. A. Mostajo-Radji,
matched action potentials detected using electrophysiology.         S. Kheifets, V. Parot, S. Chettih, K. J. Williams, B. Gmeiner, S. L. Farhi, L.
In some neuronal cell types in Drosophila, calcium indica-          Madisen, E. K. Buchanan, I. Kinsella, D. Zhou, L. Paninski, C. D. Harvey, H. Zeng,
tors located in the cell body have failed to exhibit fluores-       P. Arlotta, R. E. Campbell, A. E. Cohen, Voltage imaging and optogenetics reveal
                                                                    behaviour-dependent changes in hippocampal dynamics. Nature 569, 413–417
cence changes even under conditions where high spike rates          (2019). doi:10.1038/s41586-019-1166-7
are expected (29). However, spikes were clearly detectable
                                                                9. L. Jin, Z. Han, J. Platisa, J. R. A. Wooltorton, L. B. Cohen, V. A. Pieribone, Single
when imaging from the soma of dopamine neurons with                 action potentials and subthreshold electrical events imaged in neurons with a
Voltron (fig. S18E). We could clearly distinguish spikes from       fluorescent protein voltage probe. Neuron 75, 779–785 (2012).
the two neurons based on the amplitude of the spiking sig-          doi:10.1016/j.neuron.2012.06.040 Medline
nals even when imaging from neuropil where their axons          10. P. Zou, Y. Zhao, A. D. Douglass, D. R. Hochbaum, D. Brinks, C. A. Werley, D. J.
                                                                    Harrison, R. E. Campbell, A. E. Cohen, Bright and fast multicoloured voltage
overlap extensively, likely because each bilaterally-
                                                                    reporters via electrochromic FRET. Nat. Commun. 5, 4625 (2014).
projecting cell contributes a denser innervation of the             doi:10.1038/ncomms5625 Medline
mushroom body in the ipsilateral hemisphere (fig. S18D).        11. Y. Gong, C. Huang, J. Z. Li, B. F. Grewe, Y. Zhang, S. Eismann, M. J. Schnitzer,
     Combining the molecular specificity of genetically en-          High-speed recording of neural spikes in awake mice and flies with a fluorescent
coded reagents with the superior photophysics of chemical            voltage sensor. Science 350, 1361–1366 (2015). doi:10.1126/science.aab0810
dyes is an established path to improved imaging reagents             Medline

First release: 1 August 2019                        www.sciencemag.org             (Page numbers not final at time of first release)                       3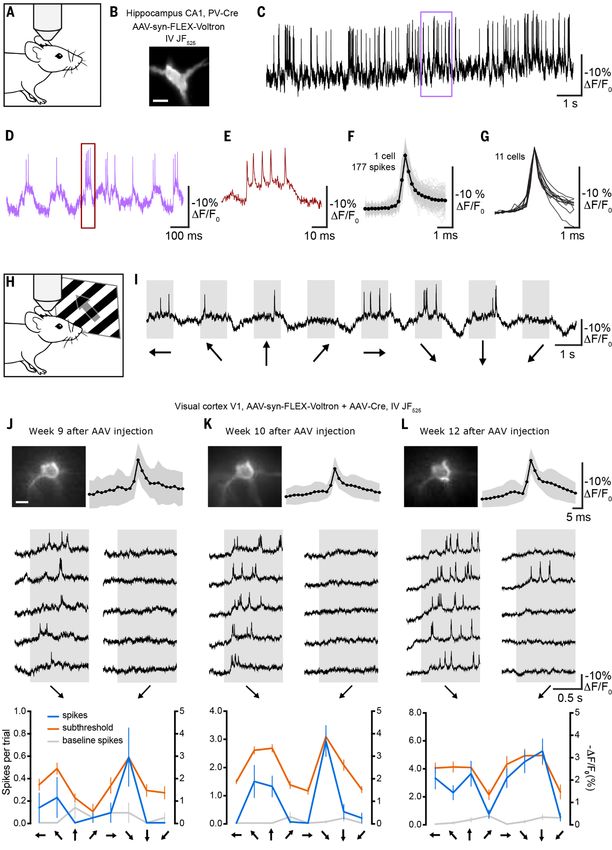
12. A. S. Abdelfattah, S. L. Farhi, Y. Zhao, D. Brinks, P. Zou, A. Ruangkittisakul, J.            S. A. Sorensen, T. Dolbeare, D. Bertagnolli, J. Goldy, N. Shapovalova, S. Parry, C.
    Platisa, V. A. Pieribone, K. Ballanyi, A. E. Cohen, R. E. Campbell, A Bright and Fast         Lee, K. Smith, A. Bernard, L. Madisen, S. M. Sunkin, M. Hawrylycz, C. Koch, H.
    Red Fluorescent Protein Voltage Indicator That Reports Neuronal Activity in                   Zeng, Adult mouse cortical cell taxonomy revealed by single cell transcriptomics.
    Organotypic Brain Slices. J. Neurosci. 36, 2458–2472 (2016).                                  Nat. Neurosci. 19, 335–346 (2016). doi:10.1038/nn.4216 Medline
    doi:10.1523/JNEUROSCI.3484-15.2016 Medline                                                28. M. B. Ahrens, J. M. Li, M. B. Orger, D. N. Robson, A. F. Schier, F. Engert, R.
13. H. H. H. Yang, F. St-Pierre, X. Sun, X. Ding, M. Z. Lin, T. R. Clandinin, Subcellular         Portugues, Brain-wide neuronal dynamics during motor adaptation in zebrafish.
    Imaging of Voltage and Calcium Signals Reveals Neural Processing In Vivo. Cell                Nature 485, 471–477 (2012). doi:10.1038/nature11057 Medline
    166, 245–257 (2016). doi:10.1016/j.cell.2016.05.031 Medline                               29. T. Hige, Y. Aso, G. M. Rubin, G. C. Turner, Plasticity-driven individualization of
14. J. B. Grimm, B. P. English, J. Chen, J. P. Slaughter, Z. Zhang, A. Revyakin, R. Patel,        olfactory coding in mushroom body output neurons. Nature 526, 258–262
    J. J. Macklin, D. Normanno, R. H. Singer, T. Lionnet, L. D. Lavis, A general method           (2015). doi:10.1038/nature15396 Medline
    to improve fluorophores for live-cell and single-molecule microscopy. Nat.                30. A. Wang, J. Feng, Y. Li, P. Zou, Beyond fluorescent proteins: Hybrid and
    Methods 12, 244–250 (2015). doi:10.1038/nmeth.3256 Medline                                    bioluminescent indicators for imaging neural activities. ACS Chem. Neurosci. 9,
15. G. V. Los, L. P. Encell, M. G. McDougall, D. D. Hartzell, N. Karassina, C. Zimprich,          639–650 (2018). doi:10.1021/acschemneuro.7b00455 Medline
    M. G. Wood, R. Learish, R. F. Ohana, M. Urh, D. Simpson, J. Mendez, K.                    31. L. A. Gross, G. S. Baird, R. C. Hoffman, K. K. Baldridge, R. Y. Tsien, The structure
    Zimmerman, P. Otto, G. Vidugiris, J. Zhu, A. Darzins, D. H. Klaubert, R. F. Bulleit,          of the chromophore within DsRed, a red fluorescent protein from coral. Proc.
    K. V. Wood, HaloTag: A novel protein labeling technology for cell imaging and                 Natl. Acad. Sci. U.S.A. 97, 11990–11995 (2000). doi:10.1073/pnas.97.22.11990
    protein analysis. ACS Chem. Biol. 3, 373–382 (2008). doi:10.1021/cb800025k                    Medline
    Medline

                                                                                                                                                                                               Downloaded from http://science.sciencemag.org/ on August 1, 2019
                                                                                              32. N. C. Shaner, P. A. Steinbach, R. Y. Tsien, A guide to choosing fluorescent
16. L. P. Encell, R. Friedman Ohana, K. Zimmerman, P. Otto, G. Vidugiris, M. G. Wood,             proteins. Nat. Methods 2, 905–909 (2005). doi:10.1038/nmeth819 Medline
    G. V. Los, M. G. McDougall, C. Zimprich, N. Karassina, R. D. Learish, R. Hurst, J.
    Hartnett, S. Wheeler, P. Stecha, J. English, K. Zhao, J. Mendez, H. A. Benink, N.         33. D. Wüstner, T. Christensen, L. M. Solanko, D. Sage, Photobleaching kinetics and
    Murphy, D. L. Daniels, M. R. Slater, M. Urh, A. Darzins, D. H. Klaubert, R. F. Bulleit,       time-integrated emission of fluorescent probes in cellular membranes.
    K. V. Wood, Development of a dehalogenase-based protein fusion tag capable of                 Molecules 19, 11096–11130 (2014). doi:10.3390/molecules190811096 Medline
    rapid, selective and covalent attachment to customizable ligands. Curr. Chem.             34. J. R. Lakowicz, Principles of Fluorescence Spectroscopy (Springer, 2006).
    Genomics 6, 55–71 (2012). doi:10.2174/1875397301206010055 Medline                         35. S. J. Lord, N. R. Conley, H. L. Lee, S. Y. Nishimura, A. K. Pomerantz, K. A. Willets,
17. J. B. Grimm, A. K. Muthusamy, Y. Liang, T. A. Brown, W. C. Lemon, R. Patel, R. Lu,            Z. Lu, H. Wang, N. Liu, R. Samuel, R. Weber, A. Semyonov, M. He, R. J. Twieg, W.
     J. J. Macklin, P. J. Keller, N. Ji, L. D. Lavis, A general method to fine-tune               E. Moerner, DCDHF fluorophores for single-molecule imaging in cells.
     fluorophores for live-cell and in vivo imaging. Nat. Methods 14, 987–994 (2017).             ChemPhysChem 10, 55–65 (2009). doi:10.1002/cphc.200800581 Medline
     doi:10.1038/nmeth.4403 Medline                                                           36. C. Eggeling, A. Volkmer, C. A. M. Seidel, Molecular photobleaching kinetics of
18. Y. Gong, M. J. Wagner, J. Zhong Li, M. J. Schnitzer, Imaging neural spiking in brain          Rhodamine 6G by one- and two-photon induced confocal fluorescence
    tissue using FRET-opsin protein voltage sensors. Nat. Commun. 5, 3674 (2014).                 microscopy. ChemPhysChem 6, 791–804 (2005).
    doi:10.1038/ncomms4674 Medline                                                                doi:10.1002/cphc.200400509 Medline
19. J. M. Kralj, D. R. Hochbaum, A. D. Douglass, A. E. Cohen, Electrical spiking in           37. T. J. Wardill, T.-W. Chen, E. R. Schreiter, J. P. Hasseman, G. Tsegaye, B. F.
    Escherichia coli probed with a fluorescent voltage-indicating protein. Science                Fosque, R. Behnam, B. C. Shields, M. Ramirez, B. E. Kimmel, R. A. Kerr, V.
    333, 345–348 (2011). doi:10.1126/science.1204763 Medline                                      Jayaraman, L. L. Looger, K. Svoboda, D. S. Kim, A neuron-based screening
20. T. Wada, K. Shimono, T. Kikukawa, M. Hato, N. Shinya, S. Y. Kim, T. Kimura-                   platform for optimizing genetically-encoded calcium indicators. PLOS ONE 8,
    Someya, M. Shirouzu, J. Tamogami, S. Miyauchi, K.-H. Jung, N. Kamo, S.                        e77728 (2013). doi:10.1371/journal.pone.0077728 Medline
    Yokoyama, Crystal structure of the eukaryotic light-driven proton-pumping                 38. S. Hippenmeyer, E. Vrieseling, M. Sigrist, T. Portmann, C. Laengle, D. R. Ladle, S.
    rhodopsin, Acetabularia rhodopsin II, from marine alga. J. Mol. Biol. 411, 986–               Arber, A developmental switch in the response of DRG neurons to ETS
    998 (2011). doi:10.1016/j.jmb.2011.06.028 Medline                                             transcription factor signaling. PLOS Biol. 3, e159 (2005).
21. A. Keppler, S. Gendreizig, T. Gronemeyer, H. Pick, H. Vogel, K. Johnsson, A                   doi:10.1371/journal.pbio.0030159 Medline
    general method for the covalent labeling of fusion proteins with small molecules          39. H. Taniguchi, M. He, P. Wu, S. Kim, R. Paik, K. Sugino, D. Kvitsiani, Y. Fu, J. Lu, Y.
    in vivo. Nat. Biotechnol. 21, 86–89 (2003). doi:10.1038/nbt765 Medline                        Lin, G. Miyoshi, Y. Shima, G. Fishell, S. B. Nelson, Z. J. Huang, A resource of Cre
22. S. Chamberland, H. H. Yang, M. M. Pan, S. W. Evans, S. Guan, M. Chavarha, Y.                  driver lines for genetic targeting of GABAergic neurons in cerebral cortex.
    Yang, C. Salesse, H. Wu, J. C. Wu, T. R. Clandinin, K. Toth, M. Z. Lin, F. St-Pierre,         Neuron 71, 995–1013 (2011). doi:10.1016/j.neuron.2011.07.026 Medline
    Fast two-photon imaging of subcellular voltage dynamics in neuronal tissue with           40. S. C. Seeman, L. Campagnola, P. A. Davoudian, A. Hoggarth, T. A. Hage, A.
    genetically encoded indicators. eLife 6, e25690 (2017). doi:10.7554/eLife.25690               Bosma-Moody, C. A. Baker, J. H. Lee, S. Mihalas, C. Teeter, A. L. Ko, J. G.
    Medline                                                                                       Ojemann, R. P. Gwinn, D. L. Silbergeld, C. Cobbs, J. Phillips, E. Lein, G. Murphy, C.
23. D. Brinks, A. J. Klein, A. E. Cohen, Two-Photon Lifetime Imaging of Voltage                   Koch, H. Zeng, T. Jarsky, Sparse recurrent excitatory connectivity in the
    Indicating Proteins as a Probe of Absolute Membrane Voltage. Biophys. J. 109,                 microcircuit of the adult mouse and human cortex. eLife 7, e37349 (2018).
    914–921 (2015). doi:10.1016/j.bpj.2015.07.038 Medline                                         doi:10.7554/eLife.37349 Medline

24. C. A. Baker, Y. M. Elyada, A. Parra, M. M. L. Bolton, Cellular resolution circuit         41. L. Campagnola, M. B. Kratz, P. B. Manis, ACQ4: An open-source software
    mapping with temporal-focused excitation of soma-targeted channelrhodopsin.                   platform for data acquisition and analysis in neurophysiology research. Front.
    eLife 5, e14193 (2016). doi:10.7554/eLife.14193 Medline                                       Neuroinform. 8, 3 (2014). doi:10.3389/fninf.2014.00003 Medline

25. S. T. Lim, D. E. Antonucci, R. H. Scannevin, J. S. Trimmer, A novel targeting signal      42. D. A. Dombeck, C. D. Harvey, L. Tian, L. L. Looger, D. W. Tank, Functional imaging
    for proximal clustering of the Kv2.1 K+ channel in hippocampal neurons. Neuron                of hippocampal place cells at cellular resolution during virtual navigation. Nat.
    25, 385–397 (2000). doi:10.1016/S0896-6273(00)80902-2 Medline                                 Neurosci. 13, 1433–1440 (2010). doi:10.1038/nn.2648 Medline

26. S. L. Smith, I. T. Smith, T. Branco, M. Häusser, Dendritic spikes enhance stimulus        43. T. Yardeni, M. Eckhaus, H. D. Morris, M. Huizing, S. Hoogstraten-Miller, Retro-
    selectivity in cortical neurons in vivo. Nature 503, 115–120 (2013).                          orbital injections in mice. Lab. Anim. 40, 155–160 (2011).
    doi:10.1038/nature12600 Medline                                                               doi:10.1038/laban0511-155 Medline

27. B. Tasic, V. Menon, T. N. Nguyen, T. K. Kim, T. Jarsky, Z. Yao, B. Levi, L. T. Gray,      44. P. Thévenaz, U. E. Ruttimann, M. Unser, A pyramid approach to subpixel

First release: 1 August 2019                                                  www.sciencemag.org                 (Page numbers not final at time of first release)                         4
registration based on intensity. IEEE Trans. Image Process. 7, 27–41 (1998). 61. O. Randlett, C. L. Wee, E. A. Naumann, O. Nnaemeka, D. Schoppik, J. E.
doi:10.1109/83.650848 Medline Fitzgerald, R. Portugues, A. M. B. Lacoste, C. Riegler, F. Engert, A. F. Schier,
45. T. W. Margrie, A. H. Meyer, A. Caputi, H. Monyer, M. T. Hasan, A. T. Schaefer, W. Whole-brain activity mapping onto a zebrafish brain atlas. Nat. Methods 12,
Denk, M. Brecht, Targeted whole-cell recordings in the mammalian brain in vivo. 1039–1046 (2015). doi:10.1038/nmeth.3581 Medline
Neuron 39, 911–918 (2003). doi:10.1016/j.neuron.2003.08.012 Medline 62. B. A. Wilt, J. E. Fitzgerald, M. J. Schnitzer, Photon shot noise limits on optical
46. F. Franke, R. Quian Quiroga, A. Hierlemann, K. Obermayer, Bayes optimal detection of neuronal spikes and estimation of spike timing. Biophys. J. 104, 51–
template matching for spike sorting - combining fisher discriminant analysis with 62 (2013). doi:10.1016/j.bpj.2012.07.058 Medline
optimal filtering. J. Comput. Neurosci. 38, 439–459 (2015). doi:10.1007/s10827-
015-0547-7 Medline
ACKNOWLEDGMENTS
47. R. W. Köster, S. E. Fraser, Tracing transgene expression in living zebrafish We acknowledge the Janelia Vivarium, Cell Culture, Instrument Design and
embryos. Dev. Biol. 233, 329–346 (2001). doi:10.1006/dbio.2001.0242 Medline Fabrication, Imaging, Molecular Biology, and, Virus Production facilities for
48. R. M. White, A. Sessa, C. Burke, T. Bowman, J. LeBlanc, C. Ceol, C. Bourque, M. assistance. Specifically, we would like to thank Brenda Shields, Deepika Walpita, Jim
Dovey, W. Goessling, C. E. Burns, L. I. Zon, Transparent adult zebrafish as a tool Cox, Chelsea McGlynn, Damien Alcor, Aaron Taylor, Jared Rouchard, Kim Ritola,
for in vivo transplantation analysis. Cell Stem Cell 2, 183–189 (2008). Xiaorong Zhang and Jordan Towne. We thank Ziqiang Wei for discussions on data
doi:10.1016/j.stem.2007.11.002 Medline analysis. Funding: The Howard Hughes Medical Institute (A.S.A., T.K., A.S., O.N.,
49. K. Kawakami, H. Takeda, N. Kawakami, M. Kobayashi, N. Matsuda, M. Mishina, A H.L., Y.S., J.Y., J.Z., J.B.G., R.P., B.D.M., J.J.M., K.P., G.C.T., Z.L., M.K., K.S., M.B.A.,
transposon-mediated gene trap approach identifies developmentally regulated L.D.L., E.R.S.), Simons Collaboration on the Global Brain Research Awards 325171
Downloaded from http://science.sciencemag.org/ on August 1, 2019
genes in zebrafish. Dev. Cell 7, 133–144 (2004). (M.B.A., L.P.) and 542943SPI (M.B.A., L.P.), IARPA MICRONS D16PC00003 (L.P.),
doi:10.1016/j.devcel.2004.06.005 Medline NIH R01EB22913 (L.P.), Taiwan Ministry of Science and Technology MOST106-2628-
B-010-004, MOST105-2628-B-010-005, MOST106-2320-B-010-012 and Taiwan
50. C. Satou, Y. Kimura, H. Hirata, M. L. Suster, K. Kawakami, S. Higashijima, National Health Research Institute NHRI-ex-107-10509NC (T-W.C., B-J.L.), and the
Transgenic tools to characterize neuronal properties of discrete populations of Allen Institute for Brain Science (L.C., S.C.S., G.J.M.). Author contributions: A.S.A.,
zebrafish neurons. Development 140, 3927–3931 (2013). L.D.L., and E.R.S. conceived the project. A.S.A. engineered Voltron. A.S.A., H.L., J.Z.,
doi:10.1242/dev.099531 Medline J.B.G., R.P., J.J.M., Z.L., L.D.L, and E.R.S. performed and analyzed in vitro
51. T. Kawashima, M. F. Zwart, C.-T. Yang, B. D. Mensh, M. B. Ahrens, The experiments. T.K., J.F., L.P., M.K., and M.B.A. performed and analyzed experiments
Serotonergic System Tracks the Outcomes of Actions to Mediate Short-Term in larval zebrafish. A.S., O.N., Y-C.H., L.C., S.C.S., J.Y., G.J.M., K.P., B-J.L., T-W.C.,
Motor Learning. Cell 167, 933–946.e20 (2016). doi:10.1016/j.cell.2016.09.055 and K.S. performed and analyzed experiments in mouse. Y.S. and G.C.T. performed
Medline and analyzed experiments in Drosophila. L.P., J.J.M., G.J.M., K.P., B-J.L., T-W.C.,
52. N. Vladimirov, Y. Mu, T. Kawashima, D. V. Bennett, C.-T. Yang, L. L. Looger, P. J. G.C.T., Z.L., M.K., K.S., M.B.A., L.D.L., and E.R.S. supervised various aspects of this
Keller, J. Freeman, M. B. Ahrens, Light-sheet functional imaging in fictively work. A.S.A. and E.R.S. wrote the manuscript with input and assistance from B.D.M.
behaving zebrafish. Nat. Methods 11, 883–884 (2014). doi:10.1038/nmeth.3040 and all other authors. Competing interests: A.S.A, L.D.L. and E.R.S. have filed for a
Medline patent on chemigenetic voltage indicators. Data and materials availability: All data
are available in the manuscript or the supplementary material. Plasmids and AAVs
53. B. K. Andrásfalvy, G. L. Galiñanes, D. Huber, M. Barbic, J. J. Macklin, K. Susumu,
are available from Addgene (https://www.addgene.org), transgenic Drosophila
J. B. Delehanty, A. L. Huston, J. K. Makara, I. L. Medintz, Quantum dot-based
stocks are available from the Bloomington Drosophila Stock Center
multiphoton fluorescent pipettes for targeted neuronal electrophysiology. Nat.
(https://bdsc.indiana.edu), and transgenic zebrafish are available from the
Methods 11, 1237–1241 (2014). doi:10.1038/nmeth.3146 Medline
Zebrafish International Resource Center (https://zebrafish.org/). J.B.G. and L.D.L.
54. Y.-K. Bae, S. Kani, T. Shimizu, K. Tanabe, H. Nojima, Y. Kimura, S. Higashijima, M. are inventors on U.S. Patent Nos. 9,933,417, 10,018,624, and 10,161,932 as well as
Hibi, Anatomy of zebrafish cerebellum and screen for mutations affecting its U.S. Patent Application No. 16/211,388 held/submitted by the Howard Hughes
development. Dev. Biol. 330, 406–426 (2009). doi:10.1016/j.ydbio.2009.04.013 Medical institute; these cover azetidine-containing fluorophores such as JF525. A.A.,
Medline L.D.L., and E.R.S. are inventors on patent application WO2018102577A1 submitted
55. M. Takeuchi, K. Matsuda, S. Yamaguchi, K. Asakawa, N. Miyasaka, P. Lal, Y. by HHMI that covers chemigenetic voltage indicators. DNA plasmids and AAVs,
Yoshihara, A. Koga, K. Kawakami, T. Shimizu, M. Hibi, Establishment of Gal4 transgenic zebrafish, and transgenic flies described in this manuscript are available
transgenic zebrafish lines for analysis of development of cerebellar neural from Addgene, ZIRC, and the Bloomington Drosophila Stock Center, respectively,
circuitry. Dev. Biol. 397, 1–17 (2015). doi:10.1016/j.ydbio.2014.09.030 Medline under a material agreement with HHMI.
56. M. Guizar-Sicairos, S. T. Thurman, J. R. Fienup, Efficient subpixel image
registration algorithms. Opt. Lett. 33, 156–158 (2008).
doi:10.1364/OL.33.000156 Medline SUPPLEMENTARY MATERIALS
science.sciencemag.org/cgi/content/full/science.aav6416/DC1
57. Y. Aso, D. Hattori, Y. Yu, R. M. Johnston, N. A. Iyer, T.-T. B. Ngo, H. Dionne, L. F.
Materials and Methods
Abbott, R. Axel, H. Tanimoto, G. M. Rubin, The neuronal architecture of the
Tables S1 to S5
mushroom body provides a logic for associative learning. eLife 3, e04577 (2014).
Figs. S1 to S45
doi:10.7554/eLife.04577 Medline
References (31–62)
58. M. Murthy, G. Turner, Dissection of the head cuticle and sheath of living flies for
whole-cell patch-clamp recordings in the brain. Cold Spring Harb. Protoc. 2013, 5 October 2018; accepted 17 July 2019
134–139 (2013). Medline Published online 1 August 2019
59. R. I. Wilson, G. C. Turner, G. Laurent, Transformation of olfactory representations 10.1126/science.aav6416
in the Drosophila antennal lobe. Science 303, 366–370 (2004).
doi:10.1126/science.1090782 Medline
60. F. St-Pierre, J. D. Marshall, Y. Yang, Y. Gong, M. J. Schnitzer, M. Z. Lin, High-
fidelity optical reporting of neuronal electrical activity with an ultrafast
fluorescent voltage sensor. Nat. Neurosci. 17, 884–889 (2014).
doi:10.1038/nn.3709 Medline
First release: 1 August 2019 www.sciencemag.org (Page numbers not final at time of first release) 5Downloaded from http://science.sciencemag.org/ on August 1, 2019 First release: 1 August 2019 www.sciencemag.org (Page numbers not final at time of first release) 6
Fig. 1 (preceding page). Development of the chemigenetic voltage indicator Voltron. (A) Schematic of Voltron
 sequence: A rhodopsin (Ace2) is fused to a self-labeling tag domain (HaloTag) with additional sequences added to
 improve or localize membrane targeting: endoplasmic reticulum export sequence (ER), Golgi export trafficking
 sequence (TS), and somatic targeting sequence (ST). (B) Model of Voltron mechanism. (C) Left panel: cultured rat
 hippocampal neuron expressing Voltron and labeled with JF525. Scale bar: 20 μm. Right panel: single-trial recording of
 action potentials and subthreshold voltage signals from current injections in primary neuron culture using 400 Hz
 imaging (top, fluorescence) or electrophysiology (bottom, membrane potential). (D) Fluorescence emission spectra
 of different JF dyes overlaid with the absorbance spectrum of Ace2N. (E) Fluorescence change as a function of
 membrane voltage with different JF dye-Voltron conjugates. (F) Relative fluorescence of ASAP2f, Ace2N-mNeon,
 Voltron525 and Voltron549 in cultured neurons (n = 70, 68, 48 and 62 measurements from five independent
 transfections for each construct). Illumination intensity ~10 mW/mm2 at imaging plane. ***P < 0.001, one-way
 analysis of variance (ANOVA) followed by Bonferroni’s test on each pair. Fluorescence was normalized to ASAP2f
 mean intensity. (G) Relative single molecule brightness of Ace2N-mNeon and Voltron549. ***P < 0.001, two-tailed
 Student's t-test. (H) Bleaching curves for ASAP2f, Ace2N-mNeon, Voltron525, and Voltron549 in primary neuron
 culture. Illumination intensity ~23 mW/mm2 at imaging plane. Bleaching curves were normalized to mean cellular

                                                                                                                                    Downloaded from http://science.sciencemag.org/ on August 1, 2019
 fluorescence from (F) or normalized to the zero-time value (inset). (I) Mean time to bleach of Ace2N-mNeon and
 Voltron549 during single-molecule imaging, 100 ms frames. ***P < 0.001, two-tailed Student's t-test. (J and K)
 Simultaneous in vivo Voltron imaging (300 and 800 Hz, top) and electrophysiology (bottom) in larval zebrafish
 (extracellular) and adult Drosophila (whole-cell), respectively. Spike-triggered averages are shown to the right.

 Fig. 2 (next page). Membrane voltage dynamics in hippocampal parvalbumin (PV) neurons and visual cortex
 pyramidal neurons of mice using Voltron. (A) Schematic of imaging of spontaneous activity in the CA1 region of
 the hippocampus of an awake mouse. (B) Image of hippocampal parvalbumin neuron expressing Voltron labeled with
 JF525. (C to E) Voltron525 raw DF/F0 traces showing spontaneous spikes of a PV neuron (B) located at a depth of 60
 µm in hippocampal CA1 region of a fully awake mouse imaged at 3858 frames per second. Boxes indicate intervals
 shown at expanded time scales. Scale bar: 20 µm. (F) Overlay of 177 spikes detected during a 15 s period (gray) and
 their average (black). (G) Spike shape of 11 PV neurons. (H) Schematic of imaging of primary visual cortex of an
 anesthetized mouse during display of drifting grating visual stimuli. (I) Example trace showing 500 Hz Voltron
 fluorescence during one trial of a sequence of visual stimuli. Arrows below represent the direction of movement of
 the drifting grating. (J to L) Top left, images of a pyramidal cell at a depth of 148 µm, imaged three times over a
 period of four weeks on the indicated weeks after virus injection. Scale bar: 10 µm. Top right, average of all spikes in
 session (black) and standard deviation (grey). Middle, raw ∆F/F0 trace for five repetitions in each session, showing
 two orthogonal orientations (indicated with arrows below) from the neuron pictured on the top left. Bottom,
 orientation tuning to full-frame drifting gratings of the neuron pictured on the top left, displayed from number of
 spikes during trials (blue), number of spikes during preceding intertrial intervals (grey), and subthreshold ∆F/F0
 (right y-axis) after low-pass filtering traces using a 10-point median filter. For each orientation, response is calculated
 by averaging the low-pass filtered trace between 100 – 400 ms after trial onset, and baseline is calculated by
 averaging the low pass filtered trace from 80 ms preceding trial onset to 20 ms after trial onset. Displayed as
 response minus baseline. Error bars represent standard error of the mean (s.e.m.) (20 - 22 repetitions per session).

First release: 1 August 2019                        www.sciencemag.org      (Page numbers not final at time of first release)   7
Downloaded from http://science.sciencemag.org/ on August 1, 2019 First release: 1 August 2019 www.sciencemag.org (Page numbers not final at time of first release) 8
Downloaded from http://science.sciencemag.org/ on August 1, 2019

First release: 1 August 2019   www.sciencemag.org   (Page numbers not final at time of first release)   9
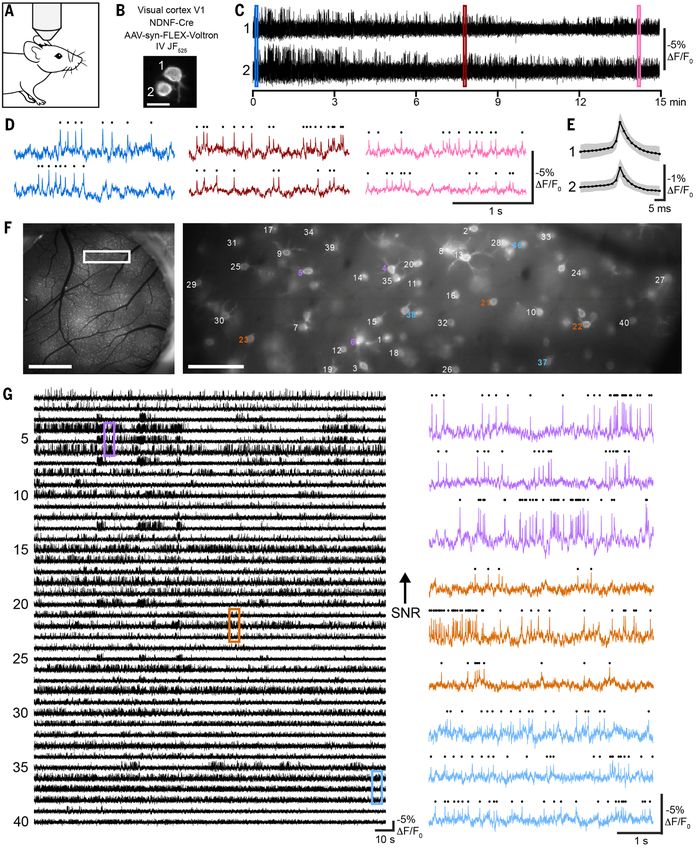
Fig. 3 (preceding page). Long duration and large field-of-view imaging of voltage activity in GABA-ergic
  neurons in mouse neocortex. (A) Schematic of the imaging setup. (B) Image of two neurons expressing ST-
  Voltron525 in layer 1 of visual cortex of an NDNF-Cre mouse. Scale bar: 10 μm. (C) ΔF/F0 traces from neurons in (B),
  recorded over 15 min at 400 Hz. (D) Color-coded zooms of indicated regions of the traces in (C) with detected
  action potentials indicated by black dots above the fluorescence traces. (E) Average of all spikes in session (black)
  and standard deviation (grey). (F) Left panel: Fluorescence image of a cranial window over primary visual cortex
  (V1) in an NDNF-Cre mouse showing Cre-dependent expression of ST-Voltron525 (bright spots). Scale bar: 1 mm.
  Right panel: zoomed image of (F) in the area indicated by the white rectangle, with neurons labels corresponding
  to fluorescence traces in (G). Scale bar: 100 μm. (G) Left panel: ΔF/F0 traces during 3 min. recording at 400 Hz
  from neurons pictured in (F), in decreasing order of signal-to-noise ratio. Right panel: zooms of ΔF/F0 traces from
  color-coded regions of (G) with detected action potentials represented as black dots above, illustrating
  representative traces with high (top), medium (middle), and low (bottom) SNR. Traces have been background-
  subtracted, which removes shared subthreshold membrane potential fluctuations (Supplementary Methods;
  Compare vs. fig. S25 without subtraction).

                                                                                                                                 Downloaded from http://science.sciencemag.org/ on August 1, 2019
  Fig. 4 (next page). Voltron reveals millisecond-timescale neural dynamics during swimming behavior in
  zebrafish. (A) Schematic illustration of the setup. An immobilized zebrafish is placed under the light-sheet
  microscope and the motor signals (inset) from its tail are recorded during the imaging session using a pair of
  electrodes. Visual stimuli (forward drifting gratings) for triggering swimming responses are presented below the
  fish. (B) Left panel: anatomical location of the imaged brain region (midbrain nucleus; see fig. S44A). Center, a
  representative field of view of the imaged region expressing Voltron. Scale bar, 20 μm. Right, the position of
  neurons analyzed in (C). (C) Left panel: periods of visual motion (pink) and swim signals (grey) are plotted above
  Voltron fluorescence traces (black) simultaneously recorded from 11 neurons shown in (B). Right panel: zoom of
  swimming signals (top) and Voltron fluorescence traces from two representative neurons (bottom) are expanded
  from the dashed box in the left panel. Dots on the top of each trace represent action potentials recognized by the
  algorithm described in fig. S45, A and B. Downward triangles and dotted gray lines indicate initiation of each swim
  bout. (D) Mean subthreshold signal (top), mean frequency of action potentials (middle) and raster plots of action
  potentials (bottom) near the initiation of swim bouts from three representative neurons: “Off” (green), “Onset”
  (red) and “Late” (blue) neuron. Shadows in the top and middle panels represent s.e.m. across swim events. (E)
  Classification of recorded neurons by their mean subthreshold signals near the initiation of swim bouts. 179
  neurons recorded from 43 fish were classified using nonnegative matrix factorization and colored according to the
  weights for three factors: “onset” (red), “off” (green) and “late” (blue). The details of this classification are
  described in the Methods. (F) Spatial organization of the same population of neurons as in (E). Neurons from
  multiple fish are superimposed to a single map based on the distance from the center of this midbrain nucleus. (G)
  Hypothetical model of neural activity modulation in this midbrain nucleus.

First release: 1 August 2019                       www.sciencemag.org     (Page numbers not final at time of first release) 10
Downloaded from http://science.sciencemag.org/ on August 1, 2019 First release: 1 August 2019 www.sciencemag.org (Page numbers not final at time of first release) 11
Bright and photostable chemigenetic indicators for extended in vivo voltage imaging
Ahmed S. Abdelfattah, Takashi Kawashima, Amrita Singh, Ondrej Novak, Hui Liu, Yichun Shuai, Yi-Chieh Huang, Luke
Campagnola, Stephanie C. Seeman, Jianing Yu, Jihong Zheng, Jonathan B. Grimm, Ronak Patel, Johannes Friedrich, Brett D.
Mensh, Liam Paninski, John J. Macklin, Gabe J. Murphy, Kaspar Podgorski, Bei-Jung Lin, Tsai-Wen Chen, Glenn C. Turner, Zhe
Liu, Minoru Koyama, Karel Svoboda, Misha B. Ahrens, Luke D. Lavis and Eric R. Schreiter

published online August 1, 2019

                                                                                                                             Downloaded from http://science.sciencemag.org/ on August 1, 2019
  ARTICLE TOOLS                   http://science.sciencemag.org/content/early/2019/07/31/science.aav6416

  SUPPLEMENTARY                   http://science.sciencemag.org/content/suppl/2019/07/31/science.aav6416.DC1
  MATERIALS

  REFERENCES                      This article cites 61 articles, 7 of which you can access for free
                                  http://science.sciencemag.org/content/early/2019/07/31/science.aav6416#BIBL

  PERMISSIONS                     http://www.sciencemag.org/help/reprints-and-permissions

Use of this article is subject to the Terms of Service

Science (print ISSN 0036-8075; online ISSN 1095-9203) is published by the American Association for the Advancement of
Science, 1200 New York Avenue NW, Washington, DC 20005. 2017 © The Authors, some rights reserved; exclusive licensee
American Association for the Advancement of Science. No claim to original U.S. Government Works. The title Science is a
registered trademark of AAAS.
You can also read