Contrasting Responses of Rhizosphere Bacterial, Fungal, Protist, and Nematode Communities to Nitrogen Fertilization and Crop Genotype in Field ...
←
→
Page content transcription
If your browser does not render page correctly, please read the page content below
ORIGINAL RESEARCH
                                                                                                                                               published: 08 April 2021
                                                                                                                                       doi: 10.3389/fsufs.2021.613269

                                            Contrasting Responses of
                                            Rhizosphere Bacterial, Fungal,
                                            Protist, and Nematode Communities
                                            to Nitrogen Fertilization and Crop
                                            Genotype in Field Grown Oilseed
                                            Rape (Brassica napus)
                                            Emma Picot 1 , Chris C. Hale 1 , Sally Hilton 1 , Graham Teakle 1 , Hendrik Schäfer 1 ,
                                            Yong-Ju Huang 2 , Sarah Perryman 3 , Jon S. West 3 and Gary D. Bending 1*
                                            1
                                             School of Life Sciences, University of Warwick, Coventry, United Kingdom, 2 School of Life and Medical Sciences, University
                                            of Hertfordshire, Hatfield, United Kingdom, 3 Rothamsted Research, Harpenden, United Kingdom
                             Edited by:
                     Adam C. N. Wong,
    University of Florida, United States    The rhizosphere microbiome is considered to play a key role in determining crop health.
                        Reviewed by:        However, current understanding of the factors which shape assembly and composition
                     Blanca B. Landa,       of the microbiome is heavily biased toward bacterial communities, and the relevance for
            Spanish National Research
                         Council, Spain
                                            other microbial groups is unclear. Furthermore, community assembly is determined by
                             Wu Xiong,      a variety of factors, including host genotype, environment and agricultural management
        Utrecht University, Netherlands     practices, and their relative importance and interactions remain to be elucidated. We
                  *Correspondence:          investigated the impact of nitrogen fertilization on rhizosphere bacterial, fungal, nematode
                      Gary D. Bending
          gary.bending@warwick.ac.uk        and protist communities of 10 contrasting oilseed rape genotypes in a field experiment.
                                            We found significant differences in the composition of bacteria, fungi, protist and
                     Specialty section:     nematode communities between the rhizosphere and bulk soil. Nitrogen application had
           This article was submitted to
Agroecology and Ecosystem Services,         a significant but weak effect on fungal, bacterial, and protist community composition,
                 a section of the journal   and this was associated with increased relative abundance of a complex of fungal
Frontiers in Sustainable Food Systems
                                            pathogens in the rhizosphere and soil, including Mycosphaerella sp. and Leptosphaeria
          Received: 01 October 2020
                                            sp. Network analysis showed that nitrogen application had different effects on microbial
           Accepted: 04 March 2021
            Published: 08 April 2021        community connectivity in the soil and rhizosphere. Crop genotype significantly affected
                               Citation:    fungal community composition, with evidence for a degree of genotype specificity for a
 Picot E, Hale CC, Hilton S, Teakle G,      number of pathogens, including L. maculans, Alternaria sp., Pyrenopeziza brassicae,
  Schäfer H, Huang Y-J, Perryman S,
     West JS and Bending GD (2021)
                                            Olpidium brassicae, and L. biglobosa, and also potentially beneficial Heliotales root
             Contrasting Responses of       endophytes. Crop genotype had no significant effect on assembly of bacteria, protist
Rhizosphere Bacterial, Fungal, Protist,
                                            or nematode communities. There was no relationship between genetic distance of crop
       and Nematode Communities to
        Nitrogen Fertilization and Crop     genotypes and the extent of dissimilarity of rhizosphere microbial communities. Field
     Genotype in Field Grown Oilseed        disease assessment confirmed infection of crops by Leptosphaeria sp., P. brassicae,
               Rape (Brassica napus).
 Front. Sustain. Food Syst. 5:613269.
                                            and Alternaria sp., indicating that rhizosphere microbiome sequencing was an effective
     doi: 10.3389/fsufs.2021.613269         indicator of plant health. We conclude that under field conditions soil and rhizosphere

Frontiers in Sustainable Food Systems | www.frontiersin.org                        1                                              April 2021 | Volume 5 | Article 613269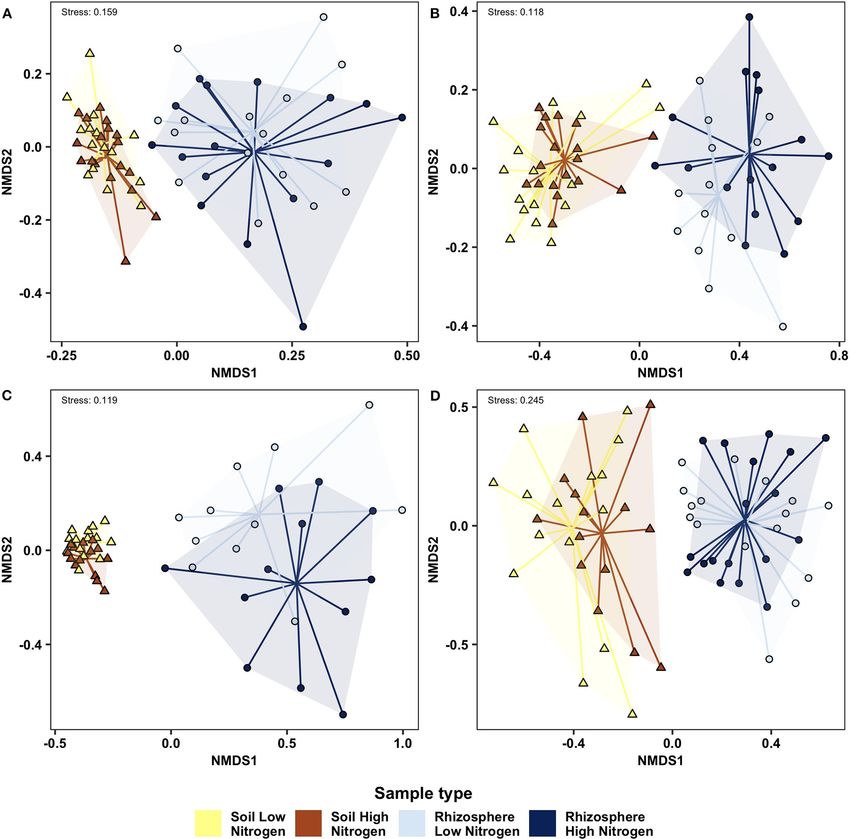
Picot et al.                                                                                            Rhizosphere Microbiome, Nitrogen, and Crop Genotype

                                            nutrient stoichiometry and crop genotype are key factors determining crop health by
                                            influencing the infection of roots by pathogenic and mutualistic fungal communities, and
                                            the connectivity and stability of rhizosphere microbiome interaction networks.

                                            Keywords: rhizosphere, crop genotype, nitrogen, protist, nematode, fungi, pathogens, interaction networks

INTRODUCTION                                                                      eukaryotes. Fungi, protists, and nematodes can all directly
                                                                                  affect plant health through pathogenic and parasitic interactions
Plant roots live in intimate association with diverse microbial                   (Hunter et al., 2014), while arbuscular fungi are among the
communities which can have major impacts on their health,                         best documented beneficial symbionts (Gosling et al., 2006).
growth, and productivity. Plants secrete up to 20% of the carbon                  Furthermore, grazing by protists is postulated to play a major
they fix into the soil as exudates, particularly in the form of                   role in determining the structure of both bacterial and fungal
sugars and organic acids, and this drives the selective growth                    communities in the rhizosphere (Gao et al., 2019).
of microbes in the soil immediately adjacent to roots, and the                        Microbiome assembly under field conditions is under the
recruitment of microbes onto the root surface and within the                      influence of a wide range of variables including fertilizer and
root itself (Morgan et al., 2005). The microbiota residing in roots               fungicide application, and the role of genotype in determining
and the soil surrounding the roots constitutes the rhizosphere                    microbiome composition, relative to other factors needs to be
microbiome, which can influence the plant through diverse direct                  understood if it is to be utilized as an effective crop management
and indirect interaction pathways (Hunter et al., 2014; Hilton                    tool (Rathore et al., 2017). For example, evidence from long
et al., 2021).                                                                    term field experiments suggests that fertilization may exert a
    Root symbionts such as arbuscular fungi have potential                        greater impact on the rhizosphere bacterial community than
to provide their host with access to nutrients and water in                       plant species (Semenov et al., 2020).
exchange for carbon, while pathogens within the root zone can                         Globally, oilseed rape (OSR) is the third largest source of
cause disease. Additionally, free-living rhizosphere microbes can                 vegetable oil, with 70 million tons produced worldwide each year,
indirectly exert beneficial and detrimental impacts on the plant,                 and is the third most cultivated crop in the UK by area (FAOstat,
e.g., by stimulating or suppressing the growth of pathogens and                   2018; DEFRA: Agriculture in the United Kingdom., 2019). While
symbionts, and through nutrient mobilization-immobilization                       there is considerable understanding of microbiome communities
processes (Morgan et al., 2005). There is considerable interest                   in the brassicaceous model Arabidopsis thaliana, the assembly
in understanding rhizosphere microbiome assembly processes in                     and function of the microbiome of OSR has received little
order to unravel what constitutes a microbiome which benefits                     attention. However, there is evidence for OSR cultivar differences
the host, and the contributors to microbiome dysbiosis, which                     in rhizosphere bacterial community composition (Marschner
results in harm to the host (Tabrett and Horton, 2020; Hilton                     et al., 2007), which persist under field conditions (Taye et al.,
et al., 2021).                                                                    2020), and furthermore, OSR cultivars can show differential
    The composition of the rhizosphere microbiome is                              responses to the fungal pathogen Verticillium longisporum,
determined by complex interactions between the soil, the                          potentially associated with differences in antagonistic endophytic
plant and the environment which determine recruitment of                          bacterial communities (Glaeser et al., 2019).
biota from the soil (Jones et al., 2004). The plant itself plays a                    In this study we investigated the influence of cultivar
major role in selecting rhizosphere microbiota, and microbiome                    and nitrogen fertilizer application on the assembly of the
composition differs between plant species, reflecting quantitative                OSR rhizosphere microbiome. Ten OSR cultivars were grown
and qualitative differences in exudation, plant nutrient and water                in the field with and without conventional application of
uptake dynamics, and root characteristics, such as the presence                   inorganic nitrogen fertilizer, and the diversity, composition and
of root hairs. Effects of the plant on the rhizosphere microbiome                 connectivity of soil and rhizosphere bacteria, fungi, protists and
are further modulated by factors which impact exudation, such                     nematode communities was investigated.
as plant development status, soil nutrient characteristics and
light intensity (Jones et al., 2004; Bulgarelli et al., 2015).
    It is also firmly established that plant intraspecific genetic                MATERIALS AND METHODS
variation can influence microbiome composition. As a result,
there is considerable interest in using breeding to engineer the                  Location, Experimental Design, and
rhizosphere microbiome, harnessing functional traits conducive                    Sampling Procedure
for sustainable agriculture, such as disease suppression and                      The field experiment was conducted at Rothamsted Research,
nutrient mobilization (Hunter et al., 2014). While crop cultivar                  Hertfordshire, UK (51.803896◦ N−0.362505◦ E) on a flinty clay
differences in microbiomes have been noted for a range of                         loam soil (27% clay, pH 7.3, total carbon 2.9% and total nitrogen
field grown crops, including cotton (Wei et al., 2019), oilseed                   (N) 0.24%). Ten different B. napus genotypes [Canard DH13
rape (Taye et al., 2020), soybean (Zhong et al., 2019), and                       (Canard), Couve Nabica DH2 (Couve Nabica), Darmor, Ningyou
wheat (Mahoney et al., 2017), the focus has been on bacterial                     7, Rocket × Lizard DH Line (Rocket), Tapidor, Temple, Victor,
communities with a striking absence of data on microbial                          York, and Yudal; Table 1] were selected to encompass the genetic

Frontiers in Sustainable Food Systems | www.frontiersin.org                   2                                         April 2021 | Volume 5 | Article 613269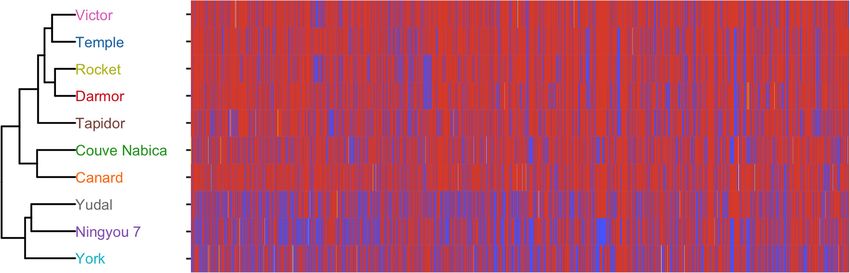
Picot et al.                                                                                                           Rhizosphere Microbiome, Nitrogen, and Crop Genotype

variability available within OSR and its wider breeding material.                                  Technologies, USA) with the broad range DNA assay and diluted
Several genotypes possessed known resistance/susceptibility to                                     to 5 ng µl−1 .
OSR fungal pathogens (Table 1). Each genotype was grown in
four 10 × 3 m plots (60 seeds/m2 ) over the 2013–2014 growing
season, two with the conventional recommended ammonium                                             Genetic Similarity of Brassica Genotypes
nitrate fertilizer rate of ∼210 kg N ha−1 (30 kg N ha−1 applied on                                 A collection of 189 accessions representing the diversity within
17/09/2013, and 174 N ha−1 applied in 05/03/2014), and two with                                    the Brassica napus species gene pool (known as the Brassica
no nitrogen application, and representing high and low nitrogen                                    napus diversity fixed foundation set; BnDFFS) developed by the
treatments, respectively. Crops were drilled on 31/08/2013 and                                     UK Defra-funded Oilseed Rape Genetic Improvement Network
received herbicides and molluscicides according to local best                                      (OREGIN; https://www.herts.ac.uk/oregin/about-oregin) project
agronomic practices. No fungicides were applied.                                                   were genotyped with the Illumina Brassica napus 60 K Infinium
   Soil and rhizosphere samples were collected immediately post-                                   assay (performed by Trait Genetics, Gatersleben, Germany).
flowering on 27/04/2014, during the pod development stage.                                         Single nucleotide polymorphism (SNP) markers were retained
Four plants were dug up equidistant to each other, from 1 m                                        for analysis of the 10 genotypes used in the current study
inside each plot, and pooled to comprise one sample from each                                      where they were polymorphic with a minor allele frequency
plot. Roots were shaken free of loose soil and fine roots were                                     of at least 5%. The vegan package (Oksanen et al., 2018)
cut to ∼5 mm sections. Fine roots together with adhering soil                                      was used to determine Euclidean distance for B. napus SNP
were designated as rhizosphere samples. Bulk soil was collected                                    data. Hierarchical clustering of the Euclidian distance of
adjacent to each plant to a depth of 12 cm, the top 2 cm discarded,                                genotype SNP data was used to determine genetic similarity
and cores combined for each plot before being sieved
Picot et al.                                                                                                     Rhizosphere Microbiome, Nitrogen, and Crop Genotype

  FIGURE 1 | Dendrogram showing relatedness of the 10 Brassica genotypes used in this study based on 60 K single nucleic acid polymorphisms (SNP), and
  associated heatmap showing the SNP at each position. Red indicates presence of major alleles, blue minor alleles. Heterozygous calls are indicated in yellow.

Determination of Microbial Community                                                   (Caporaso et al., 2010) using the Greengenes reference database
Diversity and Structure                                                                for 16S rRNA (McDonald et al., 2012), the Unite database for
PCR amplification was performed on the extracted DNA using                             ITS (Koljalg et al., 2013) and the SILVA and PR2 databases
the 16S rRNA gene primers 515f and 806r to amplify bacterial                           for 18S rRNA (Guillou et al., 2013; Quast et al., 2013). The
sequences (Caporaso et al., 2012), Internal Transcribed Spacer                         16S rRNA OTU table was filtered to remove reads annotated
(ITS) ITS3 and ITS4 primers for fungi (White et al., 1990),                            as chloroplast, eukaryota, archaea, or mitochondria. Sequences
and the 18S rRNA gene primers Euk1391 and EukBr (Amaral-                               from Archaeplastida, fungi, and metazoa were removed from
Zettler et al., 2009; Stoeck et al., 2010) for microbial eukaryotes.                   the 18S rRNA dataset to leave predominantly single-celled
Primers were modified with Illumina Nextera Index Kit v2                               eukaryotes, referred to hereafter as protists. The 18S rRNA
adapters. PCRs were conducted using a Multigene Optimax                                dataset was also used to collect nematode sequences. Samples
thermal cycler (Labnet, USA), in a volume of 25 µl containing                          with below 3,000 reads were discarded. Post filtering, there were
15 ng DNA, Q5 R Hot start High Fidelity 2× Master Mix (New                             4.9 million bacterial reads and 7647 OTUs, 1.3 million fungal
England Biolabs) and 0.5 µM of each primer. Thermocycling                              reads across 961 OTUs, 127 K protist reads and 877 OTUs, and
included an initial denaturation at 98◦ C for 30s followed by 25                       21 K nematode reads across 85 OTUs (Supplementary Table 1).
cycles (16S and 18S rRNA) or 30 cycles (ITS) of 98◦ C for 10s,                         The datasets described in this paper are available in the NCBI
50/57◦ C (for 16S and 18S rRNA/ITS, respectively) for 15s and                          sequence read archive under BioProject ID PRJNA666392. The
72◦ C for 20s. The final extension was at 72◦ C for 5 min. PCR                         sequences of OTUs highlighted in this study are deposited in the
products were purified using the AMPure XP beads (Beckman                              NCBI GenBank database under accession numbers MW051022-
Coulter, Germany) according to the manufacturer’s instructions                         MW051025 (protists) and MW051900-MW051914 (fungi).
and the DNA concentrations were measured using the Qubit 2.0
Fluorometer (Life Technologies, USA) and diluted to 4 nM. The                          Microbial Community Analysis
libraries were pooled and sequenced using the Illumina MiSeq                           Fisher’s alpha diversity was calculated at the OTU level in
Reagent Kit v300 for 2 × 300 bp sequencing.                                            R without normalization. For all other analyses, variation in
                                                                                       sequencing depth was normalized using the median ratio of OTU
                                                                                       counts with DESeq2 (Love et al., 2014). The vegan package was
Bioinformatic Analysis                                                                 used to calculate Bray-Curtis distance for amplicon data and to
Following sequencing, trimmomatic v0.35 (Bolger et al., 2014),                         perform PERMANOVA. Distance metrics were visualized using
was used to remove low-quality bases. Paired-ends reads were                           non-metric multidimensional scaling ordination, and plotted
assembled by aligning the forward and reverse reads, primers                           using ggplot2. Mantel tests were used to compare the Euclidian
were trimmed, and quality filtering was conducted with the                             distance matrix of the B. napus genotypes, as determined using
setting (–fastq_maxee 0.5) using USEARCH and UPARSE                                    SNP data, with the Bray Curtis distance matrix of each microbial
software (Edgar, 2010, 2013).                                                          group in the rhizosphere.
   Unique sequences were sorted by abundance and singletons                               Individual OTU contributions to the differences in overall
were discarded. Chimeras were removed using the SILVA                                  community structure were calculated using similarity percentage
database as a reference (Quast et al., 2013), and sequences                            (SIMPER). For multiple comparisons of genotype differences
were clustered to Operational Taxonomic Units (OTUs) at                                SIMPER was performed using PAST4 (Hammer et al., 2001).
97% minimum identity threshold. Taxonomy was assigned                                  For pairwise comparisons between nitrogen treatments, the
using Quantitative Insights into Microbial Ecology (QIIME 1.8)                         vegan implementation of SIMPER was used. Dufrene-Legendre

Frontiers in Sustainable Food Systems | www.frontiersin.org                        4                                               April 2021 | Volume 5 | Article 613269
Picot et al. Rhizosphere Microbiome, Nitrogen, and Crop Genotype indicator species analysis (Dufrêne and Legendre, 1997) was soil) accounted for between 23 and 42% of community performed using the labdsv package in R to identify OTUs linked variation, nitrogen treatment explained 0.3% of dissimilarity microbial communities at the phyla level (bacteria and fungi) or between nitrogen treatments included Pedobacter sp. class level (protists and nematodes) (Supplementary Figure 2). (B10), Flavobacterium sp. (B8), Micrococcaceae (B2), OSR genotype had no significant effect on Fisher’s alpha Promicromonospora sp. (B19), and Oxalobacteriaceae (B6) diversity in soil or rhizosphere for any microbial group which all had higher relative abundance in the low relative to (data not shown). high nitrogen treatment, and Chthoniobacteraceae (B4) which PERMANOVA (Table 2) and NMDS analysis (Figure 2) showed the reverse trend. showed that bacterial, fungal, protist and nematode beta diversity Differences in fungal beta diversity between crop genotypes were significantly different (p < 0.001) between the roots and was associated particularly with distribution of the pathogen rhizosphere. Overall, nitrogen significantly affected bacterial (p Leptosphaeria maculans, which contributed 14.49% to the = 0.032) fungal (p = 0.029) and protist (p = 0.045) beta difference between genotypes (Table 4). This fungus accounted diversity, but had no significant effect on nematode communities for over 22% of relative abundance in Couve, Yudal, Tapidor (p = 0.34). However, while compartment (rhizosphere vs. and Ningou, but only 2% of relative abundance in Canard and Frontiers in Sustainable Food Systems | www.frontiersin.org 5 April 2021 | Volume 5 | Article 613269
Picot et al.                                                                                                   Rhizosphere Microbiome, Nitrogen, and Crop Genotype

TABLE 2 | Permutational multivariate analysis of variance (PERMANOVA) of the effect of nitrogen treatment, oilseed rape genotype and compartment (soil vs.
rhizosphere), and their interactions, on microbial community composition.

                                          Df                   SS                      MS                  F. Model                    R2                    Pr (>F)

a. Bacteria

Nitrogen                                  1                   0.110                   0.110                  2.716                   0.0236                   0.0316
Compartment                               1                   1.954                   1.954                 48.282                   0.4193                   0.0003
Genotype                                  9                   0.471                   0.052                  1.294                   0.1011                   0.1339
Nitrogen:Compartment                      1                   0.061                   0.061                  1.504                   0.0131                   0.1809
Nitrogen:Genotype                         8                   0.324                   0.041                  1.001                   0.0695                   0.4488
Residuals                                43                   1.740                   0.041                  0.373
Total                                    63                   4.660                     1

b. Fungi

Nitrogen                                  1                   0.279                   0.279                  2.491                   0.0284                   0.029
Compartment                               1                   2.248                   2.2484                20.049                   0.2284                  1.00E-04
Genotype                                  9                   1.437                   0.160                  1.424                   0.1460                   0.0347
Nitrogen:Compartment                      1                   0.258                   0.258                  2.301                   0.0262                   0.0366
Nitrogen:Genotype                         8                   0.910                   0.114                  1.014                   0.0924                   0.4293
Residuals                                42                    4.71                   0.112                  0.479
Total                                    62                   9.843                     1

c. Protist

Nitrogen                                  1                   0.300                   0.300                  2.178                   0.0283                   0.0446
Compartment                               1                   3.199                   3.199                 23.248                   0.3027                   0.0003
Genotype                                  9                   1.390                   0.155                  1.123                   0.1316                   0.2482
Nitrogen:Compartment                      1                   0.226                   0.226                  1.643                   0.0214                   0.0943
Nitrogen:Genotype                         8                   1.045                   0.131                  0.953                   0.0993                   0.5388
Residuals                                32                   4.403                   0.138                  0.417
Total                                    52                   10.567                    1

d. Nematodes

Nitrogen                                  1                   0.174                   0.174                  1.053                   0.0119                   0.3389
Compartment                               1                   4.419                   4.419                 26.722                   0.3018                   0.0003
Genotype                                  9                   1.595                   0.177                  1.072                   0.1089                   0.3102
Nitrogen:Compartment                      1                   0.108                   0.108                  0.651                   0.0074                   0.7600
Nitrogen:Genotype                         8                   1.402                   0.175                  1.060                   0.0958                   0.3558
Residuals                                42                   6.945                   0.165                  0.474
Total                                    62                   14.643                    1

Bold indicates a significant effect.

York. Similarly, Mycosphaerella sp. contributed 13.97% to the                             Interestingly, three Tetracladium sp. OTU, when combined
difference between genotypes and comprised over 23% relative                           contributed over 8.5% to the difference between genotypes. These
abundance in Victor and Ningyou, but
Picot et al. Rhizosphere Microbiome, Nitrogen, and Crop Genotype FIGURE 2 | Non-metric multidimensional scaling analysis of soil and rhizosphere microbial communities determined using Bray Curtis similarity analysis of high and low nitrogen treatments, with data for each treatment reflecting combined data from 10 oilseed rape genotypes. (A) Bacteria; (B) Fungi; (C) Protist; (D) Nematode. Samples from each compartment/ nitrogen treatment combination are connected to a group centroid inside colored segments. 1, soil; o, rhizosphere. OTU Indicators of Nitrogen Treatment and indicators for both high and low nitrogen treatments Crop Genotype (Supplementary Figure 5). However, in the rhizosphere, Indicator analysis was used to identify OTUs which were indicators of low nitrogen were particularly associated with significantly associated with nitrogen treatment in the the bacterial phyla Amatimonadetes and Acidobacteria, the soil and rhizosphere. For all taxonomic groups, there was protist group Rhizaria, and the nematode classes Enoplea limited overlap between specific OTU indicators of nitrogen and Chromaonea. In contrast, rhizosphere indicators of treatment in the rhizosphere and soil (Supplementary Figure 4, high nitrogen were associated with the bacterial phyla TM7, Supplementary File 1). Most microbial phyla possessed Proteobacteria, Firmicutes, Bacteroidetes and Actinobacteria, Frontiers in Sustainable Food Systems | www.frontiersin.org 7 April 2021 | Volume 5 | Article 613269
Picot et al.                                                                                                            Rhizosphere Microbiome, Nitrogen, and Crop Genotype

TABLE 3 | Analysis of similarity percentage (SIMPER) of differences in oilseed rape rhizosphere and soil fungal, protest, and bacterial OTU between high and low nitrogen
treatments (with all 10 oilseed rape genotypes combined).

OTU                                                          % contribution to                                 % relative                                      % relative
                                                                difference                                 abundance in high N                             abundance in low N

a. Fungi

Rhizosphere
Leptosphaeria maculans F2                                            12.3                                            17.1                                           15.3
Mycosphaerella sp. F3                                                11.9                                            18.8                                            9.4
Pyrenopeziza brassicae F6                                            5.5                                             5.3                                             4.4
Tetracladium sp. F22                                                 4.6                                             5.0                                             3.3
Olpidium brassicae F40                                               4.1                                             4.3                                             2.7
Apodus sp. F32                                                       3.0                                             0.2                                             3.1
Leptosphaeria biglobosa F35                                          3.0                                             2.6                                             2.0
Soil
Mycosphaerella sp. F3                                                8.2                                             9.2                                             7.6
Leptosphaeria maculans F2                                            6.6                                             6.7                                             4.6
Gibellulopsis nigrescens F4                                          3.1                                             4.0                                             4.4
Pyrenopeziza brassicae F6                                            3.1                                             2.9                                             1.8

b. Protists

Spongospora subterranea P28                                          14.4                                            9.4                                            14.0
Ophiocytium sp. P37                                                  3.6                                             5.1                                             4.8
Phytophthora infestans P255                                          2.4                                             2.0                                             1.6
Peronosporomycetes P117                                              2.3                                             0.8                                             2.6
Phytophthora sp. P 567                                               1.5                                             1.8                                             0.1
Spongospora subterranean P796)                                       1.5                                             0.8                                             1.5
Unkown SAR P139                                                      1.5                                             1.6                                             0.9
Peronosporomycetes P98                                               1.2                                             1.8                                             2.1

c. Bacteria

Pedobacter sp. B10                                                   0.58                                            1.06                                           0.39
Chthoniobacteraceae B4                                               0.51                                            1.41                                           1.47
Flavobacterium sp. B8                                                0.50                                            1.02                                           0.91
Micrococcaceae B2                                                    0.48                                            2.38                                           1.67
Promicromonospora sp. B19                                            0.45                                            0.78                                           0.37
Oxalobacteraceae B6                                                  0.42                                            1.25                                           1.04
Flavobacterium sp. B6217                                             0.38                                            0.68                                           0.52
Flavobacterium sp. B11502                                            0.33                                            0.66                                           0.62
Bacillus sp. B7                                                      0.32                                            1.12                                           1.14

Shown are OTU which contribute >3% for fungi, >2% for protists, and >0.3% for bacteria, of the difference between high and low nitrogen treatments, with reads converted to relative
abundance for ease of reference. For fungi, PERMANOVA analysis identified a significant compartment-nitrogen interaction, and SIMPER analysis was therefore conducted on soil
and rhizosphere compartments separately. For protists and bacteria there was no significant compartment-nitrogen interaction and SIMPER analysis was conducted on combined
rhizosphere and soil compartments together.

the chytridiomycete and ascomycete fungi, and the                                                Generally, most indicators for B. napus genotype
protist Stramenopiles.                                                                       were     common      across    a   number       of   genotypes
   In the soil, groups possessing indicators of high                                         (Supplementary Figure 5, Supplementary File 1). Canard
nitrogen largely matched those in the rhizosphere, but                                       and York had the most distinctive indicators: Canard had 2
a broader range of bacterial phyla were enriched as                                          fungal indicators which were unique to it, and Tapidor a single
indicators of low nitrogen, including Verrucomicrobia,                                       unique fungal indicator. A chytrid-like OTU, Sanchytrium
Gemmatimonadetes, Cyanobacteria, Chloroflexi, Chlorobi,                                      tribonematis had over 75% of its total relative abundance in
BRC1, and Aramatimonadetes.                                                                  Ningyou 7, while there were 11 fungal indicators which had over

Frontiers in Sustainable Food Systems | www.frontiersin.org                              8                                                 April 2021 | Volume 5 | Article 613269
Picot et al. Rhizosphere Microbiome, Nitrogen, and Crop Genotype
TABLE 4 | Analysis of similarity percentage (SIMPER) of differences in oilseed rape rhizosphere fungal OTU between oilseed rape genotypes (high and low nitrogen
treatments combined).
Taxonomy % contribution to Couve Yudal Tapidor Victor Rocket Canard Temple Darmoor Ningyou York
difference
Leptosphaeria maculans F2 14.49 24.20 24.30 22.70 8.56 17.90 2.30 8.08 12.50 26.00 2.04
Mycosphaerella sp. F3 13.97 16.10 12.00 9.74 24.60 12.60 14.80 11.20 12.20 23.40 18.07
Pyrenopeziza brassicae F6 6.10 3.10 3.99 4.46 6.56 0.90 3.74 0.73 15.30 2.03 0.72
Tetracladium sp. F22 4.89 2.93 4.40 6.73 1.38 5.27 11.7 3.85 1.25 1.92 6.07
Olpidium brassicae F40 4.36 2.14 2.24 2.04 2.87 10.50 3.98 1.40 5.85 1.88 1.64
Leptosphaeria biglobosa F35 3.51 2.07 2.67 8.71 0.33 0.63 0.77 1.49 0.93 0.86 0.70
Apodus sp. F32 2.98 0.49 4.18 0.29 3.02 0.70 1.54 0.97 0.52 0.70 16.34
Articulopsora sp. F29 2.94 4.54 1.58 1.12 6.70 0.50 1.35 0.86 2.18 1.80 4.77
Alternaria sp. F23 2.92 0.22 0.16 0.14 0.12 0.12 0.71 11.80 0.12 1.72 0.02
Tetracladium sp. F25 2.33 0.96 2.63 1.53 0.72 1.57 1.49 0.95 1.45 0.30 15.30
Phaeosphaeriaceae F8 1.38 2.28 1.78 1.89 1.86 2.47 3.14 5.38 3.02 1.76 1.46
Tetracladium sp. F74 1.34 0.73 3.70 0.26 1.66 0.20 0.07 0.05 0.02 0.11 1.63
Didymellaceeae F10 1.31 0.41 1.30 3.13 0.63 0.12 0.11 0.34 0.25 0.05 0.60
Plectosphaerella cucuminerina F119 1.17 0.09 0.98 0.77 0.30 0.37 3.98 1.80 0.13 0.45 0.19
Gibbelulopsis nigrescens F4 1.03 0.37 0.07 2.66 1.03 0.29 0.14 0.41 0.19 0.03 0.31
Shown are the OTU which contributed to >1% of the difference between genotypes, with reads converted to relative abundance for ease of reference.
TABLE 5 | Network co-occurrence statistics in the soil and rhizosphere of oilseed rape crops under high and low nitrogen fertilization treatments.
Network Feature Rhizosphere Soil
High N Low N High N Low N
No. nodes 639 895 592 726
Node composition
Nematodes 4 (0.6%) 9 (1.0%) 5 (0.8%) 2 (0.3%)
Protists 14 (2.2%) 13 (1.5%) 23 (3.9%) 28 (3.9%)
Fungi 49 (7.7%) 68 (7.6%) 84 (14.2%) 98 (13.5%)
Bacteria 572 (89.5%) 805 (89.9%) 480 (81.1%) 598 (82.4%)
% positive edges 27.7 22.4 26.8 27.9
% negative edges 72.3 77.6 73.2 72.1
No. edges 2,073 3,318 2,420 3,214
Mean degree 6.5 7.4 8.2 8.9
Density 1.0% 0.8% 1.4% 1.2
Transitivity 33.8% 32.5% 41.6% 38.5%
Modularity 0.56 0.59 0.56 0.60
No. clusters 43 41 43 45
Mean cluster size 14.9 21.8 13.8 16.1
Mean node betweenness centrality 1,023 1,685 1,132 1,087
Data represents networks derived from combining replicate plots from across 10 oilseed rape genotypes for each N treatment.
50% of their total relative abundance in York, including two Effects of Nitrogen Treatment on Microbial
Tetracladium sp. OTU. Networks
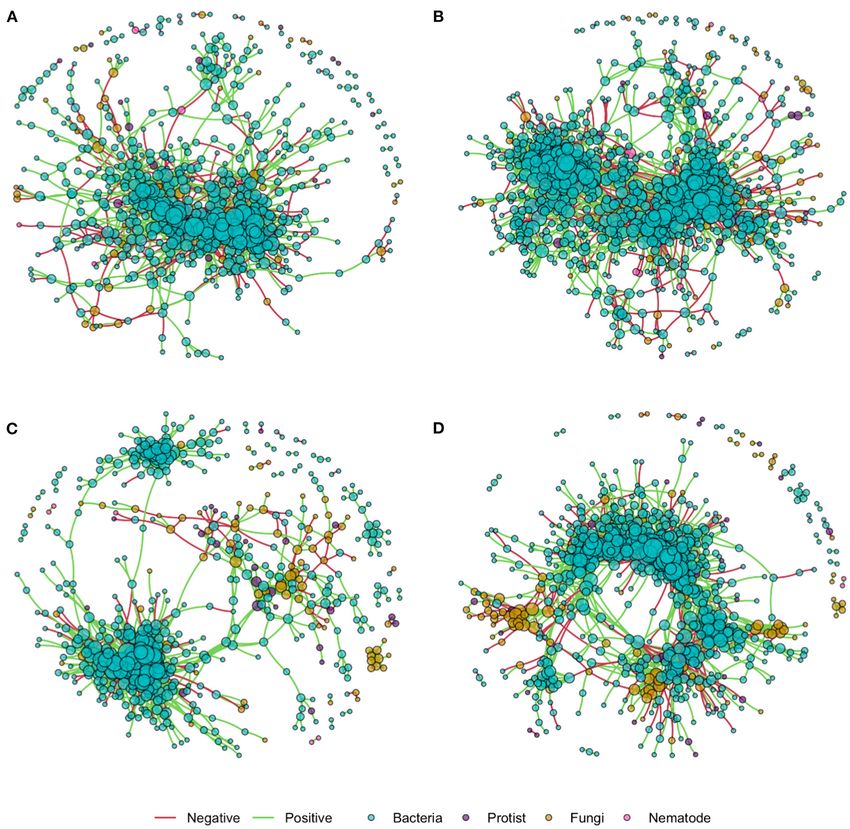
Generally, there was limited overlap between taxa the Network density was increased by nitrogen application in both
SIMPER analysis identified as contributing to the differences the rhizosphere and soil, as shown in network co-occurrence
in communities between nitrogen treatment or genotype, and statistics (Table 5) and visually in the microbial correlation
indicator species (Supplementary File 1). However, for fungal networks (Figure 3). High nitrogen was associated with a
indicators, there was some overlap with results of the SIMPER reduction in the number of nodes, from 895 and 726 to 639 and
analysis, with L. maculans and L. biglobosa indicators of high 592 in the rhizosphere and soil, respectively. However, there was
nitrogen rhizosphere soil. However, most OTU identified by the no substantive difference in the relative proportion of bacterial,
indicator analysis had low relative abundance. protist, fungal or bacterial OTUs within networks from the high
Frontiers in Sustainable Food Systems | www.frontiersin.org 9 April 2021 | Volume 5 | Article 613269Picot et al. Rhizosphere Microbiome, Nitrogen, and Crop Genotype FIGURE 3 | Inter-kingdom microbial correlation networks in the rhizosphere and soil of oilseed rape in high and low nitrogen treatments, using data from 10 oilseed rape genotypes for each nitrogen treatment. Edges indicate correlation of >0.8 or
Picot et al.                                                                                     Rhizosphere Microbiome, Nitrogen, and Crop Genotype

had a significant effect on both phoma stem canker (p = 2−8 )               pH (Liang et al., 2020). Furthermore, Revillini et al. (2019)
and upper lesion severity (p = 3−4 ). Both of these analyses                found that abundance of arbuscular mycorrhizal fungi was
showed high levels of infection in Victor, and low infection                reduced by nitrogen application, and similarly a strong effect
levels in Temple and Ningyou 7, but for the other genotypes                 of nitrogen application on rhizosphere fungi has been seen in
there was no relationship between severity of stem canker and               sugarcane (Paungfoo-Lonhienne et al., 2015). Significantly, our
upper stem lesions. Canard and Couve Nabica showed high stem                data suggests differential impacts of nitrogen fertilization on
canker infection rates, but low rates of upper stem lesions, while          fungal communities, but not protists, between the rhizosphere
Darmoor showed the reverse trend. Genotype had no significant               and soil.
effect on light leaf spot infection of the stem (p = 0.07) or                   Overall these findings suggest contrasting responses among
pods (p = 0.12).                                                            different groups of soil biota to nitrogen fertilization, and the
                                                                            extent to which the plant influences these effects. Changes in
                                                                            nitrogen availability from fertilization were not of sufficient
DISCUSSION                                                                  magnitude to cause stoichiometric shifts suitable to alter growth
                                                                            of nematode communities, but did impact protist, bacterial and
We show that while bacteria, fungi, nematodes, and protists                 fungal communities, with effects modulated by the plant for fungi
showed distinct communities in the rhizosphere of OSR, relative             but not protists or bacteria. Clearly the extent to which such
to the bulk soil, there were contrasting responses among                    effects will occur for any microbial group will depend on local
these microbial groups to both crop genotype and nitrogen                   soil stoichiometry and the characteristics of plant exudates, but
fertilization. Nematode communities were unaffected by either               our data does suggest differential susceptibility among soil biota
nitrogen application or crop genotype. Fungal community                     to these thresholds.
composition was affected by both factors, while protists and                    The nematode and protist communities were profiled by
bacteria were influenced by fertilization but not crop genotype.            extracting sequenes amplified using general microbial eukaryote
Significantly, for fungi, the effect of nitrogen application on             primers. While this represents a low cost option relative to use
community composition was associated with an increase in                    of specific primers for these groups, such as those used by Hilton
relative abundance of a variety of plant pathogens. Impacts of              et al. (2018) for nematodes, and by Bass et al. (2018) for plant
crop genotype on fungal community composition were mediated                 associated plasmodiophorid protists, it is possible that some loss
through specific fungal taxa, particularly pathogens, which were            of diversity within these groups occurred, resulting in dampening
differentially abundant across genotypes. However, there was no             of the responses of these groups to both nitrogen and genotype.
relationship between relatedness of B. napus genotypes and the                  Notably, nitrogen fertilization was associated with increases in
similarity of their microbial communities.                                  relative abundance of a number of pathogens in the rhizosphere
    Availability of nitrogen has the potential to directly influence        of OSR. This included Leptosphaeria maculans and L. biglobosa,
microbial communities by affecting nutrient stoichiometry,                  which cause blackleg diseases which impact OSR yields globally
which can change the nature of nutrient related resource                    (Fitt et al., 2006), Pyrenopeziza brassicae, responsible for light
limitations, and thereby affect microbial growth, and the rates             leaf spot, the predominant OSR disease in the UK (Dewage
and characteristics of carbon and nutrient cycling processes                et al., 2018), Olpidium brassicae, which is associated with OSR
(Aanderud et al., 2018). In the rhizosphere such effects can                yield decline (Hilton et al., 2013, 2021), and Mycosphaerella
also occur indirectly, since changes in plant nitrogen status can           sp. which are common plant pathogens and includes several
cause quantitative and qualitative changes in the composition               species which infect oilseed rape, such as M. brassicola (ringspot
of plant root exudates, thereby affecting microbial community               disease) and M. capsellae (white leaf spot disease). Nitrogen
composition (Zhu et al., 2016).                                             fertilization may play a pivotal role in plant defense (Mur
    Nitrogen fertilizer application has previously been found to            et al., 2016). While nitrogen availability generally promotes plant
affect soil and rhizosphere bacterial communities in a number               defence metabolites, it may cause changes in host physiology,
of crops, including soybean (Wang et al., 2020), rice (Chen                 such as promotion of sugar content, which can increase
et al., 2019), OSR (Monreal et al., 2018), and maize (Zhu                   resource availability to pathogens. Furthermore, pathogens may
et al., 2016). However, the effects of nitrogen application on              be nitrogen limited when they grow toward and within plant
bacterial communities may be small relative to other factors                tissues, and increased nitrogen availability may thus increase the
(Wang et al., 2016) and some studies have found no influence                rate of infection.
of nitrogen application on rhizosphere bacteria (Revillini et al.,              With the exception of O. brassicae, the pathogens we detected
2019). Evidence suggests that bacteria involved in nitrogen cycle           cause foliar diseases, and the importance of root entry in
transformations are most responsive to nitrogen application in              driving disease development is unclear, since the presence of
both the rhizosphere and bulk soil (Kastl et al., 2014; Zhu et al.,         pathogens in the rhizosphere can reflect growth from the shoot
2016), and indeed Nitrospirae were among the OTU indicators                 (Sprague et al., 2007). However, for Mycosphaerella sp., L.
of high nitrogen in our study.                                              maculans, and P. brassicae, the high nitrogen treatment was
    Much less is known about the influence of nitrogen on                   also associated with increased relative abundance in the bulk
microbial eukaryotes in the soil or rhizosphere. There is some              soil, suggesting that high nitrogen could have promoted survival
evidence that nitrogen fertilizer application can reduce diversity          or growth of spores, or mycelium residing on the debris of
of bulk soil nematode communities, potentially by affecting                 previous crops.

Frontiers in Sustainable Food Systems | www.frontiersin.org            11                                        April 2021 | Volume 5 | Article 613269
Picot et al. Rhizosphere Microbiome, Nitrogen, and Crop Genotype Overall, pathogens were dominant components of the OSR Mycosphaerella sp., and Leptosphaeria biglobosa between root fungal microbiome, and levels of infection appear to be genotypes. This could indicate differences in genetic resistance to linked to nutrient stoichiometry, which influenced pathogen the pathogens, or reflect assembly of microbiomes which inhibit communities in both the soil and rhizosphere. Our results suggest pathogen assembly on the root (Glaeser et al., 2019). that nitrogen application could be an important contributor Visual analysis of all oilseed rape genotypes confirmed to determining whether microbiomes have positive or negative that they were infected by Leptosphaeria sp., P. brassicae and impacts on crop health. Alternaria sp., as indicated by the rhizosphere community Relative to the bulk soil, the rhizosphere network was profiling. However, there was no relationship between the characterized by a variety of features which indicate lower severity of infection of these pathogens in aboveground plant connectivity, including lower mean degree, density and tissues and the relative abundance of these pathogens within transitivity, while number of nodes, showed the reverse trend. the rhizosphere microbiome, and similarly, while sequencing Nitrogen application reduced number of nodes, edges, mean revealed a potential relationship between relative abundance degree and cluster size, suggesting reduced connectivity, and of these fungal pathogens and nitrogen application, no furthermore in the rhizosphere only, nitrogen application such relationship was seen in the visual disease analysis. reduced mean node betweenness centrality, and increased Since analysis of disease severity on stems and pods was the number of positive connections. The interpretation not concomitant with the analysis of rhizosphere microbial and significance of network features and their thresholds communities, comparison should be treated with caution. in microbiomes is currently unclear, although it has been However, our findings clearly demonstrate that rhizosphere proposed that features which confer stability and resilience to microbiome composition is a direct indicator of plant health, and perturbation in microbiomes may differ from those in ecological identified the presence of pathogens that were not detected by networks, because of the fundamental importance of cooperative visual analysis. interactions in the functioning of microbiomes (Coyte et al., Interestingly, Darmor and Tapidor genotypes have been bred 2015). However, high connectivity, centrality and positive for genetic resistance to L. maculans, while Ningyou 7 and interactions have all been proposed to reduce microbial network Yudal are noted as susceptible to this pathogen (AHDB, 2015; stability (Coyte et al., 2015; de Vries et al., 2018), indicating that Larkin et al., 2015; Raman et al., 2018). Microbiome analysis communities of the rhizosphere have greater inherent stability confirmed high relative abundance of L. maculans sequences than those in the bulk soil, but that nitrogen application reduces in Ningyou 7 and Yudal relative to Darmor, but not Tapidor. community stability within the rhizosphere. Furthermore, aboveground disease analysis did not identify Host genotype exerted a significant effect on fungal differences in infection severity on stems or pods between these community assembly, while no such effect was seen for lines. Similarly, there was no evidence for greater susceptibility bacteria, nematodes or protists. In common with other crop of Tapidor to P. brassicae than the other lines, as suggested species, studies of the role of host genetics in shaping the OSR by Larkin et al. (2015). These specific pathogen resistance microbiome have largely focused on bacterial communities (Taye traits cannot therefore be used to predict infection by these et al., 2020). However, evidence suggests that plant rhizosphere pathogens either in the roots or aboveground, and in particular bacterial communities may show low responsiveness to host questions the effectiveness of L. maculans resistance traits under genotype under field conditions, with stronger responses noted field conditions. in the phyllosphere (Edwards et al., 2015; Wagner et al., 2016). Fungal root endophytes have frequently been proposed as However, bacterial responses to genotype may be determined by potential plant pathogen biocontrol agents (Whipps, 2001). plant development stage (Taye et al., 2020). Interestingly the genotype York showed the lowest amount of Significantly there was no relationship between genotype L. maculans, P. brassicae, O. brassicae, and L. biglobosa, with relatedness and the similarity of microbiomes. Fitzpatrick a combined total of 5.1% relative abundance, compared to et al. (2018) showed that similarity of the root, but not 37.9% in Tapidor. In contrast to the other genotypes, in which rhizosphere, bacterial microbiome in 30 plant species grown non-pathogen fungal OTUs were each generally present in low under controlled conditions was associated with plant genetic abundance, York supported extremely high relative abundance of similarity. Furthermore, using a field approach, Taye et al. (2020) Apodus sp., and Tetracladium sp. F25, which together comprised demonstrated a correlation between the similarity of bacterial almost 32% of fungus relative abundance. Tetracladium spp. communities in the OSR rhizosphere and plant genetic distance. have traditionally been considered as aquatic hyphomycetes, Differences in responsiveness of microbiota to host genotype but evidence is emerging, supported here, that they are widely likely reflects the nutritional mode of the interaction, and the distributed root endophytes (Selosse et al., 2008) which may be degree to which this is affected by plant traits under the influence indicators of a beneficial microbiome (Hilton et al., 2021). While of genotype, such as the presence of defence and nutritional there is no understanding of the interactions between these fungi metabolites, such as glucosinolates and erucic acid. In our with their host or plant pathogens, some related Heliotales may study, fungal communities were dominated by plant pathogens. act as root symbionts which promote plant growth and nutrient Notably, differences in fungal community composition between supply (Almario et al., 2017). genotypes was associated with differences in relative abundance A variety of approaches are used to profile responses of of several pathogens, including Leptosphaeria maculans, the microbiome to variables such as environment and host. Alternaria sp., Pyrenopeziza brassicae, Olpidium brassicae, Typically, these include analysis of alpha and beta diversity as Frontiers in Sustainable Food Systems | www.frontiersin.org 12 April 2021 | Volume 5 | Article 613269
Picot et al.                                                                                                            Rhizosphere Microbiome, Nitrogen, and Crop Genotype

used here. Although these methods are useful to identify broad                               DATA AVAILABILITY STATEMENT
relationships, they have the potential to overlook behaviours of
individual taxa, and also the responses of microbial interaction                             The datasets presented in this study can be found in online
pathways (Tabrett and Horton, 2020). Indicator species analysis,                             repositories. The names of the repository/repositories and
which accounts for both abundance and frequency of taxa                                      accession number(s) can be found here: https://www.ncbi.nlm.
detection, and is calculated independently for each taxon, is                                nih.gov/genbank/, MW051022-MW051025 https://www.ncbi.
becoming widely used to investigate microbiome composition.                                  nlm.nih.gov/genbank/, MW051900-MW051914 https://www.
We found that indicator species analysis identified complex                                  ncbi.nlm.nih.gov/, BioProject ID PRJNA666392.
OTU level responses, particularly for nitrogen treatment,
but there was limited overlap between indicator OTUs and                                     AUTHOR CONTRIBUTIONS
OTUs identified by SIMPER as contributing to community
level changes. Nonetheless indicator analysis and particularly                               CH: rhizosphere sampling. CH and SH: microbial
network analysis may be useful in providing detail about fine                                sequencing. CH, EP, and SH: bioinformatic analysis. Y-JH
scale changes in community composition which could have                                      and SP: crop disease assessment. GT: crop genotype SNP
biological significance.                                                                     analysis. CH and GB: writing the manuscript. GB: project
   We conclude that factors which shape composition of                                       conception and obtaining project funding. All authors edited
bacterial communities in the rhizosphere cannot be extrapolated                              the manuscript.
to microbial eukaryotes, with bacteria, fungi, protists, and
nematodes all showing variable responses to the factors                                      ACKNOWLEDGMENTS
we studied. We identified fungal communities as the most
responsive to host genotype and in contrast to the other                                     We thank the Biotechnology and Biological Sciences Research
groups, found that impacts of nitrogen on the microbiome were                                Council grants BB/J019690/1 and BB/L025892/1 and the Defra
modulated by the plant. Both nitrogen and genotype contributed                               OREGIN project (IF0144) for funding.
to fungal assembly patterns which could influence host health.
While controlled environment experiments have been important                                 SUPPLEMENTARY MATERIAL
for identifying factors which have potential to contribute to
microbiome assembly, field-based approaches are required to                                  The Supplementary Material for this article can be found
unravel the complex interactions which shape microbiomes in                                  online at: https://www.frontiersin.org/articles/10.3389/fsufs.
the real world.                                                                              2021.613269/full#supplementary-material

REFERENCES                                                                                      high-throughput community sequencing data. Nat. Methods 7, 335–336.
                                                                                                doi: 10.1038/nmeth.f.303
Aanderud, Z. T., Saurey, S., Ball, B. A., Wall, D. H., Barrett, J. E., Muscarella,           Caporaso, J. G., Lauber, C. L., Walters, W. A., Berg-Lyons, D., Huntley,
   M. E., et al. (2018). Stoichiometric shifts in soil C:N:P promote bacterial taxa             J., Fierer, N., et al. (2012). Ultra-high-throughput microbial community
   dominance, maintain biodiversity, and deconstruct community assemblages.                     analysis on the Illumina HiSeq and MiSeq platforms. ISME J. 6, 1621–1624.
   Front. Microbiol. 9:1401. doi: 10.3389/fmicb.2018.01401                                      doi: 10.1038/ismej.2012.8
AHDB (2015). Final Report 606 Understanding Resistance to Decrease Risk of                   Chen, J., Arafat, Y., Ud Din, I., Yang, B., Zhou, L., Wang, J., et al. (2019). Nitrogen
   Severe Phoma Stem Canker in Oilseed Rape. Agriculture and Horticulture                       fertilizer amendment alter the bacterial community structure in the rhizosphere
   Development Board.                                                                           of rice (Oryza sativa L.) and improve crop yield. Front. Microbiol. 10:2623.
Almario, J., Jeena, G., Wunder, J., Langen, G., Zuccaro, A., Coupland, G., et al.               doi: 10.3389/fmicb.2019.02623
   (2017). Root-associated fungal microbiota of nonmycorrhizal Arabis alpina and             Clauset, A., Newman, M. E. J., and Moore, C. (2004). Finding community structure
   its contribution to plant phosphorus nutrition. Proc. Natl. Acad. Sci. U.S.A. 114,           in very large networks. Phys. Rev. E 2004:70. doi: 10.1103/PhysRevE.70.066111
   E9403–E9412. doi: 10.1073/pnas.1710455114                                                 Coyte, K. Z., Schluter, J., and Foster, K. R. (2015). The ecology of the
Amaral-Zettler, L. A., McCliment, E. A., Ducklow, H. W., and Huse, S. M. (2009).                microbiome: networks, competition, and stability. Science 350, 663–666.
   A method for studying protistan diversity using massively parallel sequencing                doi: 10.1126/science.aad2602
   of V9 hypervariable regions of small-subunit ribosomal RNA Genes. PLoS ONE                Csardi, G., and Nepusz, T. (2006). The Igraph Software Package for Complex
   4:e6372. doi: 10.1371/annotation/50c43133-0df5-4b8b-8975-8cc37d4f2f26                        Network Research, 1695. Available online at: http://igraph.org InterJournal
Bass, D., van der Gast, C. J., Thomson, S., Neuhauser, S., Hilton, S., and                      Complex Systems
   Bending, G. D. (2018)Plant rhizosphere selection of plasmodiophorid lineages              de Vries, F. T., Griffiths, R. I., Bailey, M., Craig, H., Girlanda, M., Gweon, H. S.,
   from bulk soil: the importance “hidden” diversity. Front. Microbiol. 9:168.                  et al. (2018). Soil bacterial networks are less stable under drought than fungal
   doi: 10.3389/fmicb.2018.00168                                                                networks. Nat. Commun. 9:3033. doi: 10.1038/s,41467-018-05516-7
Bolger, A. M., Lohse, M., and Usadel, B. (2014). Trimmomatic: a flexible                     DEFRA: Agriculture in the United Kingdom. (2019). National Statistics,
   trimmer for Illumina sequence data. Bioinformatics 30, 2114–2120.                            Department for Environment, Food & Rural Affairs.
   doi: 10.1093/bioinformatics/btu170                                                        Dewage, C. S. K., Klöppel, C. A., Stotz, H. U., and Fitt, B. D. L. (2018). Host–
Bulgarelli, D., Garrido-Oter, R., Münch, P., Weiman, A., Dröge, J., Pan, Y.,                    pathogen interactions in relation to management of light leaf spot disease
   et al. (2015). Structure and function of the bacterial root microbiota                       (caused by Pyrenopeziza brassicae) on Brassica species. Crop and Pasture Science
   in wild and domesticated barley. Cell Host Microbe 17, 392–403.                              69, 9–19. doi: 10.1071/CP16445
   doi: 10.1016/j.chom.2015.01.011                                                           Dufrêne, M., and Legendre, P. (1997). Species assemblages and indicator species:
Caporaso, J. G., Kuczynski, J., Stombaugh, J., Bittinger, K., Bushman,                          the need for a flexible asymmetrical approach. Ecol. Monogr. 67, 345–366.
   F. D., Costello, E. K., et al. (2010). QIIME allows analysis of                              doi: 10.1890/0012-9615(1997)0670345:SAAIST2.0.CO;2

Frontiers in Sustainable Food Systems | www.frontiersin.org                             13                                                 April 2021 | Volume 5 | Article 613269
Picot et al. Rhizosphere Microbiome, Nitrogen, and Crop Genotype
Edgar, R. C. (2010). Search and clustering orders of magnitude faster than BLAST. Liang, S., Kou, X., Li, Y., Lü, X., Wang, J., and Li, Q. (2020). Soil
Bioinformatics 26, 2460–2461. doi: 10.1093/bioinformatics/btq461 nematode community composition and stability under different nitrogen
Edgar, R. C. (2013). UPARSE: highly accurate OTU sequences from additions in a semiarid grassland. Global Ecol. Conserv. 22:e00965.
microbial amplicon reads. Nat. Methods 10:996. doi: 10.1038/nmeth. doi: 10.1016/j.gecco.2020.e00965
2604 Love, M. I., Huber, W., and Anders, S. (2014). Moderated estimation of fold
Edwards, J., Johnson, C., Santos-Medellín, C., Lurie, E., Podishetty, N. K., change and dispersion for RNA-seq data with DESeq2. Genome Biol. 15:550.
Bhatnagar, S., et al. (2015). Structure, variation, and assembly of the root- doi: 10.1186/s13059-014-0550-8
associated microbiomes of rice. Proc. Natl. Acad. Sci. U.S.A. 112, E911–E920. Mahoney, A. K., Yin, C., and Hulbert, S. H. (2017). Community structure,
doi: 10.1073/pnas.1414592112 species variation, and potential functions of rhizosphere-associated bacteria of
FAOstat (2018). Food and Agriculture Organization of the United Nations different winter wheat (Triticum aestivum) Cultivars. Front. Plant Sci. 8:132.
Statistics Division. doi: 10.3389/fpls.2017.00132
Fitt, B. D. L., Brun, H., Barbetti, M. J., and Rimmer, S. R. (2006). World- Marschner, P., Solaiman, Z., and Rengel, Z. (2007). Brassica genotypes differ
wide importance of phoma stem canker (Leptosphaeria maculans and L. in growth, phosphorus uptake and rhizosphere properties under P-limiting
biglobosa) on Oilseed Rape (Brassica napus). Europ. J. Plant Pathol. 114, 3–15. conditions. Soil Biol. Biochem. 39, 87–98. doi: 10.1016/j.soilbio.2006.06.014
doi: 10.1007/s10658-005-2233-5 McDonald, D., Price, M. N., Goodrich, J., Nawrocki, E. P., DeSantis, T. Z., Probst,
Fitzpatrick, C. R., Copeland, J., Wang, P. W., Guttman, D. S., Kotanen, P. M., A., et al. (2012). An improved Greengenes taxonomy with explicit ranks
and Johnson, M. T. J. (2018). Assembly and ecological function of the root for ecological and evolutionary analyses of bacteria and archaea. ISME J. 6,
microbiome across angiosperm plant species. Proc. Natl. Acad. Sci. U.S.A. 115, 610–618. doi: 10.1038/ismej.2011.139
E1157–E1165. doi: 10.1073/pnas.1717617115 Monreal, C., Zhang, J., Koziel, S., Vidmar, J., González, M., Matus, F., et al. (2018).
Friedman, J., and Alm, E. J. (2012). Inferring correlation networks from genomic Bacterial community structure associated with the addition of nitrogen and the
survey data. PLoS Comput. Biol. 8:e1002687. doi: 10.1371/journal.pcbi.1002687 dynamics of soluble carbon in the rhizosphere of canola (Brassica napus) grown
Gao, Z., Karlsson, I., Geisen, S., Kowalchuk, G., and Jousset, A. (2019). Protists: in a Podzol. Rhizosphere 5, 16–25. doi: 10.1016/j.rhisph.2017.11.004
puppet masters of the rhizosphere microbiome. Trends Plant Sci. 24, 165–176. Morgan, J. A. W., Bending, G. D., and White, P. J. (2005). Biological costs and
doi: 10.1016/j.tplants.2018.10.011 benefits to plant–microbe interactions in the rhizosphere. J. Exp. Bot. 56,
Glaeser, S. P., Gabur, I., Haghighi, H., Bartz, J., Kämpfer, P., Snowdon, R., 1729–1739. doi: 10.1093/jxb/eri205
et al. (2019). Endophytic bacterial communities of oilseed rape associate with Mur, L. A. J., Simpson, C., Kumari, A., Gupta, A. K., and Gupta, K. J. (2016).
genotype-specific resistance against Verticillium longisporum. FEMS Microbiol. Moving nitrogen to the centre of plant defence against pathogens. Ann. Bot.
Ecol. 96:fiz188. doi: 10.1093/femsec/fiz188 119, 703–709. doi: 10.1093/aob/mcw179
Gosling, P., Hodge, A., Goodlass, G., and Bending, G. D. (2006). Arbuscular Oksanen, J., Blanchet, F. G., Friendly, M., Kindt, R., Legendre, P., McGlinn, D.,
mycorrhizal fungi and organic farming. Agricult. Ecosyst. Environ. 113, 17–35. et al. (2018). Vegan: Community Ecology Package. In {R package version 25-3}.
doi: 10.1016/j.agee.2005.09.009 Available online at: https://CRAN.R-project.org/package=vegan;
Guillou, L., Bachar, D., Audic, S., Bass, D., Berney, C., Bittner, L., et al. (2013). The Paungfoo-Lonhienne, C., Yeoh, Y. K., Kasinadhuni, N. R. P., Lonhienne, T.
Protist Ribosomal Reference database (PR2): a catalog of unicellular eukaryote G. A., Robinson, N., Hugenholtz, P., et al. (2015). Nitrogen fertilizer dose
Small Sub-Unit rRNA sequences with curated taxonomy. Nucleic Acids Res. 41, alters fungal communities in sugarcane soil and rhizosphere. Sci. Rep. 5:8678.
D597–D604. doi: 10.1093/nar/gks1160 doi: 10.1038/srep08678
Hamilton, N. E., and Ferry, M. (2018). ggtern: ternary diagrams using ggplot2. J. Quast, C., Pruesse, E., Yilmaz, P., Gerken, J., Schweer, T., Yarza, P., et al. (2013). The
Stat. Softw. 87, 1–17. doi: 10.18637/jss.v087.c03 SILVA ribosomal RNA gene database project: improved data processing and
Hammer, Ø., Harper, D. A. T., and Ryan, P. D. (2001). PAST: Paleontological web-based tools. Nucleic Acids Res. 41, D590–D596. doi: 10.1093/nar/gks1219
statistics software package for education and data analysis. Palaeontol. Raman, H., Raman, R., Diffey, S., Qiu, Y., McVittie, B., Barbulescu, D. M., et al.
Electro. 4:9. (2018) Stable quantitative resistance loci to blackleg disease in canola (Brassica
Hilton, S., Bennett, A. J., Chandler, D., Mills, P., and Bending, G. D. (2018). napus L.) over continents. Front. Plant Sci. 9:1622. doi: 10.3389/fpls.2018.01622
Preceding crop and seasonal effects influence fungal, bacterial and nematode Rathore, R., Dowling, D. N., Forristal, P. D., Spink, J., Cotter, P. D., Bulgarelli,
diversity in wheat and oilseed rape rhizosphere and soil. Appl. Soil Ecol. 126, D., et al. (2017). Crop establishment practices are a driver of the plant
34–46. doi: 10.1016/j.apsoil.2018.02.007 microbiota in winter oilseed rape (Brassica napus). Front. Microbiol. 8:1489.
Hilton, S., Bennett, A. J., Keane, G., Bending, G. D., Chandler, D., Stobart, R., doi: 10.3389/fmicb.2017.01489
et al. (2013). Impact of shortened crop rotation of oilseed rape on soil and Revillini, D., Wilson, G. W. T., Miller, R. M., Lancione, R., and Johnson, N.
rhizosphere microbial diversity in relation to yield decline. PLoS ONE 8:e59859. C. (2019). Plant diversity and fertilizer management shape the belowground
doi: 10.1371/journal.pone.0059859 microbiome of native grass bioenergy feedstocks. Front. Plant Sci. 10:1018.
Hilton, S., Picot, E., Schreiter, S., Bass, D., Norman, K., Oliver, A. E., et al. (2021). doi: 10.3389/fpls.2019.01018
Identification of microbial signatures linked to oilseed rape yield decline at the Selosse, M. A., Vohnik, M., and Chauvet, E. (2008). Out of the rivers:
landscape scale. Microbiome 9:19. doi: 10.1186/s40168-020-00972-0 are some aquatic hyphomycetes plant endophytes? New Phytol. 178, 3–7.
Hunter, P. J., Teakle, G. R., and Bending, G. D. (2014). Root traits and doi: 10.1111/j.1469-8137.2008.02390.x
microbial community interactions in relation to phosphorus availability and Semenov, M. V., Krasnov, G. S., Semenov, V. M., and van Bruggen, A. H. (2020).
acquisition, with particular reference to Brassica. Front. Plant Sci. 5:27. Long-term fertilization rather than plant species shapes rhizosphere and bulk
doi: 10.3389/fpls.2014.00027 soil prokaryotic communities in agroecosystems. Appl. Soil Ecol. 154:103641.
Jones, D. L., Hodge, A., and Kuzyakov, Y. (2004). Plant and doi: 10.1016/j.apsoil.2020.103641
mycorrhizal regulation of rhizodeposition. New Phytol. 163, 459–480. Sprague, S. J., Watt, M., Kirkegaard, J. A., and Howlett, B. J. (2007). Pathways of
doi: 10.1111/j.1469-8137.2004.01130.x infection of Brassica napus roots by Leptosphaeria maculans. New Phytol. 176,
Kastl, E., Schloter-Hai, B., Buegger, F., and Schloter, M. (2014) “Impact of 211–222. doi: 10.1111/j.1469-8137.2007.02156.x
fertilization on the abundance of nitrifiers and denitrifiers at the root–soil Stoeck, T., Bass, D., Nebel, M., Christen, R., Jones, M. D. M., Breiner, H.-W., et al.
interface of plants with different uptake strategies for nitrogen. Biol. Fertil. Soils (2010). Multiple marker parallel tag environmental DNA sequencing reveals a
51, 57–64. doi: 10.1007/s00374-014-0948-1 highly complex eukaryotic community in marine anoxic water. Mol. Ecol. 19,
Koljalg, U., Nilsson, R. H., Abarenkov, K., Tedersoo, L., Taylor, A. F. S., Bahram, 21–31. doi: 10.1111/j.1365-294X.2009.04480.x
M., et al. (2013). Towards a unified paradigm for sequence-based identification Tabrett, A., and Horton, M. W. (2020). The influence of host genetics
of fungi. Mol. Ecol. 22, 5271–5277. doi: 10.1111/mec.12481 on the microbiome. F1000Research 9:84. doi: 10.12688/f1000research.
Larkin, N. J., Ma, L., and Borhan, M. H. (2015). The Brassica napus receptor-like 20835.1
protein RLM2 is encoded by a second allele of the Lep3/Rlm2 blackleg resistance Taye, Z. M., Helgason, B. L., Bell, J. K., Norris, C. E., Vail, S., Robinson,
locus. Plant Biotechnol. J. 13, 983–992. doi: 10.1111/pbi.12341 S. J., et al. (2020). Core and differentially abundant bacterial taxa in
Frontiers in Sustainable Food Systems | www.frontiersin.org 14 April 2021 | Volume 5 | Article 613269You can also read