Latin Americans show wide-spread Converso ancestry and the imprint of local Native ancestry on physical appearance - bioRxiv
←
→
Page content transcription
If your browser does not render page correctly, please read the page content below
bioRxiv preprint first posted online Jan. 23, 2018; doi: http://dx.doi.org/10.1101/252155. The copyright holder for this preprint
 (which was not peer-reviewed) is the author/funder, who has granted bioRxiv a license to display the preprint in perpetuity.
                                    All rights reserved. No reuse allowed without permission.

             Latin Americans show wide-spread Converso ancestry and the imprint of
                          local Native ancestry on physical appearance

              Juan C. Chacón-Duque1, Kaustubh Adhikari1, Macarena Fuentes-Guajardo1,2, Javier
           Mendoza-Revilla1,3, Victor Acuña-Alonzo1,4, Rodrigo Barquera Lozano4,5, Mirsha Quinto-
          Sánchez6, Jorge Gómez-Valdés7, Paola Everardo Martínez8, Hugo Villamil-Ramírez9, Tábita
          Hünemeier10, Virginia Ramallo11,12, Caio C. Silva de Cerqueira12, Malena Hurtado3, Valeria
            Villegas3, Vanessa Granja3, Mercedes Villena13, René Vásquez14, Elena Llop15, José R.
          Sandoval16, Alberto A. Salazar-Granara16, Maria-Laura Parolin17, Karla Sandoval18, Rosenda
            I. Peñaloza-Espinosa19, Hector Rangel-Villalobos20, Cheryl Winkler21, William Klitz22,
          Claudio Bravi23, Julio Molina24, Daniel Corach25, Ramiro Barrantes26, Verónica Gomes27,28,
          Carlos Resende27,28, Leonor Gusmão27,28,29, Antonio Amorim27,28,30, Yali Xue31, Jean-Michel
          Dugoujon32, Pedro Moral33, Rolando Gonzalez-José11, Lavinia Schuler-Faccini12, Francisco
            M. Salzano12, Maria-Cátira Bortolini12, Samuel Canizales-Quinteros9, Giovanni Poletti3,
            Carla Gallo3, Gabriel Bedoya34, Francisco Rothhammer15,35, David Balding1,36 , Garrett
                                  Hellenthal1*† and Andrés Ruiz-Linares37,38*†

         1
          Department of Genetics, Evolution and Environment and UCL Genetics Institute,
         University College London, London, UK.
         2
          Departamento de Tecnología Médica, Facultad de Ciencias de la Salud, Universidad de
         Tarapacá, Arica, Chile.
         3
          Laboratorios de Investigación y Desarrollo, Facultad de Ciencias y Filosofía, Universidad
         Peruana Cayetano Heredia, Lima, Peru.
         4
          Molecular Genetics Laboratory, Escuela Nacional de Antropología e Historia, Mexico City,
         Mexico.
         5
          Department of Archaeogenetics, Max Planck Institute for the Science of Human History,
         Jena, Germany.
         6
          Ciencia Forense, Facultad de Medicina, Universidad Nacional Autónoma de México,
         Mexico City, Mexico.
         7
          Posgrado en Antropología Física, Escuela Nacional de Antropología e Historia, Mexico
         City, Mexico.
         8
          Posgrado en Antropología, Universidad Nacional Autónoma de México, Mexico City,
         Mexico.
         9
          Unidad de Genómica de Poblaciones Aplicada a la Salud, Facultad de Química,
         Universidad Nacional Autónoma de México e Instituto Nacional de Medicina Genómica,
         Mexico City, Mexico.
         10
           Departamento de Genética e Biología Evolutiva, Instituto de Biociências, Universidade de
         São Paulo, Sao Paulo, Brazil.
         11
          Instituto Patagónico de Ciencias Sociales y Humanas-Centro Nacional Patagónico,
         CONICET, Puerto Madryn, Argentina.
         12
           Departamento de Genética, Universidade Federal do Rio Grande do Sul, Porto Alegre,
         Brazil.

                                                                       1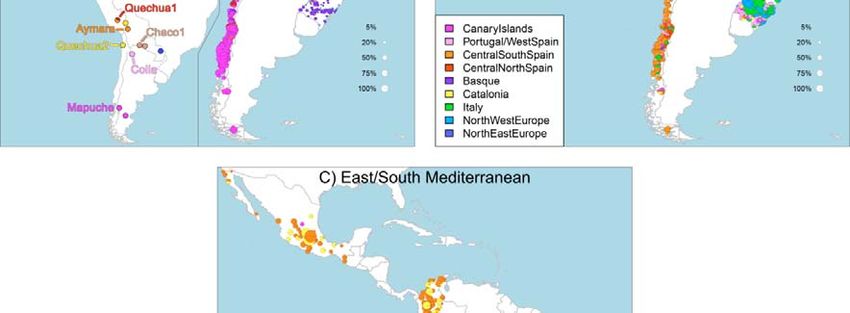
bioRxiv preprint first posted online Jan. 23, 2018; doi: http://dx.doi.org/10.1101/252155. The copyright holder for this preprint
 (which was not peer-reviewed) is the author/funder, who has granted bioRxiv a license to display the preprint in perpetuity.
                                    All rights reserved. No reuse allowed without permission.

         13
           Instituto Boliviano de Biología de Altura (IBBA), Universidad Mayor de San Andrés
         (UMSA), La Paz, Bolivia.
         14
           Instituto Boliviano de Biología de Altura (IBBA), Universidad Autónoma Tomás Frías,
         Potosí, Bolivia.
         15
           Programa de Genetica Humana, ICBM, Facultad de Medicina, Universidad de Chile,
         Santiago, Chile.
         16
              Facultad de Medicina Humana, Universidad de San Martín de Porres, Lima, Peru.
         17
          Instituto de Diversidad y Evolución Austral (IDEAus), Centro Nacional Patagónico,
         CONICET, Puerto Madryn, Argentina.
         18
          National Laboratory of Genomics and Biodiversity (LANGEBIO), CINVESTAV, Irapuato,
         Mexico.
         19
          Department of Biological Systems, Division of Biological and Health Sciences,
         Universidad Autónoma Metropolitana-Xochimilco, Mexico City, Mexico.
         20
          Instituto de Investigación en Genética Molecular, Universidad de Guadalajara, Ocotlán,
         Mexico.
         21
              National Cancer Institute, Frederick, MD, USA.
         22
              Integrative Biology, University of California, Berkeley, CA, USA.
         23
              Instituto Multidisciplinario de Biología Celular, CONICET, La Plata, Argentina.
         24
              Centro de Investigaciones Biomédicas de Guatemala, Ciudad de Guatemala, Guatemala.
         25
          Servicio de Huellas Digitales Genéticas and CONICET, Universidad de Buenos Aires,
         Buenos Aires, Argentina.
         26
              Escuela de Biología, Universidad de Costa Rica, San José, Costa Rica.
         27
           Instituto de Patologia e Inmunologia Molecular da Universidade do Porto (IPATIMUP),
         Porto, Portugal.
         28
              Instituto de Investigação e Inovação em Saúde (i3S), University of Porto, Porto, Portugal.
         29
           DNA Diagnostic Laboratory (LDD), State Universidade do Estado do Rio de Janeiro, Rio
         de Janeiro, Brazil.
         30
              Faculty of Sciences, University of Porto, Porto, Portugal.
         31
              The Wellcome Trust Sanger Institute, Hinxton, UK.
         32
           Centre National de la Recherche Scientifique, Université Toulouse 3 Paul Sabatier,
         Toulouse, France.
         33
           Departament de Biologia Animal-Antropologia, Universitat de Barcelona, Barcelona,
         Spain.
         34
              Genética Molecular (GENMOL), Universidad de Antioquia, Medellín, Colombia.
         35
              Instituto de Alta Investigación, Universidad de Tarapacá, Arica, Chile.
         36
          Schools of BioSciences and Mathematics & Statistics, University of Melbourne,
         Melbourne, Australia.
         37
           Ministry of Education Key Laboratory of Contemporary Anthropology and Collaborative
         Innovation Center of Genetics and Development, Fudan University, Shanghai, China.

                                                                       2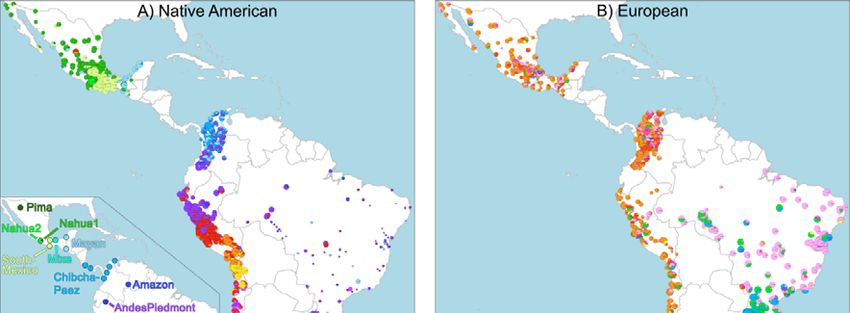
bioRxiv preprint first posted online Jan. 23, 2018; doi: http://dx.doi.org/10.1101/252155. The copyright holder for this preprint
 (which was not peer-reviewed) is the author/funder, who has granted bioRxiv a license to display the preprint in perpetuity.
                                    All rights reserved. No reuse allowed without permission.

         38
              Aix-Marseille Univ, CNRS, EFS, ADES, Marseille, France.
         * Correspondence to: andresruiz@fudan.edu.cn (A.R.-L.); g.hellenthal@ucl.ac.uk (G.H.)
         † Joint last authors

         Historical records and genetic analyses indicate that Latin Americans trace their
         ancestry mainly to the admixture of Native Americans, Europeans and Sub-Saharan
         Africans1. Using novel haplotype-based methods here we infer the sub-populations
         involved in admixture for over 6,500 Latin Americans and evaluate the impact of sub-
         continental ancestry on the physical appearance of these individuals. We find that pre-
         Columbian Native genetic structure is mirrored in Latin Americans and that sources of
         non-Native ancestry, and admixture timings, match documented migratory flows. We
         also detect South/East Mediterranean ancestry across Latin America, probably
         stemming from the clandestine colonial migration of Christian converts of non-
         European origin (Conversos). Furthermore, we find that Central Andean ancestry
         impacts on variation of facial features in Latin Americans, particularly nose
         morphology, possibly relating to environmental adaptation during the evolution of
         Native Americans.
                 Genetic studies can provide refined insights into human population history. Recently
         developed haplotype-based methods have been shown to provide higher resolution than
         allele-based approaches for examining patterns of human population sub-structure2. A recent
         application of these methods enabled a detailed analysis of the population structure of the
         population of the British Isles, matching fine-grained historical events3. Other than
         contributing to historical reconstruction, a fine-grained analysis of patterns of population
         genetic sub-structure is of interest for assessing the genetic basis of geographic variation in
         human phenotypes. For instance, although the impact of continental ancestry on physical
         appearance is well established4, little is known about the genetic basis of variation in physical
         appearance within continental human populations. The inter-continental admixture history of
         Latin America makes it an ideal setting in which to examine patterns of sub-continental
         genetic structure, the historical correlates of this structure and its impact on physical
         appearance.
                 We examined data for over 500,000 autosomal SNPs typed in more than 6,500
         individuals born in Brazil, Chile, Colombia, Mexico and Peru (denoted the CANDELA
         sample, Supplementary Fig. 1). To infer ancestry in this sample, we collated data for 2,359
         individuals from 117 reference populations (including 430 newly genotyped individuals from
         42 populations) representing five major bio-geographic regions: Native Americans;
         Europeans; East/South Mediterraneans; Sub-Saharan Africans and East Asians (Fig. 1A,
         Supplementary Table 1, Supplementary Fig. 2). We grouped the reference population
         individuals into 56 homogeneous clusters based on patterns of haplotype sharing, using the
         program fineSTRUCTURE2 (Supplementary Tables 2 and 3). We inferred the proportion of
         the genome in each CANDELA individual that is most closely related to individuals in each
         of these 56 reference clusters, using a novel approach we term SOURCEFIND (see Methods).
         In contrast to other haplotype-based approaches3,5, SOURCEFIND uses a Bayesian model
         that eliminates contributions that cannot be reliably distinguished from background noise.
         Simulations show that SOURCEFIND has greater accuracy than other approaches used to
         examine sub-continental ancestry (Supplementary Note 1). For ease of visualization, we
         collapsed the ancestry components inferred from these 56 clusters into 35 groups, based on
         the genetic relatedness of the clusters (Supplementary Fig. 3).

                                                                       3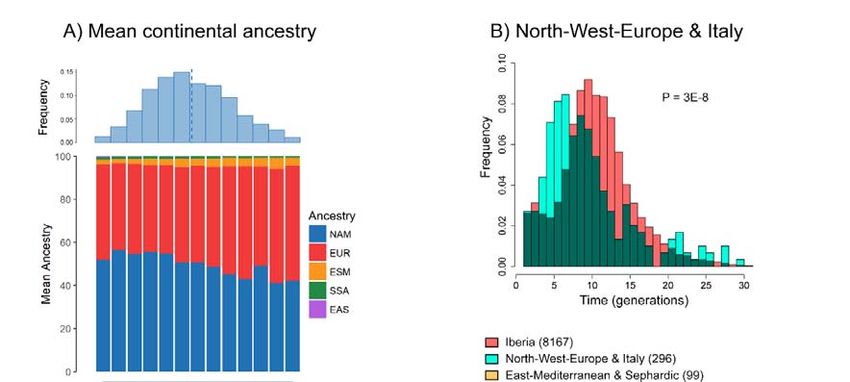
bioRxiv preprint first posted online Jan. 23, 2018; doi: http://dx.doi.org/10.1101/252155. The copyright holder for this preprint
(which was not peer-reviewed) is the author/funder, who has granted bioRxiv a license to display the preprint in perpetuity.
All rights reserved. No reuse allowed without permission.
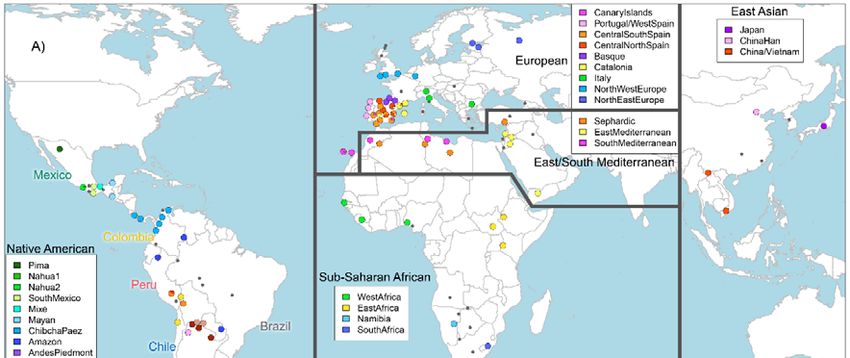
Allele-based analyses have previously documented that broad patterns of Native
American population structure are detectable in admixed Latin Americans6,7. SOURCEFIND
analysis extends these results by enabling the inference of 25 Native American ancestry
components across Latin America, resulting in a high-resolution picture of Native variation in
the region (Figures 1B and 2A) and emphasizing the “genetic continuity” of pre-Columbian
and admixed populations across the Americas. In addition, SOURCEFIND distinguishes
between closely-related ancestry components from the Iberian Peninsula, as well as from the
East and South Mediterranean (including individuals self-identified as Sephardic; i.e. Iberian
Jews). The distribution of European ancestry in the CANDELA sample shows a sharp
differentiation between Brazil and the Spanish American countries (Fig. 1C). In Brazil the
predominant European sub-component matches mostly the Portugal/West-Spain reference
group while in Mexico, Colombia, Peru and Chile mostly Central/South-Spanish ancestry is
inferred (Figures 1C and 2B). This differentiation matches the colonial history, Portuguese
migration having concentrated in Eastern South America while the Spanish settled mainly in
Central America and Western South America1. The relatively small contribution inferred for
the Basque and Catalan agrees with historical information documenting that Spanish migrants
to America originated mainly in Southern and Central Spain8. In addition, the Brazilian
sample shows substantial Italian and German ancestry, and these components concentrate in
the South of the country. This pattern is consistent with the documented migration to
Southern Brazil of large numbers of Germans and Italians in the late 19th century9.
To assess the time-frame of admixture between the ancestry components described
above we used the program GLOBETROTTER5. Since admixture proportions in Latin
Americans vary greatly, we analyzed each individual separately; simulations confirmed the
accuracy of GLOBETROTTER in this setting (Supplementary Note 1). Inferred dates for
events involving Iberian components had a median of 10 generations (IQR=7-13), consistent
with other estimates for admixture in Latin America6,10,11. Noticeably, individuals with more
recent inferred dates of admixture have greater Native ancestry (Fig. 3A, Supplementary
Table 4), consistent with continuing admixture between admixed Latin Americans and
unadmixed Natives, possibly as a result of the decline in Iberian immigration after the mid-
17th century, concomitant with the demographic recovery of neighboring Native American
populations12,13. Admixture involving the German or Italian components have a significant
skew towards more recent dates than admixture involving Iberians (Fig. 3B; Wilcoxon rank-
sum test one-sided p-value=3×10⁻⁸)9, consistent with the relatively recent arrival of Germans
and Italians.
SOURCEFIND finds that Sephardic/East/South Mediterranean ancestry is detectable
in all the countries sampled: Brazil (1%), Chile (4%), Colombia (3%), Mexico (3%) and Peru
(2%). Altogether, ~23% of the CANDELA individuals show >5% of such ancestry (Fig. 1D)
and in these individuals SOURCEFIND infers this ancestry to be mostly Sephardic (7.3%),
with smaller non-Sephardic East Mediterranean (3.9%) and non-Sephardic South
Mediterranean (1%) contributions. Individuals with Sephardic/East/South Mediterranean
ancestry were detected across Latin America (Fig. 2C). GLOBETROTTER estimates for the
time since Sephardic/East/South Mediterranean admixture were not significantly different
from those involving Iberian sources (Fig. 3C; Wilcoxon rank-sum test one-sided p-
value>0.1). It is possible that outliers with particularly high values of Sephardic/East/South
Mediterranean ancestry are descendants from recent non-European immigrants. For 19 of 42
individuals with >25% Sephardic/East/South Mediterranean ancestry genealogical
information (up to grandparents) identified recent ancestry in the Eastern Mediterranean.
However, no recent immigration was documented for Colombians with >5% Sephardic
ancestry, despite these individuals showing the highest estimated Sephardic ancestry across
4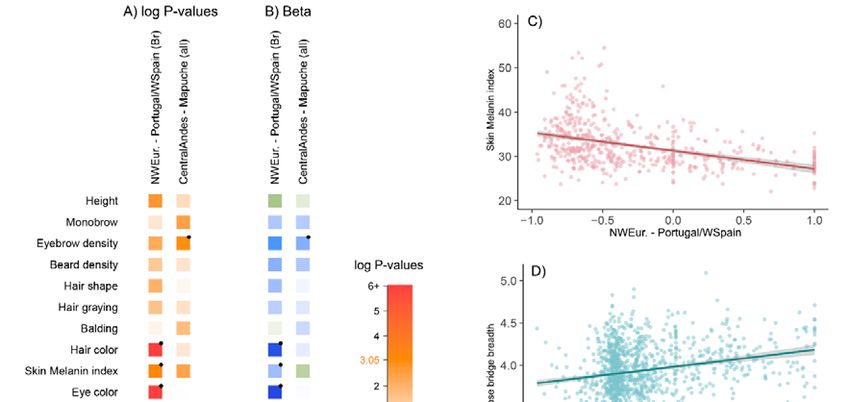
bioRxiv preprint first posted online Jan. 23, 2018; doi: http://dx.doi.org/10.1101/252155. The copyright holder for this preprint
 (which was not peer-reviewed) is the author/funder, who has granted bioRxiv a license to display the preprint in perpetuity.
                                    All rights reserved. No reuse allowed without permission.

         countries (10% on average, Fig. 1D). Jewish communities existed in Iberia (Sepharad) since
         roman times and much of the peninsula was ruled by Arabs and Berbers for most of the
         Middle Ages, by the end of which large Sephardic communities had developed14. Genetic
         studies have detected North and East Mediterranean ancestry in the current Spanish
         population, as well European admixture in the Sephardim15-17. The estimates of North and
         East Mediterranean (including Sephardic) ancestry in Latin Americans obtained here
         represent values over and above those present in our sampled present-day Spanish individuals,
         suggesting migration of individuals with higher levels of such ancestry to Latin America.
         Columbus’ arrival to the New World in the late 15th century coincided with the expulsion of
         Jews from Iberia, with the non-Christians remaining being forced to convert to Christianity.
         Although these Conversos were forbidden from migrating to the colonies, historical records
         document that some individuals made the journey, in an attempt to avoid persecution14. Since
         this was a clandestine process, the extent of Converso migration to Latin America is poorly
         documented. Genetic studies have provided suggestive evidence that certain Latin American
         populations, arguably with a peculiar history, could have substantial Converso ancestry1,18.
         Our findings indicate that the genetic signature of Converso migration to Latin America is
         substantially more prevalent than suggested by these special cases, or by historical records.
                 The average Sub-Saharan ancestry estimated in the full CANDELA sample is ~4%,
         reflecting the fact that regions which historically received large numbers of African slaves are
         under-represented4. SOURCEFIND infers a marked predominance of the West African sub-
         component, particularly in the Spanish American countries (Supplementary Figures 4 and 5),
         consistent with previous genetic analyses, and with historical information13,19. The
         distribution of dates involving Sub-Saharan African admixture mostly overlaps with that for
         Iberian admixture, although a substantial proportion of recent dates were also inferred (Fig.
         3D), possibly reflecting continuing admixture in the regions sampled. Historical information
         indicates some East Asian migration to Latin America, from the 19th century onwards9.
         SOURCEFIND estimates East Asian ancestry in the CANDELA sample to be, on average,
         very low (5% East Asian ancestry, this component is inferred to be most closely
         related to the Chinese and to a lesser extent the Japanese, except in Brazil where the opposite
         is found (Supplementary Fig. 6). GLOBETROTTER estimated dates for admixture involving
         an East Asian source were significantly more recent than those involving Iberian sources
         (median = 3, IQR 2-5 generations ago, Wilcoxon rank-sum test one-sided p-value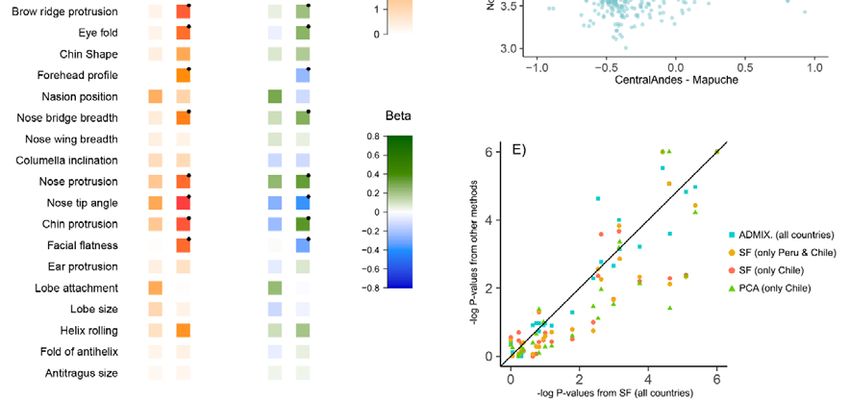
bioRxiv preprint first posted online Jan. 23, 2018; doi: http://dx.doi.org/10.1101/252155. The copyright holder for this preprint
 (which was not peer-reviewed) is the author/funder, who has granted bioRxiv a license to display the preprint in perpetuity.
                                    All rights reserved. No reuse allowed without permission.

         protrusion being associated with higher Mapuche ancestry (Fig. 4D). Validation analyses
         limited to Peru and Chile or only to Chile, using the ancestry components inferred by
         SOURCEFIND as well as related components obtained with ADMIXTURE or PCA
         (Supplementary Figures 7 and 8, Supplementary Note 3), produced similar results (Fig. 4E,
         Supplementary Note 4). It is noticeable that regional Native American ancestry impacts on
         nose shape. The Mapuche component is strongly associated with a less protruded nose (P-
         value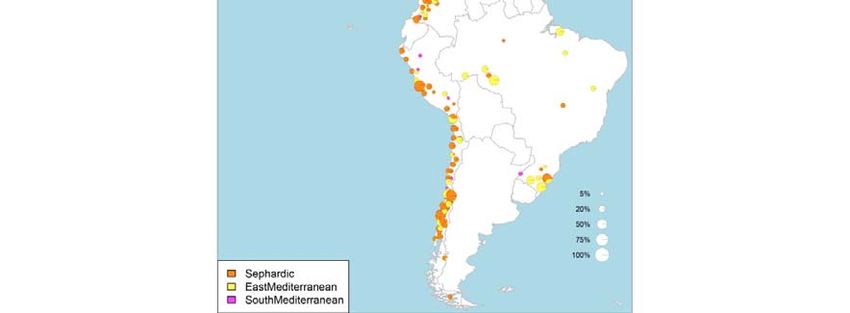
bioRxiv preprint first posted online Jan. 23, 2018; doi: http://dx.doi.org/10.1101/252155. The copyright holder for this preprint
 (which was not peer-reviewed) is the author/funder, who has granted bioRxiv a license to display the preprint in perpetuity.
                                    All rights reserved. No reuse allowed without permission.

         42 were newly genotyped population samples (comprising 27 Native American, 7 European
         and 8 East/South Mediterranean), including a total of 430 individuals. These individuals
         were genotyped on the Illumina HumanOmniExpress chip which includes 730,525 SNPs.
         PLINK v1.926,27 was used to exclude SNPs and individuals with more than 5% missing data,
         markers with minor allele frequency 40% and one Libyan with Sub-Saharan
         African ancestry of 79%; both of these populations have an estimated average Sub-Saharan
         African ancestry of ~20% +/- 3%).

              After QC, the merged CANDELA + reference population dataset comprised genotypes
         for 546,780 autosomal SNPs in 8,647 individuals (including 6,589 Latin Americans and
         2,058 individuals from the reference population samples).

         Phasing of genotype data

              Phasing of the merged dataset was performed with SHAPEIT229 using default
         parameters. Genetic distances used were obtained from the HapMap Phase II genetic map
         build GRCh3730. Missing genotypes for any SNP (less than 5% after the QC) were imputed
         during the phasing process.

         Inference of haplotype similarity patterns

               CHROMOPAINTER2 was used to infer haplotype similarity (informally, “chromosome
         painting”) across individuals. We set-up the software to provide estimates of the proportion
         of DNA in every CANDELA and reference population individual (denoted recipients) that is
         most closely related to each reference population individual (denoted donors), allowing us to
         reconstruct haplotype similarity profiles for all individuals in terms of the reference samples.
         The recombination scaling constant  and the mutation parameter θ used by
         CHROMOPAINTER were jointly estimated for every individual in a subset of chromosomes
         (1, 6, 13 and 22) with 10 Expectation-Maximization steps, starting from default values
         defined by the software. The average  and θ values across chromosomes (weighted by
         chromosome size) were then used for subsequent CHROMOPAINTER runs on all autosomes
         ( = 290.83 and θ = 0.00038). Genetic distances from the HapMap Phase II genetic map
         build GRCh37 were used in the CHROMOPAINTER runs. CANDELA individuals with
         >99% European ancestry (52 Brazilians, of which 37 reported German and 15 Italian

                                                                       7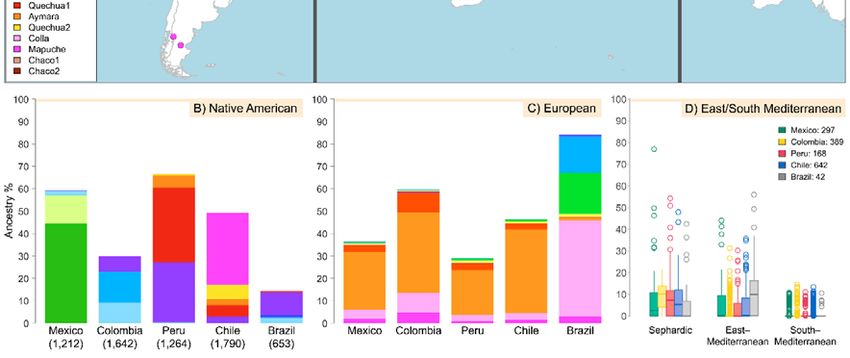
bioRxiv preprint first posted online Jan. 23, 2018; doi: http://dx.doi.org/10.1101/252155. The copyright holder for this preprint
 (which was not peer-reviewed) is the author/funder, who has granted bioRxiv a license to display the preprint in perpetuity.
                                    All rights reserved. No reuse allowed without permission.

         ancestors) or with >95% Native American ancestry (1 Colombian, 22 Mexicans, 65 Chileans
         and 17 Peruvians) were included amongst the donors as they may harbour ancestry
         components not present in our reference dataset. In Supplementary Note 5 we show how that
         our conclusions about ancestry are similar if these individuals are excluded from the
         reference dataset. In total, 157 CANDELA individuals and 1,942 reference individuals were
         added to the panel of donors, for a total of 2,099 samples. The remaining 116 individuals
         from the initial reference dataset were excluded. Of these 80 were Native Americans with
         less than 95% Native ancestry, and 36 were Native Americans excluded after the haplotype-
         based clustering analyses performed to select the reference panel for the ancestry inference,
         as explained in the next section.

         Definition of homogeneous clusters of reference population individuals

               To evaluate genetic structure in the reference data, independent of population sample
         labels, we used fineSTRUCTURE2, a program that defines homogeneous clusters of
         individuals based on the similarity of the haplotype copying profiles obtained by
         CHROMOPAINTER. To run fineSTRUCTURE, a likelihood adjustment factor (c) is initially
         calculated in order to account for the inaccurate assumption that the amount of DNA
         matching among individuals is independent. Using default CHROMOPAINTER settings to
         infer the adjustment factor, this was estimated as c=0.236. Two MCMC runs were performed
         using 2,000,000 iterations (sampling every 10,000). Following Leslie et al. 20153, for each
         run the sample with maximum posterior probability was selected and an additional 100,000
         hill-climbing moves were then performed to search for merges or splits that further improve
         the overall model likelihood 2. After this procedure, fineSTRUCTURE classified individuals
         into 129 clusters. In order to reduce the number of clusters potentially representing sources of
         ancestry in Latin America, to avoid problems related to collinearity between different
         surrogate sources when estimating ancestry, and to facilitate interpretation of the results, we
         carried out the refinements described below, leading to the re-assignment of individuals from
         these 129 clusters into 117 “donor clusters”. Of these, 56 were considered “surrogate
         clusters” for inferring sub-continental ancestry in the CANDELA individuals (as described in
         the section “A new haplotype-based estimation of ancestry” below). The refinements were as
         follows:

              First, we checked the consistency of the assignments of every individual into a given
         cluster. We excluded all individuals that were assigned to a different cluster more than 10%
         of the time across samples in the last 1,000,000 iterations of the two fineSTRUCTURE runs,
         and 5 clusters where all individuals were inconsistent across these samples. We also excluded
         12 individuals assigned to their own unique clusters, and 10 small clusters made of either a
         small number of individuals from distant populations or from populations present in other
         clusters with greater numbers.

              Next, we used the remaining clusters (i.e. those not set aside above) to perform an initial
         estimation of sub-continental ancestry in the CANDELA samples using a modification of the
         Non-Negative Least Squares (NNLS) regression approach3,5. We excluded individuals from
         17 clusters that based on this analysis did not contribute to the CANDELA samples.
         Furthermore, based on the tree inferred by fineSTRUCTURE and on Total Variation
         Distance (TVD) (e.g. as used in Leslie et al. 20153), we merged 29 remaining clusters that
         were difficult to distinguish from one another into 13 groups. After these steps, there were 69
         clusters remaining intact from the original 129 (a subset of which became the final 56
         “surrogate clusters” as described in the next paragraph).

                                                                       8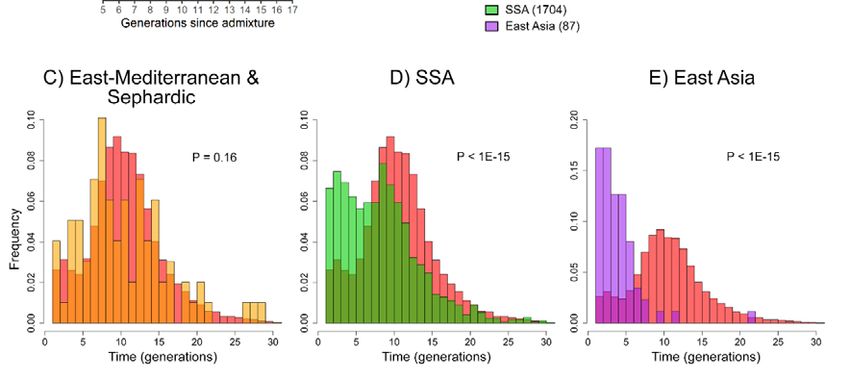
bioRxiv preprint first posted online Jan. 23, 2018; doi: http://dx.doi.org/10.1101/252155. The copyright holder for this preprint
 (which was not peer-reviewed) is the author/funder, who has granted bioRxiv a license to display the preprint in perpetuity.
                                    All rights reserved. No reuse allowed without permission.

               We next took all individuals that had been excluded as described above and reclassified
         them into 48 clusters based on population label information. This resulted in 117 “donor
         clusters” that we use throughout. Supplementary Table 2 lists how individuals from the initial
         129 fineSTRUCTURE clusters were classified into the 117 donor clusters. We then
         performed a few additional steps to define the final 56 “surrogate clusters”, starting from 69
         “intact” clusters described above, using the modified NNLS regression approach 3,5. In
         particular, we checked if closely related clusters could potentially contribute to collinearity
         issues in subsequent analyses or if they had complex ancestry profiles that could eventually
         complicate the interpretation of the results. To perform the regression analysis, the
         proportions of DNA that each individual from the 69 clusters matches to each donor as
         estimated by CHROMOPAINTER were summed across donors within each of the 117 donor
         groups defined above. For each individual from the 69 clusters, this produces a vector of 117
         variables that we call a “copying vector”, with each variable the proportion of DNA that this
         individual copies from (i.e. matches to) all individuals contained in that donor group. For
         each of the 69 clusters, we averaged these copying vectors across all individuals assigned to
         that cluster, creating a unique copying vector for each of the 69 clusters. Then, for each of
         these 69 clusters, we performed a NNLS regression with the copying vector of that cluster as
         the response and the copying vectors for all 68 other clusters as predictors. From these
         analysis, 7 clusters (whose individuals belong to the Native American populations Uros,
         Kogi, Karitiana, Surui, Ticuna and Mixe (Supplementary Table 2)) with considerable levels
         of genetic drift (as evidenced by the amount of haplotype similarity within their own cluster
         and the fact that their painting profile, as interpreted by NNLS, cannot be explained as
         mixtures of other populations) and no contributions to the CANDELA samples were
         excluded; these clusters were also removed from the donors for subsequent analyses given
         their high amounts of genetic drift. An additional 6 clusters showing complex signals in
         NNLS analyses were also excluded based on the following criteria: (i) the cluster contributed
         to the ancestry profiles of several surrogate groups of interest and (ii) the cluster showed
         ancestry from more than two continental groups. For instance, in the case of (i) we excluded
         Sardinia as it was contributing high amounts (~15%) to the ancestry of Portugal/WestSpain,
         Catalonia and Italy. The best example for (ii) is Turkey, which was inferred to have >5%
         ancestry from an East Asian source and 5% from a European one. These analyses resulted in
         the 69 “intact” clusters being reduced to 56 “surrogate clusters” that are made of 1,444
         individuals from the reference panel. Supplementary Table 3 details the individual makeup of
         these 56 clusters, in terms of the population sample labels. Supplementary Figure 3 shows a
         phylogenetic tree relating these clusters and allowing the definition of 35 “surrogate groups”
         based on their genetic similarity.

         SOURCEFIND: A new haplotype-based estimation of ancestry

              The 56 surrogate clusters defined above were used for inferring the ancestral population
         contributions to admixture in Latin America. We generated copying vectors for each
         CANDELA individual and for each individual included in the 56 surrogate clusters by
         summing the proportion of DNA that every individual matched to individuals from the 117
         donor clusters defined in the previous section. To cope with differences in surrogate cluster
         size and improve resolution, we modelled the copying vector of each CANDELA individual
         as a weighted mixture of the copying vectors from the surrogates3,5. To do so, we introduce a
         model-based approach we term SOURCEFIND, which outperforms the NNLS approach
         taken in Leslie et al. 20153. Below we describe the SOURCEFIND algorithm.

                                                                       9
bioRxiv preprint first posted online Jan. 23, 2018; doi: http://dx.doi.org/10.1101/252155. The copyright holder for this preprint
(which was not peer-reviewed) is the author/funder, who has granted bioRxiv a license to display the preprint in perpetuity.
All rights reserved. No reuse allowed without permission.
Let , … , be the copying vector describing the total genome length (in cM)
that a recipient individual (or group) copies from each of the 1, … , 117 donor
clusters as inferred by CHROMOPAINTER (Note that copying vectors can also be averaged
across recipients to perform the analysis in groups). Here for any , ∑
, where is
ೝ
equal to the total genome length of DNA (in cM), and we further define . Henceforth
we let r denote a CANDELA individual, and s denote a surrogate cluster. In the latter case,
represents an average across all individuals from that surrogate cluster.
We assume that:
| , … , %
, ,
! "; $
,…,$
Where
are the mixture coefficients we aim to infer and every &
,…,
1, … , ' 56 represents a surrogate cluster used to describe the ancestry of group r. In
practice, often all the donor clusters are used as surrogates, so that ' . However, in our
case the surrogates are a subset of the donors so that ' * .
We take a Bayesian approach to inferring , further assuming the following:
|+
Dirichlet + , … , + ,
+ Uniform0,10.
For each recipient r, we wish to sample the mixing coefficients , … , based on
their posterior probabilities conditional on , , … . We do so using the following
Markov Chain Monte Carlo (MCMC) technique. We start with an initial value of λ(0) = 0.5
and sample our initial values of 0 0, … , 0 from the prior distribution
Dirichlet +0, … , +0. Then for 1, … , :
Update
, … ,
using a Metropolis-Hastings (M-H) step:
i. Randomly sample ;~=
0,0.1.
ii. Randomly sample a surrogate & and set ೣ ೣ > 1 ? ;⁄5. For
numerical stability, if ೣ A 1 > 1B , set ೣ 1 > 1B .
Repeat this for 4 additional randomly sampled (with replacement) surrogates & .
iii. Randomly sample a surrogate & and set ೣ ೣ > 1 > ;⁄5. For
numerical stability, if ೣ * 1 > 1B , set ೣ 1B .
Repeat this for 4 additional randomly sampled (with replacement) surrogates &
iv. For all other surrogates & 1, … , ', excluding the randomly sampled set above,
set > 1.
v. Re-scale ∑
1.0.
vi. Accept with probability min C ,1.0, where:
ೝ భ ,…,ೄ ,,ೝ ೝ |
.
ೝ భ ,…,ೄ ,,ೝ ೝ |
D
10bioRxiv preprint first posted online Jan. 23, 2018; doi: http://dx.doi.org/10.1101/252155. The copyright holder for this preprint
(which was not peer-reviewed) is the author/funder, who has granted bioRxiv a license to display the preprint in perpetuity.
All rights reserved. No reuse allowed without permission.
Update each + for & 1, … , ' using a M-H step:
i. Propose a new + from a Normal + > 1, & 0.2.
ii. Automatically reject if + F 0,10.
iii. Otherwise accept + with probability min C ,1.0), where:
ೝ|
.
ೝ |
D
For large M, this algorithm is guaranteed to converge to the true posterior distribution of
the ’s (e.g. Gamerman 199731). In practice, we used M=200,000, sampling every 1,000
iterations. Also, for each recipient individual r, we combined results across 50 independent
runs of the above procedure, extracting the estimates with the highest posterior probability in
each run and then taking a weighted (by posterior probability) average of these 50 estimates.
We refer to the final estimates of , … , , weighted by posterior values, as our inferred
proportions of ancestry for individual r conditional on this set of S surrogates. This approach
differs from the mixture model procedure described in3,5,32-34 in that it assumes that is
multinomial distributed and solves for using a Bayesian approach rather than a non-
negative least squares optimization. The model is similar to the one described in35, but
introduces new improvements in the way that λ is estimated and in the MCMC proposal
procedure.
The accuracy and robustness of the ancestry estimations obtained by SOURCEFIND
and NNLS were evaluated using simulations mimicking Latin American admixture
(Supplementary Note 1).
SOURCEFIND is available upon request from g.hellenthal@ucl.ac.uk
Estimation of the number of generations since admixture
The times and sources of major admixture events were inferred using the program
GLOBETROTTER5. GLOBETROTTER tests for evidence of one or more pulses of
admixture between two or more ancestral groups, and dates these admixture events and infers
the genetic make-up of the admixing groups involved. Due to the recent nature of intermixing
in the Americas, admixture times and proportions may vary substantially across CANDELA
individuals. Therefore we tested each individual separately, restricting this analysis to the
6,352 individuals inferred by SOURCEFIND to have ancestry from more than one surrogate
cluster.
For each haploid genome of each individual, we used 10 random samples of genome-
wide local matching to donor clusters per haplotype as provided by the CHROMOPAINTER
analysis described above. For each CANDELA individual, we ran GLOBETROTTER
including as surrogates only the subset of 1% to that
individual, as inferred by SOURCEFIND. For each CANDELA individual,
GLOBETROTTER categorized admixture inference into one of three types: (i) one date of
admixture involving two sources, (ii) one date of involving more than two sources
(suggestive of a admixture among multiple genetically different groups within a short time
span), and (iii) multiple dates of admixture between two or more sources (not necessarily the
same two), suggesting a more complicated history but which GLOBETROTTER attempts to
describe as two major pulses of admixture.
Altogether, for 55.4% of the CANDELA individuals (3519/6352) GLOBETROTTER
inferred a single admixture event between two source groups, while in 44.6% of the
CANDELA individuals (2833/2378) a more complex admixture was inferred. This could
11bioRxiv preprint first posted online Jan. 23, 2018; doi: http://dx.doi.org/10.1101/252155. The copyright holder for this preprint
(which was not peer-reviewed) is the author/funder, who has granted bioRxiv a license to display the preprint in perpetuity.
All rights reserved. No reuse allowed without permission.
consist of more than two groups admixing (Supplementary Fig. 9) and/or multiple dates of
admixture (Fig. 3B, Supplementary Table 6). For simplicity, the inferred admixture history of
these latter individuals was described as two distinct events, with each event characterised as
having two admixing groups and a single date of admixture. In total GLOBETROTTER
inferred 9,185 such admixture events (Supplementary Table 6). For simplicity, we represent
the two admixing sources using GLOBETROTTER's “best-guess” results, which describes
each admixing source by the single (included) surrogate group out of 56 that is inferred to be
most genetically similar to that (unknown) admixing source group.
To convert the time estimates obtained by GLOBETROTTER (in generations) into
years, we used the formula y=1990-28*(g+1), where y is the year of admixture, 1990 is the
mean birth year in CANDELA individuals, g the estimated admixture time (in generations),
and taking 28 years as the generation time.
Testing for differences in the distributions of inferred admixture dates for different
source groups
In Figure 3, we plot histograms of inferred dates for each of the major geographic labels
“Iberia”, “NorthWestEurope & Italy”, “East Mediterranean & Sephardic”, “Sub-Saharan
African (SSA)” and “East Asia”. These plots contain the inferred dates for all admixture
events (out of 9,185) that involved a inferred source group categorized under that major
geographic label, with:
“Iberia”: CanaryIslands, Portugal/WestSpain, CentralSouthSpain, CentralNorthSpain,
Basque and Catalonia.
“NorthWestEurope & Italy”: Italy1 and NorthWestEurope1.
“East Mediterranean & Sephardic”: Sephardic1, EastMediterranean1 and
EastMediterranean2.
“Sub Saharan Africa”: WestAfrica1, WestAfrica2, WestAfrica3, EastAfrica1,
EastAfrica2, Namibia and SouthAfrica.
“East Asia”: Japan, ChinaHan, China/Vietnam1 and China/Vietnam2.
We used “wilcox.test” in R36 to perform a one-sided Wilcoxon rank-sum test (also
known as a Mann-Whitney U test) to test the alternative hypothesis that the distribution of
admixture dates for each geographic label X= {“East Asia”, “NorthWestEurope & Italy”,
“East Mediterranean & Sephardic”, “SSA”} is skewed towards more recent dates relative to
the “Iberia” geographic label, versus the null hypothesis that distributions are the same.
Though they may represent genuine admixture events, for these tests and the histograms of
Figure 3 we removed events with an inferred date of 1. This was done both to avoid such
dates dominating inference due to their high frequency (8% of all events in Iberia have
inferred dates of 1, with East Asia = 21%, NorthWestEurope & Italy = 6%, East
Mediterranean & Sephardic = 10%, SSA = 13%) and because such events have been
interpreted as evidence of “no admixture” in past applications of GLOBETROTTER (e.g. 5).
For the Wilcoxon rank-sum test, we further excluded individuals with = 30 generations to avoid admixture events that occurred prior to
colonial-era migrations. In addition, this analysis assumes each inferred event is an
independent observation, even though some individuals have two inferred events. However,
we note that conclusions and trends do not change if we restrict to one inferred event per
individual (results omitted), e.g. by excluding individuals who infer multiple dates of
admixture (i.e. case (iii) described in “Estimation of number of generations since admixture”
12bioRxiv preprint first posted online Jan. 23, 2018; doi: http://dx.doi.org/10.1101/252155. The copyright holder for this preprint
(which was not peer-reviewed) is the author/funder, who has granted bioRxiv a license to display the preprint in perpetuity.
All rights reserved. No reuse allowed without permission.
above) and only including the more strongly signaled event in individuals who infer more
than two sources of admixture at the same time (i.e. case (ii) described in “Estimation of
number of generations since admixture” above).
Association of sub-continental ancestry with physical features
We recorded 28 physical appearance traits, by physical examination of the volunteers
and/or by examining facial photographs. These traits have been described in detail
previously4,22,24,25 and brief definitions are provided in Supplementary text 5.
To evaluate the phenotypic effect of sub-continental ancestry components defined by
SOURCEFIND we used linear regression. Since these components are (negatively) correlated
with other major continental ancestries, using them directly would cause confounding in the
linear model. We therefore performed linear regression analysis including a contrast between
subcontinental ancestry components. To maximize power, we defined three criteria for
making these contrasts: (i) each component tested should have at least 10% frequency in a
country (ii) the two sub-continental ancestry components contrasted should add up to at least
half of the total continental ancestry in a country and (iii) the components contrasted should
show a relatively high genetic differentiation.
These criteria only allowed one contrast to be made based on the European components
(Fig. 1): that between North-West Europe and Portugal/West-Spain in Brazil. In addition,
merging the closely related Quechua1, Quechua2, Colla and Aymara into a “Central Andean”
component, enabled a Native American contrast based on the SOURCEFIND analysis.
Similar components were defined by Principal Component (PC) 7 (Supplementary Fig. 8)
and by ADMIXTURE at K=7 (Supplementary Fig. 7), which we tested for consistency.
The basic regression model tested was:
Phenotype ~ Age + Sex + Socioeconomic status + Total Sub Saharan African ancestry +
Total European ancestry + Native component contrast,
or,
Phenotype ~ Age + Sex + Socioeconomic status + Total Sub Saharan African ancestry +
Total Native American ancestry + European component contrast.
For facial traits, BMI was included as a covariate. When doing a multi-country analysis we
also used country as dummy variable. To reduce variability from other continental ancestries,
we excluded individuals with high Sub Saharan African or East/South Mediterranean
ancestry and individuals with >1% East Asian ancestry.
Differences in allele frequencies of GWAS hits in Mapuche and Central Andean
populations
To test whether allele frequencies differed between individuals with Mapuche versus
Central Andean ancestry at loci previously identified as being associated with facial
features22, we first inferred the allele frequencies at these loci in each of the Mapuche and
Central Andean populations. As we have relatively few reference individuals with Mapuche
and Central Andean ancestry, we inferred allele frequencies by combining these reference
samples with admixed Candela individuals that were inferred to carry the appropriate Native
ancestry at these loci.
To do so, we used the software RFMix37 to infer local continental ancestry in the subset
of phased Candela individuals described earlier. Three continental reference panels
13bioRxiv preprint first posted online Jan. 23, 2018; doi: http://dx.doi.org/10.1101/252155. The copyright holder for this preprint
(which was not peer-reviewed) is the author/funder, who has granted bioRxiv a license to display the preprint in perpetuity.
All rights reserved. No reuse allowed without permission.
(consisting of phased haplotpes for 107 IBS, 101 YRI and 125 Native American samples)
were used for this purpose. RFMix assigns local continental ancestry to each allele of each
Candela haplotype, allowing for errors in genotyping, slight admixture in the reference
samples, etc. Thus for each allele of each haplotype, it produces two files of relevance – the
local ancestry at that site, and the ‘putative’ allele at that site (after ‘fixing’ any such errors).
Using SOURCEFIND sub-continental ancestry proportions, two different sets of
Candela individuals were selected to obtain allele frequencies for Central Andes and
Mapuche groups. For each set, all individuals had >10% inferred ancestry from that Native
group, with 0.99) (the number of surrogate individuals with
>99% Native ancestry for the Mapuche group wasn’t large enough for such a comparison).
Allele frequencies were thus obtained for the index SNPs (among the chip data) of all
the six genomic regions identified in Adhikari et al. 201622. A t-test was used to assess
whether the allele frequencies were significantly different in Central Andes vs. Mapuche
individuals. The FDR (false discovery rate) procedure was used to control the Type-I error
rate at 0.05 level. After the FDR procedure, all SNPs showed a significant difference in allele
frequency between Central Andes & Mapuche. Furthermore, for each SNP, the allele with a
higher frequency in Central Andes compared to Mapuche had the same direction of effect
(same signs of regression coefficient beta) for that allele in the GWAS as compared to the
regression coefficient (beta, Fig. 4B) between the CentralAndes-Mapuche contrast and the
trait, for all traits that are associated at a genome-wide significant or suggestive significant
level with the SNP.
Acknowledgments: We are very grateful to the volunteers for their enthusiastic support for
this research. We thank Alvaro Alvarado, William Arias, Mónica Ballesteros Romero,
Ricardo Cebrecos, Miguel Ángel Contreras Sieck, Francisco de Ávila Becerril, Joyce
De la Piedra, María Teresa Del Solar, Gastón Macín, William Flores, Martha
Granados Riveros, Rosilene Paim, Ricardo Gunski, Sergeant João Felisberto Menezes
Cavalheiro, Major Eugênio Correa de Souza Junior, Wendy Hart, Ilich Jafet Moreno,
Claudia Jaramillo, Paola León-Mimila, Francisco Quispealaya, Diana Rogel Diaz,
Ruth Rojas and Vanessa Sarabia, for assistance with volunteer recruitment, sample
processing and data entry. We acknowledge the institutions that kindly provided
facilities for the assessment of volunteers: Escuela Nacional de Antropología e
Historia and Universidad Nacional Autónoma de México (México); Universidade
Federal do Rio Grande do Sul (Brazil); 13° Companhia de Comunicações Mecanizada
do Exército Brasileiro (Brazil); Pontificia Universidad Católica del Perú, Universidad
de Lima and Universidad Nacional Mayor de San Marcos (Perú). Ethics approval was
obtained from Universidad Nacional Autónoma de México (México), Universidad de
Antioquia (Colombia), Universidad Perúana Cayetano Heredia (Perú), Universidad de
Tarapacá (Chile), Universidade Federal do Rio Grande do Sul (Brazil) and University
College London (UK). We also thank the National Laboratory for the Genetics of
Israeli Populations (http://yoran.tau.ac.il/nlgip/) and Dr. David Gurwitz for making
14bioRxiv preprint first posted online Jan. 23, 2018; doi: http://dx.doi.org/10.1101/252155. The copyright holder for this preprint
(which was not peer-reviewed) is the author/funder, who has granted bioRxiv a license to display the preprint in perpetuity.
All rights reserved. No reuse allowed without permission.
available DNA samples. We thank Chris Tyler-Smith and Caroline Costedoat for
comments on the manuscript. This work was funded by grants from the Leverhulme
Trust (F/07 134/DF to A.R.-L.), BBSRC (BB/I021213/1 to A.R.-L.), Wellcome
Trust/Royal Society (098386/Z/12/Z to G.H.), Universidad de Antioquia (CODI
sostenibilidad de grupos 2013- 2014 and MASO 2013-2014), Conselho Nacional de
Desenvolvimento Científico e Tecnológico, Fundação de Amparo à Pesquisa do
Estado do Rio Grande do Sul (Apoio a Núcleos de Excelência Program) and
Fundação de Aperfeiçoamento de Pessoal de Nível Superior. V.G. is supported by
Fundação para a Ciência e Tecnologia (FCT) and Programa Operacional Potencial
Humano (POCH), through the grant SFRH/BPD/76207/2011. IPATIMUP integrates
the i3S Research Unit, which is partially supported by FCT. Y.X. was supported by
The Wellcome Trust (098051). J.C.C.-D. was supported by a doctoral scholarship
from COLCIENCIAS-Colombia.
Author contributions: J.C.C.-D., K.A., J.M.-R., M.F.-G., G.H. and A.R.-L. performed the
analyses. G.H. developed SOURCEFIND. J.C.C.-D., K.A., G.H. and A.R.-L. wrote
the paper with input from co-authors. All other authors contributed to volunteer
recruitment or collection of data. A.R.-L. coordinated the study.
Competing financial interests: The authors declare no competing financial interests.
Data availability: Raw genotype or phenotype data are not publicly sharable due to ethics
restrictions. GWAS summary statistics from the CANDELA consortium have been
deposited at GWAS central.
Software availability: SOURCEFIND is available upon request from
g.hellenthal@ucl.ac.uk.
Corresponding authors: andresruiz@fudan.edu.cn (A.R.-L.); g.hellenthal@ucl.ac.uk (G.H.)
15bioRxiv preprint first posted online Jan. 23, 2018; doi: http://dx.doi.org/10.1101/252155. The copyright holder for this preprint
(which was not peer-reviewed) is the author/funder, who has granted bioRxiv a license to display the preprint in perpetuity.
All rights reserved. No reuse allowed without permission.
FIGURES
Fig. 1. Reference population samples, fineSTRUCTURE groups and SOURCEFIND ancestry
estimates for the five Latin American countries examined. (A) Colored pies and grey dots
indicate the approximate geographic location of the 117 reference population samples
studied. These samples have been subdivided on the world map into five major bio-
geographic regions: Native Americans (38 populations), Europeans (42 populations),
East/South Mediterraneans (15 populations), Sub-Saharan Africans (15 populations) and East
Asians (7 populations). The coloring of pies represents the proportion of individuals from that
sample included in one of the 35 reference groups defined using fineSTRUCTURE (these
groups are listed in the color-coded insets for each region; Supplementary Fig. 2). The grey
dots indicate reference populations not inferred to contribute ancestry to the CANDELA
sample. Panels (B) and (C) show, respectively, the estimated proportion of sub-continental
Native American and European ancestry components in individuals with >5% total Native
American or European ancestry in each country sampled (the stacked bars are color-coded as
for the reference population groups shown in the insets of panel (A)). Panel (D) shows
boxplots of the estimated sub-continental ancestry components for individuals with >5% total
Sephardic/East/South Mediterranean ancestry. In this panel colors refer to countries as for the
colored country labels shown in (A).
16bioRxiv preprint first posted online Jan. 23, 2018; doi: http://dx.doi.org/10.1101/252155. The copyright holder for this preprint
(which was not peer-reviewed) is the author/funder, who has granted bioRxiv a license to display the preprint in perpetuity.
All rights reserved. No reuse allowed without permission.
Fig. 2. Geographic variation of Native American (A), European (B), and East/South
Mediterranean (C) ancestry sub-components in Latin American individuals. Each pie
represents an individual with pie location corresponding to birthplace. Since many
individuals share birthplace, jittering has been performed based on pie size and how crowded
an area is. Pie size is proportional to total continental ancestry and only individuals with >5%
of each continental ancestry are shown. Coloring of pies represents the proportion of each
sub-continental component estimated for each individual (color-coded as in Fig. 1; Chaco2
does not contribute >5% to any individual and was excluded). Pies in panel (C) have been
enlarged to facilitate visualization.
17bioRxiv preprint first posted online Jan. 23, 2018; doi: http://dx.doi.org/10.1101/252155. The copyright holder for this preprint
(which was not peer-reviewed) is the author/funder, who has granted bioRxiv a license to display the preprint in perpetuity.
All rights reserved. No reuse allowed without permission.
Fig. 3. Times since admixture estimated using GLOBETROTTER. Panel (A) Top: frequency
distribution of admixture times for individuals in which a single admixture event between
Native and European sources was inferred (dashed line indicates the mean). Bottom: mean
continental ancestry (%) as a function of time since admixture among these individuals. Only
time bins including >20 individuals are shown. (NAM= Native American, EUR = European,
ESM = East/South Mediterranean, SSA= Sub-Saharan African, EAS = East Asian). Panels
(B-E) show contrasts of the distribution of admixture times involving Iberian or other sources:
(B) North-West European/Italian (C) East Mediterranean/Sephardic (D) Sub-Saharan African
and (E) East Asian. P-values for the contrasts of the distributions are from a one-sided Mann-
Whitney U test.
18bioRxiv preprint first posted online Jan. 23, 2018; doi: http://dx.doi.org/10.1101/252155. The copyright holder for this preprint
(which was not peer-reviewed) is the author/funder, who has granted bioRxiv a license to display the preprint in perpetuity.
All rights reserved. No reuse allowed without permission.
Fig. 4. Effect of sub-continental genetic ancestry on physical appearance. (A) Regression
–log P-values for 28 traits (Supplementary Material) against the contrast between two sub-
continental ancestry components estimated by SOURCEFIND. The left column shows results
for the Portugal/West-Spain versus North-West Europe contrast in the Brazilian sample (Br).
The two right columns present the contrast between Central Andes versus Mapuche ancestry
in the full CANDELA sample. (B) Regression coefficients (Betas) in units of SD for the
contrasts in (A). In panels (A) and (B) color intensity reflects variation in -Log-P values or
beta coefficients, as indicated on the scale. Bonferroni-corrected significant values are
highlighted with a dot (–log P-value threshold of 3.05 for alpha=0.05). Panels (C) and (D)
display scatterplots and regression lines (with 95% confidence intervals) for two traits
showing significant association with variation in sub-continental ancestry: skin melanin index
in Brazilians (C) and nose bridge breadth in Chileans and Peruvians (D; Y-axis is in
Procrustes units). (E) Scatterplot of -Log P-values from follow-up analyses of the regression
of physical traits on the Central Andes versus Mapuche ancestry contrast. The X-axis refers
to -Log P-values from the primary analyses (using SOURCEFIND (SF) estimates and data
for all individuals, as shown in the second column of (A)). The Y-axis refers to -Log-P values
from four other regression analyses: using SOURCEFIND (SF) estimates restricted to
Peruvian and Chilean individuals, or only to Chileans; using related ancestry components
defined by: ADMIXTURE (ADMIX., at K= 7) in all the CANDELA data, or by PCA (PC 7),
19bioRxiv preprint first posted online Jan. 23, 2018; doi: http://dx.doi.org/10.1101/252155. The copyright holder for this preprint
(which was not peer-reviewed) is the author/funder, who has granted bioRxiv a license to display the preprint in perpetuity.
All rights reserved. No reuse allowed without permission.
in an analysis limited to Chileans (Supplementary Note 4, Supplementary Fig. 7-8). Sample
sizes: all data N = 5,794, Peruvians and Chileans N = 2,594, Chileans N = 1,542.
20bioRxiv preprint first posted online Jan. 23, 2018; doi: http://dx.doi.org/10.1101/252155. The copyright holder for this preprint
(which was not peer-reviewed) is the author/funder, who has granted bioRxiv a license to display the preprint in perpetuity.
All rights reserved. No reuse allowed without permission.
REFERENCES
1 Adhikari, K., Chacon-Duque, J. C., Mendoza-Revilla, J., Fuentes-Guajardo, M. &
Ruiz-Linares, A. The Genetic Diversity of the Americas. Annual Review of Genomics
& Human Genetics 18 (2017).
2 Lawson, D. J., Hellenthal, G., Myers, S. & Falush, D. Inference of population
structure using dense haplotype data. PLoS genetics 8, e1002453,
doi:10.1371/journal.pgen.1002453 (2012).
3 Leslie, S. et al. The fine-scale genetic structure of the British population. Nature 519,
309-314, doi:10.1038/nature14230 (2015).
4 Ruiz-Linares, A. et al. Admixture in Latin America: geographic structure, phenotypic
diversity and self-perception of ancestry based on 7,342 individuals. PLoS genetics 10,
e1004572, doi:10.1371/journal.pgen.1004572 (2014).
5 Hellenthal, G. et al. A genetic atlas of human admixture history. Science 343, 747-751,
doi:10.1126/science.1243518 (2014).
6 Wang, S. et al. Geographic patterns of genome admixture in Latin American Mestizos.
PLoS genetics 4, e1000037 (2008).
7 Moreno-Estrada, A. et al. The genetics of Mexico recapitulates Native American
substructure and affects biomedical traits. Science 344, 1280-1285 (2014).
8 Boyd-Bowman, P. Patterns of Spanish Emigration to the Indies until 1600. Hispanic
American Historical Review 66, 580-604 (1976).
9 Kent, R. B. Latin America : regions and people (second edition). (Guilford Press,
2016).
10 Moreno-Estrada, A. et al. Reconstructing the population genetic history of the
Caribbean. PLoS genetics 9, e1003925, doi:10.1371/journal.pgen.1003925 (2013).
11 Homburger, J. R. et al. Genomic Insights into the Ancestry and Demographic History
of South America. PLoS genetics 11, e1005602, doi:10.1371/journal.pgen.1005602
(2015).
12 Burkholder, M. A. & Johnson, L. L. Colonial Latin America. (Oxford University
Press, 2003).
13 Salzano, F. M. & Bortolini, M. C. The Evolution and Genetics of Latin American
Populations. (Cambridge University Press, 2001).
14 Sachar, H. M. Farewell España : the world of the Sephardim remembered. (Knopf,
1994).
15 Adams, S. M. et al. The genetic legacy of religious diversity and intolerance: paternal
lineages of Christians, Jews, and Muslims in the Iberian Peninsula. American journal
of human genetics 83, 725-736, doi:10.1016/j.ajhg.2008.11.007 (2008).
16 Botigue, L. R. et al. Gene flow from North Africa contributes to differential human
genetic diversity in southern Europe. Proceedings of the National Academy of
Sciences of the United States of America 110, 11791-11796,
doi:10.1073/pnas.1306223110 (2013).
17 Crawford, M. H. & Campbell, B. C. Causes and Consequences of Human Migration:
An Evolutionary Perspective. (Cambridge University Press, 2012).
18 Velez, C. et al. The impact of Converso Jews on the genomes of modern Latin
Americans. Human genetics 131, 251-263, doi:10.1007/s00439-011-1072-z (2012).
19 Kehdy, F. S. et al. Origin and dynamics of admixture in Brazilians and its effect on
the pattern of deleterious mutations. Proceedings of the National Academy of Sciences
of the United States of America 112, 8696-8701, doi:10.1073/pnas.1504447112
(2015).
21You can also read