Inflammation predicts new onset of depression in men, but not in women within a prospective, representative community cohort - Nature
←
→
Page content transcription
If your browser does not render page correctly, please read the page content below
www.nature.com/scientificreports
OPEN Inflammation predicts
new onset of depression
in men, but not in women
within a prospective,
representative community cohort
Mareike Ernst1*, Elmar Brähler1, Daniëlle Otten1, Antonia M. Werner1, Ana N. Tibubos1,
Iris Reiner1, Felix Wicke1, Jörg Wiltink1, Matthias Michal1, Markus Nagler2, Thomas Münzel4,9,
Philipp S. Wild2,3,9, Jochem König5, Norbert Pfeiffer6, Andreas Borta7, Karl J. Lackner8,9 &
Manfred E. Beutel1
Depression has been associated with increased inflammation. However, only few large-scale,
prospective studies have evaluated whether inflammation leads to new cases of depression and
whether this association can be found in men and women. Longitudinal data of N = 10,357 adult
participants with no evidence of depression at baseline (based on Patient Health Questionnaire
(PHQ-9), lifetime diagnoses, and current antidepressant medication) were evaluated for depression
5 years later. Multivariate logistic regression models were used to predict the onset of depression
based on C-reactive protein (CRP) and white blood cell count (WBC). We used interaction terms and
separate analyses in men and women to investigate gender-dependent associations. Based on both
markers, inflammation was predictive of new cases of depression 5 years later, even when adjusting
for sociodemographic, physical health, health behavior variables, and baseline depression symptoms.
As established by interaction terms and separate analyses, inflammatory markers were predictive of
depression in men, but not in women. Additional predictors of new onset of depression were younger
age, loneliness, smoking (only in men), cancer and less alcohol consumption (only in women). The
study indicates gender differences in the etiology of depressive disorders within the community, with
a greater role of physical factors in men.
Depression has been recognized as one of the most frequent and harmful mental disorders with an estimated
life time risk of 15–25%; with prevalence rates twice as high among women compared to men1. Researchers have
discussed a variety of factors underlying this observation, for instance genetic and biological vulnerabilities,
environmental factors such as daily stressors, and differences in emotion regulation and stress responsiveness2.
In recent years, a growing body of research examining the temporal dynamics of depressive disorders has
identified close associations of depression symptoms with chronic physical d iseases3–5. The association with
cardiovascular disease (CVD), which caused 37% of deaths in the German population in 2 0176, has been most
1
Department of Psychosomatic Medicine and Psychotherapy, University Medical Center of the Johannes
Gutenberg-University Mainz, Untere Zahlbacher Str. 8, 55131 Mainz, Germany. 2Preventive Cardiology and
Preventive Medicine – Department of Cardiology, University Medical Center of the Johannes Gutenberg-University
Mainz, Mainz, Germany. 3Center for Thrombosis and Hemostasis (CTH), University Medical Center of the
Johannes Gutenberg-University Mainz, Mainz, Germany. 4Department of Cardiology – Cardiology I, University
Medical Center of the Johannes Gutenberg-University Mainz, Mainz, Germany. 5Institute of Medical Biostatistics,
Epidemiology and Informatics (IMBEI), University Medical Center of the Johannes Gutenberg-University Mainz,
Mainz, Germany. 6Department of Ophthalmology, University Medical Center of the Johannes Gutenberg-University
Mainz, Mainz, Germany. 7Boehringer Ingelheim Pharma GmbH Co KG, Ingelheim am Rhein, Germany. 8Institute
of Clinical Chemistry and Laboratory Medicine, University Medical Center of the Johannes Gutenberg-University
Mainz, Mainz, Germany. 9German Center for Cardiovascular Research (DZHK), Partner Site Rhine-Main, Mainz,
Germany. *email: Mareike.Ernst@unimedizin‑mainz.de
Scientific Reports | (2021) 11:2271 | https://doi.org/10.1038/s41598-021-81927-9 1
Vol.:(0123456789)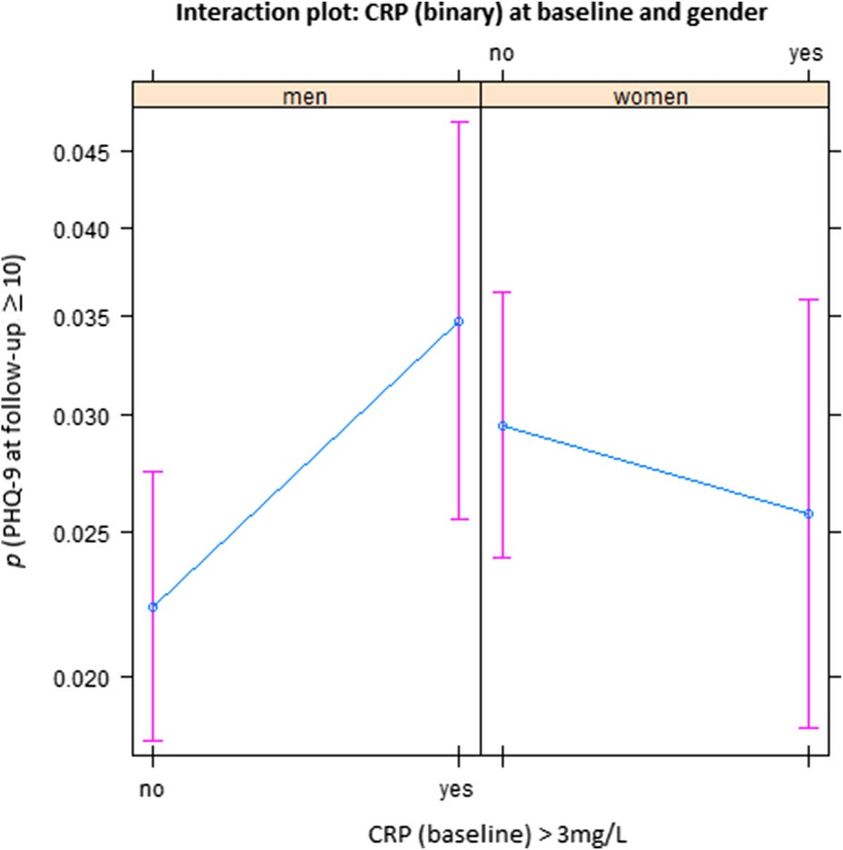
www.nature.com/scientificreports/
extensively investigated. Studies showed (1) an increased risk of CVD in depressed individuals, (2) an even higher
risk of depression following acute CVD, and (3) worse prognosis when CVD is complicated by d epression7–10.
However, the mechanisms underlying this comorbidity remain an issue of investigation. Depression has been
shown to aggravate health risks by poor health behaviors (smoking, sedentary behavior, poor diet) which can
lead to central obesity, diabetes and C VD11. Studies have found that poor health behavior was more common
among men than among w omen12. Chronic, low-grade inflammation plays a crucial role for atherosclerosis which
underlies CVD13. Recently, inflammation has been studied as a potential link between depression and CVD14.
Already in the 1990s, meta-analyses15 have associated depression with alterations in cellular immunity. A
recent meta-analysis16 found low-grade inflammation (C-reactive protein (CRP) > 3 mg/l) in 27% of depressed
participants (Odds Ratio (OR) = 1.46; compared to healthy controls). Other cross-sectional studies indicated a
link between depression symptoms and inflammation (e.g. CRP, interleukin-1 receptor antagonist (IL1-RA),
fibrinogen)17,18. Lifestyle factors such as smoking and obesity, which are associated with inflammatory responses,
accounted for the cross-sectional relationships. A recent meta-analysis, however, found that CRP and interleukin
12 (IL-12) not only had robust associations with depression (irrespective of cofounders such as smoking), but
also showed a reduced variability in depressed participants vs. matched controls19.
The concept of an inflammatory phenotype of depression19 has attracted considerable attention. Chronic and
persistent stress not only increases the risk for depression, but may also lead to a loss of the ability to regulate the
inflammatory response. Chronically elevated cortisol levels contribute to a vicious cycle of immune dysregula-
tion, hypertension, arteriosclerotic plaques and subsequent CVD. Systemic inflammation may drive depression
via pro-inflammatory cytokines. As evidenced by immunotherapy (e. g. IFN–treatment in cancer patients),
pro-inflammatory cytokines act on the brain to cause sickness behavior including early-onset somatic symptoms
(such as flu-like complaints, pain, fatigue, loss of appetite, decreased motor activity and sleep disturbance), as
well as late onset cognitive-emotional symptoms (such as mild cognitive dysfunction including impaired atten-
tion and memory, depressed mood, withdrawal, irritability and anxiety)20. Sickness behavior is an evolutionary
adaptive constellation of changes, however, prolonged inflammatory activation is detrimental to physical and
mental well-being21.
The cross-sectional findings raise important issues, (1) whether inflammatory mechanisms actually constitute
risk factors for the onset of new depression, (2) which immunological markers are relevant, and (3) whether
these findings are valid for men and for women.
The meta-analysis by Valkanova et al.22 identified a total of eight studies with 14,832 participants investi-
gating the influence of baseline CRP on new onset of depression an average of 5 years later, and three studies
(N = 3695) examining interleukin 6 (IL-6). Studies were predominantly conducted in the US, with few studies
from Great Britain and the Netherlands. Elevated inflammatory markers had a small but statistically significant
association with new onset of depression after adjustment for sociodemographic and other (unspecified) risk
factors for depression, most importantly baseline depression. In a biobank investigation in a large cohort from
Great Britain, Khandaker et al.8 established associations of depression with a family history of heart disease, as
well as with IL-6, CRP and triglycerides.
Given the limited understanding of the mechanisms underlying the relationship between inflammation and
depression, there is no consensus which inflammatory markers are particularly relevant. In their meta-analysis
of longitudinal studies, Valkanova et al.22 demonstrated stronger effects for CRP vs. IL-6 on depression. By com-
parison, white blood cell count has been understudied as a marker. Yet, depression could lead to stimulation of
hematopoietic cells and reduced vagal nerve activity accelerating the production of white blood cells (WBCs)23.
In recent years, awareness of the importance of sex- and gender-sensitive or -specific approaches in medical
research has increased24–26. Given the substantial epidemiological gender differences in depressive disorders, it
seems particularly promising to investigate potentially gender-dependent risk factors for depression. Knowledge
about differential vulnerabilities could inform prevention and intervention efforts that are specially geared to
the needs of men and women27,28.
The role of inflammation in the etiology of depression also needs to be investigated in a gender-specific
manner as studies have found greater physiological dysregulation in women (including a host of systems and
inflammatory markers), especially after m enopause29. Experimental evidence supports a gender difference as
well: a study found that women reported a stronger decline in their mood after being administered an endotoxin
as inflammatory c hallenge30.
However, population-based findings regarding gender-dependent associations of depression and inflamma-
tion are scarce and mixed as participants’ outcomes were only seldom analyzed in gender- specific ways. In their
large population-based cohort study, Khandaker et al.8 reported no gender differences regarding the association
of CRP, IL-6 and depression. Surtees et al.31 found an association of both depression episode status and history
of depression with higher leukocyte counts, but only in men. By contrast, Beydoun et al.14 reported that higher
total white blood cell count was predictive of an increase of depression symptoms in women, but not in men. In
a large Swedish twin study, Kendler et al.7 found that the manifestation of CVD was more predictive of the onset
of major depression than reverse. However, the temporal pattern differed between men and women: The risk of
depression following CVD was much greater for men than for women, particularly in the first year.
The present study. We used data of a prospective, representative cohort study to address these research
gaps. The purpose of this longitudinal study was twofold:
(1) to determine whether baseline indicators of inflammation (CRP and WBC) predict new onset of depression
at follow-up 5 years later and;
(2) to explore differences between men and women with respect to these associations.
Scientific Reports | (2021) 11:2271 | https://doi.org/10.1038/s41598-021-81927-9 2
Vol:.(1234567890)www.nature.com/scientificreports/
Figure 1. Participant flow. The present work is based on a community sample of N = 10,357 participants who
took part in assessments at two measurement points and had no evidence for depression at baseline. BL baseline,
FU follow-up.
In order to identify cases with new onset of depression, we excluded participants with acute depression, a
lifetime diagnosis of depression and antidepressant medication at baseline. We controlled sociodemographic
factors, socioeconomic status and lifestyle confounders such as smoking and body mass index (BMI) and,
importantly, also for baseline depression symptoms.
Methods
Procedure and study sample. The Gutenberg Health Study (GHS) is a population-based, prospective,
observational single-center cohort study in the Rhine-Main-Region, G ermany32,33. Its primary aim is to ana-
lyze cardiovascular risk factors and their stratification and to foster health prevention in the community. The
study protocol and documents were approved by the ethics committee of the Medical Chamber of Rhineland-
Palatinate and the local data safety commissioner. All investigations were conducted in line with the Declaration
of Helsinki and principles outlined in recommendations for Good Clinical Practice and Good Epidemiological
Practice. Participants were included after informed consent. Insufficient knowledge of German and psychologi-
cal or physical impairment hindering participation led to exclusion. The sample was drawn randomly from the
local registry in the city of Mainz and the district of Mainz-Bingen, stratified 1:1 for gender and residence and
in equal strata for decades of age. Inclusion criterion was age 35 to 74 years. The response rate (defined as the
recruitment efficacy proportion, i.e. the number of persons with participation in or appointment for the base-
line examination, divided by the total number of persons with participation in or appointment for the baseline
examination, plus those with refusal and those who were not contactable) was 60.3%.
At baseline (assessments between 2007 and 2012), N = 15,010 participants were examined. A total of 12,423
of them took part in the follow-up examination (82.8%).
As the present study concerned new onset of depression, we excluded 2056 individuals with evidence for
current depression or history of depression at baseline: 1424 had reported a diagnosis of depression; of the
remaining sample, 213 had reported taking antidepressant medication. Lastly, there were 429 participants in
the dataset who had surpassed the PHQ-9 cut-off score for relevant symptom burden (≥ 10) at baseline. They
were also excluded. Thus, all analyses reported in the following were based on the analyses sample of N = 10,357
participants. Figure 1 shows the participant flow.
Materials and assessment. The 5-h baseline-examination at the study center evaluated the classical cardi-
ovascular risk factors and clinical variables. Participants also underwent a computer-assisted personal interview,
and staff performed laboratory examinations from venous blood samples, blood pressure and anthropometric
measurements. Examinations were performed according to standard operating procedures by certified medical
technical assistants.
Sociodemographic information. Sociodemographic variables were assessed by self-report: gender, age
in years, employment (no/yes), income, living with partner (no/yes), and socioeconomic status (SES). SES was
defined according to Lampert et al.34. The index combines data based on education, profession and income and
ranges from three (lowest socioeconomic status) to 27 (highest socioeconomic status).
Scientific Reports | (2021) 11:2271 | https://doi.org/10.1038/s41598-021-81927-9 3
Vol.:(0123456789)www.nature.com/scientificreports/
Depression measures. Depression symptoms were assessed using the depression module of the Patient
Health Questionnaire PHQ-9 (at baseline and follow-up). Participants rated the frequency of occurrence of
the nine diagnostic criteria of major depression over the course of the last two weeks. (e.g. “Little interest or
pleasure in doing things”) on a Likert scale (0 = not at all, 1 = several days, 2 = more than half the days, 3 = nearly
every day). The sum scores ranges from 0 to 27. Presence of relevant symptom burden was defined as a sum
score ≥ 10 which has previously shown a sensitivity of 81% and a specificity of 82% for detecting major depressive
disorder35. Internal consistency was good (Cronbach’s α = 0.80).
Medication was registered on site by scanning the bar codes of original packages of drugs taken by partici-
pants. Active ingredients were recorded using ATC codes. Three classes of antidepressants were noted: nonselec-
tive monoamine reuptake inhibitors (ATC N06AA), selective serotonin reuptake inhibitors (ATC N06AB), and
other antidepressants (ATC N06AX).
Loneliness was assessed using one item: ’I am frequently alone/have few contacts’ rated from 0 = no, does not
apply, to 4 = yes, it applies, and I suffer strongly from it36.
Behavioral measures. Health behavior assessments included smoking. Participants’ reports were dichoto-
mized into non-smokers (combining never smokers and ex-smokers) and smokers (combining occasional and
frequent smokers).
Obesity was defined as a body mass index (BMI) ≥ 30 kg/m2.
Alcohol consumption was assessed via self-report. Participants reported how often, how many, and which
kinds of beverages they consumed (e.g. beer, wine, spirits) in certain quantities. Following a standardized pro-
cedure, the number of grams/day was calculated from these responses. Alcohol consumption above the recom-
mended limit was defined as daily consumption ≥ 10 g for women and ≥ 20 g for men (in line with the German
threshold for alcohol consumption above tolerance).
Physical activity was inquired with the Short Questionnaire to Assess Health-Enhancing Physical Activ-
ity (SQUASH; Peters et al.37]). The SQUASH captures commuting, leisure time, household, work and school
activities with reference to a typical week in recent months. Sleeping, lying, sitting and standing were classified
as inactivity37. Active sports was presented in quartiles with Q1 denominating the lowest and Q4 the highest
quartile of physical activity. Information on days per week, average time per day, and intensity of the activity
is used for the calculation of an index score (total minutes of activity multiplied by intensity score, with higher
scores reflecting more (intense) activity).
Interview assessments. During the computer-assisted personal interview, the presence of coronary heart
disease was assessed by the question: ‘Were you diagnosed with a stenosis of your coronary vessels?’ Self-reported
myocardial infarction (MI), heart failure (HF), stroke, deep vein thrombosis (DVT), pulmonary embolism (PE),
and peripheral arterial disease (PAD) were summarized as cardiovascular disease (CVD). Participants were also
asked whether they had ever received a definite cancer diagnosis from a physician, and whether they had ever
received the definite diagnosis of any depressive disorder (i.e. lifetime diagnosis of depression).
Diabetes was defined in individuals with a definite diagnosis of diabetes by a physician or a blood glucose
level of ≥ 126 mg/dl in the baseline examination after an overnight fast of at least 8 h or a blood glucose level
of > 200 mg/dl after a fasting period of 8 h.
Laboratory analysis. Venous blood sampling was performed in supine position, and the prior fast-
ing period was documented. C-reactive protein (CRP) concentration was measured in heparin-plasma by a
high-sensitivity latex enhanced immunoturbidimetric assay (Abbott Laboratories, Abbott Park, IL). The limit
of detection was 0.2 mg/l. Blood cell counts (including white blood cell count (WBC)) were performed on an
ADVIA 2120 system (Siemens Healthcare Diagnostics, Eschborn, Germany). Measures of CRP and WBC were
done immediately after sampling.
Statistical analysis. All data underwent quality control by a central data management unit. Data were
reviewed for completeness by predefined algorithms and plausibility criteria. Descriptive analyses were per-
formed as absolute and relative proportions for categorical data, means and standard deviations for continu-
ous variables, and median with interquartile range if not fulfilling normal distribution. Inference tests between
groups were calculated using t-tests or χ2 tests, where appropriate.
In order to identify predictors of incident depression in the analyses sample, we performed logistic regression
analyses with depression (PHQ-9 sum score ≥ 10) at follow-up as the criterion variable. The models controlled
for depression symptoms at baseline (PHQ-9 sum score), comprised inflammatory markers (CRP, WBC) and
their interactions with gender, demographic variables (gender, age, living with a partner, SES) and physical health
and health behavior variables (diabetes, cardiovascular disease, cancer, obesity, smoking, physical activity, and
excessive consumption of alcohol) as predictors. For analyses, CRP was dichotomized into normal and elevated
levels (≥ 3 mg/l, this cut-off value is based on the American Heart Association’s/Centers for Disease Control and
Prevention’s guidelines38 and previous study p rocedures39). Raw WBCs were substantially left skewed, thus the
natural log of WBC was used instead.
In order to determine gender-dependent effects (i.e. following observations of statistically significant interac-
tion terms with gender), we also analyzed women and men separately.
All p-values should be regarded as continuous parameters that reflect the level of statistical evidence, and
they are therefore reported exactly. Statistical analysis was carried out using R version 3.6.1.
Scientific Reports | (2021) 11:2271 | https://doi.org/10.1038/s41598-021-81927-9 4
Vol:.(1234567890)www.nature.com/scientificreports/
Variable All (N = 10,120) PHQ-9 ≥ 10 at FU (N = 448) PHQ-9 ≤ 9 at FU (N = 9672) p
Sociodemographic
Women (%) 46.1% (4670) 53.1% (238) 45.8% (4432) 0.003
Age 54.3 (10.9) 51.2 (10.3) 54.5 (10.9) < 0.001
Living with partner (%) 84.5% (8547) 79.7% (357) 84.7% (8190) 0.006
Socioeconomic status 13.45 (4.39) 12.94 (4.26) 13.48 (4.39) 0.010
Inflammation
CRP ≥ 3 mg/l (%) 23.9% (2419) 28.0% (125) 23.7% (2292) 0.041
WBC (leucocytes/nl) 6.80 (5.75/8.10) 7.10 (5.80/8.66) 6.80 (5.75/8.10) 0.002
Physical health and health behavior
Diabetes (%) 7.3% (739) 8.3% (37) 7.3% (702) 0.40
CVD (%) 8.3% (836) 7.9% (35) 8.3% (801) 0.86
Cancer (%) 7.9% (800) 8.9% (40) 7.9% (760) 0.42
Obesity (%) 22.7% (2297) 24.8% (111) 22.6% (2186) 0.30
Smoker (%) 17.2% (1738) 24.3% (108) 16.9% (1630) < 0.001
Physical activity 7260 (5174/9390) 7590 (5500/10,140) 7230 (5156/9360) 0.019
Alcohol (% > recom. limit) 28.1% (2836) 22.7% (101) 28.3% (2735) 0.01
Mental distress
Loneliness (%) 6.6% (668) 19.0% (85) 6.1% (590) < 0.001
PHQ-9 sum at baseline 3.13 (2.31) 5.48 (2.37) 3.02 (2.25) < 0.001
Table 1. Baseline participant characteristics (stratified by PHQ-9 ≥ 10 at follow-up). Bold values indicate
statistically significant differences. Participant characteristics are shown as mean values and standard
deviations, medians with interquartile ranges (if not fulfilling normal distribution) or as percentages and
absolute numbers. CRP C-reactive protein, CVD cardiovascular disease, FU follow-up, PHQ-9 patient health
questionnaire-9, WBC white blood cell count.
Results
In the following, we first report univariate differences between individuals with and without new onset of depres-
sion (PHQ-9 sum score ≥ 10) at follow-up (which took place 5 years after the baseline assessment). We then
present several logistic regression models predicting depression at follow-up: We tested elevated levels of CRP
as a binary predictor (first within the whole sample using an interaction term with gender, secondly in separate
analyses in men and women) as well as WBC as a continuous predictor (again both within the whole sample
using an interaction term, and separately in men and women).
Sample characteristics. Table 1 yields an overview of baseline data of the study participants stratified by
the presence of clinically relevant depression symptoms (according to the PHQ-9) at follow-up.
At follow-up, 448 participants (210 men and 238 women) without evidence for depression at baseline reported
relevant depression symptoms (4.4% of the overall sample). Group comparisons showed that those participants
were more likely to be women, comparatively younger, more likely to live without a partner, and to have a lower
socioeconomic status. Participants with new onset of depression were also more likely to smoke, to be physically
inactive, and to consume less alcohol at baseline.
More women (5.1%) than men (3.9%) had new onset depression at follow-up. Supplementary Table S1 depicts
differences between those with depression at follow-up and those without stratified by gender: Among women,
new onset of depression was more common in those who were younger, smoked, and consumed less alcohol.
The latter difference was not present among men. By contrast, new onset of depression among men was related
to living without a partner, lower socioeconomic status, higher inflammation markers (both CRP and WBC),
and being physically inactive.
Main analyses. We tested associations of CRP and WBC on new onset of depression in separate multivari-
ate logistic regression models.
C‑reactive protein. Table 2 shows the association of baseline CRP with depression at follow-up.
Elevated levels of CRP at baseline were predictive of depression at follow-up in the total sample (OR 1.58, 95%
CI 1.10–2.26). The interaction term, however, showed that this effect was modified by gender. The interaction of
elevated levels of CRP with gender was statistically significant (OR 0.55, 95% CI 0.33–0.91). As illustrated by the
interaction plot (Fig. 2), elevated values of CRP predicted new onset depression only in men and not in women.
Additional predictors of depression were being a woman, younger age, loneliness, and baseline depression score;
there was a trend for lower SES. No significant effects were found for diabetes, cardiovascular disease, cancer,
obesity, smoking, physical activity and alcohol consumption.
Table 3 shows separate analyses for men and for women: CRP was predictive of depression (OR 1.4), 95%
CI 1.03–2.16) in men only, along with younger age, smoking, loneliness and baseline depression symptoms. In
Scientific Reports | (2021) 11:2271 | https://doi.org/10.1038/s41598-021-81927-9 5
Vol.:(0123456789)www.nature.com/scientificreports/
Predictors OR 95% CI p
Inflammation
CRP ≥ 3 mg/l 1.58 1.10; 2.26 0.013
Interaction: CRP by gender (women)* 0.55 0.033; 0.91 0.021
Sociodemographic information
Gender (women) 1.34 1.02; 1.74 0.03
Age 0.98 0.97; 0.99 < 0.001
Living with partner 1.14 0.84; 1.55 0.40
Socioeconomic status 0.99 0.96; 1.02 0.06
Physical health and health behavior
Diabetes 1.34 0.84; 2.12 0.22
CVD 1.15 0.75; 1.77 0.53
Cancer 1.38 0.92; 2.07 0.12
Obesity 0.88 0.66; 1.17 0.37
Smoker 1.40 1.07; 1.83 0.013
Physical activity 1.00 1.00; 1.00 0.81
Alcohol > recom. limit 0.83 0.64; 1.09 0.18
Loneliness 1.83 1.33; 2.52 < 0.001
PHQ-9 sum (baseline) 1.47 1.40; 1.54 < 0.001
Table 2. Results of the logistic regression analysis: Prediction of new onset of depression at follow-up (based
on predictors measured at baseline 5 years earlier, including CRP ≥ 3 mg/l). Bold values indicate statistically
significant predictors. Total model: Nagelkerke R2 = 0.37. CI confidence interval; CRP C-reactive protein; CVD
cardiovascular disease, OR odds ratio, PHQ-9 patient health questionnaire-9. *The odds ratio of the interaction
term is a ratio of odds ratios (ROR). The OR for CRP > 3 mg/l of 1.58 is to be interpreted as the OR for men
with elevated CRP. The OR for women with elevated CRP can be calculated from the ROR and the above OR
for men as 1.58 × 0.55 = 0.87.
Figure 2. Association with baseline CRP levels and depression symptoms at follow-up in men and women. We
observed gender differences regarding the association of elevated levels of CRP at baseline with new onset of
depression at follow-up: in men, elevated CRP at baseline was associated with higher PHQ-9 scores at follow-up;
whereas in women, no clear effect of baseline CRP on PHQ-9 at follow-up was apparent. The plot results show
the probability (p) and 95% confidence intervals of depression (PHQ-9 ≥ 10) estimated based on the regression
model of the total sample (reported in Table 2), depending on baseline CRP (normal versus elevated) and other
predictors held fixed. (Figures were created using R version 3.6.1 https://www.R-project.org/).
Scientific Reports | (2021) 11:2271 | https://doi.org/10.1038/s41598-021-81927-9 6
Vol:.(1234567890)www.nature.com/scientificreports/
Men Women
Nagelkerke R2 = 0.38 Nagelkerke R2 = 0.37
Predictors OR 95% CI p OR 95% CI p
Inflammation
CRP ≥ 3 mg/l 1.49 1.03; 2.16 0.033 0.92 0.63; 1.36 0.68
Sociodemographic
Age 0.99 0.97; 1.00 0.023 0.97 0.95; 0.99 < 0.001
Living with partner 1.29 0.80; 2.10 0.30 1.06 0.71; 1.58 0.79
Socioeconomic status 0.99 0.95; 1.03 0.60 1.00 0.95; 1.04 0.87
Physical health and health behavior
Diabetes 1.54 0.89; 2.67 .12 0.87 0.34; 2.23 0.76
CVD 1.01 0.58; 1.78 0.97 1.21 0.61; 2.42 0.59
Cancer 0.85 0.41; 1.75 0.65 1.82 1.11; 2.99 0.018
Obesity 0.98 0.67; 1.44 0.92 0.76 0.48; 1.18 0.22
Smoker 1.53 1.05; 2.22 0.027 1.31 0.89; 1.92 0.17
Physical activity 1.00 1.00; 1.00 0.54 1.00 1.00; 1.00 0.85
Alcohol > recom. limit 0.97 0.68; 1.40 0.88 0.67 0.44; 1.00 0.049
Mental distress
Loneliness 1.92 1.18; 3.10 0.008 1.75 1.14; 2.69 0.011
PHQ-9 sum (baseline) 1.56 1.46; 1.67 < 0.001 1.38 1.30; 1.48 < 0.001
Table 3. Results of the logistic regression analysis: Prediction of new onset of depression at follow-up (based
on predictors measured at baseline 5 years earlier, including CRP ≥ 3 mg/l), stratified by gender. Bold values
indicate statistically significant predictors. CI confidence interval, CRP C-reactive protein, CVD cardiovascular
disease, OR odds ratio, PHQ-9 patient health questionnaire-9.
Predictors OR 95% CI p
Inflammation
Ln(WBC) 1.88 1.04; 3.42 0.04
Interaction: Ln(WBC)* Gender (women) 0.37 0.16; 0.87 0.023
Sociodemographic
Gender (women) 7.91 1.48; 42.33 0.02
Age 0.98 0.97; 0.99 < 0.001
Living with partner 1.13 0.83; 1.54 0.43
Socioeconomic status 0.99 0.97; 1.02 0.65
Physical health and health behavior
Diabetes 1.38 0.87; 2.19 0.17
CVD 1.14 0.74; 1.76 0.55
Cancer 1.39 0.93; 2.09 0.11
Obesity 0.89 0.67; 1.18 0.41
Smoker 1.37 1.04; 1.80 0.02
Physical activity 1.00 1.00; 1.00 0.81
Alcohol > recom. limit 0.86 0.66; 1.12 0.25
Mental distress
Loneliness 1.82 1.32; 2.50 < 0.001
PHQ-9 sum (baseline) 1.47 1.4; 1.54 < 0.001
Table 4. Results of the logistic regression analysis: Prediction of new onset of depression at follow-up (based
on predictors measured at baseline 5 years earlier, including the natural logarithm of WBC). Bold values
indicate statistically significant predictors. Total model: Nagelkerke R2 = 0.37. CI confidence interval, CVD
cardiovascular disease, OR odds ratio, PHQ-9 patient health questionnaire-9, WBC white blood cell count.
women, lower age, a history of cancer, lower alcohol consumption, loneliness and baseline depression symptoms
were predictive of depression, but not CRP.
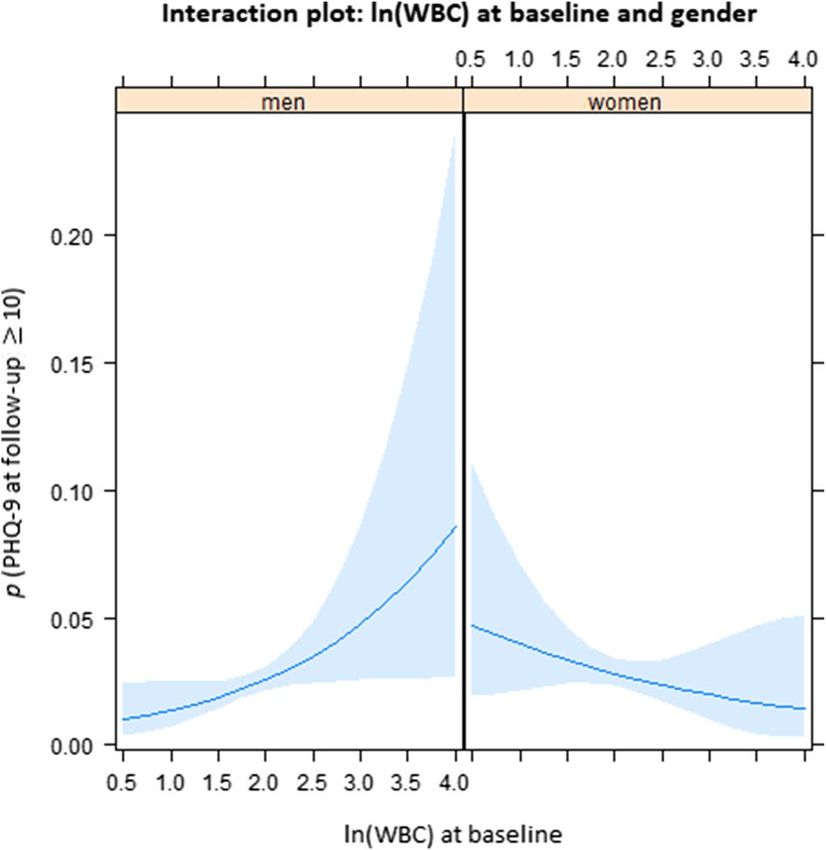
White blood cell count. Table 4 presents the association of baseline ln(WBC) with depression at follow-up.
As Table 4 shows, ln(WBC) was predictive of depression (OR 1.88, 95% CI 1.04–3.42) in the total sample.
Again, the interaction of the inflammation parameter with gender (OR 0.37, 95% CI 0.16–0.87) indicated a
Scientific Reports | (2021) 11:2271 | https://doi.org/10.1038/s41598-021-81927-9 7
Vol.:(0123456789)www.nature.com/scientificreports/
Figure 3. Interaction plot between gender and natural log of white blood cell count as predictors of new onset
of depression 5 years later. There were differences between men and women with respect to the association of
elevated levels of WBC at baseline with new onset of depression at follow-up: in men, elevated WBC at baseline
was more closely associated with higher PHQ-9 sum scores at follow-up. The plot results show the probability
(p) and 95%-confidence intervals (shaded areas) of depression (PHQ-9), estimated based on the regression
model of the total sample (reported in Table 4), depending on baseline natural log of WBC and other predictors
held fixed. (Figures were created using R version 3.6.1 https://www.R-project.org/).
Men Women
Nagelkerke R2 = 0.25 Nagelkerke R2 = 0.29
Predictors OR 95% CI p OR 95% CI p
Inflammation
Ln(WBC) 1.80 0.96; 3.37 0.07 0.72 0.38; 1.36 0.31
Sociodemographic
Age 0.99 0.97; 1.01 0.025 0.97 0.95; 0.99 < 0.001
Living with partner 1.27 0.79; 2.07 0.33 1.05 0.70; 1.56 0.82
Socioeconomic status 0.99 0.95; 1.03 0.66 1.00 0.95; 1.04 0.83
Physical health and health behavior
Diabetes 1.58 0.91; 2.72 0.10 0.89 0.34; 2.29 0.80
CVD 1.00 0.57; 1.76 0.99 1.33 0.68; 2.62 0.41
Cancer 0.88 0.43; 1.82 0.73 1.79 1.09; 2.95 0.021
Obesity 1.02 0.70; 1.49 0.90 0.75 0.49; 1.15 0.19
Smoker 1.42 0.96; 2.10 0.08 1.36 0.92; 2.01 0.12
Physical activity 1.00 1.00; 1.00 0.51 1.00 1.00; 1.00 0.83
Alcohol > recom. limit 1.02 0.71; 1.46 0.93 0.66 0.44; 1.00 0.047
Mental distress
Loneliness 1.89 1.17; 3.05 0.01 1.75 1.14; 2.69 0.011
PHQ-9 sum (baseline) 1.56 1.45; 1.67 < 0.001 1.38 1.30; 1.48 < 0.001
Table 5. Results of the logistic regression analysis: prediction of new onset of depression at follow-up (based
on predictors measured at baseline 5 years earlier, including the natural logarithm of WBC), stratified by
gender. Bold values indicate statistically significant predictors. CVD cardiovascular disease, PHQ-9 patient
health questionnaire-9, WBC white blood cell count.
Scientific Reports | (2021) 11:2271 | https://doi.org/10.1038/s41598-021-81927-9 8
Vol:.(1234567890)www.nature.com/scientificreports/
stronger increase of depression symptoms based on WBC in men (Fig. 3). Other statistically significant predic-
tors were being a woman, younger age, smoking, loneliness, and baseline depression symptoms. In separate
analyses for men and for women (Table 5), these analyses, the association of inflammation and depression in
men showed a wide confidence interval, just beyond the conventional level of statistical significance (OR 1.80,
95% CI 0.96–3.37, p = 0.07). Risk factors were younger age, loneliness, and baseline depression symptoms. In
women, younger age also played a role, and a history of cancer, lower alcohol consumption, loneliness, and
baseline depression symptoms.
Discussion
The present study investigated the longitudinal associations of inflammatory markers and new onset of depres-
sion symptoms in a large and representative German community sample. We had previously excluded all cases of
acute depression, previous diagnosis of depression, and those on antidepressants at baseline in order to identify
cases with new onset of depression at follow-up.
Based on two markers, CRP and WBC, we found inflammation at baseline predictive of new cases of depres-
sion at follow-up 5 years later. The effects of both markers were independent of depression symptoms at baseline.
Increased CRP levels raised the risk of subsequent depression by 1.58 (95% CI 1.010 to 2.16) and ln WBC by 1.88
(95% CI 1.04 to 3.42), even when adjusting for sociodemographic, physical health, health behavior variables,
and baseline depression symptoms.
Unlike previous studies, we used interaction terms with gender in our models and also conducted separate
analyses for men and women. We found significant interactions of CRP and WBC with gender. In separate analy-
ses, CRP was only predictive of new onset of depression in men, but not in women. These findings compliment
previous research showing a stronger increase of CRP in depressed men vs. women40,41. Additional factors were
lower age, smoking, loneliness and baseline depression symptoms. In women, lower age, a history of cancer, lower
alcohol consumption, loneliness and baseline depression symptoms were predictive of depression, but not CRP.
As consumption of alcohol is quite widespread in Germany, especially in social contexts, and as the recommended
limit (for women) is reached with few drinks, the negative predictive valence of alcohol consumption might
have been related to little social contact (and related social drinking) which aggravates the risk for depression42.
Regarding WBC, we found a trend for men (OR 1.80; 95% CI 0.96 to 3.37 per natural log-unit increase), along
with loneliness, and baseline depression symptoms. These patterns of predictors corroborate previous findings
of large cohort s tudies43.
In our study, inflammation increased the risk of incident depression in men. Especially with respect to CRP, it
was suggested that the relationship with depression symptoms only applies to m en44,45. A possible explanation is
provided by the hypothesis that inflammation arises from the dysregulation of hormonal systems. In this context,
estrogen might have beneficial effects (which are also indicated by the positive influence of hormone replacement
therapy on women’s mood46), for instance due to its anti-inflammatory p roperties47,48.
What is more, there are differences in the basic immune response of men and w omen49 that could shape the
association between inflammation markers and depression symptoms. Women’s response to infection is more
pronounced; this pertained to the overwhelming majority of characteristics of immune components including
both the innate and the adaptive immune system50. Although this response pattern has been deemed adaptive as
women have a better prognosis after experiencing e. g. s epsis51, it might have downsides as they are more likely
to suffer from autoimmune diseases than m en52.
The exact mechanisms underlying the present findings, however, remain to be elucidated, as both inflam-
mation and depression could be consequences of an underlying factor like allostatic load. Therefore, further
characterization of an inflamed depression subtype could be a worthwhile pursuit. However, the gender differ-
ence and the high variability of the effect of inflammation on depression in men suggest that inflammation is
not a necessary cause of depression. Instead, the results indicate gender-specific pathways in the development
of depressive disorders. Regarding the generally more pronounced vulnerability for internalizing mental disor-
ders, studies have shown that these disparities co-occur with the onset of p uberty2. It has been discussed that
differential risk depends on hormonal changes and societal gender role concepts alike (which become more
salient around this time)2.
Within the present study, we observed that older age protected against new onset of depression. At baseline
participants were between 35 and 74 years old. Correspondingly, the prevalence of major depression decreased
with age in previous community s tudies53. Along these lines, it is important to note that hormonal changes over
the course of a persons’ lifespan shape physiological regulation including inflammatory p rocesses29. Moreover,
studies have found that the gender gap in depression narrows after the fertile periods of women’s lives whereas
women’s susceptibility to chronic inflammatory diseases approaches men’s as they age54. In a previous meta-
analysis, depression in older adults was more likely to co-occur with physical complaints (including e.g. gastro-
intestinal symptoms) than in the young55.
As inflammation is a core mechanism of cardiovascular, metabolic and other chronic somatic diseases, the
present results help to understand the high prevalence of somatic comorbidity in depression. In our investiga-
tion, presence of CVD was not associated with depression symptoms at follow-up (in models that controlled
for inflammatory markers and lifestyle factors such as including bodyweight, physical activity, smoking, and
alcohol consumption). Previous studies have found that depression was a risk factor for CVD56,57. Addition-
ally, an earlier prospective cohort study showed that depression symptoms predicted health risk behaviors five
ediator11 of the relationship between depression and CVD. It is important to
years later, indicating a potential m
note that an individual’s lifestyle constitutes a modifiable risk factor that can be addressed by population-based
intervention and prevention programs (e. g. smoking cessation; physical exercise). Beneficial effects of lifestyle
changes on inflammation were recently reported58 and could contribute to recovery from depression symptoms,
Scientific Reports | (2021) 11:2271 | https://doi.org/10.1038/s41598-021-81927-9 9
Vol.:(0123456789)www.nature.com/scientificreports/
too. Other examples of interventions to reduce depression and CVD address nutrition (e.g. by incorporating
anti-inflammatory foods and s upplements23) and the reduction of chronic stress as a major driver of inflamma-
tion (e. g. by psychotherapy, online interventions, relaxation exercises).
Strengths and limitations. We report findings from a sizeable community cohort with equal proportions
of men and women. As previously recommended19, we excluded participants with any indication of previous
depression (based on baseline assessment, lifetime diagnosis, and intake of antidepressants). We also controlled
for lifestyle variables associated with depression and with inflammation (smoking, obesity) and, importantly, for
baseline depression symptoms.
In addition to CRP, one of the most frequently studied and robust indicators of inflammation, we included
WBC to expand on previous research. Yet, we are aware that we used only two inflammatory markers, and other
acute-phase markers (e. g. fibrinogen) or other soluble immune markers (e. g. cytokines such as IL-6) were not
included. Given the fact that they were the focus of a large body of previous research concerning the etiology
and/or maintenance of depression22, this limits the comparability of our investigation with previous studies. In
addition, the combined study of a wider range of inflammatory markers could elicit different (gender-specific)
pathogenic pathways.
Our primary outcome measure was the PHQ-9. It is one of the most-widely used self-report questionnaires
to assess depression symptoms. While we inquired previous diagnoses of depression, we did not ascertain medi-
cal diagnoses of depression from medical files. Given the limited period of two weeks captured by the PHQ-9,
we cannot preclude that participants were depressed at other times before the follow-up assessment took place.
While we used all information available to exclude individuals who had previously been depressed, an unknown
proportion of included participants might have fulfilled the criteria of depression in the past without proper
diagnosis. Also, they might not have disclosed previous diagnoses. Other potential predictors such as family
history of depression were not assessed. Further, alcohol consumption exceeding the recommended limit was
defined based on self-reports that could not be objectively validated. We also assessed previous diagnosis of
CVD and cancer via self-reported diagnoses. We did not differentiate for time since diagnosis or (in the case of
cancer) stage and treatment status, which presents a limitation.
Data availability
The written informed consent of the study participants is not suitable for public access to the data and this
concept was not approved by the local data protection officer and ethics committee. Access to data at the local
database in accordance with the ethics vote is offered upon request at any time. Interested researchers make their
requests to the Principal Investigator of the GHS (Philipp.Wild@unimedizin-mainz.de).
Received: 8 October 2020; Accepted: 14 January 2021
References
1. Malhi, G. S. & Mann, J. J. Depression. The Lancet 392, 2299–2312. https://doi.org/10.1016/s0140-6736(18)31948-2 (2018).
2. Kuehner, C. Why is depression more common among women than among men?. Lancet Psychiatry 4, 146–158. https://doi.
org/10.1016/s2215-0366(16)30263-2 (2017).
3. Tibubos, A. N. et al. Course of depressive symptoms in men and women: Differential effects of social, psychological, behavioral
and somatic predictors. Sci. Rep. 9, 18929. https://doi.org/10.1038/s41598-019-55342-0 (2019).
4. Poole, L. & Steptoe, A. Depressive symptoms predict incident chronic disease burden 10years later: Findings from the english
longitudinal study of ageing (ELSA). J. Psychosom. Res. 113, 30–36. https://doi.org/10.1016/j.jpsychores.2018.07.009 (2018).
5. Dijkstra-Kersten, S. M. A. et al. Longitudinal associations of multiple physical symptoms with recurrence of depressive and anxiety
disorders. J. Psychosom. Res. 97, 96–101. https://doi.org/10.1016/j.jpsychores.2017.04.015 (2017).
6. Statistisches Bundesamt. Verteilung der Häufigsten Todesursachen in Deutschland im Jahr 2017. (2020). https: //de.statis ta.com/stati
stik/daten/studie/240/umfrage/verteilung-der-sterbefaelle-nach-todesursachen/. Accessed 12 Oct 2020.
7. Kendler, K. S., Gardner, C. O., Fiske, A. & Gatz, M. Major depression and coronary artery disease in the Swedish twin registry:
Phenotypic, genetic, and environmental sources of comorbidity. Arch. Gen. Psychiatry 66, 857–863. https://doi.org/10.1001/archg
enpsychiatr y.2009.94 (2009).
8. Khandaker, G. M. et al. Shared mechanisms between coronary heart disease and depression: Findings from a large UK general
population-based cohort. Mol. Psychiatry 25, 1477–1486. https://doi.org/10.1038/s41380-019-0395-3 (2020).
9. Penninx, B. W. Depression and cardiovascular disease: Epidemiological evidence on their linking mechanisms. Neurosci. Biobehav.
Rev. 74, 277–286. https://doi.org/10.1016/j.neubiorev.2016.07.003 (2017).
10. Pinquart, M. & Duberstein, P. R. Depression and cancer mortality: A meta-analysis. Psychol. Med. 40, 1797–1810. https://doi.
org/10.1017/S0033291709992285 (2010).
11. Whooley, M. A. et al. Depressive symptoms, health behaviors, and risk of cardiovascular events in patients with coronary heart
disease. JAMA 300, 2379–2388 (2008).
12. Pinkhasov, R. M. et al. Are men shortchanged on health? Perspective on health care utilization and health risk behavior in men
and women in the United States. Int. J. Clin. Pract. 64, 475–487. https://doi.org/10.1111/j.1742-1241.2009.02290.x (2010).
13. Raggi, P. et al. Role of inflammation in the pathogenesis of atherosclerosis and therapeutic interventions. Atherosclerosis 276,
98–108 (2018).
14. Beydoun, M. A. et al. White blood cell inflammatory markers are associated with depressive symptoms in a longitudinal study of
urban adults. Transl. Psychiatry 6, e895. https://doi.org/10.1038/tp.2016.180 (2016).
15. Herbert, T. B. & Cohen, S. Stress and immunity in humans: A meta-analytic review. Psychosom. Med. 55, 364–379. https://doi.
org/10.1097/00006842-199307000-00004 (1993).
16. Osimo, E. F., Baxter, L. J., Lewis, G., Jones, P. B. & Khandaker, G. M. Prevalence of low-grade inflammation in depression: A sys-
tematic review and meta-analysis of CRP levels. Psychol. Med. 49, 1958–1970. https: //doi.org/10.1017/S00332 91719 00145 4 (2019).
17. Duivis, H. E., Vogelzangs, N., Kupper, N., de Jonge, P. & Penninx, B. W. Differential association of somatic and cognitive symp-
toms of depression and anxiety with inflammation: Findings from the Netherlands study of depression and anxiety (NESDA).
Psychoneuroendocrinology 38, 1573–1585. https://doi.org/10.1016/j.psyneuen.2013.01.002 (2013).
Scientific Reports | (2021) 11:2271 | https://doi.org/10.1038/s41598-021-81927-9 10
Vol:.(1234567890)www.nature.com/scientificreports/
18. Michal, M. et al. Differential associations of depressive symptom dimensions with cardio-vascular disease in the community:
Results from the Gutenberg health study. PLoS ONE 8, e72014. https://doi.org/10.1371/journal.pone.0072014 (2013).
19. Osimo, E. F. et al. Inflammatory markers in depression: A meta-analysis of mean differences and variability in 5,166 patients and
5,083 controls. Brain Behav. Immunol. 87, 901–909. https://doi.org/10.1016/j.bbi.2020.02.010 (2020).
20. Dantzer, R., O’Connor, J. C., Freund, G. G., Johnson, R. W. & Kelley, K. W. From inflammation to sickness and depression: When
the immune system subjugates the brain. Nat. Rev. Neurosci. 9, 46–56. https://doi.org/10.1038/nrn2297 (2008).
21. Cohen, S. et al. Chronic stress, glucocorticoid receptor resistance, inflammation, and disease risk. Proc. Natl. Acad. Sci. U.S.A. 109,
5995–5999. https://doi.org/10.1073/pnas.1118355109 (2012).
22. Valkanova, V., Ebmeier, K. P. & Allan, C. L. CRP, IL-6 and depression: A systematic review and meta-analysis of longitudinal stud-
ies. J. Affect. Disord. 150, 736–744. https://doi.org/10.1016/j.jad.2013.06.004 (2013).
23. Shao, M. et al. Depression and cardiovascular disease: Shared molecular mechanisms and clinical implications. Psychiatry Res.
285, 112802. https://doi.org/10.1016/j.psychres.2020.112802 (2020).
24. Heidari, S., Babor, T. F., De Castro, P., Tort, S. & Curno, M. Sex and gender equity in research: Rationale for the SAGER guidelines
and recommended use. Res. Integr. Peer Rev. 1, 2. https://doi.org/10.1186/s41073-016-0007-6 (2016).
25. Clayton, J. A. & Collins, F. S. Policy: NIH to balance sex in cell and animal studies. Nature 509, 282–283. https://doi.
org/10.1038/509282a (2014).
26. Mauvais-Jarvis, F. et al. Sex and gender: Modifiers of health, disease, and medicine. The Lancet 396, 565–582. https://doi.
org/10.1016/s0140-6736(20)31561-0 (2020).
27. Oquendo, M. A. et al. Sex differences in clinical predictors of depression: A prospective study. J. Affect. Disord. 150, 1179–1183.
https://doi.org/10.1016/j.jad.2013.05.010 (2013).
28. Kendler, K. S. & Gardner, C. O. Sex differences in the pathways to major depression: A study of opposite-sex twin pairs. Am. J.
Psychiatry 171, 426–435. https://doi.org/10.1176/appi.ajp.2013.13101375 (2014).
29. Yang, Y. & Kozloski, M. Sex differences in age trajectories of physiological dysregulation: Inflammation, metabolic syndrome, and
allostatic load. J. Gerontol. A Biol. Sci. Med. Sci. 66, 493–500. https://doi.org/10.1093/gerona/glr003 (2011).
30. Moieni, M. et al. Sex differences in depressive and socioemotional responses to an inflammatory challenge: Implications for sex
differences in depression. Neuropsychopharmacology 40, 1709–1716. https://doi.org/10.1038/npp.2015.17 (2015).
31. Surtees, P. et al. Association of depression with peripheral leukocyte counts in EPIC-Norfolk—Role of sex and cigarette smoking.
J. Psychosom. Res. 54, 303–306. https://doi.org/10.1016/s0022-3999(02)00456-7 (2003).
32. Hohn, R. et al. The ophthalmic branch of the Gutenberg health study: Study design, cohort profile and self-reported diseases. PLoS
ONE 10, e0120476. https://doi.org/10.1371/journal.pone.0120476 (2015).
33. Wild, P. S. et al. The Gutenberg health study. Bundesgesundheitsblatt Gesundh. Gesundh. 55, 824–829. https://doi.org/10.1007/
s00103-012-1502-7 (2012).
34. Lampert, T., Kroll, L., Müters, S. & Stolzenberg, H. Measurement of the socioeconomic status within the German health update
2009 (GEDA). Bundesgesundheitsblatt Gesundh. Gesundh. 56, 131–143. https://doi.org/10.1007/s00103-012-1583-3 (2009).
35. Lowe, B. et al. Diagnosing ICD-10 depressive episodes: Superior criterion validity of the Patient Health Questionnaire. Psychother.
Psychosom. 73, 386–390. https://doi.org/10.1159/000080393 (2004).
36. Beutel, M. E. et al. Loneliness in the general population: Prevalence, determinants and relations to mental health. BMC Psychiatry
17, 97. https://doi.org/10.1186/s12888-017-1262-x (2017).
37. Peters, T. et al. Validity of a short questionnaire to assess physical activity in 10 European countries. Eur. J. Epidemiol. 27, 15–25.
https://doi.org/10.1007/s10654-011-9625-y (2012).
38. Pearson, T. A. et al. Markers of inflammation and cardiovascular disease: Application to clinical and public health practice: A
statement for healthcare professionals from the Centers for disease control and prevention and the American Heart association.
Circulation 107, 499–511. https://doi.org/10.1161/01.cir.0000052939.59093.45 (2003).
39. Michal, M. et al. Complaints of sleep disturbances are associated with cardiovascular disease: Results from the Gutenberg health
study. PLoS ONE 9, e104324. https://doi.org/10.1371/journal.pone.0104324 (2014).
40. Danner, M., Kasl, S. V., Abramson, J. L. & Vaccarino, V. Association between depression and elevated C-reactive protein. Psychosom.
Med. 65, 347–356 (2003).
41. Ford, D. E. & Erlinger, T. P. Depression and C-reactive protein in US adults: Data from the Third National health and nutrition
examination survey. Arch. Intern. Med. 164, 1010–1014 (2004).
42. Goodman, R. J., Samek, D. R., Wilson, S., Iacono, W. G. & McGue, M. Close relationships and depression: A developmental cascade
approach. Dev. Psychopathol. https://doi.org/10.1017/S0954579418001037 (2018).
43. Beutel, M. E. et al. New onset of depression in aging women and men—Contributions of social, psychological, behavioral, and
somatic predictors in the community. Psychol. Med. https://doi.org/10.1017/S0033291718001848 (2018).
44. Elovainio, M. et al. Depression and C-reactive protein: Population-based Health 2000 Study. Psychosom. Med. 71, 423–430. https
://doi.org/10.1097/PSY.0b013e31819e333a (2009).
45. Toker, S., Shirom, A., Shapira, I., Berliner, S. & Melamed, S. The association between burnout, depression, anxiety, and inflam-
mation biomarkers: C-reactive protein and fibrinogen in men and women. J. Occup. Health Psychol. 10, 344–362. https://doi.
org/10.1037/1076-8998.10.4.344 (2005).
46. Toffol, E., Heikinheimo, O. & Partonen, T. Hormone therapy and mood in perimenopausal and postmenopausal women: A nar-
rative review. Menopause (New York) 22, 564–578. https://doi.org/10.1097/GME.0000000000000323 (2015).
47. Villa, A., Rizzi, N., Vegeto, E., Ciana, P. & Maggi, A. Estrogen accelerates the resolution of inflammation in macrophagic cells. Sci.
Rep. 5, 15224. https://doi.org/10.1038/srep15224 (2015).
48. Ma, L., Xu, Y., Wang, G. & Li, R. What do we know about sex differences in depression: A review of animal models and potential
mechanisms. Prog. Neuropsychopharmacol. Biol. Psychiatry 89, 48–56. https://doi.org/10.1016/j.pnpbp.2018.08.026 (2019).
49. Oertelt-Prigione, S. The influence of sex and gender on the immune response. Autoimmunol. Rev. 11, A479–A485. https://doi.
org/10.1016/j.autrev.2011.11.022 (2012).
50. Klein, S. L. & Flanagan, K. L. Sex differences in immune responses. Nat. Rev. Immunol. 16, 626–638. https://doi.org/10.1038/
nri.2016.90 (2016).
51. Angele, M. K., Pratschke, S., Hubbard, W. J. & Chaudry, I. H. Gender differences in sepsis: Cardiovascular and immunological
aspects. Virulence 5, 12–19. https://doi.org/10.4161/viru.26982 (2014).
52. Ngo, S. T., Steyn, F. J. & McCombe, P. A. Gender differences in autoimmune disease. Front. Neuroendocrinol. 35, 347–369. https
://doi.org/10.1016/j.yfrne.2014.04.004 (2014).
53. Weinberger, A. H. et al. Trends in depression prevalence in the USA from 2005 to 2015: Widening disparities in vulnerable groups.
Psychol. Med. 48, 1308–1315. https://doi.org/10.1017/S0033291717002781 (2018).
54. Gubbels Bupp, M. R. Sex, the aging immune system, and chronic disease. Cell Immunol. 294, 102–110. https://doi.org/10.1016/j.
cellimm.2015.02.002 (2015).
55. Hegeman, J. M., Kok, R. M., van der Mast, R. C. & Giltay, E. J. Phenomenology of depression in older compared with younger
adults: Meta-analysis. Br. J. Psychiatry 200, 275–281. https://doi.org/10.1192/bjp.bp.111.095950 (2012).
56. Frasure-Smith, N. & Lesperance, F. Depression—A cardiac risk factor in search of a treatment. JAMA 289, 3171–3173. https://doi.
org/10.1001/jama.289.23.3171 (2003).
Scientific Reports | (2021) 11:2271 | https://doi.org/10.1038/s41598-021-81927-9 11
Vol.:(0123456789)www.nature.com/scientificreports/
57. Goldstein, B. I. et al. Major depressive disorder and bipolar disorder predispose youth to accelerated atherosclerosis and early car-
diovascular disease: A scientific statement from the American Heart Association. Circulation 132, 965–986. https: //doi.org/10.1161/
CIR.0000000000000229 (2015).
58. van ‘t Klooster, C. C. et al. The relation between healthy lifestyle changes and decrease in systemic inflammation in patients with
stable cardiovascular disease. Atherosclerosis 301, 37–43. https://doi.org/10.1016/j.atherosclerosis.2020.03.022 (2020).
Acknowledgements
The authors thank all of the study participants for their willingness to provide data for this research project, and
the authors are also indebted to all coworkers for their enthusiastic commitment. The Gutenberg Health Study is
funded by the government of Rhineland-Palatinate (Stiftung Rheinland-Pfalz für Innovation, contract AZ 961-
386261/733); by the research programs Wissen schafft Zukunft and Center for Translational Vascular Biology of
the Johannes Gutenberg University of Mainz; and by a contract with Boehringer Ingelheim and Philips Medical
Systems, including an unrestricted grant for the Gutenberg Health Study. Boehringer Ingelheim, Philips Medical
Systems, and Novartis Pharma provided funding toward this study.
Author contributions
M.E., P.S.W., M.E.B. and K.J.L., conceived of and designed the study; M.N. analyzed the data; M.E. and M.E.B.
wrote the paper; E.B., D.O., A.N.T., A.M.W., I.R., F.W., J.W., M.M., J.K., N.P., T.M., and A.B. critically revised the
manuscript; and all authors read and approved the final manuscript.
Competing interests
Philipp S. Wild is funded by the Federal Ministry of Education and Research (BMBF 01EO1503). Philipp S. Wild
and Thomas Münzel are PI of the German Center for Vascular Research (DZHK). There are no patents, products
in development, or marketed products to declare. This does not alter the authors’ adherence to all of the journal
policies on sharing data and materials. The funders had no role in the study design, data collection and analysis,
decision to publish, or preparation of the manuscript. The other authors declare no competing interests.
Additional information
Supplementary Information The online version contains supplementary material available at https://doi.
org/10.1038/s41598-021-81927-9.
Correspondence and requests for materials should be addressed to M.E.
Reprints and permissions information is available at www.nature.com/reprints.
Publisher’s note Springer Nature remains neutral with regard to jurisdictional claims in published maps and
institutional affiliations.
Open Access This article is licensed under a Creative Commons Attribution 4.0 International
License, which permits use, sharing, adaptation, distribution and reproduction in any medium or
format, as long as you give appropriate credit to the original author(s) and the source, provide a link to the
Creative Commons licence, and indicate if changes were made. The images or other third party material in this
article are included in the article’s Creative Commons licence, unless indicated otherwise in a credit line to the
material. If material is not included in the article’s Creative Commons licence and your intended use is not
permitted by statutory regulation or exceeds the permitted use, you will need to obtain permission directly from
the copyright holder. To view a copy of this licence, visit http://creativecommons.org/licenses/by/4.0/.
© The Author(s) 2021
Scientific Reports | (2021) 11:2271 | https://doi.org/10.1038/s41598-021-81927-9 12
Vol:.(1234567890)You can also read


