Effects of illuminance and correlated color temperature of indoor light on emotion perception - Nature
←
→
Page content transcription
If your browser does not render page correctly, please read the page content below
www.nature.com/scientificreports
OPEN Effects of illuminance
and correlated color temperature
of indoor light on emotion
perception
Yun Li1,2, Taotao Ru2,3*, Qingwei Chen1,2, Liu Qian1,2, Xianghang Luo1 & Guofu Zhou2,3
The acute non-image forming (NIF) effects of daytime light on momentary mood had been-although
not always-established in the current literature. It still remains largely unknown whether short-time
light exposure would modulate emotion perception in healthy adults. The current study (N = 48) was
conducted to explore the effects of illuminance (100 lx vs. 1000 lx at eye level) and correlated color
temperature (CCT, 2700 K vs. 6500 K) on explicit and implicit emotion perception that was assessed
with emotional face judgment task and emotional oddball task respectively. Results showed that
lower CCT significantly decreased negative response bias in the face judgment task, with labeling
ambiguous faces less fearful under 2700 K vs. 6500 K condition. Moreover, participants responded
slightly faster for emotional pictures under 6500 K vs. 2700 K condition, but no significant effect of
illuminance or CCT on negativity bias was revealed in the emotional oddball task. These findings
highlighted the differential role of illuminance and CCT in regulating instant emotion perception and
suggested a task-dependent moderation of light spectrum on negativity bias.
Light therapy has been established as an effective antidepressant treatment for patients with seasonal and non-
seasonal affective d isorders1–3. Several meta-analyses of randomized, placebo-controlled trials confirmed that
light therapy was more effective than a placebo in patients with affective disorders3–5. Light can induce indirect
regulation of mood by modulating circadian rhythms and s leep6. It was well documented that aberrant light
stimulation can cause problems with circadian rhythms and sleep, which can result in the development of mood
disorders7–9. In addition to the indirect pathway, light can directly regulate mood by activating brain regions (i.e.,
the medial amygdala and lateral habenula) involving emotional processing, which was not necessarily mediated
by the suprachiasmatic nucleus (SCN). The main driver for these so-called non-image-forming effects (NIF)
effects of light is the intrinsically photosensitive retinal ganglion cells (ipRGCs) containing the photopigment
melanopsin, with peak sensitivity in the blue part of the electromagnetic spectrum10–12.
To date, we know little about how light effectively works in the treatment of affective disorders. Negativity bias
was identified as playing an important role in developing and maintaining major depressive disorder (MDD)13,14,
which describes the phenomenon whereby individuals selectively pay more attention to negative stimuli than
neutral and positive s timuli15,16 or are inclined to judge an ambiguous stimulus as n egative17,18. The above find-
ings suggested that individuals who experience symptoms of depression show greater negative bias than people
without such symptoms13,15–18. Negativity bias, in turn, could predict both the development of severe symptoms
in the future and the development of a persistent depressive episode among people with d epression19–24. However,
whether specific artificial light exposure would moderate the negativity bias remains largely unknown.
In addition to the antidepressant effects of long-term light exposure, the acute non-image forming effects
(NIF) of short-term light exposure on subjective mood were reported in multiple empirical s tudies25–30. The
current literature has-although not always-demonstrated the benefits of manipulating light intensity for a short
duration (30–120 min) on momentary mood during d aytime25–27,31. For instance, one study by Smolders and de
Kort26 revealed that participants felt significantly happier in 1000 lx vs. 200 lx conditions (at eye level) after 30 min
of light exposure, though participants’ feeling of sadness remained unaffected with light level. Another recent
1
School of Psychology, South China Normal University, Guangzhou 510631, China. 2Lab of Light and
Physio‑psychological Health, National Center for International Research on Green Optoelectronics, South China
Normal University, Guangzhou 510006, China. 3Guangdong Provincial Key Laboratory of Optical Information
Materials and Technology & Institute of Electronic Paper Displays, South China Academy of Advanced
Optoelectronics, South China Normal University, Guangzhou 510006, China. *email: taotao.ru@m.scnu.edu.cn
Scientific Reports | (2021) 11:14351 | https://doi.org/10.1038/s41598-021-93523-y 1
Vol.:(0123456789)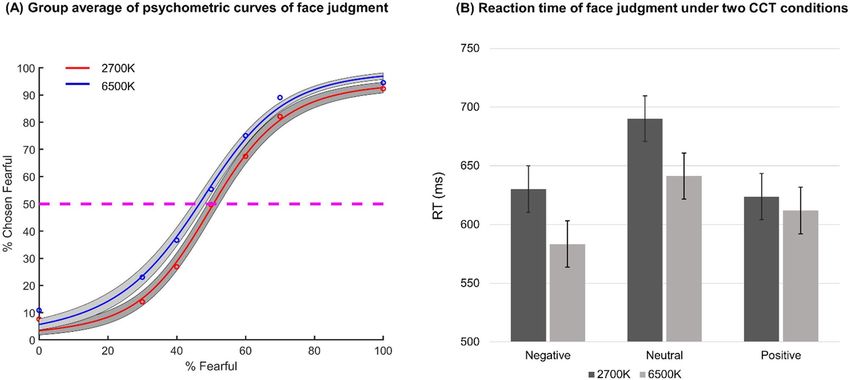
www.nature.com/scientificreports/
study by Ru and colleagues reported that participants’ negative mood assessed with Positive Affect and Negative
Affect Schedule (PANAS) significantly decreased after 50 min of 1000 lx vs. 100 lx light during daytime working
hours25. By contrast, several studies revealed null effects of light intensity on subjective affective state28,32–34. This
case was also true for the acute effect of manipulating light’s spectrum on subjective indicators of mood. Note that
the correlated color temperature (CCT) of polychromatic light generally increases when it contains more power
in the blue part of the spectrum. The findings of these studies have reported either benifitial29,35,36 or i mpaired30
and null32,37,38 effects of correlated color temperature (CCT) on subjective mood. For instance, Hawes et al.35
reported that participants’ depression scores, as assessed by the profile of mood states (POMS), decreased with
higher color temperatures (5448 K and 6029 K vs. 3345 K; 90 min), suggesting that mood can be enhanced by
higher CCT. In contrast, Smolders and de K ort30 found that subjects felt less happy and sadder as assessed with
a single 4-point item under high vs. low CCT (6000 K vs. 2700 K; 90 min) conditions.
Furthermore, quite a few empirical studies were conducted in an effort to investigate the interaction effects
of illuminance and spectrum of light on and subjective m ood25,39–41. Lan et al.42 found that participants reported
more positive mood in the standard warm light (300 lx, 3000 K) and bright cool light (2000 lx, 6000 K) condition
than in the bright warm light (2000 lx, 3000 K), while Ru et al.25 did not reveal statistically significant interac-
tion effect between light level and CCT on subjective mood as assessed with PANAS. The above inconsistent
findings could partly be explained by the differences in light properties and time factor, while the differential
subjective indicators of mood employed in these studies may also be the factor leading to the variability of the
light’s regulation of mood.
To date, a few studies investigated the effects of illuminance or/and spectrum of light on emotional
processing43–48. For instance, Fotios et al.43 reported that the intensity of ambient light had significant effects on
expression recognition, such that the probability of correctly identifying emotions conveyed by facial expres-
sion was increased with the increased light level. Whereas one subsequent study by Fotios et al.45 revealed that
the spectrum of lamp light (2000 K vs. 4000 K) did not significantly affect the ability to recognize facial expres-
sions. A recent study by Yoshiike et al.48 reported that a 15-min bright light (9000 lx) facilitated fear extinction
and antagonized fear acquisition after 24 h and regulated the hemodynamic response of the prefrontal cortex
involving in the top-down regulation of fear. These findings suggested that short-term light exposure had the
potential to modulate the perception of emotional stimulus. Yet, the acute effects of short-term light exposure
on the processing of different valences (i.e., positive, neutral, and negative) of emotional stimuli, especially the
regulation of negativity bias, were scarcely investigated. As we mentioned above, a reduction in negative biases
in interpretation and appraisal of intrusions was usually associated with a reduction in depressive symptoms
over the same p eriod49,50. It is of great practical significance to explore the regulation of ambient light on this
specific emotional processing.
The potential mechanism by which light regulates emotional processing still remains unclear. There were evi-
dences that ipRGCs project to multiple emotional relevant brain regions, among which are cortical areas involved
in the top-down regulation of emotional attention (such as the dorsolateral prefrontal cortex, intraparietal sul-
cus, and superior parietal lobule) and subcortical areas related to the bottom-up reorientation of attention (the
right insula, the anterior cingulate cortex, and the superior temporal sulcus)51–55. These findings may provide an
insight that light exposure would moderate both the implicit (Top-down) and explicit (Bottom-up) processing
to emotional stimulus. Also, given that the subjective mood may interact with light, thus modulating objective
emotional processing56,57, it is necessary to explore the specific effects of light on instant emotional processing
with careful monitoring subtle influence from emotional states.
Thus, the current study was conducted in an effort to investigate the influence of light level and spectrum
of indoor light on explicit emotional perception as assessed with facial expression judgment task and implicit
emotional perception as assessed with the emotional oddball task. Forty-eight healthy participants were assigned
to perform both emotional judgment task and emotional detection task under two illuminance levels (100 lx
and 1000 lx at eye level) and two CCT levels (2700 K and 6500 K). To dissociate the specific light’s effects on
emotional perception from subjective mood, we monitored the subjective momentary mood and sleepiness
prior to the laboratory study and further put them as covariates. To the best of our knowledge, the current study
is the first time to explore the influence of indoor light on both explicit and implicit emotional perception with
careful controlling of subtle influence from emotional states. Our study may provide further insights into indoor
lighting design or provide guidance on light therapy.
Methods
Experimental design. A 2 (CCT level: 2700 K vs. 6500 K, between-subjects) × 2 (Illuminance: 100 lx vs.
1000 lx at eye level, within-subjects) mixed-model design was employed in the current study. Participants came
to the laboratory on two separate days with an interval of at least 2 days. The laboratory study was conducted
from May to August 2019. All participants were free to register either in the morning session (8:30–12:30) or in
the afternoon session (14:30–17:30), and the local clock time remained the same on the two experiment days.
The order of illuminance condition was counterbalanced between participants.
Participants. A power analysis was conducted before the formal experiment using G*power58; each group
needs 24 participants to achieve 95% power when the effect size partial η2 was hypothesized to be 0.1459. Forty-
eight healthy young volunteers (mean age = 20.12 years, SD = 1.76 years, 37 females) were recruited from local
universities via advertisements; 24 participants (19 females) were assigned into 2700 K condition, while the
other half (18 females) received the light at 6500 K. All the participants had a normal or corrected-to-normal
vision and were right-handed. None of them were extreme chronotypes according to the Morningness-Evening-
ness Questionnaire60. Besides, they had no indication of emotional disturbance based on the Beck Depression
Scientific Reports | (2021) 11:14351 | https://doi.org/10.1038/s41598-021-93523-y 2
Vol:.(1234567890)www.nature.com/scientificreports/
α-Optic lux value
λmax (4000 K, 200 lx) (2700 K, 100 lx) (2700 K, 1000 lx) (6500 K, 100 lx) (6500 K, 1000 lx)
Lux 193 103 1016 111 1000
CCT 4034 3094 2710 6634 6571
S-cone 419 127 44 269 114 1031
Melanopsin 480 139 54 446 108 979
Rod 496 151 65 564 110 994
M-cone 530 175 87 820 111 1004
L-cone 558 189 102 1010 107 970
Table 1. Spectrally weighted α-Optic lux level at eye levels for each lighting condition based on Lucas et al.91.
Figure 1. Spectral power distribution was measured at eye level in the four lighting conditions.
Inventory-II61 and the Beck Anxiety I nventory62. The study was approved by the Human Research Ethics Com-
mittee for Experiment involving Human Species at Local University, and all research activities have adhered to
the principles of the Declaration of Helsinki. All participants gave their written informed consent before starting
the laboratory study and got payment for participation.
Experimental setting. The experiment was conducted in a room furnished as a simulated office (4.1 m by
3.3 m by 2.9 m). There were four white workstations separated by white panels; each workstation included a pure
white desk (1.2 m by 0.8 m) and a black chair, and on the desk was a white All-in-One PC (Lenovo C260, 19.5
inches) with a pair of headphones, a keyboard, and a mouse. Six recessed Philips Savio luminaires were mounted
on the ceiling of the room. The illuminance level, spectral power distribution (SPD), and color-rendering index
(CRI) were measured at eye level by a calibrated spectroradiometer (JETI Specbos1201) aimed at the screen in
the gaze direction of participants (Table 1 and Fig. 1). The CRI at 6500 K was Ra = 84, and the CRI at 2700 K was
Ra = 86.
Measures. Subjective mood and sleepiness. The subjective mood was measured with two items ("happy"
and "sad" respectively) selected from the activation-deactivation adjective checklist63; each item was rated on a
five-point Likert scale, ranging from 1 = definitely not to 5 = definitely. Subjective sleepiness was assessed with
the Karolinska Sleepiness Scale (KSS)64, ranging from 1 = extremely alert to 9 = extremely sleepy.
Light sensitivity and evaluation of experimental light. Light sensitivity was measured with three items adopted
from Smolders et al.28. At the end of the experiment, all participants were asked to evaluate the experimental
light (pleasantness, comfort, disturb, warmth, preference, brightness, excitement) using seven 5-point Likert-
scale items adopted from F lynn65. Additionally, two 5-point Likert scale items adopted from Smolders and de
Kort were used to probe participants’ beliefs about the current lighting effects on work performance and mood25.
Experimental tasks. Emotional face judgment task. The emotional face judgment task was used to assess
the explicit perception of emotional stimuli, in which all the faces were on a morphed expression continuum
between exemplars of fearful and happy expressions66. Two female faces and two men faces were selected from
an international database named STOIC database67. The unambiguous exemplars of fearful and happy expres-
sions were selected for each individual, and pixel value and location were interpolated between fearful exemplar
faces and happy exemplar faces to generate the morphed expression continua for this experiment. Five levels of
fear-happy morphs, ranging from 30% fear/70% happy to 70% fear/30% happy in steps of 10%, were created by
Scientific Reports | (2021) 11:14351 | https://doi.org/10.1038/s41598-021-93523-y 3
Vol.:(0123456789)www.nature.com/scientificreports/
Figure 2. (A) Stimulus sample of face judgment task: female, facial expression ranges from 100% happy
/0% fearful to 0% happy /100% fearful, all morphs were created by customized scripts in MATLAB R2017a
(MathWorks Inc., Natick, MA, USA). (B) Emotional face judgment task. A face was presented after a fixation
cross, and then participants were required to judge whether the emotion conveyed by the face is "fearful" or
"happy" within 1.5 s. (C) Emotional oddball task. A picture was presented after a fixation cross, and participants
were required to answer whether it is a standard stimulus or an oddball stimulus within 1.5 s immediately. (D)
Overview of experimental condition and schematic representation of one full session. Note that the task order
was the same on two experiment days and counterbalanced between the participants.
customized scripts in MATLAB R2017a (MathWorks Inc., Natick, MA, USA), and low-level image properties
were equalized by the SHINE toolbox68 in MATLAB. At last, seven levels of fear–happy morphs were included,
ranging from 0% fear/100% happy to 100% fear/0% happy in steps of 10%, so the faces include seven levels of
fearful ratio: 0%, 30%, 40%, 50%, 60%, 70%, 100%. According to the degree of fear, these seven different levels
were further divided into three levels: positive, neutral, negative (Fig. 2A). During this task, participants were
asked to judge the facial expressions (happy or fearful) presented on the screen as quickly and accurately as
possible by pressing one of two labeled response keys on the keyboard. The response hand for happy and fear-
ful faces was balanced between participants. There were two blocks for this task, with each block including 140
trails, and each face was presented for 1500 ms with a random interval of 800 to 1200 ms (Fig. 2B). The reaction
time for the three kinds of emotional faces and the selection rate for fearful faces in the seven levels of emotional
faces were separately investigated.
Emotional oddball task. The emotional oddball task was used to assess the implicit perception of emotional
stimulus. A neutral picture (valence = 5.59, arousal = 4.40) was selected as the standard stimulus, whereas the
other three kinds of stimuli with a different emotional valance (negative, neutral, and positive) were selected as the
oddball stimuli. All the pictures were selected from the Chinese Affective Picture System (CAPS)69. The standard
stimulus was presented with a probability of 70%, and the oddball stimuli were presented with a probability of
30% (10% for each Valence)70. The valence level (Negative, M = 2.05, SD = 0.16; Neutral, M = 5.68, SD = 0.17; Pos-
itive, M = 6.77, SD = 0.16) of three kinds of oddball stimulus were evaluated before the main task with significant
difference across them (F (2,87) = 602.37, p < 0.001), while the arousal level (Negative, M = 5.69, SD = 0.57; Neu-
tral, M = 5.69, SD = 0.75; Positive, M = 5.71, SD = 0.16) were not different significantly (F (2,87) = 0.18, p = 0.84).
Two blocks were included in this task, with each block consisting of 150 trails. Each stimulus was presented for
1500 ms with a random interval of 800 to 1200 ms (Fig. 2C). Participants were required to respond to the oddball
or standard stimulus by pressing one of two labeled response keys as quickly as possible. The response hand for
the standard and the oddball stimulus was balanced between participants. The average accuracy and reaction
time of the three kinds of emotional pictures were separately recorded for the analyses.
Experimental procedure. After participants arrived in the laboratory, they were instructed to complete a
set of questionnaires with questions about their sleep offset, sleep duration, sleep quality of the preceding night,
light sensitivity, how long they spent outdoors and whether they had consumed coffee and/or other drinks
containing alcohol or caffeine before they arrived at the laboratory. Baseline sleepiness and mood were assessed
before the light manipulation. The experiment always started with a 5-min light adaption after the experimental
Scientific Reports | (2021) 11:14351 | https://doi.org/10.1038/s41598-021-93523-y 4
Vol:.(1234567890)www.nature.com/scientificreports/
2700 K 6500 K Statistics
100 lx 1000 lx 100 lx 1000 lx CCT Illuminance CCT*illuminance
EMM (SE) EMM (SE) EMM (SE) EMM (SE) F df p F df p F df p R2
Sleep duration 7.67 (0.19) 7.62 (0.19) 7.98 (0.19) 8.37 (0.19) 5.81 (1,48) 0.02 1.12 (1,48) 0.30 1.86 (1,48) 0.18 0.05
Sleep quality 1.54 (0.54) 2.79 (0.54) 2.50 (0.54) 2.96 (0.54) 0.87 (1,48) 0.36 3.26 (1,48) 0.08 0.70 (1,48) 0.41 0.10
Light sensitivity 7.67 (0.40) 7.13 (0.40) 7.75 (0.40) 7.38 (0.40) 0.10 (1,48) 0.76 6.08 (1,48) 0.02 0.20 (1,48) 0.66 − 0.10
Sleepiness (KSS) 2.96 (0.25) 2.88 (0.25) 3.17 (0.25) 2.83 (0.25) 0.08 (1,48) 0.78 1.45 (1,48) 0.24 0.52 (1,48) 0.47 0.05
Happy 3.67 (0.14) 3.63 (0.14) 3.63 (0.14) 3.71 (0.14) 0.02 (1,48) 0.90 0.30 (1,48) 0.90 0.27 (1,48) 0.60 0.01
Sad 2.00 (0.17) 1.71 (0.17) 1.83 (0.17) 1.67 (0.17) 0.26 (1,48) 0.61 2.73 (1,48) 0.11 0.20 (1,48) 0.65 0.05
Table 2. Descriptive statistics results for confounding variables and baseline measures. EMM estimated
marginal means, SE standard errors. A significant difference is indicated by bold labels. Effect sizes (pseudo
R2-values (R2pseudo)) indicates the proportion (percentage) of the reduction in the variance of residuals from the
null model to the final (full) model at level two; it is worth mentioning that this measure can also have negative
values71.
light was turned on, in which participants were free to read books containing no emotion priming contexts.
Afterward, two computerized tasks were programmed with counterbalanced orders, and the order of the task
remained consistent for each participant on the two experiment days. At the end of the task session, subjec-
tive mood and sleepiness were repeatedly measured, and the subjective evaluation of the experiment light was
assessed. A schematic representation of one full experimental session is depicted in Fig. 2D.
Statistical analyses. Before further statistical analyses were performed, responses on error trials (omis-
sions, false starts, and trials following incorrect responses) and outliers (M ± 3SD; per participant and per
dependent variable per session) were removed. Due to the hierarchical structure of the data, linear mixed model
(LMM) analyses were conducted to test the effects of Illuminance and CCT on all dependent variables. Par-
ticipants and the experimental session (nested within participant) were added as random intercepts to cluster
the data per participant and per experimental session in all models. Firstly, a preparatory LMM analysis was
performed with sleep duration (self-reported hours), sleep quality (GSQS score) of the night before the experi-
ment days, or light sensitivity as the response variable; the models for each of the different dependent variables
further included CCT and Illuminance level and their interactions as fixed factors. Secondly, further LMM
analyses were performed with the subjective sleepiness and mood before (baseline) and after light manipulation
and evaluation of lighting conditions as dependent variables; in those models, CCT and Illuminance and their
interaction were added as fixed factors. Confounding variables with significant differences at baseline, baseline
subjective mood, and alertness, lighting evaluation variables of post-experiment with a significant difference
across conditions were used as control variables in future LMM analysis on emotional processing.
For the face judgment task, an LMM model was built with CCT, Illuminance, Fearful levels of faces or Valence,
and their interactions as fixed factors, whereas the percentage of choosing fearful or reaction time work as
response variables respectively. For the oddball task, LMM models were built with CCT, Illuminance, Valence,
and their interactions as fixed factors, whereas the response accuracy or reaction time as response variables,
respectively. Post hoc contrasts were performed to investigate the nature of all significant interaction effects with
Bonferroni corrected. Adjusted R-Squared was given for the total mixed model at level 1, i.e., within sessions.
This measure is the proportion of reduction in the variance of residuals; note that this measure can also have
negative values71.
Results
Confounding variables: sleep quality, sleep duration, and light sensitivity. Surprisingly,
our results revealed a significant main effect of Illuminance on light sensitivity (F (1,48) = 6.08, p = 0.02,
R2pseudo = − 0.10), the participants reported higher light sensitivity before receiving the high light level manipula-
tion. In addition, a main effect of CCT was found on sleep duration (F (1,48) = 5.81, p = 0.02, R2pseudo = 0.05), with
shorter total sleep time in the 6500 K condition (8.17 ± 0.16) than in the 2700 K condition (7.65 ± 0.15). Results
showed that there were no main effects of CCT or Illuminance on sleep quality, neither the interaction effects of
CCT and Illuminance on these three variables (all p > 0.01) (Table 2). Thus, sleep duration and light sensitivity
were both taken as covariates in further analysis.
Baseline comparison: sleepiness and mood. For the baseline rating, all the LMM analyses showed no
significant main effects or interaction effects of CCT and Illuminance on baseline sleepiness, positive mood, and
negative mood (all p values > 0.05) (Table 2).
Effects of lighting on emotion perception. Emotional face judgment task. LMM analysis for the per-
centage of choosing fearful in the face judgment task revealed a significant main effect of CCT (F (1,52) = 4.78,
p = 0.03); participants were less inclined to make fearful decisions under 2700 K (EMM = 0.49, SE = 0.02) versus
6500 K condition (EMM = 0.55, SE = 0.02, p = 0.03). The interaction effect between CCT and fearful levels was
also significant (F(6,570) = 2.09, p = 0.05, R2pseudo = 0.92). The post-hoc analysis revealed that participants selec-
Scientific Reports | (2021) 11:14351 | https://doi.org/10.1038/s41598-021-93523-y 5
Vol.:(0123456789)www.nature.com/scientificreports/
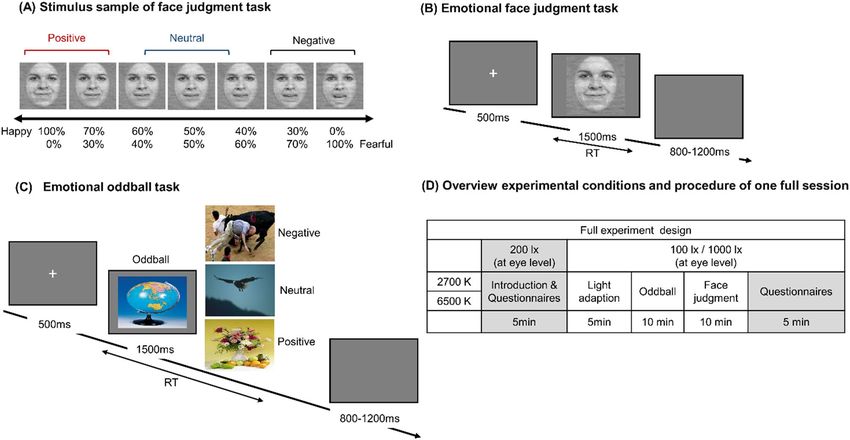
Figure 3. (A) Group average of psychometric curves showing the proportion of trials judged as fearful as a
function of morph levels (ranging from 0% fearful (100% happy; on the left) to 100% fearful (0% happy; on the
right)). Shaded area denotes ± SEM across subjects. (B) Face judgment reaction time of negative vs. neutral vs.
positive faces under two CCT conditions. Whiskers represent standard errors.
tively showing significantly lower percentage of choosing fearful for the 30%, 40%, 60% and 70% fearful levels
(all p values < 0.05) under 2700 K vs. 6500 K condition, but not for 0% and 100% fearful level.
To further investigate participants’ sensitivity of emotional judgment in two CCT conditions, a logistic func-
tion was fitted to obtain smooth psychometric curves under two CCT conditions. The Eq. (1) is as follows:
Pinf
P(x) =
−α χ−χhalf
(1)
1+e
P is the percentage of trials judging faces as fear, χ is the morph level, Pinf is the value when χ approaches infinity
(the curve’s maximum value), χhalf is the symmetric inflection point (the curve’s midpoint), and α is the steepness
of the curve. Pinf, χhalf, and α were fitted from the observed data (P and χ).
Emotion Sensitivity Index (ESI), defined as the slope of the psychometric curves fitted by the above function,
was used to investigate the sensitivity of emotional judgment at different morph levels. The results revealed a
monotonically increasing relationship between the likelihood of identifying a face as fearful and the fearfulness
in the morphed face for all participants (Fig. 3A). Participants under 2700 K (M = 1.47, SD = 0.32) and 6500 K
(M = 1.42, SD = 0.29) light conditions had similar slopes (independent-samples t-Test, t (46) = 0.55, p = 0.59).
Besides, the threshold, defined as the fearful chosen rate when the morph level was 50%, was also derived from
the fitted curve for each participant under two CCT conditions. The results showed that the fearful chosen rate in
2700 K light condition (M = 48.63, SD = 17.51) was not significantly different from that in 6500 K light condition
(M = 56.64, SD = 14.84) when the morph level was 50% (t (46) = − 1.71, p = 0.09).
For the response time (RT), LMM analysis revealed that the main effect of Valence was significant
(F(2,570) = 92.73, p < 0.001); the post-hoc test showed that participants responded significantly slower to the
neutral faces (EMM = 665.70, SE = 13.33) than to the positive faces (EMM = 617.88, SE = 13.50, p < 0.001) and
the negative faces (EMM = 606.79, SE = 13.50, p < 0.001), while the reaction time for positive faces and negative
faces was not significantly different (p > 0.05). In addition, the interaction effect between CCT and Valence was
also significant (F (2,570) = 8.70, p < 0.001, R2pseudo = 0.26). The post-hoc analysis indicated that participants’
reaction time for the negative, neutral, and positive faces did not significantly differ between 6500 K condition
(negative: EMM ± SD = 583.45 ± 19.78; neutral: EMM ± SD = 641.25 ± 19.55, positive: EMM ± SD = 611.98 ± 19.78)
and 2700 K condition (negative: EMM ± SD = 630.13 ± 19.67; neutral: EMM ± SD = 690.15 ± 19.45; positive:
EMM ± SD = 623.79 ± 19.67) after Bonferroni correction (Fig. 3B). In addition, the results yielded no significant
main or interaction effect of CCT and illuminance.
Emotional oddball task. The LMM analysis of the accuracy rate in the oddball task revealed a similar response
bias towards negative stimuli (F(2,186) = 11.96, p < 0.001, R2pseudo = 0.13), with participants showing relatively
higher response accuracy for the negative emotional stimulus (EMM = 0.96, SE = 0.01, p < 0.001) and positive
emotional stimulus (EMM = 0.95, SE = 0.01, p = 0.02) compared to the neutral emotional stimulus (EMM = 0.94,
SE = 0.01) (Fig. 4A). However, such response bias was not modulated by the illuminance and CCT manipulation
(all p values > 0.05).
Neither the illuminance nor the CCT induced a main effect on the reaction time of emotional perception
(illuminance: F(1,57) = 1.36, p = 0.25; CCT: F(1,50) = 3.73, p = 0.059), whereas the planed comparison indicated
Scientific Reports | (2021) 11:14351 | https://doi.org/10.1038/s41598-021-93523-y 6
Vol:.(1234567890)www.nature.com/scientificreports/
Figure 4. (A) Oddball accuracy of Negative vs. Neutral vs. Positive pictures under all light conditions. Whiskers
represent standard errors. p < 0.05, ***p < 0.001. (B) Oddball reaction time of negative vs. neutral vs. positive
pictures under all light conditions. Whiskers represent standard errors. *p < 0.05, **p < 0.01.
2700 K 6500 K Statistics
100 lx 1000 lx 100 lx 1000 lx CCT Illuminance CCT*illuminance
EMM (SE) EMM (SE) EMM (SE) EMM (SE) F df p F df p F df p R2
Sleepiness 4.18 (0.36) 4.06 (0.36) 4.21 (0.36) 4.4 (0.38) 0.19 (1,49) 0.67 0.01 (1,49) 0.91 0.31 (1,48) 0.58 0.07
Happiness 3.07 (0.14) 3.2 (0.14) 3.19 (0.14) 3.11 (0.14) 0.004 (1,48) 0.95 0.04 (1,48) 0.85 0.97 (1,47) 0.33 0.17
Sadness 2.37 (0.20) 2.12 (0.20) 2.45 (0.20) 2.67 (0.21) 1.69 (1,47) 0.20 0.01 (1,46) 0.91 2.37 (1,45) 0.13 0.06
Pleasantness 3.41 (0.19) 3.09 (0.19) 3.69 (0.19) 3.27 (0.20) 1.28 (1,48) 0.26 4.00 (1,49) 0.05 0.07 (1,48) 0.79 0.07
Comfort 3.29 (0.23) 3.06 (0.23) 3.52 (0.23) 3.13 (0.24) 0.34 (1,50) 0.57 2.45 (1,49) 0.12 0.16 (1,49) 0.69 0.10
Disturb 3.61 (0.21) 3.39 (0.21) 3.51 (0.21) 3.25 (0.22) 0.27 (1,50) 0.61 1.34 (1,50) 0.25 0.01 (1,49) 0.93 0.04
Warmth 3.63 (0.20) 3.73 (0.20) 2.98 (0.20) 2.82 (0.21) 13.52 (1,50) 0.001 0.02 (1,49) 0.88 0.45 (1,48) 0.50 − 0.09
Preference 3.09 (0.19) 2.79 (0.19) 3.01 (0.19) 3.02 (0.20) 0.14 (1,50) 0.71 0.59 (1,50) 0.45 0.67 (1,49) 0.42 0.02
Brightness 2.62 (0.21) 3.64 (0.21) 3.03 (0.21) 4.43 (0.22) 7.36 (1,49) 0.009 32.12 (1,48) 0.00 0.80 (1,48) 0.38 0.26
Excitement 2.35 (0.22) 3.23 (0.22) 2.74 (0.22) 3.67 (0.23) 3.34 (1,95) 0.07 17.11 (1,95) 0.00 0.01 (1,95) 0.93 0.18
Effect on work 3.02 (0.17) 2.83 (0.17) 3.29 (0.17) 3.16 (0.18) 2.38 (1,50) 0.13 1.15 (1,50) 0.29 0.03 (1,49) 0.86 0.01
Effect on mood 3.25 (0.14) 3.21 (0.14) 3.19 (0.14) 3.1 (0.15) 0.31 (1,48) 0.58 0.27 (1,48) 0.61 0.03 (1,47) 0.87 − 0.09
Table 3. Results for subjective measures (sleepiness, mood, evaluation of lighting conditions). EMM estimated
marginal means, SE standard errors. A significant difference is indicated by bold labels.
that participants’ reaction time tend to be shorter under 6500 K (EMM = 422.90, SE = 11.67) than 2700 K condi-
tion (EMM = 455.79, SE = 11.89, p = 0.059). The main effect of Valence was significant (F (2,186) = 7.13, p = 0.001,
R2pseudo = 0.08) (Fig. 4B), participants responded faster to the negative emotional stimulus (EMM = 434.35,
SE = 8.25) than positive (EMM = 442.45, SE = 8.25, p = 0.002) and neutral emotional stimulus (EMM = 441.23,
SE = 8.25, p = 0.01). Again, such difference was not susceptible to the influence from illuminance or CCT (p
value > 0.05).
Effects of lighting condition on subjective sleepiness and mood. LMM analysis showed that the
lighting conditions had no significant main and interaction effects on subjective sleepiness and subjective mood
(all p values > 0.05). LMM analysis for the light evaluation revealed a significant main effect of Illuminance
on the subjective pleasantness (F(1,49) = 4.00, p = 0.05, R2pseudo = 0.07), brightness (F(1,48) = 32.12, p < 0.001,
R2pseudo = 0.26) and excitement (F(1,95) = 17.11, p < 0.001, R2pseudo = 0.18) of the light; participants evaluated the
100 lx light as more pleasant than the 1000 lx light, while they rated 1000 lx light as brighter and more excit-
ing than the 100 lx light. Moreover, CCT elicited a significant effect on the perceived warmth (F (1,50) = 13.52,
p = 0.001, R2pseudo = − 0.09), brightness (F (1,49) = 7.36, p = 0.009) of the light. Participants evaluated the 2700 K
light as warmer than 6500 K light, but they perceived the 6500 K light as brighter than 2700 K light. In addition,
no interaction effect between Illuminance and CCT was found (Table 3).
Scientific Reports | (2021) 11:14351 | https://doi.org/10.1038/s41598-021-93523-y 7
Vol.:(0123456789)www.nature.com/scientificreports/
Discussion
Although the antidepressant effect of light therapy and the acute effects of short-term light exposure on subjective
affective state have been widely investigated, few studies have investigated the acute effects of indoor light on
pure emotional perception. The current study was conducted to explore the individual and interaction regula-
tion of illuminance and CCT of inddor light on explicit and implicit emotion perception tasks with controlling
the prior affective and vigliance state. The results mainly revealed that the lower CCT decreased the negative
response bias during emotional face judgment. Nevertheless, no such modulation effects of CCT were found on
attentional negativity bias as assessed with the emotional oddball task. Reaction speed to emotional faces and
pictures was not significantly affected with light manipulation. Moreover, the results did not reveal any significant
effects of light manipulations on subjective momentary alertness and mood. These findings contributed to the
current studies suggesting a type of task-dependent modulation effect of CCT in emotional perception and the
differential role of CCT and the illuminance of indoor light in regulating emotion perception.
For the explicit emotional perception, the CCT manipulation significantly regulated individuals’ negative
response bias, such that participants perceived the same set of faces as less fearful in 2700 K light than in 6500 K
light in the emotional face judgment task. Furthermore, it is notable that reaction time may also have to do with
this negativity bias, as a previous study found that there was a significant correlation between reaction time and
valence bias, that is, the faster participants responded to ambiguous faces, the more likely they were to judge
them as n egative72. We thus conducted an additional statistical analysis of the reaction time at seven fearful levels,
and the results showed that the RT of different fearful levels under the two CCT conditions were not significant
(p = 0.24), suggesting there was no contribution of the correlation between the reaction speed and negativity
bias in the current study.
The light-rendered emotional scene could partly explain these findings since facial expression recognition was
proved to be susceptible to scene information (a picture of an emotional scene that presents before or simultane-
ously as the face stimulus present)73–75. To be specific, the room with warm-white light (less than 3500 K) was
inclined to be perceived as a more positive (i.e., pleasant, attractive, and relaxed) atmosphere than a room with
cool-white light (with relatively high CCT). In contrast, light with high CCT (equal to or greater than 5000 K)
was perceived as a more negative atmosphere than light with low CCT76–79. The findings from the study by Lee
et al.80 also revealed that individuals’ perceptual thresholds for a morphed face continuum(neutral (0%) to fear-
ful (100%) in 10% increments) was influenced by scene information, with ambiguous fearful facial expressions
being more efficiently categorized as fearful when they were embedded in a negative scene relative to a neutral
or positive one. Thus, in the current study, the ambient light presented a different color appearance due to its
different CCT, which also led to the occurrence of scene effects.
Another possible explanation for the low CCT induced regulation of attenuated negative emotional bias is that
the low ambient CCT induced warm perception of ambient light might prime participants to perceive neutral
faces as more positive. One recent study by Gu et al.81 reported that individuals were more likely to recognize
neutral faces as happy on a warm-colored background than a cool-colored background. These findings could
be explained by the embodied cognition theory, suggesting the perception of the physical environment (such as
cold and warm, bright and dark) will trigger the activation of the higher-level psychological concepts (such as
good and bad)82,83. For instance, the previous studies reported that environmentally induced warm conditions
(touching warm beverages/pack or placing participants in warm ambient conditions) were associated with more
positive behaviors84,85.
Contrary to explicit emotional perception, the implicit emotion perception was not significantly regulated
by the manipulation of light level and CCT. However, the current findings revealed a stronger attentional bias
to the emotional pictures, with higher accuracy and faster reaction speed for positive and negative pictures than
neutral pictures, regardless of the light manipulations. These findings were comparable to the study by Huang
and Luo86, which revealed an emotional effect, as evidenced by mean reaction time was as shorter for emotional
stimuli than neutral stimuli. Differentiating versus explicit emotional processing, this performance improve-
ment in emotional stimulus was independent of CCT and illuminance, suggesting that CCT did not moderate
the attentional bias in the implicit task.
Regarding the task-dependent regulation (only manifested in the explicit emotion task) of lighting on emo-
tional perception in the current study, this may be due to the differences in the dominant processes of these
two tasks. The judgment of the face inclined to be perceptual processing via "top-down" i nfluences87, while the
response to the emotional pictures in the oddball task involved more "bottom-up" attention88. As stated in the
introduction, bright light and light of short wavelength could modulate neural activities in both top-down and
bottom-up attentional p athways89. Different from high-intensity polychromatic light and monochromatic blue
light, the polychromatic light with a relatively low blue spectrum may only have a more significant regulatory
effect on a particular neural pathway (i.e., the top-down processes). Nevertheless, as the behavioral measurement
approach was employed in the current, we had no conclusive findings of this explanation.
In addition to explicit and implicit emotion perception, the current study also investigated the acute effects
of light manipulation on momentary mood and sleepiness. The findings revealed no statistically significant
individual or interacted regulation of high illuminance and CCT level on subjective sleepiness and mood. This
finding is in line with several studies in which participants’ subjective sleepiness remained unaffected after
50 min exposure to 1000 lx vs. 200 lx light25,34 as well to 6000 K vs. 2700 K light30. Furthermore, the null effect
of CCT level on sleepiness in the current study may be explained by the fact that the short exposure duration
and medium–high CCT level were insufficient to produce an alerting effect. There was evidence that the alerting
effects of a higher CCT level were occasionally reported when more extended exposure periods (several weeks)
or extremely high CCT levels (17,000 K vs. 4000 K)29,90 was employed.
Scientific Reports | (2021) 11:14351 | https://doi.org/10.1038/s41598-021-93523-y 8
Vol:.(1234567890)www.nature.com/scientificreports/
Similarly, the subjective mood remained insensitive to the illuminance and CCT manipulation in the cur-
rent study, reflecting the results of the previous studies28,33,34. A possible explanation might be that the two-item
scale employed in the current study might not be sensitive to detecting tiny changes in mood. Other researchers
reported significant effects of illuminance or CCT of daytime light on the mood that was assessed with multiple
items questionaires25,39. Moreover, participants in the current study had a relatively agreeable emotional state at
baseline (EMM = 3.69 for happy and EMM = 2.00 for sad on the five-point items), such that lead a limited room
for improvement of mood with light manipulation. In contrast to the effects on alertness and mood, the current
findings demonstrate a more consistent picture regarding light’s effects on subjective evaluation of experimental
light. The light of 1000 lx and light of 6500 K were both perceived as brighter and more exciting; the light of
1000 lx was rated as more pleasant than the light of 100 lx, and the light of 2700 K was rated as warmer than the
light of 6500 K.
Some limitations of the current study must be considered before generalizing the experimental results. First,
the light exposure duration in the current study was relatively short (only about 30 min), and its modulatory effect
on mood and negativity bias may not be fully manifested. Secondly, the effect of time of day was not considered in
this study due to the limited number of samples, which was established as a moderator of the diurnal NIF effects
of light on physiological and psychological a ctivities30. Thirdly, the non-nonclinical sample employed might limit
the transfer of the current findings into the clinical field. Future studies should conduct a randomized controlled
trial on the effect of light on emotional processing among individuals diagnosed with seasonal affective disorder.
Conclusion
In conclusion, no significant main or interaction effects of illuminance and CCT on subjective sleepiness and
mood were found in the current study. The findings demonstrated that low CCT decreased individuals’ nega-
tive response bias, labeling ambiguous faces as less fearful during explicit emotional judgment independent of
illuminance. In comparison, no significant regulating effect of light (illuminance and CCT) on the attentional
negativity bias in the implicit emotional oddball task was revealed. These findings contribute to the current stud-
ies suggesting a type of task-dependent modulation effect of CCT in emotional perception and the differential
role of CCT and the illuminance of indoor light in regulating emotion perception.
Data availability
The datasets generated during and/or analysed during the current study are available from the corresponding
author on reasonable request.
Received: 3 February 2021; Accepted: 16 June 2021
References
1. Al-Karawi, D. & Jubair, L. Bright light therapy for nonseasonal depression: Meta-analysis of clinical trials. J. Affect. Disord. 198,
64–71. https://doi.org/10.1016/j.jad.2016.03.016 (2016).
2. Choukroun, J. & Geoffroy, P. A. Light therapy in mood disorders: A brief history with physiological insights. Chronobiol. Med. 1,
3–8. https://doi.org/10.33069/cim.2018.0009 (2019).
3. Tseng, P. T. et al. Light therapy in the treatment of patients with bipolar depression: A meta-analytic study. Eur. Neuropsychophar-
macol. 26, 1037–1047. https://doi.org/10.1016/j.euroneuro.2016.03.001 (2016).
4. Chang, C. H., Liu, C. Y., Chen, S. J. & Tsai, H. C. Efficacy of light therapy on nonseasonal depression among elderly adults: A
systematic review and meta-analysis. Neuropsychiatr. Dis. Treat. 14, 3091–3102. https://doi.org/10.2147/NDT.S180321 (2018).
5. Zhao, X., Ma, J., Wu, S., Chi, I. & Bai, Z. Light therapy for older patients with non-seasonal depression: A systematic review and
meta-analysis. J. Affect. Disord. 232, 291–299. https://doi.org/10.1016/j.jad.2018.02.041 (2018).
6. LeGates, T. A., Fernandez, D. C. & Hattar, S. Light as a central modulator of circadian rhythms, sleep and affect. Nat. Rev. Neurosci.
15, 443–454. https://doi.org/10.1038/nrn3743 (2014).
7. Stephenson, K. M., Schroder, C. M., Bertschy, G. & Bourgin, P. Complex interaction of circadian and non-circadian effects of light
on mood: Shedding new light on an old story. Sleep Med. Rev. 16, 445–454. https://doi.org/10.1016/j.smrv.2011.09.002 (2012).
8. Bedrosian, T. A. & Nelson, R. J. Influence of the modern light environment on mood. Mol. Psychiatry 18, 751–757. https://doi.org/
10.1038/mp.2013.70 (2013).
9. Bedrosian, T. A. & Nelson, R. J. Timing of light exposure affects mood and brain circuits. Transl. Psychiatry 7, e1017. https://doi.
org/10.1038/tp.2016.262 (2017).
10. Brainard, G. C. et al. Action spectrum for melatonin regulation in humans: Evidence for a novel circadian photoreceptor. J. Neurosci.
21, 6405–6412 (2001).
11. Hattar, S., Liao, H. W., Takao, M., Berson, D. M. & Yau, K. W. Melanopsin-containing retinal ganglion cells: Architecture, projec-
tions, and intrinsic photosensitivity. Science 295, 1065–1070. https://doi.org/10.1126/science.1069609 (2002).
12. Semo, M. A. et al. Melanopsin retinal ganglion cells and the maintenance of circadian and pupillary responses to light in aged
rodless/coneless (rd/rd cl) mice. Eur. J. Neurosci. 17, 1793–1801 (2003).
13. Williams, L. M. et al. ‘Negativity bias’ in risk for depression and anxiety: Brain–body fear circuitry correlates, 5-HTT-LPR and
early life stress. Neuroimage 47, 804–814 (2009).
14. Roiser, J. P., Elliott, R. & Sahakian, B. J. Cognitive mechanisms of treatment in depression. Neuropsychopharmacology 37, 117–136
(2012).
15. Mogg, K., Bradley, B. P. & Williams, R. Attentional bias in anxiety and depression: The role of awareness. Br. J. Clin. Psychol. 34,
17–36 (1995).
16. Dai, Q. & Feng, Z. Deficient interference inhibition for negative stimuli in depression: An event-related potential study. Clin.
Neurophysiol. 122, 52–61 (2011).
17. Lawson, C. & MacLeod, C. Depression and the interpretation of ambiguity. Behav. Res. Ther. 37, 463–474 (1999).
18. Hindash, A. H. C. & Amir, N. Negative interpretation bias in individuals with depressive symptoms. Cogn. Ther. Res. 36, 502–511
(2012).
19. Beevers, C. G., Clasen, P. C., Enock, P. M. & Schnyer, D. M. Attention bias modification for major depressive disorder: Effects on
attention bias, resting state connectivity, and symptom change. J. Abnorm. Psychol. 124, 463–475. https://doi.org/10.1037/abn00
00049 (2015).
Scientific Reports | (2021) 11:14351 | https://doi.org/10.1038/s41598-021-93523-y 9
Vol.:(0123456789)www.nature.com/scientificreports/
20. Disner, S. G., Beevers, C. G., Haigh, E. A. & Beck, A. T. Neural mechanisms of the cognitive model of depression. Nat. Rev. Neurosci.
12, 467–477. https://doi.org/10.1038/nrn3027 (2011).
21. Clasen, P. C., Wells, T. T., Ellis, A. J. & Beevers, C. G. Attentional biases and the persistence of sad mood in major depressive
disorder. J. Abnorm. Psychol. 122, 74–85. https://doi.org/10.1037/a0029211 (2013).
22. Elgersma, H. J. et al. Predictive value of attentional bias for the recurrence of depression: A 4-year prospective study in remitted
depressed individuals. Behav Res Ther 114, 25–34. https://doi.org/10.1016/j.brat.2019.01.001 (2019).
23. Sanchez-Lopez, A., Koster, E. H. W., Van Put, J. & De Raedt, R. Attentional disengagement from emotional information predicts
future depression via changes in ruminative brooding: A five-month longitudinal eye-tracking study. Behav Res Ther 118, 30–42.
https://doi.org/10.1016/j.brat.2019.03.013 (2019).
24. Disner, S. G., Shumake, J. D. & Beevers, C. G. Self-referential schemas and attentional bias predict severity and naturalistic course
of depression symptoms. Cogn. Emot. 31, 632–644. https://doi.org/10.1080/02699931.2016.1146123 (2017).
25. Ru, T., de Kort, Y. A. W., Smolders, K. C. H. J., Chen, Q. & Zhou, G. Non-image forming effects of illuminance and correlated color
temperature of office light on alertness, mood, and performance across cognitive domains. Build. Environ. 149, 253–263. https://
doi.org/10.1016/j.buildenv.2018.12.002 (2019).
26. Smolders, K. C. H. J. & de Kort, Y. A. W. Bright light and mental fatigue: Effects on alertness, vitality, performance and physiological
arousal. J. Environ. Psychol. 39, 77–91. https://doi.org/10.1016/j.jenvp.2013.12.010 (2014).
27. Bijleveld, E. & Knufinke, M. Exposure to bright light biases effort-based decisions. Behav. Neurosci 132, 183–193. https://doi.org/
10.1037/bne0000244 (2018).
28. Smolders, K. C., de Kort, Y. A. & Cluitmans, P. J. A higher illuminance induces alertness even during office hours: Findings on
subjective measures, task performance and heart rate measures. Physiol. Behav. 107, 7–16. https://doi.o rg/10.1016/j.physbeh.2012.
04.028 (2012).
29. Mills, P. R., Tomkins, S. C. & Schlangen, L. J. The effect of high correlated colour temperature office lighting on employee wellbeing
and work performance. J. Circadian Rhythms 5, 2. https://doi.org/10.1186/1740-3391-5-2 (2007).
30. Smolders, K. C. H. J. & de Kort, Y. A. W. Investigating daytime effects of correlated colour temperature on experiences, performance,
and arousal. J. Environ. Psychol. 50, 80–93. https://doi.org/10.1016/j.jenvp.2017.02.001 (2017).
31. Leichtfried, V. et al. Intense illumination in the morning hours improved mood and alertness but not mental performance. Appl.
Ergon. 46(Pt A), 54–59. https://doi.org/10.1016/j.apergo.2014.07.001 (2015).
32. Baron, R. A., Rea, M. S. & Daniels, S. G. Effects of indoor lighting (illuminance and spectral distribution) on the performance of
cognitive tasks and interpersonal behaviors—The potential mediating role of positive affect. Motiv. Emot. 16, 1–33. https://doi.
org/10.1007/Bf00996485 (1992).
33. Huiberts, L. M., Smolders, K. C. & de Kort, Y. A. Shining light on memory: Effects of bright light on working memory performance.
Behav. Brain Res. 294, 234–245. https://doi.org/10.1016/j.bbr.2015.07.045 (2015).
34. Huiberts, L. M., Smolders, K. C. & de Kort, Y. A. Non-image forming effects of illuminance level: Exploring parallel effects on
physiological arousal and task performance. Physiol. Behav. 164, 129–139. https://doi.org/10.1016/j.physbeh.2016.05.035 (2016).
35. Hawes, B. K., Brunyé, T. T., Mahoney, C. R., Sullivan, J. M. & Aall, C. D. Effects of four workplace lighting technologies on percep-
tion, cognition and affective state. Int. J. Ind. Ergon. 42, 122–128. https://doi.org/10.1016/j.ergon.2011.09.004 (2012).
36. Hopkins, S. et al. Blue-enriched lighting for older people living in care homes: Effect on activity, actigraphic sleep, mood and
alertness. Curr. Alzheimer Res. 14, 1053–1062. https://doi.org/10.2174/1567205014666170608091119 (2017).
37. Knez, I. Affective and cognitive reactions to subliminal flicker from fluorescent lighting. Conscious Cogn. 26, 97–104. https://doi.
org/10.1016/j.concog.2014.02.006 (2014).
38. Knez, I. & Enmarker, I. Effects of office lighting on mood and cognitive performance and a gender effect in work-xrelated judg-
ment. Environ. Behav. 30, 553–567. https://doi.org/10.1177/001391659803000408 (1998).
39. Zhu, Y. et al. Effects of illuminance and correlated color temperature on daytime cognitive performance, subjective mood, and
alertness in healthy adults. Environ. Behav. 51, 199–230. https://doi.org/10.1177/0013916517738077 (2019).
40. Chen, L. et al. The effects of short-term light exposure on subjective affect and comfort are dependent on the lighting time of day.
Sci. Rep. 11, 1–7 (2021).
41. Lan, L., Hadji, S., Xia, L. L. & Lian, Z. W. The effects of light illuminance and correlated color temperature on mood and creativity.
Build Simul-China 14(3), 463–475. https://doi.org/10.1007/s12273-020-0652-z (2020).
42. Lan, L., Hadji, S., Xia, L. & Lian, Z. In Building Simulation. 463–475 (Springer).
43. Fotios, S., Yang, B. & Cheal, C. Effects of outdoor lighting on judgements of emotion and gaze direction. Light. Res. Technol. 47,
301–315 (2015).
44. Yang, B. & Fotios, S. Lighting and recognition of emotion conveyed by facial expressions. Light. Res. Technol. 47, 964–975 (2015).
45. Fotios, S., Castleton, H., Cheal, C. & Yang, B. Investigating the chromatic contribution to recognition of facial expression. Light.
Res. Technol. 49, 243–258 (2017).
46. Fisher, P. M. et al. Three-week bright-light intervention has dose-related effects on threat-related corticolimbic reactivity and
functional coupling. Biol. Psychiatry 76, 332–339. https://doi.org/10.1016/j.biopsych.2013.11.031 (2014).
47. Lambert, G. W., Reid, C., Kaye, D. M., Jennings, G. L. & Esler, M. D. Effect of sunlight and season on serotonin turnover in the
brain. Lancet 360, 1840–1842. https://doi.org/10.1016/s0140-6736(02)11737-5 (2002).
48. Yoshiike, T., Honma, M., Yamada, N., Kim, Y. & Kuriyama, K. Effects of bright light exposure on human fear conditioning, extinc-
tion, and associated prefrontal activation. Physiol. Behav. 194, 268–276. https://doi.org/10.1016/j.physbeh.2018.06.015 (2018).
49. Lang, T. J., Blackwell, S. E., Harmer, C. J., Davison, P. & Holmes, E. A. Cognitive bias modification using mental imagery for
depression: Developing a novel computerized intervention to change negative thinking styles. Eur. J. Pers. 26, 145–157 (2012).
50. Yang, W., Ding, Z., Dai, T., Peng, F. & Zhang, J. X. Attention bias modification training in individuals with depressive symptoms:
A randomized controlled trial. J. Behav. Ther. Exp. Psychiatry 49, 101–111 (2015).
51. Alkozei, A. et al. Exposure to blue light increases subsequent functional activation of the prefrontal cortex during performance of
a working memory task. Sleep 39, 1671–1680. https://doi.org/10.5665/sleep.6090 (2016).
52. Perrin, F. et al. Nonvisual responses to light exposure in the human brain during the circadian night. Curr. Biol. 14, 1842–1846.
https://doi.org/10.1016/j.cub.2004.09.082 (2004).
53. Vandewalle, G. et al. Brain responses to violet, blue, and green monochromatic light exposures in humans: Prominent role of blue
light and the brainstem. PLoS ONE 2, e1247. https://doi.org/10.1371/journal.pone.0001247 (2007).
54. Vandewalle, G. et al. Daytime light exposure dynamically enhances brain responses. Curr. Biol. 16, 1616–1621. https://doi.org/10.
1016/j.cub.2006.06.031 (2006).
55. Alkozei, A., Smith, R. & Killgore, W. D. Exposure to blue wavelength light modulates anterior cingulate cortex activation in response
to “uncertain” versus “certain” anticipation of positive stimuli. Neurosci. Lett. 616, 5–10. https://doi.org/10.1016/j.neulet.2016.01.
034 (2016).
56. Vuoskoski, J. K. & Eerola, T. The role of mood and personality in the perception of emotions represented by music. Cortex 47,
1099–1106 (2011).
57. Mayer, J. D., Gaschke, Y. N., Braverman, D. L. & Evans, T. W. Mood-congruent judgment is a general effect. J. Pers. Soc. Psychol.
63, 119–132 (1992).
58. Faul, F., Erdfelder, E., Lang, A. G. & Buchner, A. G*Power 3: A flexible statistical power analysis program for the social, behavioral,
and biomedical sciences. Behav. Res. Methods 39, 175–191. https://doi.org/10.3758/Bf03193146 (2007).
Scientific Reports | (2021) 11:14351 | https://doi.org/10.1038/s41598-021-93523-y 10
Vol:.(1234567890)You can also read