Effects of Pasteurization and High-Pressure Processing of Camel and Bovine Cheese Quality, and Proteolysis Contribution to Camel Cheese Softness
←
→
Page content transcription
If your browser does not render page correctly, please read the page content below

ORIGINAL RESEARCH
                                                                                                                                                published: 17 June 2021
                                                                                                                                         doi: 10.3389/fnut.2021.642846

                                               Effects of Pasteurization and
                                               High-Pressure Processing of Camel
                                               and Bovine Cheese Quality, and
                                               Proteolysis Contribution to Camel
                                               Cheese Softness
                                               Mustapha Mbye 1 , Huda Mohamed 1 , Tholkappiyan Ramachandran 2 , Fathalla Hamed 2 ,
                                               Ahlam AlHammadi 3 , Rabih Kamleh 3 and Afaf Kamal-Eldin 1*
                                               1
                                                Department of Food Science, United Arab Emirates University, Al-Ain, United Arab Emirates, 2 Department of Physics,
                                               United Arab Emirates University, Al-Ain, United Arab Emirates, 3 Agthia Public Joint Stock Company (PJSC) Group of
                                               Companies, Al Ain, United Arab Emirates

                                               The effects of high-pressure processing (HPP) compared to thermal treatments on the
                             Edited by:        quality of camel vs. bovine cheeses were studied. The study showed that camel milk
                        Golfo Moatsou,
               Agricultural University of      has a lower microbial load compared to bovine milk, which is maintained during 7 days’
                        Athens, Greece         storage of the processed milk. The effect of three HPP treatments (350, 450, and 550
                        Reviewed by:           MPa for 5 min at 4◦ C) and two pasteurization treatments (65◦ C for 30 min and 75◦ C for
                  Jorge Welti-Chanes,
Monterrey Institute of Technology and
                                               30 s) on the quality of soft unripened camel and bovine milk cheeses were accessed. The
   Higher Education (ITESM), Mexico            cheeses were evaluated for pH, yield, proximate composition, textural and rheological
Bruno Ricardo de Castro Leite Júnior,          properties, microstructure, and protein profile by SDS-PAGE electrophoresis. The effects
   Federal University of Viçosa, Brazil
                                               of the treatments on cheese’s hardness were different between the camel and bovine
                   *Correspondence:
                       Afaf Kamal-Eldin        cheeses; while heat treatment at 65◦ C for 30 min gave the hardest bovine milk cheese
                afaf.kamal@uaeu.ac.ae          (1,253 ± 20), HPP treatment at 350 MPa for 5 min gave the highest value for camel milk
                                               cheese (519 ± 5) (p < 0.05). The hardness of the cheeses was associated with low yield
                    Specialty section:
          This article was submitted to        and moisture content. SDS-PAGE electrophoresis revealed that extensive proteolysis
           Nutrition and Food Science          might have contributed to the softness of camel cheeses compared to bovine and
                             Technology,
                                               suggested the involvement of some residual enzyme activities.
                a section of the journal
                    Frontiers in Nutrition     Keywords: camel milk, bovine milk, cheese quality, pasteurization, high pressure processing
       Received: 16 December 2020
           Accepted: 26 May 2021
          Published: 17 June 2021              INTRODUCTION
                              Citation:
                Mbye M, Mohamed H,             Nowadays, great attention is given to camel milk production and consumption because of its high
          Ramachandran T, Hamed F,             nutritional value and digestibility (1). Bacterial fermentation and cheese manufacture are typical
         AlHammadi A, Kamleh R and             of perverse dairy products (2). Still, up to now, their application to camel milk is limited due to
       Kamal-Eldin A (2021) Effects of         the extreme softness of the produced coagulum (3–5). The most crucial step in cheese making
     Pasteurization and High-Pressure
                                               is the chymosin-induced coagulation of milk (6). The coagulation rate and the outcome of the
     Processing of Camel and Bovine
       Cheese Quality, and Proteolysis
                                               cheese are significantly influenced by different factors, including the animal species and breed, the
        Contribution to Camel Cheese           composition of the milk, and pretreatment of the milk such as pasteurization, homogenization,
      Softness. Front. Nutr. 8:642846.         and pressure treatment (7). Milk pasteurization is an important step in cheese making to ensure the
      doi: 10.3389/fnut.2021.642846            safety of the cheese (8). However, higher temperatures may lead to adverse effects on curd formation

Frontiers in Nutrition | www.frontiersin.org                                         1                                             June 2021 | Volume 8 | Article 642846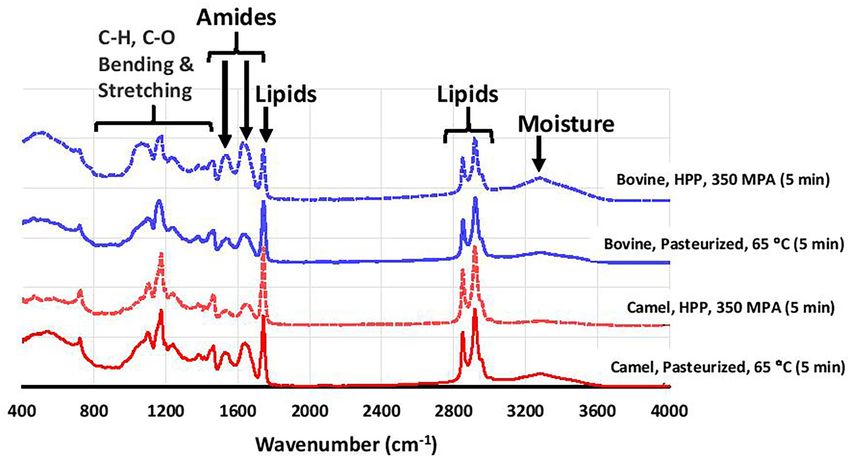
Mbye et al.                                                                                     High-Pressure Processing of Camel Cheese Quality

due to longer coagulation times and weaker gels (9, 10) and             bromophenol blue), resolving gel buffer (1.5M Tris HCL, pH
are less suitable for cheese production (7). Thus, non-thermal          8.8), stacking gel buffer (0.5 M Tris HCL, pH 6), sodium dodecyl
technologies, such as high-pressure processing (HPP), have              sulfate (SDS) solution (10%), dithiothreitol (DTT), ammonium
emerged as alternatives to traditional heat treatment in milk and       persulphate (APS), 10 × TGS buffer (0.25M Tris, 1.92M glycine
dairy products (11).                                                    and 1% sodium dodecyl sulfate), QC colloidal Coomassie stain
   HPP provides a useful food preservation method that                  and 30% acrylamide/Bis solution 29:1 (v/v) were purchased from
eliminates food bacteria by disrupting their cell membranes and         Bio-Rad Laboratories Inc. (Hercules, CA, USA).
the intermediate layer between the cell wall and the cytoplasmic
membrane, deactivating membrane ATPase, and destroying the              Heat Treatments and High-Pressure
nucleic acids and ribosomes involved in protein synthesis (12).
Unlike heat treatments, HHP also maintains the quality of fresh
                                                                        Processing of Milk
                                                                        The first experiment was performed using a central composite
foods with little effect on flavor and nutritional factors such
                                                                        rotatable design with varying combinations of the independent
as vitamins and other bioactive compounds (13). HHP of milk
                                                                        variable pressure (308, 350, 450, 550, and 590 MPa at 4◦ C) and
induces electrostatic interactions between proteins leading to
                                                                        time (1, 3, 6, 9, and 10 mins) (17) and the response variables
their disruption, solubilization of colloidal calcium phosphate,
                                                                        (cheese yield, hardness, and viscosity) were measured Table 1.
reduction in the size of casein micelles, and the whey protein’s
                                                                        Similarly, microbiological analyzes were carried out on the milk
denaturation (14, 15). This modification was reported to improve
                                                                        samples after various pressure-time combinations or after the
the milk coagulation time and gel firmness of bovine milk cheese
                                                                        pasteurization treatments Table 5. In the second experiment, the
(15, 16). To the best of our knowledge, no data is available to
                                                                        milk samples were subjected to two pasteurization regimes and
describe the effect of HPP on camel milk’s microbial load and
                                                                        three high-pressure treatment levels, as explained in Table 2.
milks utilization in cheese manufacture.
                                                                        In this experiment, several other parameters were measured in
   To explore a wider range of pressure-time combinations at
                                                                        addition to yield, hardness, and viscosity.
a fixed temperature of 4◦ C, two experiments were performed.
                                                                           Heat treatments of milk samples were performed by low-
In the first experiment, the effect of pressure (350, 450, and
                                                                        temperature long time (LTLT, 65◦ C for 30 min) or high-
550 MPa) and time (3, 6, and 9 min) on microbial count
                                                                        temperature short-time (HTST, 75◦ C for 30 s) pasteurization. For
load, cheese’s yield, hardness, and viscosity were assessed. In
                                                                        the high-pressure processing (HPP), the two kinds of milk (camel
the second experiment, the effects of the two pasteurization
                                                                        and bovine) were filled in plastic bottles (330 mL) without any
temperatures (65◦ C for 30 min, 75◦ C for 30 s) and three high-
                                                                        headspace and subsequently vacuum seal packed in polyethylene
pressure treatments (350, 450, and 550 MPa for 5 min at 4◦ C)
                                                                        bags using a vacuum packaging machine Multivac Sepp C350
on the textural and physicochemical properties of cheeses made
                                                                        (Haggenmuller SE and CO. KG, Düsseldorf, Germany) before
from camel and bovine milk were studied. Analysis of the cheeses
                                                                        pressurizations. HPP treatments were performed using an Iso-
by SDS-PAGE electrophoresis showed that proteolytic activities
                                                                        Lab high-pressure pilot food processor S-FL-100-250-09-W
generate a large number of peptides in the camel but not bovine
                                                                        (Stansted fluid power LTD Essex, UK). The HP unit consisted
cheeses, which might be responsible for the softness of the camel
                                                                        of a system that generates a maximum pressure of 700 MPa,
milk cheeses.
                                                                        an inlet and outlet temperature of 2–4◦ C, a pressure rate of 5
                                                                        MPa/s, and a heating rate of (0.5◦ C/100 MPa). In this study,
MATERIALS AND METHODS                                                   HPP was performed at three pressures (350, 450, and 550 MPa)
                                                                        at 4◦ C for different times as explained in experiments 1 and
Materials                                                               2. The system was equipped with a water jacket that allows
Tank pooled raw camel and bovine milk samples were purchased
                                                                        temperature control in the pressure chamber by circulating cold
from the Al Ain Dairy farm (Abu Dhabi Emirate, UAE).
                                                                        water. The pressure chamber was filled with distilled water as
The milk was delivered to the Food Science Department
                                                                        the transmitting fluid. The plastic bottles containing the milk
at United Arab Emirates University in refrigerated coolers
                                                                        samples were submerged in the pressure chamber and then
(4◦ C). The lyophilized yogurt starter culture used was Yoflex
                                                                        subjected to varying combinations of pressure and time, as
Express R 1.0, a 1:1 mixture of Streptococcus thermophiles and
                                                                        described in Tables 1, 2.
Lactobacillus bulgaricus subsp. delbrückii. Recombinant camel
chymosin (CHY-MAX R M, activity of 1,000 IMCU/mL) was
from Chr. Hansen (Hoersholm, Denmark). TEMED Ultra for                  Microbiological and Raw Milk Composition
molecular biology (N, N, N′ , N′ -Tetramethylethylenediamine,           Analysis
>99%), calcium chloride, and all other chemicals and reagents           Milk samples (25 ml) were diluted in buffered peptone saline
were of analytical grade and were purchased from Sigma-                 (225 ml, 0.5% w/v; peptone; 0.85% w/v; NaCl), mixed in
Aldrich (St. Louis, Missouri, USA). Unless otherwise stated, all        stomacher bag (Seward 400, England) for 2 min. To quantify
the media and supplements used throughout microbial analysis            the various microbial groups, Increased sensitivity to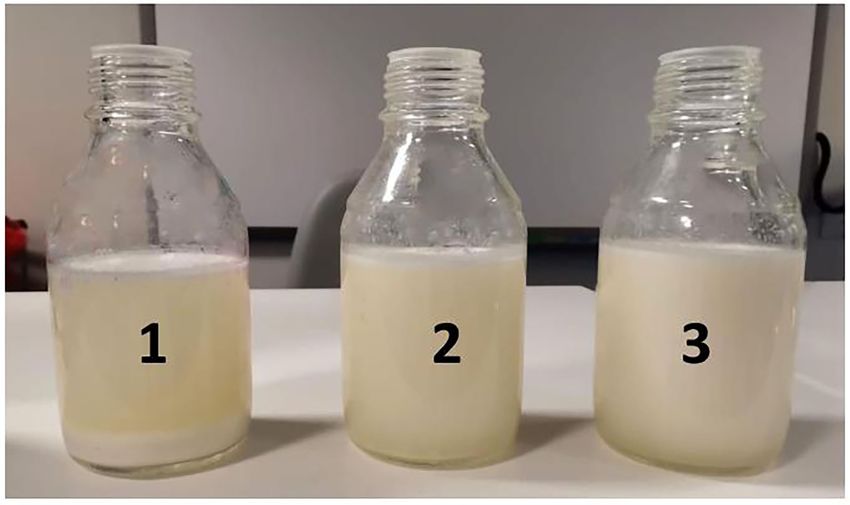
Mbye et al.                                                                                                          High-Pressure Processing of Camel Cheese Quality

TABLE 1 | Experimental design of the independent variables (pressure, time, and 4◦ C) and results of associated response variables (cheese yield hardness and viscosity).

Run order             Independent variables                                                          Response variables

                    Pressure               Time               Yield (g/100 g milk)                        Hardness (g)                         Viscosity (Pa.s)
                     (MPa)                 (min)
                                                           Camel              Bovine              Camel               Bovine              Camel              Bovine
                                                           cheese             cheese              cheese              cheese              cheese             cheese

1                      550                     3            15.8                19.2                271                  684               7,990              10,358
2                      590                     6            16.3                20.6                212                  583               7,819              9,499
3                      450                     6            13.4                16.0                334                  810               8,778              13,488
4                      450                     1            12.9                15.8                362                  843               8,821              13,188
5                      450                     6            13.6                16.3                341                  812               8,766              13,452
6                      450                     6            13.4                16.8                343                  819               8,758              13,423
7                      450                     10           14.0                18.8                311                  783               8,655              13,288
8                      350                     9            12.0                15.2                519                  927               9,431              16,699
9                      350                     3            12.4                15.5                498                  900               9,212              16,241
10                     450                     6            13.5                17.1                337                  814               8,722              13,417
11                     308                     6            12.2                15.4                507                  913               9,330              16,441
12                     550                     9            16.0                19.8                243                  652               7,919              10,058
13                     450                     6            13.7                16.6                335                  822               8,768              13,488

was carried out on plate count agar (PCA), incubated at 32◦ C                            acidity was determined in triplicate using the standard method
for 72 h (18). The coliforms were determined by the most                                 ISO/TS 11,869:2,012 [IDF/RM 150:2,012 (3)]. The texture profile
probable number (MPN) method according to the US standard                                analysis (TPA) of the cheese samples was analyzed using a CT
method (19). Staphylococcus aureus was enumerated on Baird                               III texture analyzer equipped with a 4.5 kg load cell (Brookfield,
Parker agar supplemented with egg yolk according to (20).                                Middleborough, Massachusetts, USA). TPA was carried out with
Listeria monocytogenes were detected according to (21) while the                         a compression test of the cheese in a 40 mL cup using a 25-
Escherichia coli was examined with MacConkey agar followed by                            mm-diameter perplex cylindrical probe (TA11/1000) with a test
24 h incubation at 37◦ C according to (22).                                              speed of 1 mm/s and 3 mm of target distance (3). The hardness
   Lactose, protein, fats, and total solids contents (%) were                            (the amount of force required to attain a given deformation),
evaluated using Near Infra-Red Multipurpose Analyzer (MPA),                              cohesiveness (a measure of the extent to which cheese can be
Bruker Optik Gmbh (Ettlingen, Germany) (23). The pH of                                   deformed before it ruptures), gumminess (the ability of cheese
the samples was determined using a digital pH meter (Starter                             to regain its original position during the first deformation test),
3100; Ohaus, New Jersey, USA), and the titratable acidity was                            and chewiness (a measure of the energy required to masticate
determined in triplicate using the standard method ISO/TS                                cheese into a uniform state before swallowing) were performed
11,869:2,012 (IDF/RM 150:2,012) (3).                                                     on cheese samples at room temperature (27).
                                                                                             The rheological properties measurement was carried out in a
Preparation of the Cheeses                                                               stress-controlled rheometer (Discovery Hybrid Rheometer, TA
Two liters of treated camel or bovine milk was processed into                            Instruments, Delaware, USA) fitted with cone plate geometry
cheeses, three repetitions per treatment, supplemented with                              (30 mm diameter and 2◦ of inclination angle). Samples were
calcium chloride (3%) and incubated with 3% (w/v) of an active                           loaded and spread on the horizontal plate’s surface, and leftover
thermophilic yogurt starter culture at 43◦ C for 60 min to allow                         pieces were trimmed off. The cheese was rested for 5 min to allow
the pH to fall to 6.2 (3). Thereafter, recombinant camel chymosin                        it to attain thermal equilibrium and stress relaxation. The top
(CHY-MAX R M, 50 IMCU) was added to the milk (24), and the                               plate was slowly lowered until the gap was 1 mm. Strain sweep
incubation was continued for 4 h until the pH reached 4.8, and                           tests were conducted from 0.01 to 100% at a frequency of 1 Hz (3).
firm curd was observed. Then, the curd was placed in cheesecloth                         The data obtained were elastic modulus (G′ ), viscous modulus
to drain for 8 h (25).                                                                   (G′′ ), and viscosity (Pa.s), which gave the viscoelastic range.
                                                                                         Each measurement was performed in triplicate at a controlled
Cheese Yield and Physicochemical                                                         temperature of 25◦ C using a water-cooling system (Thermo Cube
Properties                                                                               Model 10–300-1CL, New York USA).
The cheese yield was calculated as the percentage of weight                                  The microstructures of different cheese samples were
recovered from the whole milk used for preparation (Yield =                              observed using a JEOL JSM-6010LA scanning electron
kg of fresh cheese × 100/mL of processed milk) (26). The                                 microscope (SEM, Akishima, and Tokyo, Japan). The lyophilized
pH of the samples was determined using a digital pH meter                                cheese samples were placed on an aluminum SEM stub with
(OHAUS, Starter 3100, New Jersey, USA), and the titratable                               double-sided adhesive carbon tape and coated with gold. The

Frontiers in Nutrition | www.frontiersin.org                                         3                                            June 2021 | Volume 8 | Article 642846
Mbye et al. High-Pressure Processing of Camel Cheese Quality
samples were observed under a high vacuum and a voltage of
18 ± 0.45ab
19 ± 0.31b
47 ± 0.12d
23 ± 0.05d
6.4 ± 0.15a
0.47 ± 0.02e
(5 time at 4◦ C)
0.7 ± 0.05i
12,376 ± 327d
80,201 ± 156d
23,353 ± 228d
20 kV and recorded the micrographs of the pieces at a 400×
305 ± 12c
645 ± 7d
59 ± 1c
550 MPa
magnification (3).
The Chemical Composition of the Cheeses
bc
0.45 ± 0.01ef
and Wheys
b
h
c
13,539 ± 320c
81,586 ± 351c
24,520 ± 164c
5.9 ± 0.05
0.8 ± 0.04
49 ± 0.21
18 ± 0.74
(5 min at 4◦ C)
79 ± 6.7b
17 ± 0.4c
c
25 ± 0.1
810 ± 12
356 ± 7b
450 MPa
The total solid, fat, and protein in camel and bovine milk
cheese and whey samples were determined by near infra-red
multipurpose analyzer using the equipment calibration model
(MPA, Bruker Optik Gmbh, Ettlingen, Germany). All the samples
Bovine milk cheeses
abc
were analyzed on the same day in triplicate. Fourier transform
bc
15 ± 0.15d
b
b
g
0.41 ± 0.02f
16,429 ± 240b
97,753 ± 336b
32,173 ± 141b
5.8 ± 0.02
1.1 ± 0.05
51 ± 0.11
28 ± 0.05
18.6 ± 0.24
(5 min at 4◦ C)
93 ± 1.5a
infrared (FTIR) spectroscopy of the cheese sample was analyzed
b
374 ± 7b
350 MPa
913 ± 9
with ATR-FTIR mid-infrared spectrometer (Nicole-TM 1S50
FTIR, Thermo Fisher Scientific, Massachusetts, USA). Three
infrared spectra per sample were recorded between 4,000 and 400
cm−1 at a resolution of 4 cm−1 . The dried cheese was ground and
d
0.52 ± 0.02d
h
e
e
f
38,499 ± 186h
11,786 ± 153h
5.4 ± 0.02
1.3 ± 0.02
41 ± 0.13
20 ± 0.08
15.5 ± 0.31
51 ± 1.5d
21 ± 0.2a
mixed with potassium bromide at 1:5 (sample: KBr). The pellet
6,859 ± 43h
e
75◦ C (30 s)
438 ± 14
227 ± 5d
HTST,
was then prepared, compressed, and scanned (28). The data was
processed by OPUS/IR spectroscopic software installed on the
FTIR system.
Protein analysis of camel and bovine cheese samples was
d
0.37 ± 0.01g
a
a
f
17,419 ± 119a
99,360 ± 233a
37,694 ± 204a
5.6 ± 0.04
1.2 ± 0.03
53 ± 0.13
29 ± 0.09
14 ± 0.3e
a
99 ± 2.5a
performed using sodium dodecyl sulfate-polyacrylamide gel
a
463 ± 17a
19.2 ± 0.3
1,253 ± 20
LTLT, 65 C
(30 min)
◦
electrophoresis (SDS-PAGE) (29). Cheese samples were prepared
using the method described before (30). Cheese samples (0.6 g)
were dissolved in 25 ml. of 8M urea. The cheese samples
TABLE 2 | Chemical composition of camel and bovine milk cheeses prepared from pasteurized and HPP-treated milk*.
were homogenized for 2 min using T 25 digital Ultra-Turrax
cd
7.4 ± 0.21ef
0.68 ± 0.01b
g
e
e
f
46,334 ± 350g
20,621 ± 308g
5.8 ± 0.03
1.7 ± 0.04
39.4 ± 0.13
22.2 ± 0.12
13.3 ± 0.21
(5 min at 4◦ C)
14.7 ± 0.3e
7,945 ± 38g
(IKA-Werke GmbH and Co., KG, Staufen, Germany). To
h
187 ± 7e
550 MPa
276 ± 7
dissociate caseins, the urea-cheese dispersion was incubated in
a temperature-controlled water bath at 37◦ C for 2 h and then
defatted by centrifugation at 9,150 g at 4◦ C for 35 min and filtered
*Values within a raw having different superscripts are significantly different (p < 0.05, n = 3 per treatment).
through Whatman no. 1 filter paper (pore size, 11 µm). Of the
0.65 ± 0.01bc
7.7 ± 0.31ef
d
d
g
e
f
5.6 ± 0.01
1.9 ± 0.02
39.7 ± 0.22
21.8 ± 0.13
13.2 ± 0.41
filtered sample, a 10 µl portion was added to 30 µl of 4X Lamelli
(5 min at 4◦ C)
53,429 ± 129f
21,424 ± 260f
13.5 ± 0.2f
8,746 ± 22f
224 ± 5d
g
450 MPa
341 ± 5
buffer solution containing 50 mM Dithiothreitol (added freshly).
The sample and sample buffer mix were heated in a temperature-
Values superscripts are significantly different (p < 0.05) with a the highest and i the lowest.
controlled water bath for 5 min at 90◦ C. From this mix, 6 µl was
Camel milk cheeses
loaded on the hand-cast polyacrylamide gels.
Gels with 1 mm thickness were prepared using the gel hand
0.53 ± 0.01d
e
c
f
23,289 ± 139d
58,671 ± 252e
5.5 ± 0.02
2.5 ± 0.05
40.6 ± 0.26
(5 min at 4◦ C)
11.5 ± 0.2h
e
12 ± 0.2e
f
9,804 ± 81e
21.2 ± 0.1
14.3 ± 0.3
d
281 ± 5c
casting accessories provided with the Bio-Rad Mini- PROTEAN
350 MPa
519 ± 5
Tetra cell (Bio-Rad Laboratories Inc., Hercules, California, USA).
A 12% resolving gel and 4% stacking gel were prepared. To
prepare a quantity of 15 ml of 12% resolving gel solution
h
a
c
0.82 ± 0.02a
the following were added: 6 ml 30% acrylamide/Bis Solution
f
3.7.8 ± 0.13f
i
G-double prime (pa.s) 22,172 ± 129e 11,336 ± 267h
5.2 ± 0.03
2.9 ± 0.05
37.4 ± 0.16
17.6 ± 0.37
17.8 ± 0.03
3,448 ± 235i
58,240 ± 150e 22,657 ± 213i
17 ± 0.3c
HTST, 75 C
185 ± 8e
i
29:1, 3.75 ml 1.5M Tris HCL (pH 8.8), 150 µl 10% SDS
228 ± 7
◦
(30 s)
solution, 5.03 ml deionized water, 75 µl of 10% APS (ammonium
persulphate), 7.5 µl TEMED. To prepare a quantity of 15 ml of
4% stacking gel solution the following were added: 1.98 ml 30%
8.9. ± 0.36ef
b
12 ± 0.02g
0.62 ± 0.02c
de
f
5.3 ± 0.01
2.7 ± 0.04
g
f
9,717 ± 15e
40.9 ± 0.2
20.5 ± 0.1
15.14 ± 0.1
acrylamide / Bis Solution 29:1, 3.78 ml 0.5 M Tris HCL (pH 6.8),
228 ± 8d
g
LTLT, 65 C
367 ± 6
(30 min)
◦
150 µl 10% SDS solution, 9 ml deionized water, 75 µl 10% APS,
15 µl TEMED. Electrophoresis was executed at 200 V using a
power supply from Bio-Rad power basic. The gels were kept for
1 h in a solution of 40% ethanol and 10% acetic acid for fixation
Quality parameter
of the protein bands. Gels were stained for 20 h using the QC
Chewiness (MJ)
Gumminess (g)
Viscosity (Pa.s)
Total solids (%)
G-prime (pa.s)
colloidal Coomassie stain. The gels were destained for 3 h by
Cohesiveness
Hardness (g)
Protein (%)
Acidity (%)
changing the distilled water three times. Gel DocTM XR+ and
Yield (%)
Fat (%)
ChemidocTM XRS+ Imaging Systems (Bio-Rad Laboratories
pH
Inc., Hercules, California, USA) performed gel image acquisition
Frontiers in Nutrition | www.frontiersin.org 4 June 2021 | Volume 8 | Article 642846
Mbye et al.                                                                                         High-Pressure Processing of Camel Cheese Quality

and densitometry. The Image lab software (version 6) operated               cheese yield, hardness, and viscosity (associated response
the instrument. The software was used to determine the protein              variables). Plots showing the interaction effects of the
bands’ molecular weights, integrate the peaks, and determine                independent variables are shown in Table 1. The results
their relative densities.                                                   clearly show that the increase in pressure results in higher
                                                                            yield but lower hardness and viscosity in both camel and
Statistical Analysis                                                        bovine cheeses (Figure 1), which agrees with others (15, 44).
A central composite rotatable design (Table 1) and the                      The negative correlation between cheese yield and hardness is
dependent and independent variables’ model relationships                    consistent with our previous observations explained by increased
(Table 3) were designed using Minitab R 19 (USA). The data                  moisture content in the soft cheeses (3). Certain HPP and
on the physicochemical, textural, rheological, and proximate                pressurization conditions may promote extensive whey protein
composition were analyzed using a one-way analysis of variance              denaturation and interaction with the κ-casein on the surface
(ANOVA) technique. The statistical data were analyzed using the             of the casein micelle (14, 45). Denatured whey proteins were
commercial statistical package IBM SPSS (SPSS INC., Chicago,                suggested to protect the casein micelles from dissociation and to
IL, USA). Cheese preparation and analytical measurements were               serve as barriers against their aggregation resulting in cheeses
executed in triplicate, and mean values and standard deviations             with a relatively open structure and high moisture retention (46).
were used in the calculations. Means were related using the                 In the case of cheeses made from LTLT and HPP at 350 MPa, this
least significant difference, and a probability of p ≤ 0.05 was             effect might have been minimal explaining the harder texture
considered statistically significant.                                       and lower moisture content.
                                                                                Table 3 presents the mathematical models that show the
                                                                            significance of the independent variables and their interactions
RESULTS AND DISCUSSION
                                                                            in affecting the camel and bovine cheeses’ yield, hardness,
Milk Composition                                                            and viscosity. The most important terms for both camel and
The gross composition of camel milk (pH, 6.61; acidity, 0.15%;              bovine cheeses include the constant, which signifies the inherent
Lactose, 4.43%; total solids, 12.4%; protein, 2.7%; and fat, 3.1%)          differences between the camel and bovine milk, the pressure,
was slightly different from that of bovine milk (pH, 6.68; acidity,         and the time and pressure square interactions. The effect
0.15%; lactose, 5.08%; total solids, 12.6%; protein, 2.98 %; and fat,       of the independent variables on hardness and viscosity were
3.4%) in agreement with other researchers (23, 31–33).                      qualitatively similar between the camel and bovine cheeses
                                                                            despite the notable quantitative differences where camel cheeses
Effect of HPP and Thermal Pasteurization                                    are significantly (p < 0.001) softer than the corresponding bovine
on the Microbial Loads in Camel and                                         cheeses. These observed difference between bovine and camel
                                                                            cheeses is reported to be mainly due to difference in caseins
Bovine Kinds of Milk                                                        composition. There is a major difference between camel milk and
Table 4 revealed that all the pressure-time combinations used
                                                                            bovine milk caseins. Camel milk caseins consist of α-s1, (22.0%),
in this study were enough to maintain the total plate count
                                                                            α-s2, (9.5%), β, (65.0%), and κ (3.5%) whereas bovine milk
and other bacteria below the acceptable limit in camel but
                                                                            caseins consist of high percentage of α-casein (38%) followed
not in bovine milk (34). Studies have shown that HPP
                                                                            by 36–39% β-casein and 13% κ-casein (47). Milk κ-casein is the
treatments at 350 and 450 MPa at room temperature and
                                                                            major player in cheese quality because coagulation is initiated
times
Mbye et al. High-Pressure Processing of Camel Cheese Quality
TABLE 3 | The model equation of independent and dependent variables and its estimated cheeses’ estimated constant values.
Models constants and coefficients Yield (%) Hardness (g) Viscosity (Pa.s)
Camel Bovine Camel Bovine Camel Bovine
cheese cheese cheese cheese cheese cheese
Constant 11*** 11*** 729*** 1,586*** 9,851*** 26,374***
C1 −0.005*** −0.037*** +1.44*** −4.36*** +0.01*** −32.93***
C2 −0.06 −0.47* +17.5** +12.2* +123 +433
C3 +0.0002 −0.0006 −0.003** +0.0037*** −0.006 +0.007
C4 −0.009 +0.027 +0.082 +0.26 −1.69 −11.98*
C5 −0.0006 +0.0007 −0.049 −0.0408 −0.243 −0.63*
*Significant terms; p-values: *p < 0.05, **p < 0.01, and ***p < 0.005.
Response variable value = Constant + C1 × Pressure + C2 × Time + C3 × Pressure2 + C4 × Time2 + C5 × Pressure × Time + Residuals (all models are significant at p < 0.001).
TABLE 4 | Experimental design of the independent variables (pressure, time and at 4◦ C) on the associated microbial count of camel and bovine HPP and pasteurization
milk.
Sample Pressure (MPa) Time Camel milk microbial load (CFU/ml) Bovine milk microbial load (CFU/ml)
code or temperature (C) (min)
Day 0 Day 7 Day 0 Day 7
TPC S TPC S TPC S TPC S
1 550 3 120 50 60 100 NC 10 NC NC
2 590 6 100 78 22 198 NC 10 NC NC
3 450 6 170 100 30 150 NC 20 NC NC
4 450 1 294 100 70 260 NC 50 NC NC
5 450 6 186 100 56 250 NC 40 NC NC
6 450 6 200 100 40 100 NC 70 NC NC
7 450 10 121 200 28 200 NC 50 NC NC
8 350 9 200 200 100 250 NC 20 NC NC
9 350 3 290 150 110 200 NC 60 NC NC
10 450 6 250 150 50 250 NC 70 NC NC
11 308 6 289 200 76 300 NC 20 NC NC
12 550 9 112 100 40 100 NC 30 NC NC
13 450 6 270 100 60 150 NC 40 NC NC
HTST 75 30 s 10 0 30 50 300 20 NC NC
LTLT 65 30 min 50 10 43 50 400 50 NC NC
TPC, Total plate count; S, Staphylococcus aureus; NC, Not countable, >500 CFU/mL; HTST, High temperature short time; LTLT, low temperature long time. Coliforms, E. coli, Listeria
monocytogenes were not detected in day 1 or 7. The impression of the microbial counts did not exceed 15%.
high yield from HTST-treated milk samples can be due to whey (p < 0.05). This has been explained by the disaggregation of the
protein denaturation and its interactions with the κ-casein on colloidal casein micelles and the increased dissolution of ionic
the surface of the casein micelles (51, 52). High pressurization calcium phosphate in response to the pressure effect on bovine
promotes whey protein denaturation especially β-lactoglobulin milk (15, 54–56). Cheese produced from the HTST-pasteurized
which interacts with casein micelle (14, 45). Thus, the denatured camel milk samples had the lowest pH and the highest acidity
whey proteins would serve as barriers against the re-formation compared to bovine milk samples (p < 0.05), which can be
of casein aggregates during curd formation, resulting in cheeses explained by enhanced hydrophobic contacts within the casein
with open structure and high moisture content, consequently micelles conferring stability against dissociation with increased
higher yield (45). Thus, the slight increase in cheese yield is temperature (57).
due to the HPP-induced whey proteins’ denaturation causing an
increase in moisture and fat retention (16, 44, 53). According to Comparing the Effects of Pasteurization
our results, HTST-treated camel milk has the lowest suitability and HPP Treatments on Cheese Hardness,
for cheese production due to its soft weak curd firmness. Rheology, and Microstructure
The HPP treatment decreased the titrable acidity and Bovine milk cheeses had significantly higher textural properties
increased the pH of the camel and bovine cheeses significantly than camel milk cheeses except for cohesiveness (Table 2), which
Frontiers in Nutrition | www.frontiersin.org 6 June 2021 | Volume 8 | Article 642846Mbye et al. High-Pressure Processing of Camel Cheese Quality
FIGURE 1 | Effect of HPP pressure and time at 4◦ C on the yield, hardness, and viscosity of camel (Upper panel) and bovine (lower panel) cheeses. Treatment time:
1 min (blue lines), 5 min (red lines), and 10 min (green lines). The illustration shows the effect of pressure—on the yield, hardness, and viscosity at three different times
at (1, 5, and 10 min).
can be explained by the higher content of β-casein with a sticky properties of cheeses on HPP-treated milk from 350 to 550
hydrophobic C-terminal in camel milk (47). The LTLT-treated MPa (Tables 1, 2; Figure 1). The LTLT samples of bovine milk
bovine milk cheese showed improved hardness, gumminess, cheese showed the highest G′ , significantly different from the
and chewiness. This can be associated with the milk’s faster other treatments (P < 0.05). In contrast, the viscosity and G′ of
coagulation, enhancing water drainage, and increasing curd HTST-treated milk samples were considerably lower than all the
firmness (58). On the other hand, HPP treatment at 350 MPa other treatments showing positive relationships with hardness
produced the hardest camel milk, possibly due to the “optimal” and negative relations with moisture content and yield.
disruption of the casein micelles. It was reported that a mild Figure 2 presents the microstructures of the two
HPP treatment would not cause complete disruption of the pasteurization levels (LTLT and HTST) and two HHP levels
casein micelles but rather dissociate parts of their surfaces (59). of milk treatment (350 and 550 MPa). Large, irregular lumps
The micelle fragments would surround fat globules rather than characterized the camel and bovine cheeses’ microstructure
intact casein micelles and make them behave as casein micelles resulting from the LTLT and HHP 350 MPa-treated kinds of
rather than embedded fat globules observed on average in higher milk with granular structures, which permit faster drainage
pressures (60). Such structures could enhance gel firmness and of the whey and enhance cheese hardness (3, 65). On the
aggregation by increasing particle associations. The significantly other hand, cheeses produced from HTST and HHP 500 MPa-
lower textural profile of the bovine cheeses made from HPP- treated milk showed tight aggregate strands, homogeneous
treated milk at 450 and 550 MPa (p < 0.05) compared to HPP 350 structures, and continuous networks as observed before
MPa agrees with previous reports (61). The reduction in firmness (62, 66). The water-holding capacity of curds is directly
upon high-pressure treatments was attributed to increased water linked to the gels’ porosity (67). Thus, microstructures
retention due to the protein network’s hydration. Water in the with smoother protein networks have fewer pore spaces
protein matrix plays a plasticizer role decreasing its elasticity and and retain moisture explaining the increased yield and
making it prone to fracture during compression. softness (68).
Rheology describes the gel system’s stress-strain characteristic
parameters. G′ , the “storage modulus” describes the protein Proteolytic Activities May Be Involved in
network’s elastic (solid) component predicting gel strength (62).
′′
the Softness of Camel Milk Cheese
The rheological properties (G′ , G , and Viscosity) of bovine Figure 3 shows that except for the HTST cheese, the fat, protein,
milk cheese samples were significantly (p < 0.05) higher than and total solids contents were significantly higher in bovine
that of camel milk cheese samples (Table 2). This could be milk cheeses than camel milk cheeses (p < 0.001), which is in
due to the rapid coagulation of bovine caseins into dense agreement with previous findings (69, 70). This can be related,
and more interwoven structures (3, 63) compared to soft gel at least partly, to the higher level of κ-casein in bovine milk
texture in camel caseins (64) as well as yogurts (4, 5). We also (47). κ-Casein is known to enhance the coagulation properties
observed a decrease in the gel strength and associated rheological by forming a denser casein matrix, which reduces the loss of fat
Frontiers in Nutrition | www.frontiersin.org 7 June 2021 | Volume 8 | Article 642846Mbye et al. High-Pressure Processing of Camel Cheese Quality FIGURE 2 | Scanning electron micrograph of camel cheeses (Upper panel) and bovine cheeses (Lower panel) with two pasteurization temperatures and two high-pressure treatments applied to the milk (Magnification: ×400). FIGURE 3 | The percentages of fat (yellow), protein (orange), and other solids. Frontiers in Nutrition | www.frontiersin.org 8 June 2021 | Volume 8 | Article 642846
Mbye et al.                                                                                                    High-Pressure Processing of Camel Cheese Quality

 FIGURE 4 | FTIR spectra of selected bovine and camel milk cheeses prepared from heat pasteurization and HHP treatment.

and protein to the whey (27, 71). Fourier transforms infrared                     in cheese, which are absent in bovine kinds of milk (Figure 5),
(FTIR) spectroscopy is a rapid but straightforward technique that                 suggesting that some endogenous proteolytic enzymes in the
analyzes food components based on different functional groups.                    camel milk may have been activated during cheese processing.
The FTIR spectra of the cheeses in this study showed typical                      Thus, the hydrolysis of camel’s milk caseins, predominantly β-
cheese behavior (Figure 4).                                                       and αs1-casein, by the enzymatic plasminogen/plasmin system
    Figure 5 presents sodium dodecyl polyacrylamide gel (SDS-                     may contribute to the observed extensive proteolytic activity in
PAGE) electropherograms of camel and bovine cheeses and                           camel milk cheeses (80). The numerous peptide bands observed
wheys. It is observed that the camel milk cheeses show                            in camel milk cheeses may be explained by plasmin (EC 3.4.21.7)
more bands below and above the caseins suggesting extensive                       degradation of β-casein, which accounts for 65% of camel milk
proteolysis compared with bovine cheeses. The observed                            vs. 40% of bovine milk caseins, and the lack of β-lactoglobulin
proteolysis may result from the action of two proteolytic                         in this milk (47). γ2-Casein, a C-terminal peptide originating
enzymes; the residual chymosin used in milk coagulation or                        from highly specific proteolysis of β-casein by plasmin, was
the indigenous milk proteinase, plasmin (EC 3.4.21.7) (72–76).                    found in raw camel milk (81). Plasmin activity in milk is
The recombinant camel chymosin used in this study is known                        affected by the level of its precursor, plasminogen, and some
to hydrolyze bovine and camel κ-caseins at different positions,                   activators/deactivators (73). For example, β-lactoglobulin, the
Phe105-Met106, and Phe97-Ile98, respectively, leading to the                      major whey protein in bovine milk that is lacking in camel
release of different macro peptides (77) and possibly fewer                       milk (41, 82), was reported to act as an inhibitor through thiol-
hydrolysis products in camel milk because κ-casein is present at                  disulfide exchange with plasmin causing reduced plasmin activity
very low concentration (3.5%) compared to bovine milk (about                      (83). HPP treatment of bovine milk at pressures higher than 100
13%) (47). It reported that cheese coagulation by chymosin is                     MPa was reported to induce β-lactoglobulin denaturation (14).
slower and weaker in camel compared to bovine milk (3) but                            There are conflicting reports on the effect of HPP on
the mechanisms behind these differences are still not known.                      plasmin/plasminogen activity in bovine milk. For example, one
In bovine milk, chymosin hydrolysis of κ-casein is the most                       study reported that HPP treatment enhances this activity (84)
important proteolytic reaction during cheese making (78). Of the                  while other studies reported that plasmin activity was not affected
rennet used in bovine milk coagulation, about 6–10% is retained                   by HPP up to 400 MPa for 30 min (14) or 600 MPa for 20 min
in the bovine cheese curd (79) but the residues chymosin retained                 (85). Thus, the plasmin activity may explain the softness of camel
in camel cheese curd to further hydrolyze other caseins requires                  cheeses but it does not explain the hardening effect of HPP
further investigation.                                                            on camel milk cheeses. Future studies should investigate the
    Notably, the raw and processed camel kinds of milk showed                     differences between the plasmin/plasminogen systems in camel
similar proteolytic bands, of less prevalence than those observed                 and their effects on cheese making. As already discussed, the

Frontiers in Nutrition | www.frontiersin.org                                  9                                            June 2021 | Volume 8 | Article 642846
Mbye et al. High-Pressure Processing of Camel Cheese Quality FIGURE 5 | SDS-PAGE electropherograms of the camel and bovine cheeses and whey. For processing conditions (see Table 1). Frontiers in Nutrition | www.frontiersin.org 10 June 2021 | Volume 8 | Article 642846
Mbye et al.                                                                                                                       High-Pressure Processing of Camel Cheese Quality

TABLE 5 | Chemical of camel and bovine milk whey proteins (n = 3).

Treatment                                              pH                                Total solids (%)                               Fat (%)                              Protein (%)

Camel milk whey
LTLT, 65◦ C (30 min)                               4.5 ± 0.01a                             6.9 ± 0.051c                               1.2 ± 0.00d                            1.6 ± 0.04b
HTST, 75◦ C (30 s)                                 4.0 ± 0.01d                              7.9 ± 0.06a                               2.0 ± 0.01a                            1.7 ± 0.02a
                                                                c                                        b                                         d
350 MPa (5 min) at 4 C ◦
                                                   4.3 ± 0.02                              7.5 ± 0.087                                1.3 ± 0.01                             1.5 ± 0.02c
                                                                b                                        b                                         b
450 MPa (5 min) at 4 C ◦
                                                   4.4 ± 0.01                               7.6 ± 0.07                                1.4 ± 0.00                             1.5 ± 0.02c
                                                                b                                        b                                         b
550 MPa (5 min) at 4 C ◦
                                                   4.4 ± 0.02                               7.7 ± 0.09                               1.4 ± 0.007                             1.5 ± 0.03c
Bovine milk whey
LTLT, 65◦ C (30 min)                               4.6 ± 0.02a                              6.0 ± 0.17d                               1.3 ± 0.02b                            1.3 ± 0.03d
                                                                b                                        e                                         b
          ◦
HTST, 75 C (30 s)                                  4.4 ± 0.03                               6.3 ± 0.03                                1.4 ± 0.01                             1.4 ± 0.01c
                                                                b                                        f                                         c
350 MPa (5 min) at 4 C ◦
                                                   4.4 ± 0.02                               6.1 ± 0.16                                1.3 ± 0.02                             1.3 ± 0.02d
                                                                c                                        f                                         c
450 MPa (5 min) at 4 C ◦
                                                   4.3 ± 0.02                               6.1 ± 0.13                                1.3 ± 0.03                             1.3 ± 0.02d
550 MPa (5 min) at 4◦ C                            4.4 ± 0.01b                              6.1 ± 0.02f                               1.3 ± 0.02c                            1.3 ± 0.02d

A comparison was made between the different treatments for each whey. Values within each column carrying different superscript are statistically different (p < 0.05, n = 3 per treatment).

  FIGURE 6 | The whey fractions from cheeses produced from camel milk (1) pasteurized (75◦ C, 30 s), (2) HPP (350 MPa, 5 min at 4◦ C), and (3) HPP (550 MPa, 5 min
  at 4◦ C).

major difference between camel and bovine milk relates to the                                       The loose casein micelle structure in camel cheeses may be
composition, i.e., the relative percentages of the four caseins, and                             responsible for water retention and associated with higher yield
the nature of the casein micelles in the two kinds of milk. The                                  and lower hardness, viscosity, and rheology. Thus, resulting in
hydrophilicity/hydrophobicity of the micelle and the access of                                   loss of more total solid protein and fat into the whey. Our study
the hydrolytic enzymes to the reactive sites on the caseins affects                              has revealed camel milk whey had significant (p < 0.05) higher
the proteolytic activities. In addition, the higher hydration level                              total solid protein and fat. LTLT treatment whey had a total solid
and concentrations of minerals, mainly calcium, magnesium,                                       of (6.9 ± 0.051), fat (1.2 ± 0.00), and protein (1.6 ± 0.04). The
phosphate, and citrate, in the casein micelles of camel compared                                 results obtained from this study are less than what was reported
to bovine milk (86) may also play an important role in the micelle                               by (24). While HTST treatment whey had significantly (p < 0.05)
structure and its vulnerability to proteolytic attacks (87).                                     the highest protein and fat (Table 5). This is due to the infiltration

Frontiers in Nutrition | www.frontiersin.org                                                11                                                  June 2021 | Volume 8 | Article 642846
Mbye et al. High-Pressure Processing of Camel Cheese Quality
of fat and protein into the whey fraction due to hydrolysis of could replace pasteurization HTST (75◦ C 30 s) in camel milk
micro casein during coagulation (Figure 3). The whey fractions microbial preservation before cheese production. Further studies
from camel milk had tiny casein particles, especially from the are needed to further investigate the possibility of camel cheese
HTST-treated milk, where a higher amount of total solid can be production using HPP processing and to evaluate the safety
observed (Figure 6). and sensory quality of ripened cheeses. Further studies are also
The increase in cheese hardness by HPP may also be affected required to identify the proteolytic products in camel milk
by factors other than plasmin activity, e.g., disruption and cheeses, their protein source (s), and their role in camel milk
destabilization of the camel milk micelles and enhancement coagulation and cheese quality.
of coagulation. It was reported that when milk is pressurized
at room temperature, micelle disruption might enhance the DATA AVAILABILITY STATEMENT
susceptibility of casein to proteolysis by increasing the protein
surface area available to the plasmin enzymes as well as the The original contributions presented in the study are included
exposure of new substrate sites (80). in the article/supplementary material, further inquiries can be
directed to the corresponding author/s.
CONCLUSIONS
AUTHOR CONTRIBUTIONS
This study investigated the effects of high-pressure milk
processing and pasteurization on the yield and physicochemical AK-E and RK were in charge of conceptualizing ideas,
properties of soft unripe cheeses produced from camel milk funding, and supervision the study. MM, HM, AA,
as compared with bovine milk. It was found that camel milk and TR performed the laboratory experiments. FH
cheeses were affected differently from bovine milk cheeses by evaluated the SEM results. MM wrote the first draft of the
the different treatments. Camel milk cheeses were relatively manuscript. All authors reviewed and contributed to the
softer than bovine cheeses, possibly due to an active endogenous final draft.
protease proposed to be the plasmin/plasminogen system. The
results revealed that mild processing conditions [e.g., LTLT FUNDING
pasteurization (65◦ C, 30 min) and HPP-treatment (350 MPa,
5 min at 4◦ C)] were effective in productizing semi-hard cheeses The United Arab Emirates University funded this research
from camel milk. It was also shown that HPP treatment through the research grant 31F133.
REFERENCES 9. Chavan RS, Chavan SR, Khedkar CD, Jana AH. UHT milk processing and
effect of plasmin activity on shelf life: a review. Compr Rev Food Sci Food Saf.
1. Izadi A, Khedmat L, Mojtahedi SY. Nutritional and therapeutic perspectives (2011) 10:251–68. doi: 10.1111/j.1541-4337.2011.00157.x
of camel milk and its protein hydrolysates: a review on versatile biofunctional 10. Chawla R, Patil GR, Singh AK. High hydrostatic pressure technology
properties. J Funct Foods. (2019) 60:103441. doi: 10.1016/j.jff.2019.103441 in dairy processing: a review. J Food Sci Technol. (2011) 48:260–
2. Muehlhoff E, Bennett A, McMahon D. Milk and Dairy Products in Human 8. doi: 10.1007/s13197-010-0180-4
Nutrition. Food and Agriculture Organization of the United Nations 11. Muñoz-Cuevas M, Guevara L, Aznar A, Martínez A, Periago PM, Fernández
(FAO) (2013). PS. Characterisation of the resistance and the growth variability of Listeria
3. Mbye M, Sobti B, Al Nuami MK, Al Shamsi Y, Al Khateri L, Al Saedi R, monocytogenes after high hydrostatic pressure treatments. Food Control.
et al. Physicochemical properties, sensory quality, and coagulation behavior (2013) 29:409–15. doi: 10.1016/j.foodcont.2012.05.047
of camel versus bovine milk soft unripened cheeses. NFS J. (2020) 20:28– 12. Datta N, Deeth H. High pressure processing of milk and dairy products. Austr
36. doi: 10.1016/j.nfs.2020.06.003 J Dairy Technol. (1999) 54:41–8.
4. Sobti B, Al Teneiji HA, Kamal-Eldin A. Effect of added bovine casein and whey 13. Norton T, Sun D-W. Recent advances in the use of high pressure as an effective
protein on the quality of camel and bovine milk yoghurts. Emirates J Food processing technique in the food industry. Food Bioprocess Technol. (2008)
Agric. (2019) 31:804–11. doi: 10.9755/ejfa.2019.v31.i10.2022 1:2–34. doi: 10.1007/s11947-007-0007-0
5. Sobti B, Mbye M, Alketbi H, Alnaqbi A, Alshamisi A, Almeheiri M, et al. 14. Lopez-Fandino R, Carrascosa A, Olano A. The effects of high pressure on
Rheological characteristics and consumer acceptance of camel milk yogurts whey protein denaturation and cheese-making properties of raw milk. J Dairy
as affected by bovine proteins and hydrocolloids. Int J Food Properties. (2020) Sci. (1996) 79:929–36. doi: 10.3168/jds.S0022-0302(96)76443-3
23:1347–60. doi: 10.1080/10942912.2020.1797785 15. Nassar KS, Lu J, Pang X, Ragab ES, Yue Y, Zhang S, et al. Rheological and
6. Liepa M, Zagorska J, Galoburda R. Effect of high pressure processing on microstructural properties of rennet gel made from caprine milk treated by
milk coagulation properties. Res R Dev. (2017) 1. doi: 10.22616/rrd.23. HP. J Food Eng. (2020) 267:109710. doi: 10.1016/j.jfoodeng.2019.109710
2017.033 16. Pandey P, Ramaswamy H, St-Gelais D. Effect of high pressure processing on
7. Huppertz T, Hinz K, Zobrist MR, Uniacke T, Kelly AL, Fox PF. Effects rennet coagulation properties of milk. Innov Food Sci Emerg Technol. (2003)
of high pressure treatment on the rennet coagulation and cheese-making 4:245–56. doi: 10.1016/S1466-8564(03)00034-1
properties of heated milk. Innov Food Sci Emerg Technol. (2005) 6:279– 17. Raghubeer EV, Phan BN, Onuoha E, Diggins S, Aguilar V, Swanson S,
85. doi: 10.1016/j.ifset.2005.03.005 et al. The use of high-pressure processing (HPP) to improve the safety and
8. Rankin S, Bradley R, Miller G, Mildenhall K. A 100-Year Review: A quality of raw coconut (Cocos nucifera L) water. Int J Food Microbiol. (2020)
century of dairy processing advancements-Pasteurization, cleaning and 331:108697. doi: 10.1016/j.ijfoodmicro.2020.108697
sanitation, and sanitary equipment design. J Dairy Sci. (2017) 100:9903– 18. Marshall RT. Standard Methods for the Examination of Dairy
15. doi: 10.3168/jds.2017-13187 Products Washington, DC: American Public Health Association (1992).
Frontiers in Nutrition | www.frontiersin.org 12 June 2021 | Volume 8 | Article 642846Mbye et al. High-Pressure Processing of Camel Cheese Quality
19. Register F. Drinking water: national primary drinking water regulations; 40. Mal G, Pathak KML. Camel milk and milk products. In: SMVS Dairy Year
analytical techniques coliform bacteria proposed rule. Fed Proc. Book. Ghaziabad:ServaManavVikasSamiti (2010). p. 97–103.
(1990) 54:22752–6. 41. Berhe T, Ipsen R, Seifu E, Kurtu MY, Eshetu M, Hansen EB. Comparison of
20. Haaber J, Cohn M, Petersen A, Ingmer H. Simple method for correct the acidification activities of commercial starter cultures in camel and bovine
enumeration of Staphylococcus aureus. J Microbiol Methods. (2016) 125:58– milk. LWT. (2018) 89:123–7. doi: 10.1016/j.lwt.2017.10.041
63. doi: 10.1016/j.mimet.2016.04.004 42. Ho TM, Chan S, Yago AJE, Shravya R, Bhandari BR, Bansal
21. Hitchins AD, Jinneman K, Chen Y. BAM Chapter 10: Detection of Listeria N. Changes in physicochemical properties of spray-dried camel
monocytogenes in Foods and Environmental Samples, and Enumeration milk powder over accelerated storage. Food Chem. (2019)
of Listeria monocytogenes in Foods. Washington, DC: US Food Drug 295:224–33. doi: 10.1016/j.foodchem.2019.05.122
Administration (2004). Available online at: https://www.fda.gov/food/ 43. Felfoul I, Jardin J, Gaucheron F, Attia H, Ayadi MA. Proteomic profiling
laboratory-methods-food/bam (accessed November 20). of camel and cow milk proteins under heat treatment. Food Chem. (2017)
22. Lupindu AM. Isolation and characterization of Escherichia coli from animals, 216:161–9. doi: 10.1016/j.foodchem.2016.08.007
humans, and environment. In: Samie A, editor. Escherichia coli-Recent 44. Huppertz T, Fox PF, Kelly AL. Effects of high pressure treatment on the
Advances on Physiology, Pathogenesis and Biotechnological Applications. yield of cheese curd from bovine milk. Innov Food Sci Emerg Technol. (2004)
London: IntechOpen Limited (2017). p. 187–206. 5:1–8. doi: 10.1016/j.ifset.2003.09.001
23. Mohamed H, Nagy P, Agbaba J, Kamal-Eldin A. Use of near and 45. Fox PF, McSweeney PL, Paul L. Dairy Chemistry and Biochemistry. London:
mid infra-red spectroscopy for analysis of protein, fat, lactose Springer (1998).
and total solids in raw cow and camel milk. Food Chem. (2020) 46. Gazi I, Huppertz T. Casein-whey protein interactions for optimizing milk
334:127436. doi: 10.1016/j.foodchem.2020.127436 protein functionality. Agro Food Ind Hi Tech. (2015) 26:11–4.
24. Al-Zoreky NS, Almathen FS. Using recombinant camel chymosin 47. Mohamed H, Johansson M, Lundh Å, Nagy P, Kamal-Eldin
to make white soft cheese from camel milk. Food Chem. (2021) A. Caseins and α-lactalbumin content of camel milk (Camelus
337:127994. doi: 10.1016/j.foodchem.2020.127994 dromedarius) determined by capillary electrophoresis. J Dairy Sci. (2020)
25. Benkerroum N, Dehhaoui M, El Fayq A, Tlaiha R. The effect of 103:11094–9. doi: 10.3168/jds.2020-19122
concentration of chymosin on the yield and sensory properties of camel 48. El Zubeir Jabreel SO. Fresh cheese from camel milk coagulated with Camifloc.
cheese and on its microbiological quality. Int J Dairy Technol. (2011) 64:232– Int J Dairy Technol. (2008) 61:90–5. doi: 10.1111/j.1471-0307.2008.00360.x
9. doi: 10.1111/j.1471-0307.2010.00662.x 49. Mehaia MA. Manufacture of fresh soft white cheese (Domiati type) from
26. Akinloye A, Adewumi O. Effects of local coagulants on the yield of cheese dromedary camel’s milk using ultrafiltration process. J Food Technol.
using cow and sheep milk. Int J Dev Sustainability. (2014) 3:150–61. (2006) 4:206–12. Available online at: https://medwelljournals.com/abstract/?
27. Ong L, Dagastine RR, Kentish SE, Gras SL. The effect of pH at renneting on doi=jftech.2006.206.212
the microstructure, composition and texture of Cheddar cheese. Food Res Int. 50. Ramet J-P. The Technology of Making Cheese from Camel Milk (Camelus
(2012) 48:119–30. doi: 10.1016/j.foodres.2012.02.020 dromedarius). Food and Agriculture Organization (2001).
28. Koca N, Rodriguez-Saona L, Harper W, Alvarez V. Application of Fourier 51. Lucey JA, Teo CT, Munro PA, Singh H. Rheological properties at small
transform infrared spectroscopy for monitoring short-chain free fatty acids (dynamic) and large (yield) deformations of acid gels made from heated milk.
in Swiss cheese. J Dairy Sci. (2007) 90:3596–603. doi: 10.3168/jds.2007-0063 J Dairy Res. (1997) 64:591–600. doi: 10.1017/S0022029997002380
29. Laemmli UK. Cleavage of structural proteins during the assembly of the head 52. Zobrist M, Huppertz T, Uniacke T, Fox P, Kelly A. High-pressure-induced
of bacteriophage T4. Nature. (1970) 227:680–5. doi: 10.1038/227680a0 changes in the rennet coagulation properties of bovine milk. Int Dairy J. (2005)
30. Park Y, Jin Y. Proteolytic patterns of Caciotta and Monterey Jack hard goat 15:655–62. doi: 10.1016/j.idairyj.2004.07.025
milk cheeses as evaluated by SDS-PAGE and densitometric analyses. Small 53. San Martin-González M, Roach A, Harte F. Rheological properties
Rumin Res. (1998) 28:263–72. doi: 10.1016/S0921-4488(97)00092-8 of corn oil emulsions stabilized by commercial micellar casein and
31. Al Kanhal HA. Compositional, technological and nutritional high pressure homogenization. LWT Food Sci Technol. (2009) 42:307–
aspects of dromedary camel milk. Int Dairy J. (2010) 20:811– 11. doi: 10.1016/j.lwt.2008.04.005
21. doi: 10.1016/j.idairyj.2010.04.003 54. Chopde S, Deshmukh M, Kalyankar S, Changade S. High pressure technology
32. Konuspayeva G, Faye B, Loiseau G. The composition of camel milk: a for cheese processing-a review. Asian J Dairy Food Res. (2014) 33:239–
meta-analysis of the literature data. J Food Compos Anal. (2009) 22:95– 45. doi: 10.5958/0976-0563.2014.00610.1
101. doi: 10.1016/j.jfca.2008.09.008 55. Huppertz T, de Kruif GC. High pressure-induced solubilisation
33. Nagy P, Juhász J, Reiczigel J, Császár G, Kocsis R, Varga L. Circannual of micellar calcium phosphate from cross-linked casein micelles.
changes in major chemical composition of bulk dromedary camel milk as Colloids Surf A Physicochem Eng Aspects. (2007) 295:264–
determined by FT-MIR spectroscopy, and factors of variation. Food Chem. 8. doi: 10.1016/j.colsurfa.2006.09.010
(2019) 278:248–53. doi: 10.1016/j.foodchem.2018.11.059 56. Orlien V, Boserup L, Olsen K. Casein micelle dissociation in skim milk during
34. Council NR. Scientific Criteria to Ensure Safe Food. Maryland, MD: National high-pressure treatment: effects of pressure, pH, and temperature. J Dairy Sci.
Academies Press (2003). (2010) 93:12–8. doi: 10.3168/jds.2009-2244
35. Rendueles E, Omer M, Alvseike O, Alonso-Calleja C, Capita R, 57. Gebhardt R, Doster W, Kulozik U. Pressure-induced dissociation of casein
Prieto M. Microbiological food safety assessment of high hydrostatic micelles: size distribution and effect of temperature. Braz J Med Biol Res.
pressure processing: a review. LWT Food Sci Technol. (2011) (2005) 38:1209–14. doi: 10.1590/S0100-879X2005000800008
44:1251–60. doi: 10.1016/j.lwt.2010.11.001 58. Guinee T. Role of protein in cheese and cheese products. In: Fox PF,
36. Almehdar HA, El-Baky NA, Alhaider AA, Almuhaideb SA, Alhaider AA, McSweeney PLH, editors. Advanced Dairy Chemistry-1 Proteins. Boston, MA:
Albiheyri RS, et al. Bacteriostatic and bactericidal activities of camel Springer (2003). p. 1083–174.
lactoferrins against Salmonella enterica Serovar Typhi. Probiotics Antimicrob 59. Sandra S, Dalgleish D. Effects of ultra-high-pressure homogenization and
Proteins. 12:18–31. (2019). doi: 10.1007/s12602-019-9520-5 heating on structural properties of casein micelles in reconstituted skim milk
37. Mahmoudi I, Moussa OB, Khaldi TEM, Kebouchi M, Soligot C, Le Roux powder. Int Dairy J. (2005) 15:1095–104. doi: 10.1016/j.idairyj.2004.11.015
Y, et al. Functional in vitro screening of Lactobacillus strains isolated from 60. Hayes MG, Fox PF, Kelly AL. Potential applications of high pressure
Tunisian camel raw milk toward their selection as probiotic. Small Rumin Res. homogenisation in processing of liquid milk. J Dairy Res. (2005)
(2016) 137:91–8. doi: 10.1016/j.smallrumres.2016.03.016 72:25. doi: 10.1017/S0022029904000524
38. Sharma C, Singh C. Therapeutic value of camel milk-a review. Adv J Pharm 61. Messens W, Van de Walle D, Arevalo J, Dewettinck K, Huyghebaert A.
Life Sci Res. (2014) 2:7–13. Rheological properties of high-pressure-treated Gouda cheese. Int Dairy J.
39. El Khasmi M, Faye B. Blood, milk and meat vitamin D in the dromedary (2000) 10:359–67. doi: 10.1016/S0958-6946(00)00066-2
camel. Iranian J Appl Anim Sci. (2019) 9:585–95. Available online at: http:// 62. Zhang R, Pang X, Lu J, Liu L, Zhang S, Lv J. Effect of high
ijas.iaurasht.ac.ir/article_669298.html intensity ultrasound pretreatment on functional and structural
Frontiers in Nutrition | www.frontiersin.org 13 June 2021 | Volume 8 | Article 642846Mbye et al. High-Pressure Processing of Camel Cheese Quality
properties of micellar casein concentrates. Ultrason Sonochem. (2018) 77. Kappeler S, Farah Z, Puhan Z. Sequence analysis of Camelus dromedarius milk
47:10–6. doi: 10.1016/j.ultsonch.2018.04.011 caseins. J Dairy Res. (1998) 65:209–22. doi: 10.1017/S0022029997002847
63. Xiong YL, Kinsella JE. Influence of fat globule membrane composition and fat 78. Beermann C, Hartung J. Current enzymatic milk fermentation procedures.
type on the rheological properties of milk based composite gels. II. Results. Eur Food Res Technol. (2012) 235:1–12. doi: 10.1007/s00217-012-1733-8
Milchwissenschaft. (1991) 46:207–12. 79. Fox P. Proteolysis during cheese manufacture and ripening. J Dairy Sci. (1989)
64. Macdougall PE, Ong L, Palmer MV, Gras SL. The microstructure and textural 72:1379–400. doi: 10.3168/jds.S0022-0302(89)79246-8
properties of Australian cream cheese with differing composition. Int Dairy J. 80. Garía-Risco M, Olano A, Ramos M, Lopez-Fandino R. Micelar
(2019) 99:104548. doi: 10.1016/j.idairyj.2019.104548 changes induced by high pressure. Influence in the proteolytic
65. Britz T, Robinson RK. Advanced Dairy Science and Technology. New activity and organoleptic properties of milk. J Dairy Sci. (2000)
Jersey, NJ: John Wiley and Sons (2008). 83:2184–9. doi: 10.3168/jds.S0022-0302(00)75101-0
66. Mimouni A, Deeth H, Whittaker A, Gidley M, Bhandari B. Investigation 81. Baer A, Ryba I, Farah Z. Plasmin activity in camel milk. LWT Food Sci Technol.
of the microstructure of milk protein concentrate powders during (1994) 27:595–8. doi: 10.1006/fstl.1994.1118
rehydration: alterations during storage. J Dairy Sci. (2010) 93:463– 82. Berhe T, Seifu E, Ipsen R, Kurtu MY, Hansen EB. Processing challenges
72. doi: 10.3168/jds.2009-2369 and opportunities of camel dairy products. Int J Food Sci. (2017)
67. Lucey JA, Tamehana M, Singh H, Munro PA. Effect of heat treatment on the 2017:9061757. doi: 10.1155/2017/9061757
physical properties of milk gels made with both rennet and acid. Int Dairy J. 83. Mazri C, Sánchez L, Ramos S, Calvo M, Pérez M. Effect of high-pressure
(2001) 11:559–65. doi: 10.1016/S0958-6946(01)00081-4 treatment on denaturation of bovine lactoferrin and lactoperoxidase. J Dairy
68. Green ML, Marshall RJ, Glover FA. Influence of homogenization of Sci. (2012) 95:549–57. doi: 10.3168/jds.2011-4665
concentrated milks on the structure and properties of rennet curds. J Dairy 84. Garcia-Risco M, Recio I, Molina E, Lopez-Fandino R. Plasmin
Res. (1983) 50:341–8. doi: 10.1017/S0022029900023177 activity in pressurized milk. J Dairy Sci. (2003) 86:728–
69. Hailu Y, Hansen EB, Seifu E, Eshetu M, Petersen MA R. Lametsch, et al. 34. doi: 10.3168/jds.S0022-0302(03)73653-4
Rheological and sensory properties and aroma compounds formed during 85. Scollard PG, Beresford TP, Murphy PM, Kelly AL. Barostability of milk
ripening of soft brined cheese made from camel milk. Int Dairy J. (2018) plasmin activity. Le Lait. (2000) 80:609–19. doi: 10.1051/lait:2000148
81:122–30. doi: 10.1016/j.idairyj.2018.01.007 86. Attia H, Kherouatou N, Nasri M, Khorchani T. Characterization of the
70. Yirda A, Eshetu M, Babege K. Current status of camel dairy dromedary milk casein micelle and study of its changes during acidification.
processing and technologies: a review. Open J Anim Sci. (2020) Le Lait. (2000) 80:503–15. doi: 10.1051/lait:2000141
10:362–77. doi: 10.4236/ojas.2020.103022 87. Bhat MY, Dar TA, Singh LR. Casein proteins: structural and functional aspects.
71. Dai S, Jiang F, Shah NP, Corke H. Functional and pizza bake properties of In: Gigli I, editor. Milk Proteins-From Structure to Biological Properties and
Mozzarella cheese made with konjac glucomannan as a fat replacer. Food Health Aspects. Rijeka: InTech (2016). p. 1–17.
Hydrocolloids. (2019) 92:125–34. doi: 10.1016/j.foodhyd.2019.01.045
72. Bastian E, Lo C, David K. Plasminogen activation in cheese Conflict of Interest: AA and RK were employed by Agthia Public Joint Stock
milk: influence on Swiss cheese ripening. J Dairy Sci. (1997) Company (PJSC) Group of Companies.
80:245–51. doi: 10.3168/jds.S0022-0302(97)75932-0
73. Bastian ED, Hansen KG, Brown RJ. Inhibition of plasmin by β-lactoglobulin The remaining authors declare that the research was conducted in the absence of
using casein and a synthetic substrate. J Dairy Sci. (1993) 76:3354– any commercial or financial relationships that could be construed as a potential
61. doi: 10.3168/jds.S0022-0302(93)77673-0 conflict of interest.
74. Fox PF (editor). Indigenous enzymes in milk. III. Proteinases. In: Advanced
Dairy Chemistry – 1: Proteins. Oxford: Elsevier (1992). p. 310–21. Copyright © 2021 Mbye, Mohamed, Ramachandran, Hamed, AlHammadi, Kamleh
75. Mulvihill D, McCarthy A. Proteolytic and rheological changes during ageing and Kamal-Eldin. This is an open-access article distributed under the terms of
of cheese analogues made from rennet caseins. Int Dairy J. (1994) 4:15– the Creative Commons Attribution License (CC BY). The use, distribution or
23. doi: 10.1016/0958-6946(94)90046-9 reproduction in other forums is permitted, provided the original author(s) and the
76. Song XG, Nagaoka S, Kanamaru Y, Kuzuya Y. Plasmin and plasminogen copyright owner(s) are credited and that the original publication in this journal
activities and casein degradation during ripening of Swiss-type cheese. Nippon is cited, in accordance with accepted academic practice. No use, distribution or
Shokuhin Kogyo Gakkaishi. (1993) 40:287–95. doi: 10.3136/nskkk1962.40.287 reproduction is permitted which does not comply with these terms.
Frontiers in Nutrition | www.frontiersin.org 14 June 2021 | Volume 8 | Article 642846You can also read


