Sonic Hedgehog Signaling Agonist (SAG) Triggers BDNF Secretion and Promotes the Maturation of GABAergic Networks in the Postnatal Rat Hippocampus ...
←
→
Page content transcription
If your browser does not render page correctly, please read the page content below
ORIGINAL RESEARCH
                                                                                                                                                     published: 23 April 2020
                                                                                                                                              doi: 10.3389/fncel.2020.00098

                                               Sonic Hedgehog Signaling Agonist
                                               (SAG) Triggers BDNF Secretion and
                                               Promotes the Maturation of
                                               GABAergic Networks in the Postnatal
                                               Rat Hippocampus
                                               Quentin Delmotte 1,2,3 , Diabe Diabira 2,3 , Yasmine Belaidouni 1,2,3 , Mira Hamze 1,2,3 ,
                                               Marine Kochmann 1,4 , Aurélie Montheil 1,2,3 , Jean-Luc Gaiarsa 1,2,3 , Christophe Porcher 1,2,3 *†
                                               and Yesser H. Belgacem 2,3†
                                               1
                                                 Aix-Marseille Univ, Marseille, France, 2 INSERM (Institut National de la Santé et de la Recherche Médicale) Unité 1249,
                                               Marseille, France, 3 INMED (Institut de Neurobiologie de la Méditerranée), Parc Scientifique de Luminy, Marseille, France,
                                               4
                                                 Institut des Neurosciences de La Timone, Marseille, France
                               Edited by:
                         Laura Cancedda,
      Italian Institute of Technology (IIT),   Sonic hedgehog (Shh) signaling plays critical roles during early central nervous system
                                      Italy
                                               development, such as neural cell proliferation, patterning of the neural tube and neuronal
                           Reviewed by:
                        Enrico Cherubini,      differentiation. While Shh signaling is still present in the postnatal brain, the roles it may
     European Brain Research Institute,        play are, however, largely unknown. In particular, Shh signaling components are found at
                                      Italy
                                               the synaptic junction in the maturing hippocampus during the first two postnatal weeks.
                             Martial Ruat,
    Institut National de la Santé et de la     This period is characterized by the presence of ongoing spontaneous synaptic activity
         Recherche Médicale (INSERM),          at the cellular and network levels thought to play important roles in the onset of neuronal
                                   France
                                               circuit formation and synaptic plasticity. Here, we demonstrate that non-canonical Shh
                   *Correspondence:
                    Christophe Porcher
                                               signaling increases the frequency of the synchronized electrical activity called Giant
          christophe.porcher@inserm.fr         Depolarizing Potentials (GDP) and enhances spontaneous GABA post-synaptic currents
†
    These authors share last authorship        in the rodent hippocampus during the early postnatal period. This effect is mediated
                  Specialty section:
                                               specifically through the Shh co-receptor Smoothened via intracellular Ca2+ signal and
This article was submitted to Cellular         the activation of the BDNF-TrkB signaling pathway. Given the importance of these
   Neurophysiology, a section of the
                                               spontaneous events on neuronal network maturation and refinement, this study opens
                   journal Frontiers in
                Cellular Neuroscience          new perspectives for Shh signaling on the control of early stages of postnatal brain
                                               maturation and physiology.
           Received: 22 January 2020
            Accepted: 31 March 2020            Keywords: GABA, sonic hedgehog, GDP, hippocampus, BDNF
             Published: 23 April 2020

                           Citation:
 Delmotte Q, Diabira D, Belaidouni Y,          INTRODUCTION
Hamze M, Kochmann M, Montheil A,
         Gaiarsa J-L, Porcher C and            Sonic Hedgehog (Shh) signaling is a highly conserved pathway among invertebrates and
          Belgacem YH (2020) Sonic             vertebrates (Kumar et al., 1996), mostly known for its roles during embryonic central
  Hedgehog Signaling Agonist (SAG)             nervous system development on neural cell proliferation, neural progenitor specification
       Triggers BDNF Secretion and
                                               and neuronal differentiation (Ruat et al., 2012, 2014; Briscoe and Thérond, 2013; Belgacem
         Promotes the Maturation of
GABAergic Networks in the Postnatal
                                               et al., 2016). Despite its known role as a mitogen, more recent studies have shown other
                 Rat Hippocampus.              functions of Shh affecting later phases of central nervous system development. For instance,
        Front. Cell. Neurosci. 14:98.          Shh regulates axonal guidance (Yam et al., 2009; Makihara et al., 2018; Peng et al., 2018), axonal
     doi: 10.3389/fncel.2020.00098             elongation (Yao et al., 2015) and, in cultured hippocampal neurons, it regulates glutamatergic

Frontiers in Cellular Neuroscience | www.frontiersin.org                                1                                                April 2020 | Volume 14 | Article 98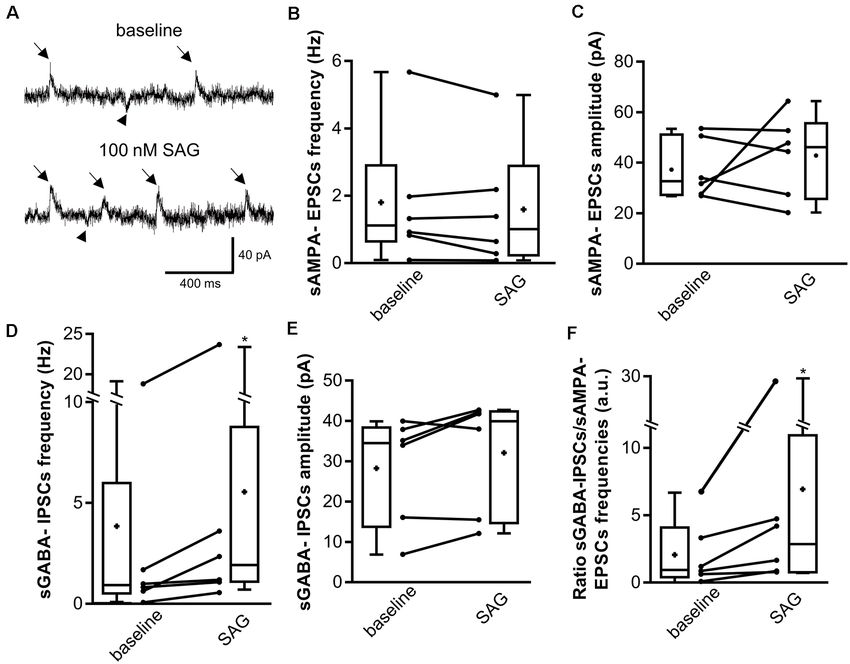
Delmotte et al.                                                                               Sonic Hedgehog Modulates GABAergic Neurotransmission

synaptic size and function (Mitchell et al., 2012). Shh binds to            in the embryonic spinal cord, which is crucial for spinal
its receptor Patched 1 (Ptch1), which releases the constitutive             neuron differentiation and GABAergic phenotype homeostatic
inhibition it exerts on Shh-coreceptor Smoothened (Smo), a                  specification (Belgacem and Borodinsky, 2011, 2015; Belgacem
member of the G protein-coupled receptor family. Smo, in                    et al., 2016).
turn, activates the main downstream canonical effectors of                      In the present study, we discover that activating
Shh signaling, the Glioma-associated oncogen (Gli) family of                Smo-dependent Shh signaling leads to an increase in
transcription factors (Ruat et al., 2012; Briscoe and Thérond,              spontaneous GABAergic synaptic currents and to a long-lasting
2013; Ruat et al., 2014; Belgacem et al., 2016). Shh signaling              potentiation in GDP frequency. Furthermore, we show that this
also initiates several non-canonical, Gli-independent signaling             effect requires an intracellular calcium signal, and the secretion
pathways, including the GTPase RhoA (Polizio et al., 2011) or               of BDNF followed by the activation of the subsequent TrkB
Rac1 (Sasaki et al., 2010), Src family kinases (Yam et al., 2009) and       signaling pathway. The findings also suggest the existence of a
the AMPK axis (Teperino et al., 2012). Moreover, interactions               critical period for Shh-Smo signaling modulation of spontaneous
between Smo signaling and Ca2+ activity have been identified                GABAergic synaptic activity in the immature hippocampus. This
in hippocampal neurons (Feng et al., 2016) and the spinal cord              study describes a novel function for the Shh pathway during
for the specification of the GABAergic phenotype (Belgacem and              postnatal development on early synaptic and network activities.
Borodinsky, 2011; Belgacem et al., 2016). Interestingly, Ptch1 and
Smo have been described in immature and adult rat hippocampal               MATERIALS AND METHODS
neurons. In postnatal neurons, Ptch1 and Smo are co-localized in
the processes and growth cones (Petralia et al., 2011), whereas in          Animals
adult neurons Shh receptors are present in the post-synaptic sides          All animal experiments were carried out according to the
in several hippocampal areas including CA3 and CA1 pyramidal                guidelines set by the INSERM animal welfare through the local
neurons (Petralia et al., 2011) and the granule cells of the dentate        committee and the European Communities Council Directive of
gyrus (Charytoniuk et al., 2002). Moreover, functional analysis of          24 November 1986 (86/609/EEC). Experiments were performed
cultured adult hippocampal neurons revealed that Shh signaling              on male and female Wistar rats (Janvier Labs) from postnatal
regulated the structure and the electrophysiological properties             day 1 (P1) to 15 (P15). Animals were housed in a temperature-
of presynaptic terminals (Mitchell et al., 2012). Besides, a recent         controlled environment with a 12-h light/dark cycle at 22-24◦ C
study demonstrated that Shh is released by hippocampal neurons              and free access to food and water.
in an activity-dependent manner (Su et al., 2017). Altogether,
these data raise the question of a new role for Shh acting as a             Drugs
neurotrophic factor during this particular developmental stage              The following reagents were used from the indicated source:
of synapse formation and establishment of neuronal networks                 Smo agonist (SAG) and Cyclopamine from Tocris (Bristol, UK).
(Charytoniuk et al., 2002; Traiffort et al., 2010; Petralia et al.,         1,2,3,4-Tetrahydro-6-nitro-2,3-dioxo-benzo[f]quinoxaline-
2011, 2012; Yao et al., 2016).                                              7-sulfonamide (NBQX), D-2-amino-5-phosphovaleric acid
    The perinatal period corresponds to a peak in synaptogenesis            (D-APV) from the Molecular, Cellular, and Genomic
and the emergence of spontaneous electrical activity important              Neuroscience Research Branch (MCGNRB) of the National
for the formation of functional GABAergic synapses (Colin-                  Institute of Mental Health (NIMH, Bethesda, MD, USA). 1.2- bis
Le Brun et al., 2004; Griguoli and Cherubini, 2017). In the                 (2-Aminophenoxy)ethane-N,N,N0 ,N0 -tetraacetic acid (BAPTA)
developing rodent hippocampus, ongoing synaptic activity                    and BAPTA-AM from Sigma (St. Louis, MN, USA). TrkB- and
occurs at the cellular and network levels and is characterized              TrkC-IgG were purchased from R&D system (Minneapolis,
by a developmental sequence with GABAergic synapses                         MN, USA). Tetrodotoxin (TTX) was purchased from Abcam
formed before glutamatergic synapses (Ben-Ari et al., 2007).                (Bristol, UK).
Consequently, proper GABAergic synapse formation during                     Hippocampal Slices Preparation
brain development is instrumental and alterations in GABA                   Brains were removed and immersed into ice-cold (2-4◦ C)
connectivity may lead to neurodevelopmental disorders                       artificial cerebrospinal fluid (ACSF) with the following
including Autism Spectrum Disorder and epilepsy (Kuzirian                   composition (in mM): 126 NaCl, 3.5 KCl, 2 CaCl2 , 1.3 MgCl2 ,
and Paradis, 2011; Ben-Ari et al., 2012; Canitano and Pallagrosi,           1.2 NaH2 PO4 , 25 NaHCO3 and 11 glucose, pH 7.4 equilibrated
2017). Parallel to this sequential process of GABA and glutamate            with 95% O2 and 5% CO2 . Hippocampal slices (350 µm
synapse formation, in the developing hippocampus, spontaneous               thick) were cut with a McIlwain tissue chopper (Campden
network activity is characterized by the presence of Giant                  Instruments Limited) and kept in oxygenated (95% O2 and 5%
Depolarizing Potentials (GDP; Ben-Ari et al., 1989; Griguoli                CO2 ) ACSF at room temperature (25◦ C) for at least 1 h before
and Cherubini, 2017). These spontaneous network events                      recording. Slices were then transferred to a submerged recording
are generated by a synchronized discharge of glutamatergic                  chamber perfused with oxygenated (95% O2 and 5% CO2 ) ACSF
and GABAergic inputs (Ben-Ari et al., 1989, 2007) and are                   (3 ml/min) at 34◦ C.
of importance in the formation and stabilization of neuronal
assemblies through synaptic plasticity facilitation (Mohajerani             Electrophysiological Recordings
et al., 2007; Griguoli and Cherubini, 2017). Interestingly,                 Extracellular field potentials were recorded by using tungsten
Shh signaling modulates early spontaneous electrical activity               wire electrodes (diameter: 50 µm, California Fine Wire, Grover

Frontiers in Cellular Neuroscience | www.frontiersin.org                2                                         April 2020 | Volume 14 | Article 98
Delmotte et al. Sonic Hedgehog Modulates GABAergic Neurotransmission
Beach, CA, USA) and a low-noise multichannel DAM-8A concentrated solutions following the manufacturer’s protocol.
amplifiers (WPI, GB; low filter: 0.1 Hz; high filter: 3 kHz; Experiments and analyses were done blindly.
1,000×) located in the stratum pyramidal of the CA3 region.
Whole-cell patch-clamp recordings of CA3 pyramidal neurons Primary Cultures of Rat Hippocampal
were performed with an Axopatch 200B amplifier (Axon Neurons
Instruments, Foster City, CA, USA). For sGABA-IPSCs-only Neurons from 18-day-old rat embryos were dissected and
recording, microelectrodes (4–8 M) were filled with the dissociated using 0.05% Trypsin (Gibco) and plated at a
following solution (in mM): CsCl (110), K-gluconate (30), density of 70,000 cells cm−2 in minimal essential medium
HEPES (10); EGTA (1.1), CaCl2 (0.1), MgATP (4), NaGTP (MEM) supplemented with 10% NU serum (BD Biosciences,
(0.3). With this solution, the GABAA receptor-mediated synaptic Le Pont de Claix, France), 0.45% glucose, 1 mM sodium
currents reversed at a membrane potential of 0 mV. GABA pyruvate (Invitrogen), 2 mM glutamine, 15 mM HEPES
spontaneous activity was isolated using ionotropic glutamatergic Buffer (Invitrogen) and 10 IU ml−1 penicillin-streptomycin
receptor antagonists NBQX (5 µM) and D-APV (40 µM) (Invitrogen) as previously described (Kaech and Banker, 2006).
while membrane potential was held at −70 mV. Smo-agonist On days 7, 10 and 13 of culture incubation (DIV, days
SAG was applied 15 min at the indicated concentrations and in vitro), half of the medium was changed to MEM with 2%
in presence of indicated drugs: cyclopamine (2 µM), BDNF B27 supplement (Invitrogen). For electrophysiology, neuronal
scavenger TrkB-IgG (1 µg/ml) or TrkC-IgG (1 µg/ml). To cultures were plated on coverslips placed in 35-mm culture
block intracellular calcium signaling in the indicated experiment, dishes. Twelve hours before plating, dishes with coverslips were
calcium-chelator BAPTA (10 mM) was added in microelectrodes coated with polyethyleneimine (5 mg/ml).
in addition to the above intrapipette solution.
For the simultaneous recording of spontaneous GABA Electrophysiological Recordings in
inhibitory (sGABA-IPSCs) and glutamate excitatory (sAMPA- Neuronal Cell Culture
EPSCs) post-synaptic currents, glass recording electrodes Electrophysiological recordings from neurons were performed
(4–7 M) were filled with a solution containing (in mM): at 14 DIV. Neurons were continuously perfused with an
100 KGluconate, 13 KCl, 10 N-2-hydroxyethyl piperazine- extracellular solution containing the following (in mM):
N0 -2-ethane sulfonic acid (HEPES), 1.1 ethylene glycol-bis 150 NaCl, 2.5 KCl, 2.5 HEPES, 20 D-glucose, 2.0 CaCl2 ,
(β-aminoethyl ether)-N,N,N0 ,N0 -tetra-acetic acid (EGTA), 2.0 MgCl2 , 0.01 CNQX, 0.4 D-APV pH 7.4, at 1 ml/min.
0.1 CaCl2 , 4 MgATP, and 0.3 NaGTP. The pH of the intracellular Recording electrodes (4–6 M) were filled with a solution
solution was adjusted to 7.2 and the osmolality to 280 mOsmol containing the following (in mM): 140 CsCl, 10 HEPES,
l−1 . With this solution, GABA-IPSCs reversed at −70 mV. 2.5 MgCl2 , 4 Na-ATP, 0.4 Na-GTP, 10 sodium phosphocreatine,
GABA-IPSCs and AMPA-EPSCs were simultaneously recorded 0.6 EGTA, pH 7.2, and with calcium-chelator BAPTA for
at a holding potential of −45 mV. indicated experiment. Smo-agonist SAG was applied in the
The signals were digitized using a Digidata1440A converter bath at 100 nM for 10 min. Recordings were made using an
(Axon Instruments, San Jose, CA, USA). Axoscope software Axopatch-200A amplifier and pCLAMP acquisition software
version 8.1 (Axon Instruments, San Jose, CA, USA) or (Molecular Devices). Series resistance was compensated
pCLAMP1 0.0.1.10 (Axon Instruments, San Jose, CA, USA) and electronically. Data were low-pass filtered at 2 kHz and acquired
MiniAnalysis 6.03 (Synaptosoft, Decatur, CA, USA) programs at 10 kHz. Spontaneous GABA postsynaptic currents were
were used for acquisition and analysis. Series resistance (Rs ), analyzed blindly using Mini Analysis software (Synaptosoft). All
membrane capacitance (Cm) and input resistance (Ri ) were experiments were performed at 22–24◦ C.
determined by an online fitting analysis of the transient currents
in response to a 5-mV pulse with Acquis 4.0 software (Bio-logic, Surface BDNF-mCherry
Orsay, France). Criteria for accepting a recording included a Immunofluorescence Analysis
resting potential < −55 mV, Ri > 400M, Rs < 25M and The procedure was similar to that previously described
cells exhibiting more than 20% change in series resistance were (Kuczewski et al., 2008b; Porcher et al., 2011). Briefly,
excluded from the analysis. hippocampal neurons (14 DIV) were transfected with cDNAs
encoding the BDNF-mCherry using CombiMag Transfection
Reagent (OZ Biosciences; Buerli et al., 2007). The cultures were
Sonic Hedghehog Protein (Shh) incubated with TTX (0.5 µM) for 1 h in the presence or
Immunoassay absence of cyclopamine (2 µM), followed by NBQX (5 µM)
Hippocampal tissues from rats at the indicated age were and D-APV (40 µM) for 10 min. Cell cultures were then
homogenized in RIPA buffer (150 mM NaCl, 1% Triton X100, stimulated for 10 min with SAG (100 nM). The omission of
0.1% SDS, 50 mM Tris HCl, pH 8, containing protease inhibitors SAG or incubation with KCl (50 mM) was used as negative and
(Complete Mini; Roche). Lysates were centrifuged (5000 g for positive controls respectively. Live cultures were incubated at
5 min at 4◦ C). Loading was 200 µg of protein as determined 10◦ C for 1 h in the presence of an anti-DsRed rabbit antibody
using a modified Bradford reaction (BioRad Laboratories). (10 µg/ml; BioVision). Immediately after treatment, cultures
Quantification of Shh was performed with Rat Shh ELISA Kit were fixed for 30 min with 4% PFA at 4◦ C. After fixation,
(FineTest, Wuhan Fine Biotech Company Limited, China) in the cultures were permeabilized and co-incubated overnight with
Frontiers in Cellular Neuroscience | www.frontiersin.org 3 April 2020 | Volume 14 | Article 98Delmotte et al. Sonic Hedgehog Modulates GABAergic Neurotransmission
mouse anti-MAP2 (1:2,000). Cells were exposed to a saturating Statistics
concentration (10 µg/ml) of FITC-conjugated anti-rabbit IgG To ensure the consistency and reproducibility of our results,
(Invitrogen) and Cy5-conjugated anti-mouse IgG (Millipore) we conducted repeated trials (referred to as n) prepared from
for 1.5 h. Quantification was performed using ImageJ software at least three independent experiments or animals (referred to
(NIH, Bethesda, MD, USA1 ). The ratio of surface-bound as N) for each experimental condition. No statistical methods
BDNF-mCherry-FITC to total BDNF-mCherry was estimated were used to predetermine sample sizes, but our sample sizes
as the ratio of the area of co-localized FITC and BDNF- correspond to those reported in previous publications (Guimond
mCherry/total area of BDNF-mCherry and expressed as the et al., 2014; Riffault et al., 2014; Dumon et al., 2019). A
ratio of co-localized signals. Images were acquired using a laser Shapiro–Wilk test was used to verify if the data were normally
scanning confocal microscope (Zeiss LSM 510 Meta) with a 40× or not normally distributed. If not stated otherwise, statistics are
oil-immersion objective. presented as the median only for non-normally distributed data.
For data displaying non-normal distribution, Mann-Whitney
U-test was used for comparison between two independent
Phospho-CREB Activation and groups and Wilcoxon matched-pairs signed-rank test to analyze
Immunocytochemistry differences within one group across conditions. Statistical
The procedure was similar to that previously described analyses and assessment of normal or non-normal distribution
(Kuczewski et al., 2008b; Fiorentino et al., 2009). Briefly, 1 day (Shapiro–Wilk test) were performed with GraphPad Prism
before stimulation (at 13 DIV) one-half of the culture medium (GraphPad software 5.01).
was changed to MEM with 2% B27 supplement. The cultures
were then stimulated with SAG (100 nM) for 10 min in the
absence or presence of different drugs, as described in the RESULTS
results section and figure legends. After stimulation, neurons
were fixed, permeabilized and co-incubated overnight with SAG Enhances GDP Frequency in a
mouse anti-CREB (1:1,000; Cell Signaling Technology, catalog Dose-Dependent Manner During a Critical
no #9104), rabbit anti-phospho-CREB (pCREB, 1:1,000; Cell Temporal Window
Signaling Technology, no #9198) and with chicken anti-MAP2 Spontaneous electrical activity is important to promote specific
(1:4,000, Sigma, no AB5543) antibodies. Immunoreactivity steps of central nervous system development and is therefore
for pCREB, CREB and MAP2 were detected with secondary found during specific time windows in the early stages
antibodies coupled to rabbit-Alexa 488 (1:1,000; Cell Signaling of postnatal development. To assess a potential role of
Technology, no #4412), mouse-Cy3 (1:1,000; Merck Millipore, Shh signaling in ongoing spontaneous synaptic activity, field
no AP130C) and chicken-Alexa 647 (1:1,000; Merck Millipore, potential recordings were made on acute hippocampal slices
no AP194SA6) respectively. All procedures were performed in from P5 to P7 while bath applying the Shh signaling agonist
a phosphate-free solution containing 140 mM NaCl, 5 mM (SAG; Chen et al., 2002b) at concentrations of 10 nM, 100 nM
KCl and 10 mM HEPES-Na, pH 7.4. The acquisition (Zeiss and 1 µM (Belgacem and Borodinsky, 2011, 2015; Feng et al.,
LSM 510) of A488 (pCREB), Cy3 (CREB) and then Cy5 2016) for 15 min. In control hippocampi, the GDP median
(MAP2) was sequential to avoid overlap of excitation and duration is 200–300 ms with a median frequency of 0.021 Hz
emission of fluorescence. The optical sections were digitized (Figures 1A–C). During the application of 10 nM SAG, the
(1,024 × 1,024 pixels) and processed using ImageJ software. median GDP frequency is increased to 0.04 Hz and stays high
during wash at 0.042 Hz (Figures 1A–C), thus suggesting a
Real-Time qRT-PCR long-lasting potentiation effect of SAG on GDPs. Furthermore,
RNA was isolated and quantified by reading the absorbance our results indicate that the effect of SAG on GDP frequency is
at 260 nm (NanoPhotometer, IMPLEN) using an RNeasy kit dose-dependent. Indeed, 10 and 100 nM SAG increased GDP
(Qiagen), then converted to cDNA using 1 µg RNA and a frequency (Figure 1D). On the other hand, 1 µM of SAG
QuantiTect Reverse Transcription kit (Qiagen) according to application decreased GDP frequency (Figure 1D). This effect
the manufacturer’s instructions. PCR was carried out with agrees with previous in vitro studies on NIH 3T3 cell cultures
the LightCycler 480 SYBR Green I Master (Roche Applied that have shown that high concentrations of SAG (i.e., above
Science) with 1 µl cDNA using the following oligonucleotides 1 µM) induce less Shh signaling activation than lower doses in
(QuantiTect Primer Assay, Qiagen): Smo: QT00190183; the range of 100 nM (Chen et al., 2002b). To ensure that the
Ptch1: QT01579669; Gli1: QT01290324 and glyceraldehyde-3- action of SAG was specific to the Smo signaling pathway, we
phosphate dehydrogenase (GAPDH): QT001199633. Relative pre-incubated slices with cyclopamine, a competitive antagonist
mRNA values were calculated using the LC480 software and of Smo that binds to the same domain as SAG (Chen et al.,
GAPDH as the housekeeping gene. The minimal sample size 2002a; Ruat et al., 2014). We found that treatment with 2 µM
for each reported group analyzed using qRT-PCR is three cyclopamine (30 min) showed no effect on GDP when compared
biological replicates. to baseline activity but prevented SAG-induced increase in GDP
frequency (Figure 1E).
GDPs are only present during the first two postnatal
1 http://rsb.info.nih.gov/ij/ weeks in the rodent hippocampus (Khazipov et al., 2004). We
Frontiers in Cellular Neuroscience | www.frontiersin.org 4 April 2020 | Volume 14 | Article 98Delmotte et al. Sonic Hedgehog Modulates GABAergic Neurotransmission
FIGURE 1 | Shh-coreceptor Smoothened (Smo) signaling modulates Giant Depolarizing Potentials (GDP) frequency. (A) Extracellular field recordings of GDP at
P5 to P7 in the CA3 pyramidal layer during 10-min control baseline (baseline), 15-min application of 10 nM Smo-agonist (SAG) and 15-min of wash. GDP are shown
at an expanded time scale on the right. (B) Time course of mean GDP frequency ± SEM (2-min bin) normalized to average frequency during baseline period
preceding SAG application. (C) Box plot and individual data points show GDP frequency in baseline (10-min period before SAG application), SAG (last 10-min of
SAG application) and wash. Median frequency: 0.021 Hz during control baseline and 0.04 Hz during SAG; p = 0.005, N = 6 animals, n = 10 slices; and 0.042 Hz
during wash; p = 0.009 vs. control baseline, N = 6, n = 10; Wilcoxon test. (D) SAG effect on GDP frequency is dose-dependent. Box plot shows median GDP
frequency in control condition or during SAG application at different concentrations, normalized to GDP frequency during baseline. Median values: 100% for control
(0 nM); p = 0.84, N = 3, n = 6; 168% for 10 nM SAG compared to control baseline; p = 0.0059, N = 5, n = 10: 124.6% for 100 nM SAG; p = 0.03, N = 4, n = 6; and
72% for 1 µM SAG; p = 0.015, N = 4, n = 7; Wilcoxon test. (E) Box plot shows the effect on GDP frequency of the application of carrier only (0.1% ethanol, Control),
(Continued)
Frontiers in Cellular Neuroscience | www.frontiersin.org 5 April 2020 | Volume 14 | Article 98Delmotte et al. Sonic Hedgehog Modulates GABAergic Neurotransmission
the amplitude on sGABAA -IPSCs (Figure 2D). Furthermore, we
FIGURE 1 | Continued
observed a dose-dependent effect of SAG on sGABAA -IPSCs
10 nM SAG in 0.1% ethanol (SAG), 2 µM cyclopamine preincubated 30 min
(cyclopamine in 0.1% ethanol), or SAG in the presence of 2 µM cyclopamine
frequency with a threshold and maximal response at 100 nM
preincubated 30 min before (SAG + cyclopamine in 0.1% ethanol). Median (Figure 2E).
values: 100.2% for Control; p = 0.15, N = 4, n = 9; 224.6% for SAG; These data show that the Smo agonist SAG induces a
p = 0.03 compared to baseline period, N = 6, n = 6; 110% for cyclopamine specific dose-dependent increase in spontaneous GABAergic
alone; p = 0.25, N = 3, n = 6; and 81.4% for SAG + cyclopamine; p = 0.46,
postsynaptic currents.
N = 6, n = 6; Wilcoxon test. (F) SAG effect is developmentally regulated. Box
plot shows the effect of 10 nM SAG application on GDP frequency at different
postnatal time points. Median values: 136.8% at P1-3; p = 0.03, N = 4, n = 6; SAG Deregulates the
168.1% at P5-7; p = 0.0059, N = 5, n = 10; and 54.84% at P9-10; p = 0.45,
N = 3, n = 7; Wilcoxon test. (G) Shh protein level remains stable during the
GABAergic/Glutamatergic Transmission
first two postnatal weeks. Box plot shows median Shh protein concentration Balance
measured by ELISA between P0 and P15 in hippocampus lysates. Median Since SAG affects the GABAergic synaptic transmission, we
values: 4.53 ng/ml at P0, n = 4; 9.5 ng/ml at P5, n = 3; 5.3 ng/ml at P10, next sought to determine whether the GABAergic/glutamatergic
n = 3; and 6.73 ng/ml at P15, n = 3; p > 0.05, Mann–Whitney U test. (H)
Smoothened and (I) Patched-1 mRNA level are developmentally regulated.
transmission balance is altered by enhancing Shh-Smo signaling.
Box plots show Shh pathway components mRNA levels in hippocampus at We recorded hippocampal neurons from P5-7 rat slices using
different ages. Median values: For Smo mRNA level: 2.95 a.u. at P0, N = 9; K-Gluconate intrapipette solution with voltage-clamp at −45 mV
3.26 a.u. at P5, N = 10; 1.44 a.u. at P10, N = 9; and 1.61 a.u. at P15, N = 8; to measure simultaneously GABAergic and glutamatergic
p = 0.03 for P0 vs. P10; p = 0.0025 for P0 vs. P15; p = 0.017 for P5 vs. P10; spontaneous activity (sGABAA -IPSCs and sAMPA-EPSCs,
and p = 0.0014 for P5 vs. P15; Mann–Whitney U test. For Ptch-1 mRNA
level: 3.61 a.u. at P0, N = 9; 4.70 a.u. at P5, N = 10; 1.71 a.u. at P10, N = 9;
respectively). As observed in Figure 3A, SAG application does
and 2.03 a.u. at P15, N = 8; p = 0.004 for P5 vs. P10; p = 0.0005 for P5 vs. not change sAMPA-EPSCs (downward deflections in Figure 3A)
P15; Mann–Whitney U test. *p < 0.05, **p < 0.01, ***p < 0.001. frequency (Figures 3A,B) nor its amplitude (Figures 3A,C),
but increases sGABAA -IPSCs (upward deflections in Figure 3A)
frequency (Figures 3A,D) without modifying its amplitude
next assessed whether SAG signaling modulates GDP during
(Figures 3A,E), mimicking the effect observed on sGABA-IPSCs
this critical period by activating the Smo receptor with SAG
under CsCl conditions (Figures 2D,E). These findings lead to a
application (10 nM) on acute hippocampal slices from P1 to
significant increase in the sGABAA -IPSCs over sAMPA-EPSCs
P10 rats. We found that SAG induces an increase in GDP
frequency ratio during SAG application when compared to the
frequency on acute slices at both P1-P3 and P5-7 rats (Figure 1F).
control baseline (Figure 3F).
In contrast, at P9-P10, SAG did not affect significantly GDP
Altogether, these results show that acute Smo activation
frequency (Figure 1F).
does not affect spontaneous glutamatergic transmission
We next measured Shh protein expression levels by ELISA.
while enhances GABAergic transmission, thus, leads to a
Our results show that Shh protein is present in the hippocampus
GABAergic/glutamatergic transmission imbalance in the
at least during the two first postnatal weeks with no significant
newborn rat hippocampus.
variations in the level of Shh proteins between P0 and P15
(Figure 1G). Interestingly, the mRNA levels for the Shh co-
receptors, Smo and Ptch1 in the rat hippocampus are relatively SAG Requires an Intracellular Ca2+ Signal
stable from P0 to P5 but decrease after P10 (Figures 1H,I). to Increase Spontaneous GABAergic
Altogether, these results indicate that Shh protein is present Activity
during this postnatal period and activation of Shh signaling We next investigated the mechanisms triggered by SAG
increases GDP frequency in a dose-dependent manner through to potentiate spontaneous GABAergic activity. Previous
the co-receptor Smo during a critical period from birth to P7, studies have shown that Shh signaling through Smo increases
when the expression of Shh co-receptors is high. spontaneous Ca2+ transient frequency in embryonic spinal cord
neurons (Belgacem and Borodinsky, 2011; Feng et al., 2016). We
SAG Increases GABAergic Spontaneous assessed the contribution of intracellular Ca2+ to SAG-induced
Activity increase in spontaneous GABAergic synaptic transmission.
After establishing the role of SAG on ongoing network To this end, we performed whole-cell dialysis of recorded
activity, we investigated whether it may affect GABAergic neurons with the Ca2+ chelator BAPTA (10 mM) and found that
synaptic transmission. We performed whole-cell patch-clamp BAPTA abolished the SAG-induced increase in sGABAA -IPSCs
recording in acute hippocampal slices at P5-7 by measuring frequency (Figures 4A,B).
spontaneous GABAA receptor-mediated postsynaptic currents The fast action of SAG on the sGABAA -IPSCs frequency
(sGABAA -IPSCs) in CsCl-containing intrapipette solution (see and the dependence on intracellular Ca2+ , suggest that
‘‘Materials and Methods’’ section). Figure 2A illustrates a enhancing SAG signaling activates a non-canonical Smo
typical experiment in which SAG (100 nM) produced an mediated pathway. Canonical Shh-Smo signaling leads
increase in sGABAA -IPSCs frequency within 10 min. Application to an increased expression of its downstream target gene
of SAG in the presence of NBQX and D-APV increases Gli1 (Ruiz i Altaba, 1998; Jacob and Lum, 2007), whereas
sGABAA -IPSCs frequency, which returns to baseline after wash non-canonical pathway inhibits Gli1 expression in the
(Figures 2B,C). Conversely, we found that SAG did not affect developing spinal cord (Belgacem and Borodinsky, 2015).
Frontiers in Cellular Neuroscience | www.frontiersin.org 6 April 2020 | Volume 14 | Article 98Delmotte et al. Sonic Hedgehog Modulates GABAergic Neurotransmission FIGURE 2 | SAG modulates GABAergic spontaneous activity. (A) Representative traces of spontaneous GABAergic inhibitory post-synaptic currents (sGABA-IPSCs) during baseline, SAG application (100 nM) and wash. Averaged sGABA-IPSCs (n = 20 events) are shown at an expanded time scale on the right. (B)) Time course of mean sGABA-IPSCs frequency ± SEM (2-min bin) during SAG application, normalized to baseline period. (C,D) Box plots and individual data points show sGABA-IPSCs frequency (C) and amplitude (D) during baseline, SAG application and wash. Median values: for sGABA-IPSCs frequency: 2.97 Hz for baseline vs. 4.38 Hz during SAG; p = 0.007, N = 4 animals, n = 8 slices; and 2.15 Hz during wash; p = 0.06 compared to baseline, N = 3, n = 6; Wilcoxon test. For sGABA-IPSCs amplitude: 43.08 mV during baseline vs. 43.8 mV during SAG; p = 0.37, N = 4, n = 8; and 41.5 mV during wash; p = 0.99 compared to baseline, N = 3 n = 6; Wilcoxon test. (E) SAG effect on sGABA-IPSCs frequency is dose-dependent. Box plot show median sGABA-IPSCs frequency in control condition or during SAG application at different concentrations, normalized to baseline period. Median values: 105.2% for control; p = 0.13, N = 5, n = 12; 107.3% for SAG at 10 nM; p = 0.69, N = 5, n = 10; 155.6% for SAG at 100 nM; p = 0.007, N = 4, n = 8; and 122.7% for SAG at 1 µM; p = 0.004, N = 7, n = 10; Wilcoxon test. **p < 0.01. To further investigate whether the acute response to Smo 100 nM SAG. The results show that 45-min SAG treatment activation triggers a non-canonical signaling pathway, does not change Gli1 transcription factor mRNA levels, Gli1 expression was measured using qRT-PCR after while 6 h incubation induces an increase in Gli1 mRNA incubating the hippocampal slices for 45-min or 6 h with transcripts (Figure 4C). Frontiers in Cellular Neuroscience | www.frontiersin.org 7 April 2020 | Volume 14 | Article 98
Delmotte et al. Sonic Hedgehog Modulates GABAergic Neurotransmission
FIGURE 3 | SAG regulates the excitatory/inhibitory spontaneous activity balance. (A) Representative traces of spontaneous AMPA excitatory post-synaptic currents
(sAMPA-EPSCs, downward deflections, arrowhead) and GABAergic inhibitory post-synaptic currents (sGABA-IPSCs, upward deflections, arrows) during baseline
and SAG application (100 nM). (B–E) Box plots and individual data points show median sAMPA-EPSCs (B,C) and sGABA-IPSCs (D,E) frequency (B,D) and
amplitude (C,E) during baseline and SAG application. Median values: For sAMPA frequency: 1.12 Hz for baseline vs. 1.01 Hz during SAG; p = 0.31, N = 6 animals,
n = 6 slices. For sAMPA amplitude: 32.9 pA for baseline vs. 46.16 pA during SAG; p = 0.99, N = 6, n = 6; Wilcoxon test. Median values: For sGABA frequency:
0.90 Hz for baseline vs. 1.77 Hz during SAG; p = 0.03, N = 6, n = 6. For sGABA amplitude: 34.5 pA for baseline vs. 39.9 pA during SAG; p = 0.15, N = 6, n = 6;
Wilcoxon test. (F) Box plots and individual data points show ratio of sGABA-IPSCs over sAMPA-EPSCs frequencies. Median values: 1.03 a.u. for baseline, vs.
2.92 a.u. during SAG; p = 0.015, N = 6, n = 6; Wilcoxon test. *p < 0.05.
Overall, these data show that SAG-induced-increase in did not block the effect of SAG on sGABAA -IPSCs frequency
sGABAA -IPSCs frequency is dependent on postsynaptic (Figures 5A,C,D).
Ca2+ signaling probably through non-canonical Shh-Smo These data suggest that the Smo agonist SAG enhances
signaling pathway. spontaneous GABAergic synaptic transmission in a BDNF-
TrkB-dependent manner.
BDNF-TrkB Signaling Is Required for SAG
to Potentiate GABAergic Activity Shh Activates the BDNF-TrkB Signaling
Previous findings have shown that activation of Shh signaling Pathway
increases BDNF levels (Dai et al., 2011; Radzikinas et al., 2011; To confirm that SAG recruits the BDNF signaling, we
Bond et al., 2013; He et al., 2016) and given that regulated release decided to use an in vitro model of primary hippocampal
of BDNF increases spontaneous GABAergic synaptic activity via neuron cultures. We first performed whole-cell patch-clamp
its high-affinity receptor TrkB (Gubellini et al., 2005; Kuczewski recordings on primary hippocampal neuron cultures to measure
et al., 2008a, 2011), we assessed whether the effect of SAG on spontaneous GABAergic synaptic activity at 14 days in vitro
GABAergic activity requires the activation of the BDNF-TrkB (DIV). Following our previous results obtained on hippocampal
signaling pathway. To test this hypothesis, hippocampal slices slices, 100 nM SAG increases the sGABAA -IPSCs frequency
were incubated with the BDNF-scavenger TrkB-IgG (1 µg/ml) (Figures 6A,B) and does not affect the amplitude of sGABAA -
or with the NT3-scavenger TrkC-IgG (1 µg/ml) as control. We IPSCs (Figures 6A,C). As observed in hippocampal slices,
found that TrkB-IgG prevented the SAG-induced increase in BAPTA prevents the increase in sGABAA -IPSCs frequency
sGABAA -IPSCs frequency (Figures 5A,B,D), while TrkC-IgG produced by SAG application (Figure 6D). Altogether, these
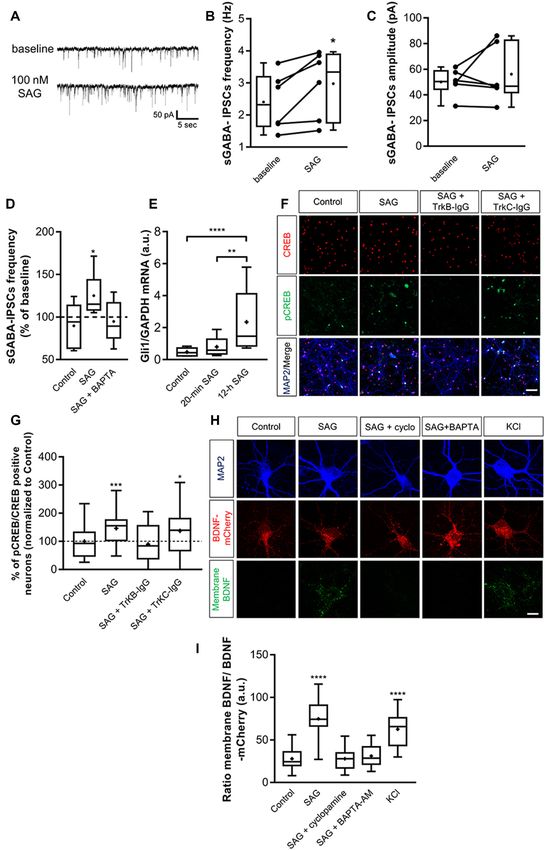
Frontiers in Cellular Neuroscience | www.frontiersin.org 8 April 2020 | Volume 14 | Article 98Delmotte et al. Sonic Hedgehog Modulates GABAergic Neurotransmission FIGURE 4 | SAG regulates GABA spontaneous activity through non-canonical signaling. (A) Time course of mean sGABA-IPSCs frequency during SAG application (100 nM) normalized to baseline period, in control conditions (circles) or with intracellular Ca2+ -chelator BAPTA (squares, 10 nM). (B) Box plots and individual data points show median sGABA-IPSCs frequency during baseline or BAPTA + SAG application. Median values: 3.21 Hz for baseline BAPTA, vs. 3.71 Hz during SAG + BAPTA; p = 0.56, N = 5 animals, n = 6 slices; Wilcoxon test. (C) Transcription factor Gli1 mRNA level during short (45 min) or long (6 h) incubation with 100 nM SAG in hippocampal slices measured by qRT-PCR. Median values: 1.55 a.u. in 45 min control condition, n = 6; 1.27 a.u. for 45 min SAG, n = 6; 2.035 a.u. in 6 h-control condition, n = 6 and 4.36 a.u. for 6 h SAG, n = 6; p = 0.18 for 45 min control vs. 45 min SAG; p = 0.02 for 6 h-control vs. 6 h SAG; p = 0.002 for 45 min SAG vs. 6 h SAG; Mann–Whitney U test. *p < 0.05, **p < 0.01. results confirm those obtained using acute hippocampal slices SAG (100 nM; 10 min) produced a significant increase in and validate the use of hippocampal cell cultures to further membrane-bound BDNF-mCherry (Figures 6H,I). This effect investigate the functional link between SAG and BDNF-TrkB was prevented by the addition of 2 µM cyclopamine or 10 µM signaling. To confirm that acute stimulation of hippocampal BAPTA-AM (Figures 6H,I). neurons with SAG does not activate a canonical pathway, Altogether, our findings suggest that Shh-Smo signaling we assessed Gli1 expression. Results show that 20-min SAG upregulates the secretion of BDNF and consequently the treatment in hippocampal neuron cultures does not change activation of the BDNF-TrkB signaling pathway. Gli1 transcription factor mRNA levels, while 12 h incubation induces a 3-fold increase in Gli1 transcripts (Figure 6E). To DISCUSSION assess the effect of SAG (10 min incubation at 100 nM) on the BDNF-TrkB signaling pathway, we measured the levels of Shh is a prominent neurotrophic factor that acts at multiple levels the phosphorylated form of cAMP-response element-binding during central nervous system development from embryonic protein (CREB), a direct downstream target of BDNF-TrkB through postnatal stages, and perturbations in its activity lead (Ghosh et al., 1994). The ratio between pCREB and CREB to major neurodevelopmental disorders (Currier et al., 2012; immunopositive neurons was quantified and expressed as Boyd et al., 2015; Halepoto et al., 2015; Feng et al., 2016; Patel a percentage of the control condition for each culture et al., 2017; Kumar et al., 2019; Sasai et al., 2019). Here, we (Figures 6F,G). SAG induces a significant increase in the demonstrate in both hippocampal slices and neuronal cultures pCREB/CREB ratio, which is prevented by pre-incubation that the Smo agonist SAG modulates spontaneous network with the TrkB-IgG scavenger and not by the TrkC-IgG activity and GABAergic synaptic plasticity in the maturing scavenger (Figures 6F,G). Finally, to investigate the ability of rodent hippocampus through the secretion and signaling of SAG to induce BDNF secretion, mCherry-tagged BDNF was BDNF and an intracellular Ca2+ -dependent mechanism. overexpressed in cultured hippocampal neurons (Kuczewski We found that in the postnatal hippocampus Smo activation et al., 2008b; Porcher et al., 2011). We compared levels of leads to a long-lasting increase in GDP frequency that occurs BDNF-mCherry bound to the cell membrane of transfected only during the first postnatal week, suggesting the existence of neurons with an antibody directed against mCherry (see a specific temporal window for Shh-Smo signaling modulation ‘‘Materials and Methods’’ section) in cultures subjected to of spontaneous network activity. However, whether Shh-Smo different conditions. In transfected neurons, 10 min incubation signaling regulates sGABA-IPSCs in the mature hippocampus with 50 mM KCl produced green staining surrounding the (i.e., after P15) will require further study. Although, we did BDNF-mCherry expressing neurons, reflecting the release of not observe a progressive increase in Shh levels as observed BDNF (Figure 6H, bottom panel). In contrast, in the control using immunoblots (Rivell et al., 2019), we confirmed by ELISA condition, the cell surface-bound of BDNF-mCherry was barely that Shh protein is expressed in the postnatal hippocampus. detectable (Figures 6H,I). We found that incubation with Interestingly, this period corresponds to a critical developmental Frontiers in Cellular Neuroscience | www.frontiersin.org 9 April 2020 | Volume 14 | Article 98
Delmotte et al.                                                                                       Sonic Hedgehog Modulates GABAergic Neurotransmission

                                                                                    synaptic transmission without affecting the glutamatergic
                                                                                    component. This selective action of SAG on GABAergic
                                                                                    synaptic currents reveals one plausible mechanism underlying
                                                                                    Shh-Smo modulation of GDP frequency in the maturing
                                                                                    hippocampus. Whether SAG requires a GABAergic excitatory
                                                                                    response in pyramidal cells remains to be elucidated but we can
                                                                                    hypothesize that these effects are unlikely to be related to the
                                                                                    depolarizing action of GABA because the SAG-induced increase
                                                                                    in GABAergic activity required a postsynaptic rise in calcium
                                                                                    as the effect was prevented when the recorded neurons were
                                                                                    loaded with 10 mM BAPTA. Additionally, the efficacy of SAG
                                                                                    to potentiate GABAergic activity was observed under conditions
                                                                                    where GABA is depolarizing (CsCl solution) as well as under
                                                                                    conditions where GABA is hyperpolarizing (K-Gluconate
                                                                                    solution). We find that this increase in GABAergic inputs
                                                                                    leads to a GABAergic/glutamatergic imbalance. Alterations
                                                                                    in excitatory/inhibitory balance and GDP dynamics have
                                                                                    been involved in the onset of neurodevelopmental disorders
                                                                                    (Griguoli and Cherubini, 2017), including autistic-like behavior
                                                                                    phenotype (Tyzio et al., 2014) or increased seizure susceptibility
  FIGURE 5 | SAG recruits BDNF-TrkB signaling to potentiate GABAergic
                                                                                    (Chiu et al., 2008). Interestingly, previous studies reported
  activity. (A) Time course of mean sGABA-IPSCs frequency during SAG                abnormally increased serum levels of Shh in children with
  (100 nM) application normalized to baseline period, with BDNF-scavenger           Autism Spectrum Disorder (Al-Ayadhi, 2012; Halepoto
  TrkB-IgG (circles) or NT3-scavenger TrkC-IgG (squares) preincubation. (B)         et al., 2015), thus suggesting a possible causal link between
  Box plots and individual data points show sGABA-IPSCs frequency after 1 h
                                                                                    alterations in Shh signaling and neurodevelopmental disorders
  of preincubation with TrkB-IgG during baseline (baseline TrkB-IgG) and SAG
  application (SAG + TrkB-IgG). Median values: 10.3 Hz for baseline, vs.
                                                                                    (Kumar et al., 2019). Other trophic factors are known to
  12.7 Hz for SAG + TrkB IgG; p = 0.19, N = 3, n = 8; Wilcoxon test. (C) Box        modulate spontaneous ongoing network activity such as
  plots and individual data points show sGABA-IPSCs frequency after 1 h of          the chemokine stromal cell-derived factor-1-alpha (SDF-
  preincubation with TrkC-IgG during baseline (baseline TrkC-IgG) and SAG           1α; Kasyanov et al., 2006), BDNF (Mohajerani et al., 2007)
  application (SAG + TrkC-IgG). Median values: 4.24 Hz for baseline, vs.
                                                                                    and the hormone leptin (Guimond et al., 2014; Dumon
  4.59 Hz for SAG + TrkC-IgG; p = 0.03, N = 3, n = 6; Wilcoxon test. (D) Box
  plots show median sGABA-IPSCs frequency during SAG application, SAG +             et al., 2019). Both BDNF and leptin increase spontaneous
  TrkB-IgG preincubation or SAG + TrkC-IgG preincubation, normalized to             GABAergic postsynaptic current frequency through the
  baseline period. Median values: 155.6% for SAG alone; p = 0.007, N = 4,           extracellular signal-related kinase (ERK) pathway. In contrast,
  n = 8; 110.4% for SAG + TrkB-IgG; p = 0.19, N = 3, n = 8; and 123.3% for          Shh inhibits ERK in an oxidative stress model of cultured
  SAG + TrkC-IgG; p = 0.03, N = 3, n = 6; Wilcoxon test. *p < 0.05,
  **p < 0.01.
                                                                                    cortical neurons to prevent apoptosis (Dai et al., 2012). The
                                                                                    identification of downstream effectors and their spatiotemporal
                                                                                    regulation in the Shh-mediated enhancement of GABAergic
phase during which synaptogenesis and network formation                             transmission in the early postnatal hippocampus requires
take place (Griguoli and Cherubini, 2017). Further, we showed                       further investigation.
that Smo and Ptch1 transcript levels are downregulated                                  Activation of Smo-dependent canonical Shh signaling leads
at the end of the first postnatal week, suggesting that                             to the recruitment of the Gli-family transcription factors
the expression of Shh co-receptors may participate in the                           (Briscoe and Thérond, 2013). However, this pathway is
process of establishing hippocampal neuronal circuits. Similarly,                   transcription-dependent, thus, it is not likely to mediate
a spatiotemporal expression of Shh components has been                              acute changes in synaptic physiology. On the other hand,
recently described in the developing human cerebral cortex                          non-canonical Smo-dependent signaling involves a fast response
(Memi et al., 2018).                                                                that often relies on kinases such as PKA, Src family kinases
    It is well known that the ongoing polysynaptic events are                       and second messengers such as Ca2+ and cAMP (Charron
dependent on synchronized GABAergic and glutamatergic                               et al., 2003; Riobo et al., 2006; Belgacem and Borodinsky,
synaptic transmission (Ben-Ari et al., 1989) and are thought to                     2011, 2015; Peng et al., 2018). In this study, we found
be important for the generation of neuronal networks, serving                       that SAG modulation of spontaneous GABAergic synaptic
as a coincidence detector to reinforce synapses from neurons                        activity at the cellular and network levels occurs within
spiking together (Kasyanov et al., 2004; Mohajerani et al.,                         minutes, suggesting the involvement of such non-canonical
2007; Griguoli and Cherubini, 2017). The higher sensitivity                         Shh-Smo signaling in this process. The non-canonical Shh
to SAG observed on polysynaptic GDP events as compared to                           signaling in the embryonic spinal cord is dependent on
monosynaptic sGABA-IPSCs activity may reflect the cumulative                        inositol triphosphate (IP3) second messenger and Ca2+ activity
effects of SAG in network-driven activities. At the cellular                        through intracellular Ca2+ stores and Ca2+ influx (Belgacem and
level, our results indicate that SAG enhances GABAergic                             Borodinsky, 2011, 2015). These second messengers are involved

Frontiers in Cellular Neuroscience | www.frontiersin.org                       10                                         April 2020 | Volume 14 | Article 98
Delmotte et al. Sonic Hedgehog Modulates GABAergic Neurotransmission
FIGURE 6 | Smo pathway induces BDNF release from hippocampal neurons grown in vitro. (A) Representative traces of spontaneous GABAergic inhibitory
post-synaptic currents (sGABA-IPSCs) during control baseline or SAG application (100 nM) in cultured hippocampal neurons at 14 DIV. (B,C) Box plots and
individual data points show sGABA-IPSCs frequency (B) and amplitude (C) during baseline and SAG application. Median values: For sGABA-IPSCs frequency:
2.31 Hz for baseline; and 3.32 Hz during SAG; p = 0.015, N = 4 cultures, n = 6 cells; Wilcoxon test. For sGABA-IPSCs amplitude: 50.3 pA for baseline and 46.66 pA
during SAG; p = 0.62, N = 4, n = 6; Wilcoxon test. (D) Box plots show median sGABA-IPSCs frequency normalized to baseline period, during application of carrier
only (control), 100 nM SAG alone (SAG), or SAG with intracellular Ca2+ -chelator BAPTA (SAG + BAPTA). Median values: 94.2% for Control; p = 0.21, n = 5; 115%
during SAG; p = 0.015, n = 6; 89.27% during SAG + BAPTA; p = 0.62, n = 5; Wilcoxon test. (E) Transcription factor Gli1 mRNA level during short (20 min) or long
(12 h) incubation with 100 nM SAG in hippocampal neuron culture at 14 DIV measured by qRT-PCR. Median values: 0.42 a.u. for Control, N = 8; 0.58 a.u. for 20-min
SAG, N = 8; and 1.46 a.u. for 12-h SAG, N = 11; p = 0.19 for Control vs. 20-min SAG; p = 0.0001 for Control vs. 12-h SAG; p = 0.006 for 20-min SAG vs.
12 h-SAG. *p < 0.05, **p < 0.01, ***p < 0.005, ****p < 0.001; Mann–Whitney U test. (F) Cultured hippocampal neurons immunostained for CREB (red, top),
(Continued)
Frontiers in Cellular Neuroscience | www.frontiersin.org 11 April 2020 | Volume 14 | Article 98Delmotte et al. Sonic Hedgehog Modulates GABAergic Neurotransmission
to promote regeneration of injured neurons (Hashimoto
FIGURE 6 | Continued
et al., 2004; Dai et al., 2012; Bond et al., 2013). In the lung
pCREB (green, middle) in control conditions (control), or treated with 100 nM
SAG alone (10 min; SAG), SAG plus TrkB-IgG preincubation (SAG +
epithelium, Shh has been reported to indirectly regulate the
TrkB-IgG), or with SAG plus TrkC-IgG preincubation (SAG + TrkC-IgG). Down, expression of BDNF through the inhibition of a BDNF repressor
merged images with MAP2 staining (blue). Scale bar: 50 µm. (G) Box plots of (Radzikinas et al., 2011).
pCREB on CREB immunostained neurons in different conditions, normalized In conclusion, our results shed a light on a new role for
to control for each culture. Median values: 92.65% for Control, N = 5 cultures,
the morphogenic peptide Shh in the maturation and refinement
n = 34 fields; 155.2% for SAG, N = 5, n = 41; 83.79% for SAG + TrkB-IgG,
N = 5, n = 35; and 139.1% for SAG + TrkC-IgG, N = 4, n = 25; p = 0.0004 for of GABAergic synaptic transmission in the rodent postnatal
Control vs. SAG; p = 0.41 for Control vs. SAG + TrkB-IgG; p = 0.03 for hippocampus. We have shown that the non-canonical Smo
Control vs. SAG + TrkC-IgG; Mann–Whitney U test. (H) SAG induces BDNF signaling may likely involve the secretion of BDNF to trigger
release. BDNF-mCherry transfected neurons (red) are live immunostained an increase of spontaneous GABAergic post-synaptic currents.
with antibody against mCherry (green) in non-permeable condition and
Altogether, these results bring therefore new perspectives for
treated during 10 min with KCl (50 mM) or SAG (100 nM) with or without
cyclopamine (2 µM) or BAPTA (10 µM). Neurons are immunostained after the function of this versatile protein in shaping neuronal
fixation with an antibody against MAP2 (blue). Scale bar: 10 µm. (I) Box plots networks during brain maturation and its involvement in
show median fluorescence intensity ratio of released membrane-bound BDNF neurodevelopmental disorders.
on total BDNF-mCherry in different culture conditions. Median values:
24.46 a.u. for control, N = 3 cultures, n = 32 cells; 74.25 a.u. for SAG,
N = 3 cultures, n = 31 cells; 27.94 a.u. for SAG + cyclopamine, N = 3, n = 37;
28.56 a.u. for SAG + BAPTA-AM, N = 3, n = 25; and 65.7 a.u. for KCl, N = 3,
DATA AVAILABILITY STATEMENT
n = 30; p = 0.0001 for control vs. SAG; p = 0.85 for control vs. SAG +
cyclopamine; p = 0.28 for control vs. SAG + BAPTA-AM; p = 0.0001 for The datasets generated for this study are available on request to
control vs. KCl; Mann–Whitney U test. *p < 0.05, **p < 0.01, ***p < 0.005, the corresponding author.
****p < 0.001.
ETHICS STATEMENT
in the modulation of developmental forms of GABAergic
synaptic plasticity (Ben-Ari et al., 2007; Guimond et al., The animal study was reviewed and approved by INSERM
2014; Dumon et al., 2019). Also, two recent studies suggested animal welfare through the local committee and the European
that non-canonical Shh signaling is likely to induce Ca2+ Communities Council Directive of 24 November 1986
oscillations in hippocampal glial cells through the activation (86/609/EEC).
of ATP-permeable channels (Adachi et al., 2019) and may
produce in hippocampal neuronal cultures an intracellular Ca2+
increase mediated by the activation of the NMDA receptor AUTHOR CONTRIBUTIONS
(Feng et al., 2016).
We show that SAG-induced potentiation of GABAA YHB, QD, and CP planned the experiments. QD, MH, YB, DD,
post-synaptic currents is prevented by chelating intracellular CP, YHB, AM, MK, and J-LG performed the experiments and
Ca2+ in hippocampal neurons. This observation indicates analyzed the data. QD, YHB, and CP wrote the manuscript.
that SAG modulates spontaneous GABAergic activity in the
developing hippocampus through post-synaptic Ca2+ dynamics.
Our experiments have been realized in the presence of ionotropic
FUNDING
glutamate receptor antagonists, which exclude the possibility This work was supported by The National Institute of Health and
of Ca2+ entry through the NMDA receptors. Further, our Medical Research (INSERM), the National Center for Scientific
study indicates that the trophic action of SAG was blocked Research (CNRS), the National Agency for Research (ANR,
by the scavenging BDNF. It is worth noting that BDNF is an grant number R07066AS 2008-2011) to QD, MH, DD, YB,
important factor playing a crucial role in synaptic plasticity and MK, AM, J-LG, and CP and the A*MIDEX project (n◦ ANR-
network assembly (Lu, 2003; Kuczewski et al., 2009; Porcher 11-IDEX-0001-02) funded by the «Investissements d’Avenir»
et al., 2018). Moreover, it has been demonstrated that ongoing French Government program, managed by the French National
synaptic activity in the developing rodent hippocampus can Research Agency (ANR). IMERA/INSERM Grant, Marie Curie
trigger the post-synaptic release of BDNF through Ca2+ influx Prestige/ERC Grant (PRESTIGE-2016-3-0025) and Brain &
(Kuczewski et al., 2008a,Kuczewski et al., 2008b; Fiorentino Behavior Research Foundation (NARSAD) Young investigator
et al., 2009). Within the hippocampus, BDNF is mainly grant (#25356) to YHB.
expressed by principal glutamatergic neurons and released
in an activity-dependent manner. Therefore, our findings
support a model in which SAG promotes GABAergic synaptic ACKNOWLEDGMENTS
activity through the secretion of BDNF by excitatory pyramidal
cells in the immature hippocampus. This interplay between We thank Drs. L. Borodinsky and M. Ruat for critical reading of
Shh-Smo signaling and BDNF is not well understood but the manuscript. We also thank F. Michel at inMAGIC (INMED
studies realized in cortical neurons, sciatic and cavernous Imaging Center) and E. Pallesi-Pocachard at PBMC (INMED
nerves indicated that Shh up-regulates BDNF secretion Molecular and Cellular Biology Facility).
Frontiers in Cellular Neuroscience | www.frontiersin.org 12 April 2020 | Volume 14 | Article 98Delmotte et al. Sonic Hedgehog Modulates GABAergic Neurotransmission
REFERENCES neurons under oxidative stress. J. Huazhong Univ. Sci. Technol. Med. Sci. 32,
856–860. doi: 10.1007/s11596-012-1047-x
Adachi, C., Kakinuma, N., Jo, S., Ishii, T., Arai, Y., Arai, S., et al. (2019). Sonic Dai, R. L., Zhu, S. Y., Xia, Y. P., Mao, L., Mei, Y. W., YAo, Y. M., et al. (2011).
hedgehog enhances calcium oscillations in hippocampal astrocytes. J. Biol. Sonic hedgehog protects cortical neurons against oxidative stress. Neurochem.
Chem. 294, 16034–16048. doi: 10.1074/jbc.ra119.007883 Res. 36, 67–75. doi: 10.1007/s11064-010-0264-6
Al-Ayadhi, L. Y. (2012). Relationship between sonic hedgehog protein, brain- Dumon, C., Pisella, L., Diabira, D., Belaidouni, Y., Wayman, G. A., and
derived neurotrophic factor and oxidative stress in autism spectrum disorders. Gaiarsa, J.-L. (2019). Developmental switch of leptin action on network
Neurochem. Res. 37, 394–400. doi: 10.1007/s11064-011-0624-x driven activity in the neonatal rat hippocampus. Front. Cell. Neurosci. 13:254.
Belgacem, Y. H., and Borodinsky, L. N. (2011). Sonic hedgehog signaling doi: 10.3389/fncel.2019.00254
is decoded by calcium spike activity in the developing spinal cord. Feng, S., Ma, S., Jia, C., Su, Y., Yang, S., Zhou, K., et al. (2016). Sonic hedgehog
Proc. Natl. Acad. Sci. U S A 108, 4482–4487. doi: 10.1073/pnas.1018 is a regulator of extracellular glutamate levels and epilepsy. EMBO Rep. 17,
217108 682–694. doi: 10.15252/embr.201541569
Belgacem, Y. H., and Borodinsky, L. N. (2015). Inversion of Sonic hedgehog action Fiorentino, H., Kuczewski, N., Diabira, D., Ferrand, N., Pangalos, M. N.,
on its canonical pathway by electrical activity. Proc. Natl. Acad. Sci. U S A 112, Porcher, C., et al. (2009). GABAB receptor activation triggers BDNF release and
4140–4145. doi: 10.1073/pnas.1419690112 promotes the maturation of GABAergic synapses. J. Neurosci. 29, 11650–11661.
Belgacem, Y. H., Hamilton, A. M., Shim, S., Spencer, K. A., and Borodinsky, L. N. doi: 10.1523/JNEUROSCI.3587-09.2009
(2016). The many hats of sonic hedgehog signaling in nervous system Ghosh, A., Carnahan, J., and Greenberg, M. E. (1994). Requirement for BDNF
development and disease. J. Dev. Biol. 4:E35. doi: 10.3390/jdb4040035 in activity-dependent survival of cortical neurons. Science 263, 1618–1623.
Ben-Ari, Y., Cherubini, E., Corradetti, R., and Gaiarsa, J. L. (1989). Giant doi: 10.1126/science.7907431
synaptic potentials in immature rat CA3 hippocampal neurones. J. Physiol. 416, Griguoli, M., and Cherubini, E. (2017). Early correlated network activity in
303–325. doi: 10.1113/jphysiol.1989.sp017762 the hippocampus: its putative role in shaping neuronal circuits. Front. Cell.
Ben-Ari, Y., Gaiarsa, J.-L., Tyzio, R., and Khazipov, R. (2007). GABA: a pioneer Neurosci. 11:255. doi: 10.3389/fncel.2017.00255
transmitter that excites immature neurons and generates primitive oscillations. Gubellini, P., Ben-Ari, Y., and Gaïarsa, J.-L. (2005). Endogenous
Physiol. Rev. 87, 1215–1284. doi: 10.1152/physrev.00017.2006 neurotrophins are required for the induction of GABAergic long-term
Ben-Ari, Y., Khalilov, I., Kahle, K. T., and Cherubini, E. (2012). The GABA potentiation in the neonatal rat hippocampus. J. Neurosci. 25, 5796–5802.
excitatory/inhibitory shift in brain maturation and neurological disorders. doi: 10.1523/JNEUROSCI.0824-05.2005
Neuroscientist 18, 467–486. doi: 10.1177/1073858412438697 Guimond, D., Diabira, D., Porcher, C., Bader, F., Ferrand, N., Zhu, M., et al. (2014).
Bond, C. W., Angeloni, N., Harrington, D., Stupp, S., and Podlasek, C. A. (2013). Leptin potentiates GABAergic synaptic transmission in the developing rodent
Sonic Hedgehog regulates brain-derived neurotrophic factor in normal and hippocampus. Front. Cell. Neurosci. 8:235. doi: 10.3389/fncel.2014.00235
regenerating cavernous nerves. J. Sex. Med. 10, 730–737. doi: 10.1111/jsm. Halepoto, D. M., Bashir, S., Zeina, R., and Al-Ayadhi, L. Y. (2015). Correlation
12030 between hedgehog (Hh) protein family and brain-derived neurotrophic factor
Boyd, P. J., Cunliffe, V. T., Roy, S., and Wood, J. D. (2015). Sonic hedgehog (BDNF) in autism spectrum disorder (ASD). J. Coll. Physicians Surg. Pak. 25,
functions upstream of disrupted-in-schizophrenia 1 (disc1): implications for 882–885. doi: 12.2015/JCPSP.882885
mental illness. Biol. Open 4, 1336–1343. doi: 10.1242/bio.012005 Hashimoto, K., Shimizu, E., and Iyo, M. (2004). Critical role of brain-
Briscoe, J., and Thérond, P. P. (2013). The mechanisms of Hedgehog signalling derived neurotrophic factor in mood disorders. Brain Res. Rev. 45, 104–114.
and its roles in development and disease. Nat. Rev. Mol. Cell Biol. 14, 416–429. doi: 10.1016/j.brainresrev.2004.02.003
doi: 10.1038/nrm3598 He, W., Cui, L., Zhang, C., Zhang, X., He, J., and Xie, Y. (2016).
Buerli, T., Pellegrino, C., Baer, K., Lardi-Studler, B., Chudotvorova, I., Sonic hedgehog promotes neurite outgrowth of primary cortical neurons
Fritschy, J.-M., et al. (2007). Efficient transfection of DNA or shRNA through Up-regulating BDNF expression. Neurochem. Res. 41, 687–695.
vectors into neurons using magnetofection. Nat. Protoc. 2, 3090–3101. doi: 10.1007/s11064-015-1736-5
doi: 10.1038/nprot.2007.445 Jacob, L., and Lum, L. (2007). Deconstructing the hedgehog pathway in
Canitano, R., and Pallagrosi, M. (2017). Autism spectrum disorders and development and disease. Science 318, 66–68. doi: 10.1126/science.1147314
schizophrenia spectrum disorders: excitation/inhibition imbalance and Kaech, S., and Banker, G. (2006). Culturing hippocampal neurons. Nat. Protoc. 1,
developmental trajectories. Front. Psychiatry 8:69. doi: 10.3389/fpsyt.2017. 2406–2415. doi: 10.1038/nprot.2006.356
00069 Kasyanov, A. M., Safiulina, V. F., Voronin, L. L., and Cherubini, E. (2004). GABA-
Charron, F., Stein, E., Jeong, J., McMahon, A. P., and Tessier-Lavigne, M. (2003). mediated giant depolarizing potentials as coincidence detectors for enhancing
The morphogen sonic hedgehog is an axonal chemoattractant that collaborates synaptic efficacy in the developing hippocampus. Proc. Natl. Acad. Sci. U S A
with netrin-1 in midline axon guidance. Cell 113, 11–23. doi: 10.1016/s0092- 101, 3967–3972. doi: 10.1073/pnas.0305974101
8674(03)00199-5 Kasyanov, A., Tamamura, H., Fujii, N., and Xiong, H. (2006). HIV-
Charytoniuk, D., Porcel, B., Rodríguez Gomez, J., Faure, H., Ruat, M., and 1 gp120 enhances giant depolarizing potentials via chemokine receptor
Traiffort, E. (2002). Sonic Hedgehog signalling in the developing and adult CXCR4 in neonatal rat hippocampus. Eur. J. Neurosci. 23, 1120–1128.
brain. J. Physiol. Paris 96, 9–16. doi: 10.1016/s0928-4257(01)00075-4 doi: 10.1111/j.1460-9568.2006.04646.x
Chen, J. K., Taipale, J., Cooper, M. K., and Beachy, P. A. (2002a). Inhibition of Khazipov, R., Khalilov, I., Tyzio, R., Morozova, E., Ben-Ari, Y., and Holmes, G. L.
Hedgehog signaling by direct binding of cyclopamine to Smoothened. Genes (2004). Developmental changes in GABAergic actions and seizure susceptibility
Dev. 16, 2743–2748. doi: 10.1101/gad.1025302 in the rat hippocampus. Eur. J. Neurosci. 19, 590–600. doi: 10.1111/j.0953-816x.
Chen, J. K., Taipale, J., Young, K. E., Maiti, T., and Beachy, P. A. (2002b). Small 2003.03152.x
molecule modulation of Smoothened activity. Proc. Natl. Acad. Sci. U S A 99, Kuczewski, N., Fuchs, C., Ferrand, N., Jovanovic, J. N., Gaiarsa, J.-L., and
14071–14076. doi: 10.1073/pnas.182542899 Porcher, C. (2011). Mechanism of GABAB receptor-induced BDNF secretion
Colin-Le Brun, I., Ferrand, N., Caillard, O., Tosetti, P., Ben-Ari, Y., and Gaïarsa, J.- and promotion of GABAA receptor membrane expression. J. Neurochem. 118,
L. (2004). Spontaneous synaptic activity is required for the formation of 533–545. doi: 10.1111/j.1471-4159.2011.07192.x
functional GABAergic synapses in the developing rat hippocampus. J. Physiol. Kuczewski, N., Langlois, A., Fiorentino, H., Bonnet, S., Marissal, T., Diabira, D.,
559, 129–139. doi: 10.1113/jphysiol.2004.065060 et al. (2008a). Spontaneous glutamatergic activity induces a BDNF-dependent
Currier, D. G., Polk, R. C., and Reeves, R. H. (2012). A sonic hedgehog (Shh) potentiation of GABAergic synapses in the newborn rat hippocampus.
response deficit in trisomic cells may be a common denominator for multiple J. Physiol. 586, 5119–5128. doi: 10.1113/jphysiol.2008.158550
features of Down syndrome. Prog. Brain. Res. 197, 223–236. doi: 10.1016/b978- Kuczewski, N., Porcher, C., Ferrand, N., Fiorentino, H., Pellegrino, C., Kolarow, R.,
0-444-54299-1.00011-x et al. (2008b). Backpropagating action potentials trigger dendritic release
Dai, R., Xia, Y., Mao, L., Mei, Y., Xue, Y., and Hu, B. (2012). Involvement of of BDNF during spontaneous network activity. J. Neurosci. 28, 7013–7023.
PI3K/Akt pathway in the neuroprotective effect of Sonic hedgehog on cortical doi: 10.1523/JNEUROSCI.1673-08.2008
Frontiers in Cellular Neuroscience | www.frontiersin.org 13 April 2020 | Volume 14 | Article 98You can also read