Reconstructing Four Centuries of Temperature-Induced Coral Bleaching on the Great Barrier Reef
←
→
Page content transcription
If your browser does not render page correctly, please read the page content below
ORIGINAL RESEARCH
                                                                                                                                          published: 15 August 2018
                                                                                                                                     doi: 10.3389/fmars.2018.00283

                                             Reconstructing Four Centuries of
                                             Temperature-Induced Coral
                                             Bleaching on the Great Barrier Reef
                                             Nicholas A. Kamenos 1* and Sebastian J. Hennige 2
                                             1
                                              School of Geographical and Earth Sciences, University of Glasgow, Glasgow, United Kingdom, 2 School of GeoSciences,
                                             University of Edinburgh, Edinburgh, United Kingdom

                                             Mass coral bleaching events during the last 20 years have caused major concern over
                                             the future of coral reefs worldwide. Despite damage to key ecosystem engineers, little
                                             is known about bleaching frequency prior to 1979 when regular modern systematic
                            Edited by:       scientific observations began on the Great Barrier Reef (GBR). To understand the
                    Stefano Goffredo,
                                             longer-term relevance of current bleaching trajectories, the likelihood of future coral
Università degli Studi di Bologna, Italy
                                             acclimatization and adaptation, and thus persistence of corals, records, and drivers of
                       Reviewed by:
                    Susana Enríquez,         natural pre-industrial bleaching frequency and prevalence are needed. Here, we use
  Universidad Nacional Autónoma de           linear extensions from 44 overlapping GBR coral cores to extend the observational
                     México, Mexico
                  Gabriel Grimsditch,        bleaching record by reconstructing temperature-induced bleaching patterns over 381
         United Nations Environment          years spanning 1620–2001. Porites spp. corals exhibited variable bleaching patterns with
          Programme (Kenya), Kenya
                                             bleaching frequency (number of bleaching years per decade) increasing (1620–1753),
                     Douglas Fenner,
            NOAA NMFS Contractor,            decreasing (1754–1820), and increasing (1821–2001) again. Bleaching prevalence (the
                        United States        proportion of cores exhibiting bleaching) fell (1670–1774) before increasing by 10%
                   Colleen A. Burge,
    University of Maryland, Baltimore        since the late 1790s concurrent with positive temperature anomalies, placing recently
                County, United States        observed increases in GBR coral bleaching into a wider context. Spatial inconsistency
                   Daniel J. Thornhill,
                                             along with historically diverging patterns of bleaching frequency and prevalence provide
  National Science Foundation (NSF),
                        United States        queries over the capacity for holobiont (the coral host, the symbiotic microalgae
                 *Correspondence:            and associated microorganisms) acclimatization and adaptation via bleaching, but
                Nicholas A. Kamenos          reconstructed increases in bleaching frequency and prevalence, may suggest coral
        nick.kamenos@glasgow.ac.uk
                                             populations are reaching an upper bleaching threshold, a “tipping point” beyond which
                   Specialty section:        coral survival is uncertain.
         This article was submitted to
                                             Keywords: coral, bleaching, adaptation, acclimatization, Symbiodinium, growth
                 Coral Reef Research,
               a section of the journal
          Frontiers in Marine Science
                                             INTRODUCTION
             Received: 25 July 2017
            Accepted: 25 July 2018           Mass coral bleaching events during the last 20 years have caused major concern over the future of
          Published: 15 August 2018
                                             coral reefs worldwide (Hughes et al., 2017). Despite these mass bleachings, little is known about
                            Citation:        bleaching frequency prior to 1979 when regular modern systematic scientific observations on the
 Kamenos NA and Hennige SJ (2018)
                                             Great Barrier Reef (GBR, Figure 1) began. The underlying mechanisms of contemporary coral
    Reconstructing Four Centuries of
Temperature-Induced Coral Bleaching
                                             bleaching are known to cause a breakdown of the coral-algae symbiosis (Glynn, 1991; Hoegh-
            on the Great Barrier Reef.       Guldberg, 1999), but the contribution of specific mechanisms are still debated (Weis, 2008).
               Front. Mar. Sci. 5:283.       Stressors such as thermal increases/decreases, irradiance extremes, disease and freshwater runoff,
     doi: 10.3389/fmars.2018.00283           along with their combined effects, can cause coral bleaching with an associated reduction in coral

Frontiers in Marine Science | www.frontiersin.org                                 1                                             August 2018 | Volume 5 | Article 283
Kamenos and Hennige                                                                                                                         Centennial GBR Bleaching

 FIGURE 1 | Sea surface temperature (SST) chart of Australia (A) and location of coral cores from Great Barrier Reef (GBR) (B). Dot shading indicates locations where
 coral cores bleached (white dot)/did not bleach (blue dot) in synchrony with either ENSO, PDO or SOI extremes over a 503 (ENSO, PDO) or 138 (SOI) year period
 depending on core length. Rib and Kelso reefs denoted by * and + respectively. Constructed using Ocean Data View. Core locations detailed in Table SM1. Overlaid
 Sea Surface Temperature (Celsius) at 4 km resolution from Aqua MODIS 11 µ Daytime 2016 annual composite (NASA Goddard Space Flight Center Ocean Biology
 Processing Group, 2017). Overlaid annual composite is indicative to show the presence of a thermal gradient across the GBR.

growth (Hendy et al., 2003; Fabricius, 2005; Wiedenmann et al.,                          Advances in reconstructing bleaching beyond the
2013). However, warm sea surface temperatures (SSTs), such as                         observational record have highlighted that there may have
those driven by El Niño Southern Oscillation are often correlated                     been at least 2 mass bleaching events since the last glacial
with mass bleaching (Clark et al., 2014) and have been well                           maximum which occurred ∼20 kyr BP and prior to the
documented in conjunction with major widespread bleaching                             industrial revolution (Dishon et al., 2015). Additionally, coral
events in 1998 and 2002 (Cantin and Lough, 2014). The relevance                       deaths during 1865-1979 in the South China Sea may have been
of temperature is such that, using spatial thermal histories, coral                   caused by El Niño-associated warming (Yu et al., 2006, 2012),
reefs at risk of bleaching can now be forecast (Liu et al., 2006;                     and also, death of branching Acropora sp. on the GBR over
Logan et al., 2014; NOAA, 2018). Forecasting of these events                          the last century has increased (Clark et al., 2017). However, as
by NOAA Coral Reef Watch (NOAA’s monitoring for coral reef                            studies reconstruct past coral mortality, it is still not possible
ecosystems) is set to become more advanced with the inclusion                         to accurately assess if corals will survive in the warmer oceans
of other key factors such as light stress through the Light Stress                    projected for the end of the century (Hoegh-Guldberg, 1999;
Damage (LSD) product suite, which accounts for rapid changes                          Hoegh-Guldberg et al., 2007; Van Hooidonk et al., 2013; Bay
in light availability (e.g., going from cloudy to clear days in                       et al., 2017) as we do not understand their ability to bleach
conjunction with rising temperatures) and the acclimatization                         and survive over centennial time scales through generational-
time of the coral to such changes (Skirving et al. 2018). As                          scale acclimatization and adaptation processes. Bleaching
the photoacclimatory response of the Symbiodinium is integral                         reconstructions have also been attempted from cores using
to the holobiont (the coral host, the symbiotic microalgae and                        carbon and oxygen isotopes (Heikoop et al., 2000; Suzuki et al.,
associated microorganisms; Rosenberg et al., 2007; Mieog et al.,                      2003; Hetzinger et al., 2016) as well as Sr/Ca ratios (Marshall
2009) and susceptibility to thermal stress (Bay et al., 2017;                         and Mcculloch, 2002), however, the balance between kinetic
Scheufen et al., 2017; Skirving et al., 2018), further research and                   (e.g., simultaneous depletion/enrichment of two isotopes due to
modeling of the interplay between temperature and light stress,                       non-bleaching drivers), metabolic and environmental factors or
and how this leads to bleaching is crucial. While bleaching events                    the influence of stress on carbonate mineralogy complicates the
may include bleaching leading to mortality, sub-lethal bleaching,                     use of these as proxies.
where the coral bleaches but recovers, may act as a “safety valve”                       At present, observational records of coral bleaching extend
allowing coral hosts to survive briefer periods of thermal stress                     back a few decades, and while these data have been valuable,
in warmer waters (Suggett and Smith, 2011) providing a possible                       they only provide us with a short time window within which
mechanism for coral hologenome acclimatization and adaptation                         to place recent rapid bleaching increases (Bellwood et al.,
(Kenkel and Matz, 2016). Additionally, there is evidence that                         2004) into a longer temporal context. Thus, to understand
thermal acclimation by corals can occur with minimal symbiont                         corals’ ability to bleach and survive over centennial time scales,
clade replacement (Palumbi et al., 2014).                                             continuous historic records of widespread coral bleaching at

Frontiers in Marine Science | www.frontiersin.org                                 2                                               August 2018 | Volume 5 | Article 283
Kamenos and Hennige                                                                                                        Centennial GBR Bleaching

centennial time scales are needed. The use of coral cores                    such as river runoff, high turbidity, or changes in nutrients
in assessing biogeochemical markers of past environmental                    (Hendy et al., 2003; Fabricius, 2005; Wiedenmann et al., 2013)
conditions (Chalker et al., 1985; Lough and Barnes, 2000;                    so comparisons are conducted both on individual cores and GBR
Mcculloch et al., 2003; Crueger et al., 2009; Lough, 2011; Zinke             wide. Sampling followed the workflow summarized in Figure 2
et al., 2014a,b; Tierney et al., 2015), contemporary biological              and detailed here.
events (De’ath et al., 2009; Cantin and Lough, 2014) and growth                 Coral growth: Porites spp. annual extension length from the
rates (Carilli et al., 2010b, 2012; Carricart-Ganivet et al., 2012;          GBR were obtained from The Great Barrier Reef Coral Growth
Hetzinger et al., 2016; D’Olivo and Mcculloch, 2017) are well                Database (Pages WDCA., 2015) with submissions by Chalker
documented and provide a mechanism to reconstruct historic                   et al. (1985), Lough and Barnes (1997, 2000), and De’ath et al.
GBR bleaching. Skeletal linear extension rates in coral cores can            (2009). Fifty-nine coral cores were initially assessed with 44
be affected by various localized and widespread stressors, such as           coral cores finally used (see below), covering the period 1572–
river runoff, high turbidity, changes in nutrients and in particular         2001 with the individual cores ranging from 32 to 416 years
temperature-induced bleaching (Goreau and Macfarlane, 1990;                  in length. Only coral core linear extension data were used with
Leder et al., 1991; Lough and Barnes, 2000; Hendy et al., 2003;              no interpolation of data between sites where coral cores were
Fabricius, 2005; Carilli et al., 2012; Carricart-Ganivet et al., 2012;       unavailable.
Wiedenmann et al., 2013; Cantin and Lough, 2014; Hetzinger
et al., 2016; D’Olivo and Mcculloch, 2017). We reconstruct                   Bleaching Threshold, Degree Heating
centennial-scale bleaching frequency and prevalence using                    Months and Environmental Data
changes in linear extension to consider recent bleaching trends in           Site specific monthly SSTs were calculated for each coral using
an environmentally relevant context, through comparison of pre-              NOAA extended reconstructed SST (ERSST) from ship and
and post-industrialisation (late 1800s) bleaching during a period            buoy data (1854–2013) (Smith et al., 2008). ERSST data were
of rapid environmental change (IPCC, 2013). To identify the                  from different dataset cells for offshore and inshore reefs [e.g.,
reductions in linear extension rate that correspond to potential             Abraham (152E 22S) vs. N Molle Is (150E 20S)]. Degree heating
temperate-induced bleaching events over the past four centuries,             months (DHM, ◦ C month−1 Donner et al., 2005) experienced
we use multiple selection criteria; (1) we set minimum linear                by each coral, and the bleaching threshold (Glynn and D’croz,
extension change “thresholds” by calibrating changes in coral                1990) were calculated following Donner et al. (2005) where a
linear extension rates to observational temperature records,                 DHM is equal to 1 month of SST that is 1◦ C above the maximum
(2) we assessed cores over large spatial regions, and (3) we                 mean monthly (MMM) for that grid cell. A DHM of 1◦ C is
imposed a “bleaching event” threshold, where we only identify                equivalent to a degree heating week (DHW) of 4◦ C, at which
a bleaching event as one where a certain number of coral                     a lower intensity bleaching threshold is reached (Donner et al.,
cores met all threshold conditions. Through such an approach,                2005). DHWs, as a measure of accumulated heat stress have been
potential impacts of localized events become secondary to larger,            significant proven indicators of bleaching (Eakin et al., 2010),
reef-scale environmental processes. This temperature-induced                 while on their own DHWs do not predict the severity of bleaching
bleaching reconstruction does not indicate a severity of bleaching           exhibited by individual coral colonies.
in individual coral colonies, and is reliant upon a bleaching event
being severe enough to reduce coral growth past a calibrated                 Bleaching and Coral Extension
threshold. Consequently, mild and isolated bleaching events are              Corals have distinct annual growth bands (Knutson et al., 1972)
not reconstructed, and bleaching events severe enough to cause               visible in X-rays; in massive Porites spp. bleaching events cause a
mortality would not be recorded, as coral cores used here were               reduction in annual extension length (Carilli et al., 2012; Cantin
alive at time of collection.                                                 and Lough, 2014). Coral skeletons are thus capable of providing
                                                                             a history of bleaching events assuming the absolute age of the
                                                                             coral is known, there are accompanying environmental data,
METHODS                                                                      and multiple corals/sites are used (Cantin and Lough, 2014). In
                                                                             addition, as massive coral species (e.g., Porites spp.) are more
To infer and quantify the frequency and prevalence of bleaching              resilient to bleaching (Marshall and Baird, 2000; Loya et al.,
events 1575–2001, we use historical changes in linear extension              2001), they are more likely to have survived historic bleaching
rates indicative of bleaching (Carilli et al., 2012; Cantin and              events while recording evidence of them in their skeletons. As
Lough, 2014; Hetzinger et al., 2016; D’Olivo and Mcculloch,                  a consequence of this, bleaching reconstruction based upon
2017) from GBR (Figure 1) Porites spp. coral cores [as per Veron             massive Porites spp. will be conservative relative to the bleaching
(2000) may include Porites lobata, Porites australiensis, Porites            that may have been evident in other coral species.
lutea, Porites evermanni, Porites solida, Porites myrmidonensis,
Porites mayeri]. Cores used in this study were previously used               Calibration of Years Indicative of Bleaching
to identify decreases in calcification on the GBR (De’ath et al.,            This was conducted over the period of coral growth that
2009), as seawater temperature proxies (Lough and Barnes, 1997,              coincided with 1854–2001, the length of the ERSST data. For each
2000) and for past environmental interrogation (Chalker et al.,              Porites spp. core individually, extension length in years where a
1985). It is important to note that skeletal linear extension rates          site-specific DHM ≥1◦ C month−1 was experienced by the coral
in individual cores can be affected by various localized effects,            was used as the extension length attainable during a bleaching

Frontiers in Marine Science | www.frontiersin.org                        3                                        August 2018 | Volume 5 | Article 283
Kamenos and Hennige Centennial GBR Bleaching
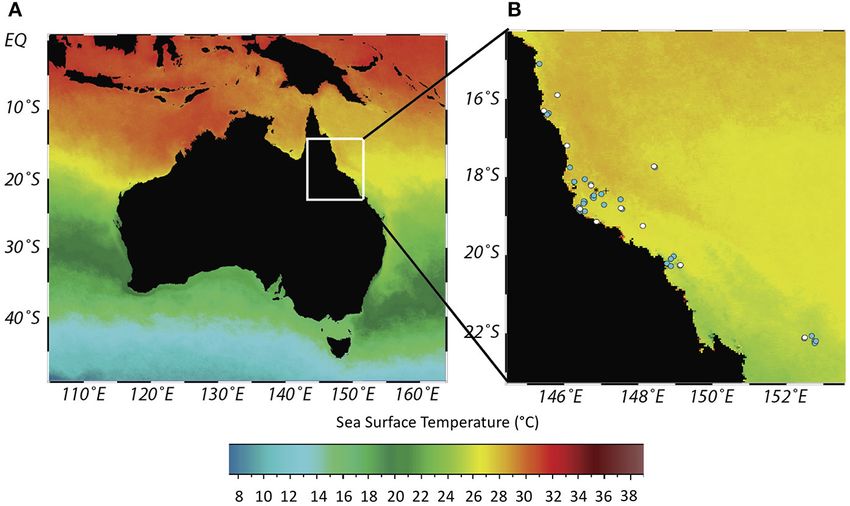
FIGURE 2 | Methodology workflow. Coral linear extension obtained from databases as detailed in methods. The upper gray box illustrates reconstructed bleaching
calibration process using ERSST data, DHM (◦ C) indicates degree heating months. The lower blue box illustrates reconstruction of bleaching.
year by that specific coral. In most cases, corals experienced thresholds and then bleaching threshold was compared with
2–5 such years over the calibration period. In those cases, the ERSST.
minimum growth rate attained in any of the DHM ≥1◦ C years 2) Over the calibration period, years were assigned as possible
◦
was used as the threshold extension attainable during a bleaching bleaching years when DHM ≥1 C.
year. Critically, coral extension rates attained during DHM ≥1◦ C 3) Before the calibration period when no ERSST data are
years were lower than those during DHMKamenos and Hennige Centennial GBR Bleaching
influence of growth anomalies associated with partial coral between SST and reconstructed bleaching. In addition, bleaching
mortality. Our reconstruction is unlikely to be influenced was compared to reconstructed Southern hemisphere surface
by GBR sea level changes over the last 4 centuries as GBR temperature (Mann et al., 2008) which were generated using
sea levels have been constant for the past 6000 years and “composite plus scale” methodology using corals, marine and
even average increases of 1.2 mm yr−1 since 1959 around lacustrine series, tree-rings, speleothems, ice core, and historical
Townsville are within the 3 mm yr−1 corals can accommodate documentary series. While this reconstruction is hemispheric,
without influences on reef growth (GBRMPA, 2018). including terrestrial proxies, it is the longest reconstruction
available and provides a contextual trend. It should be noted that
Widespread Coral Bleaching Threshold the reconstruction also included coral extension rates so is thus
Here, we only considered bleaching events that were evidenced not fully independent of our reconstruction, we therefore do
in ≥20% of corals bleaching in any individual year across all not compare the two statistically. Similarly, as we use ERSST to
cores assessed. This was to (1) ensure spatiotemporally isolated reconstruct bleaching, we do not compare bleaching and ERSST
bleaching events in particular cores did not overinflate decadal statistically.
bleaching frequency/prevalence (e.g., one bleaching event in each
of 10 years with each in a different core) and (2) to remove the Years With Larger Than Average Bleaching
weight of spatially restricted bleaching (e.g., from flood plumes, Prevalence
or from cores experiencing high light stress in relation to other We compared reconstructed bleaching prevalence (at annual
cores from the same region) not affecting the whole GBR. While resolution) to the observational bleaching record for the GBR
at present, there is not an agreed prevalence “threshold” to define between 1979 and 2001 (the overlap period between the two
a widespread bleaching event, we chose 20%, as 21% is the lowest records). Most GBR observational data available post 1982 have
threshold that was classified as a widespread bleaching event on a wide GBR spatial coverage (Oliver et al., 2009) however, as
the GBR (during 1997/8) (AIMS, 2014). observational data are for all coral species and not effort adjusted
this comparison demonstrates which year shows the highest
Proxy Validation: Comparison of percentage bleaching in both datasets but is not correlative. When
Reconstructed Bleaching With Other 7 or more coral cores were present, there was no effect of coral
Records number on the percentage of corals showing bleaching at annual
Observational percentage bleaching time series for only Porites resolution, so only the period 1979–2000 was considered [Linear
spp. corals are not available for large spatial areas of the GBR, model: F (2, 19) = 2.458, p = 0.112].
thus preventing direct comparison of reconstructed and observed
bleaching over long time scales. To validate our bleaching proxy Comparison With Other Porites spp. Reconstructed
we used 3 approaches: Bleaching Datasets
We compared evidence of bleaching (bleaching
Comparison of Reconstructed Bleaching With presence/absence) during the 1998 mass bleaching event in
Reconstructed SST our reconstructed bleaching record with independent bleaching
Our bleaching reconstruction was compared to a SST evidence generated from coral extension records from Rib and
reconstruction for the western Pacific (Tierney et al., 2015) Kelso Reef short cores (Cantin and Lough, 2014).
which included the GBR. The SST reconstruction is generated
from coral cores, with only one site (Abraham reef) providing GBR-Wide Bleaching Patterns
SST on the GBR (using a different core to this study); the While other variables are known to reduce growth/cause
majority of data come from further north in the western bleaching (e.g., disease, competition, flood plumes), temperature
◦ ◦ ◦
Pacific region which covers 25 N−25 S, 110–155 E. Data is the most common trigger that induces sudden, widespread,
provided by the GBR core are SST derived from δ18 O and bleaching events across the whole GBR (Hoegh-Guldberg, 1999).
not growth band inferred temperature, thus making our All of these variables, which may act as “multiple stressors”
bleaching reconstruction independent of the SST reconstruction. involved in bleaching events will vary spatially and temporally
We correlated reconstructed SST (Tierney et al., 2015) and (Berkelmans et al., 2004). To ensure any patterns we observed
reconstructed bleaching prevalence (defined below) in 10 yr bins were driven by thermal bleaching; (1) we averaged across all
(to allow for the influence of non-thermal bleaching) between corals spanning the whole GBR so spatial and temporal variability
1700 and 1980, the time scale over which 3 cores or more were in bleaching forcing was minimized next to the potentially larger
available and thus core number did does not drive bleaching impact of temperature perturbations. (2) We introduced a 20%
(for this validation, logistic regression was conducted on the threshold (see above) where we consider environmentally-driven
bleaching and core number time series by pooling all GBR corals; bleaching events as occurring in a meaningful proportion of
Carilli et al., 2010a). The reconstructed SST record (Tierney et al., corals across the GBR, rather than isolated individuals in different
2015) only included SST from years during which environmental locations. (3) We decadally binned reconstructed bleaching
temperature was the unambiguous driver of growth in the frequency and prevalence to allow for missed growth years
sample corals; this meant errors in δ18 O -temperature driven and growth band misidentification in the coral cores. This
by bleaching of those corals (Rodrigues and Grottoli, 2006) is because individual corals may bleach for varying reasons
were not included in their record avoiding non-independence (e.g., disease, genotypic susceptibility, flood plumes) and not
Frontiers in Marine Science | www.frontiersin.org 5 August 2018 | Volume 5 | Article 283Kamenos and Hennige Centennial GBR Bleaching
represent wider, environmentally-driven bleaching. Thus, any bleaching time series (time as random variable) was driven
growth irregularities or sampling bias in individual cores will by three large scale climatic processes: (1) El Niño Southern
have little influence on regional scale, decadal observations. Our Oscillation (ENSO) (Li et al., 2011) (up to 503 years depending
approach meets the criteria suggested by Cantin and Lough on core length), (2) Pacific Decadal Oscillation (PDO) (Mann
(2014). In this context the degree of GBR wide bleaching is et al., 2009) (up to 503 years depending on core length), and
demonstrated by the bleaching prevalence statistic (% of corals (3) Southern Oscillation Index (SOI) (Können et al., 1998) (up
bleached); this gives an indication of the % corals bleached on to 138 years depending on core length). All climatic index data
the GBR but clumping of those locations may be present due the were obtained from the NOAA National Climatic Data Center
location of available cores in any decade. (https://www.ncdc.noaa.gov).
For this approach, individual coral bleaching histories were
Bleaching Frequency and Prevalence used as coral locations covered the whole GBR (Figure 1,
The percentage of corals whose extension length indicated Table SM1) which has a spatial thermal gradient (De’ath et al.,
possible bleaching were determined. Percentages were not 2009), so spatial responses may vary. Additionally, temperature
weighted for the number of corals available as this would alone was not compared to bleaching in individual coral colonies
artificially inflate possible bleaching prevalence. Rather, (1) only as site-specific annual resolution coral bleaching may be driven
years with bleaching above the 20% threshold were considered by factors other than temperature, e.g., flood plumes which vary
and (2) decades with less than two cores (for frequency analysis) spatially (Berkelmans et al., 2004), or changes in light intensity
or three cores (for prevalence analysis) were not considered in (Scheufen et al., 2017) through spatiotemporal changes in cloud
subsequent analyses. cover or water turbidity. Large scale climatic processes integrate
such variables along with temperature and allow for a more
Frequency robust assessment of the drivers of historic coral bleaching.
Within each 10-year bin, the number of years in which at least
20% of the corals showed evidence of possible bleaching were Statistical Analysis
calculated. All analyses were conducted in Rv3.1 (RRCT., 2014) using R
Studio (Rstudio, 2014). Segmented analysis was conducted using
Prevalence
the Segmented package (Muggeo, 2008) and generalized linear
The percentage of coral growth bands that showed evidence of
mixed models with the lme4 package (Bates et al., 2014).
bleaching within each 10-year bin were calculated (excluding
those that demonstrated slow recovery post individual bleaching
events). Only those above the 20% bleaching threshold were RESULTS
considered.
Validation of Bleaching Reconstruction
Determining the Influence of Core Numbers on Reconstructed bleaching shows decadal correlation (r = 0.621,
Frequency and Prevalence Time Series p < 0.001) with reconstructed SST for the western Pacific
To determine if the number of cores available drove the (Figure 3). Both our reconstructed and the observational GBR
reconstructed bleaching frequency and prevalence patterns, bleaching records show maximum bleaching during 1998 across
logistic regression was conducted on the bleaching and core the whole GBR (Figure 3B). In addition, at the individual reef
number time series by pooling all GBR corals. The number of scale (Rib and Kelso Reefs) both our and the Cantin and Lough
cores were not significant in driving the observed patterns when (2014) bleaching reconstruction show no bleaching during 1998
greater than two cores (for decadal frequency analysis) or three despite overall widespread GBR bleaching.
cores (for decadal prevalence analysis) were available (frequency:
Z2 (df), 39 (total df) = −0.77, p = 0.442, prevalence: Z2, 37 = −1.26, GBR-Wide Bleaching Patterns
p = 0.205). Thus, when considering changes in bleaching, only Reconstructed bleaching was evident through the entire available
years were used where at least two cores (for frequency) or three record from 1575 to 2001. To determine any GBR-wide bleaching
cores (for prevalence) were available. patterns, corals were pooled from all regions in the GBR spanning
15.13 to 22.23◦ S. Quantitative assessments of bleaching were
Detecting Changes in Bleaching Over Time conducted between 1620 and 2001 for frequency and 1640–
Changes in bleaching trajectories (breakpoints) were used to 2001 for prevalence. Outside of these periods, while we have
detect the timing of changes in bleaching frequency (1620– documented historic bleaching, it is possible that the number of
2001) and prevalence (1640–2001) only during time periods cores available drove the patterns observed.
over which at least two cores (for frequency) or three cores Reconstructed bleaching frequency demonstrated three
(for prevalence) were available. Breakpoints were detected using trends; (1) frequency increased from 1620 to 1753 ± 31 (years)
segmented regression as bleaching patterns were not constant reaching up to 6 years of each decade showing evidence of
temporally. bleaching in at least 20% of coral cores. (2) Bleaching frequency
decreased to 1820 ± 31 when only 1 year of every decade
Site-Specific Bleaching Patterns had evidence of bleaching in at least 20% of coral cores. (3)
We used generalized linear mixed models fit with Laplace Bleaching frequency increased again from 1820 ± 31 to 2001.
approximation to determine if each coral’s annually resolved The 1890 and 1750 decades were notable for unusually high
Frontiers in Marine Science | www.frontiersin.org 6 August 2018 | Volume 5 | Article 283Kamenos and Hennige Centennial GBR Bleaching FIGURE 3 | Reconstructed bleaching compared to other records. (A) Bleaching prevalence—temperature responses; decadally binned Great Barrier Reef (GBR) reconstructed bleaching prevalence responses to reconstructed western Pacific (Tierney et al., 2015) sea surface temperature (SST) between 1700 and 1989 (correlation: r = 0.621, p < 0.001). (B) Annual coral bleaching rates on the GBR since 1979; (Bi) Number of observed coral bleaching events (Wilkinson, 2006). These data also include non-Porites sp. so will overestimate Porites spp. bleaching. (Bii) GBR reconstructed Porites spp. bleaching prevalence (%, bars) and number of coral cores used (line). Where the growth effects of a single bleaching event lasted several successive years, this was classified as a single bleaching event of individual corals. bleaching frequencies (Figure 4B, Table SM2). In contrast to Site-Specific Bleaching Patterns bleaching frequency, bleaching prevalence only demonstrated There were no consistent annually resolved site-specific two trends; (1) a negative trend from 1640 – 1774 ± 78, differences in reconstructed bleaching in response to large scale with prevalence falling from 41 to 21%. 2) An increase in climatic patterns (ENSO, PDO, and SOI) between or within bleaching prevalence from 21% in 1774 ± 78 to 31 % in 2001 different locations on the GBR (Figure 1B, Table SM1) over (Figure 4C, Table SM2). 138–503 year long periods (depending on core length). Only 12 Frontiers in Marine Science | www.frontiersin.org 7 August 2018 | Volume 5 | Article 283
Kamenos and Hennige Centennial GBR Bleaching
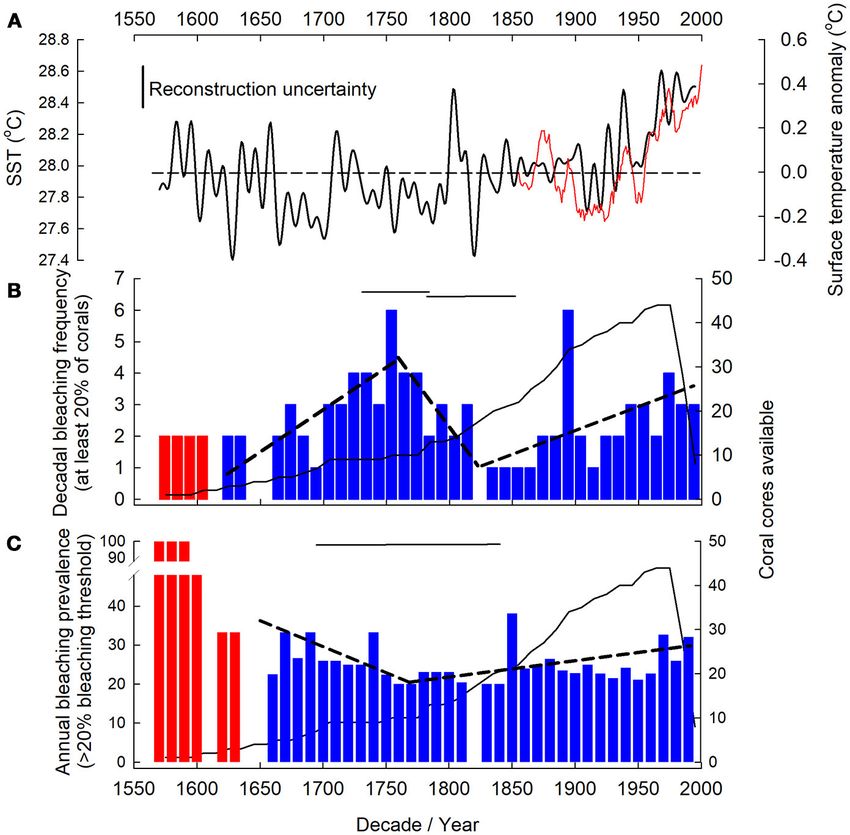
FIGURE 4 | Massive Porites spp. bleaching frequency and prevalence. NOAA extended sea surface temperature (SST) for Great Barrier Reef (GBR) (A) from ship and
buoy data (1854–2000, 11 yr moving average, red line) (Smith et al., 2008). Southern hemisphere surface temperature anomaly (ocean and land) reconstruction (Mann
et al., 2008) (solid line) with the uncertainty (0.23◦ C) on the reconstruction indicated (the reconstruction includes coral extension rates so is not fully independent of our
reconstruction). Dashed line indicates mean temperature over record length (1570–1995). Bleaching frequency (B) (number of years per decadal bin in which
bleaching occurred) and prevalence (C) (% of corals bleached per decade) observed in at least 20% of coral for the GBR denoted by blue bars. Red color bars
indicate years in which less than 2 (frequency)/3 (prevalence) coral cores were available; those years were excluded from further analysis (see
Supplementary Material). Number of coral cores available in each decade indicated by solid black line. Dashed black line indicates breakpoint determined linear
trend in bleaching and horizontal solid black lines represent breakpoint location 95%CI. For (B) decade notation marks the start of the bin for frequency and each
coral core (n = 44) contributed up to 10 annual growth extensions per decadal bin.
of 44 coral cores showed evidence of bleaching in synchrony with not incurred, and no correlation would be present. Both our
large scale climatic processes. Bleaching was synchronous with reconstructed and the observational GBR bleaching records
ENSO extremes in six corals (Snapper core 01A, Normanby 01B, show maximum bleaching during 1998 across the whole GBR
Britomart 01B, Pandora 04A, Wheeler 01A, Stanley 01A), PDO (Figure 3) although this is not scaled for observational effort. In
extremes in six corals (Agincourt 01B, Britomart 01B, Pandora addition, at the individual reef scale (Rib and Kelso Reefs) both
04A, Lupton Island 01A, Lupton Island 01C, Abraham 01H) our and the Cantin and Lough (2014) bleaching reconstruction
and SOI extremes in five corals (Findlers 01A, Pandora 04A, show no bleaching during 1998 despite overall widespread GBR
Magnetic Island 01D, Stanley 01A, Abraham 01H). bleaching. These similarities of our bleaching reconstruction to
the observational bleaching record and local reef responses at
DISCUSSION different spatial scales further validate our approach to bleaching
reconstruction.
At higher SSTs, we show increased bleaching prevalence across There are some individual years during which reconstructed
the GBR; this is the expected response and indicates a consistent bleaching does not match the observational record. These
reconstructed bleaching pattern of massive Porites spp. corals differences may be due to (1) massive Porites spp. being less
to warming between 1770 and 1989. Significantly, if SST was susceptible to bleaching than other coral species (Marshall and
not causing bleaching, growth would be higher in warmer Baird, 2000) causing differences in bleaching presence/intensity
years (Lough and Barnes, 2000) as long as heat-stress was between the observed (all coral sp.) and our reconstructed record.
Frontiers in Marine Science | www.frontiersin.org 8 August 2018 | Volume 5 | Article 283Kamenos and Hennige Centennial GBR Bleaching
(2) The observational bleaching records may be related to lethal of relative temperature stability compared to present times.
beaching, and where not, subjective determination of bleached The increase in bleaching frequency and prevalence post 1850,
and non-bleached state may influence reported bleaching where temperatures were on average increasing, may indicate
prevalence in observational records. Conversely, reconstructed that corals are coming closer to the uppermost limit of their
bleaching is quantitative and focuses on non-lethal bleaching thermal acclimatization and adaptive capacity. Although the
likely explaining some annual scale differences. (3) Microclimatic coral holobiont can acclimatize to bleaching stressors over time
influences and light stress (see below). (4) Local adaptation in (Grottoli et al., 2014; Palumbi et al., 2014; Kenkel and Matz, 2016;
individual corals (Kenkel and Matz, 2016). (5) The observational Bay et al., 2017), multiple or chronic stressors can effect holobiont
record not being scaled for observational effort. fitness and bleaching resilience (Carilli et al., 2009; Grottoli
There is evidence of GBR bleaching since at least 1575 et al., 2014). This may be why bleaching prevalence has been
(Figures 4B,C). As all the corals were cored whilst live, this exacerbated in recent times due to additional human induced
bleaching does not represent lethal bleaching events, but rather stressors (Carilli et al., 2010b) overlaying the average increase
sub-lethal bleaching with a measurable decrease in growth before in temperature (Figure 4A) [although widespread stressors can
recovery. With reconstructed bleaching occurring in more than still cause significant bleaching (e.g., temperature and light
20% of corals this bleaching represents widespread bleaching alone and synchrony)]. Given the combined rise in bleaching
across the GBR, and since 1774 ± 78, the prevalence of those frequency and prevalence documented here, the potential for
bleaching events has increased by 10%. This is concomitant with future acclimatization and adaptation of the coral holobiont,
a trend for positive hemispheric temperature anomalies since the through plasticity (Kenkel and Matz, 2016), host acclimatization
late 1700s (Figure 4A), more pronounced GBR SST increases (Palumbi et al., 2014), changes in symbiont community or
since the late 1800s (Smith et al., 2008), along with wider southern symbiont evolution over relatively rapid timescales is uncertain.
hemisphere marine and terrestrial surface temperatures increases At slower rates of change there may, however, be scope for heat
(Mann et al., 2008; IPCC, 2013; Tierney et al., 2015). Here we tolerance via rapid evolution (Bay et al., 2017).
observed a 10% increase in bleaching prevalence since the mid However, within the general trend of increased bleaching
1700s, while other studies show more significant increases since prevalence from 1770s to 2001, there are still periods of
the 1980s (Bellwood et al., 2004). We attribute this difference low prevalence and frequency, e.g., from the 1820 to 1830s.
to our bleaching reconstruction being intrinsically conservative, This reduction follows an abrupt drop in 1820s temperature
through the use of massive Porites spp. corals that are robust (Figure 4A) suggesting that when stressors are low the reduced
to bleaching and have survived historic bleaching events, using stress leads to reduced bleaching or the potential for a temporary
a centennial-length (as opposed to previous decades) bleaching increase in coral fitness and bleaching resilience through a break
baseline to place recent bleaching into context, and because we from chronic stress (Carilli et al., 2009), possibly driven by
impose a 20% minimum bleaching threshold when attributing holobiont plasticity (Kenkel and Matz, 2016).
bleaching years. In addition, this 10% increase is unlikely to be Absence of consistent bleaching patterns in response to large
attributed to sea level rise as sea levels were stable on the GBR scale climatic processes (ENSO, PDO and SOI) highlights that
until the mid-1950s (GBRMPA, 2018). (1) their role on GBR bleaching may be localized via the specific
Bleaching frequency and prevalence did not consistently nature of the stressor they generate (e.g., runoff), (2) other
show the same trends (Figure 4); for example, the reduction in processes, e.g., water runoff impacting particular corals (Hendy
bleaching prevalence but variable bleaching frequency (increase et al., 2003; Clark et al., 2014), light stress variability (Scheufen
and subsequent decrease) during the period 1620–1750s, when et al., 2017) through water runoff (turbidity) or cloud cover,
average temperatures were not increasing (Figure 4A), suggests and local adaptation to environmental variability (Kenkel and
a possible adaptive and/or acclimatory change in the coral Matz, 2016) may also influence bleaching at local scales (West
holobiont through changes to the dominant symbiont type, and Salm, 2003) and 3) similarly to 2), SSTs during bleaching
potential evolution of the algal symbiont itself over subsequent can be patchy even if driven by large scale climatic processes.
generations (Lajeunesse, 2005), or through host plasticity This suggests that while large-scale climatic patterns may drive
(Bellantuono et al., 2012). Acclimatization of the host, through bleaching at large spatial scales (GBR wide) depending on
changes in their associated symbionts and microbes, may lead the stressor they produce, this may be modulated by corals
to a period of reduced bleaching prevalence until changes in responding to their localized environment or weather (Hughes
environmental conditions once again push the host closer to et al., 2017) with additional potential variability between genetic
its acclimatory capacity. Although mechanisms for past coral individuals, and spatial hologenome variation within individuals.
holobiont adaptation remain unknown, they could account for In those instances, multiple cores taken from a single colony (top
decreased bleaching prevalence observed here, and remain a key and side of individuals Lough et al., 1999) may have different
area for future research given the importance of this question extension rates driven by differences in light availability. As
with regard to present day bleaching events and trajectories. The it is known that the bleaching response is impacted through
presence of such adaptation mechanisms will remain important both light and thermal stress (Hennige et al., 2011; Coelho
processes for corals to keep pace with projected increased et al., 2017; Scheufen et al., 2017) it is reasonable to assume
warming (Logan et al., 2014). that multiple cores from within a single colony, taken from
While acclimatization may have occurred in the past leading shaded and well-lit regions may not provide the same bleaching
to reduced bleaching frequency, this occurred during a period response, although single cores are nearly always taken from the
Frontiers in Marine Science | www.frontiersin.org 9 August 2018 | Volume 5 | Article 283Kamenos and Hennige Centennial GBR Bleaching
top, well-lit, region of the colony so this should not affect our thus place recently observed increases in GBR coral bleaching
observations. into a wider temporal context; bleaching has been occurring on
The response of individual reefs or regions to thermal the GBR at least during the last 4 centuries, and has increased 10%
stress may also differ, as they could have been subjected to in prevalence since the 1790s. Over the coming century, rapid
varying degrees of light stress. Whilst new advances are being environmental change will include multiple-stressors (Hoegh-
made in combining light and thermal stress into new coral Guldberg et al., 2007; Hofmann and Schellnhuber, 2009; Bay
bleaching forecasting (Skirving et al., 2018), we currently cannot et al., 2017), and the increase in prevalence and frequency
reconstruct historic light stress or its synergistic effect with indicate that we may be coming to a tipping point beyond which
thermal stress. With new advances in forecasting algorithms survival in uncertain.
and further work into discerning the impact of thermal and
light stress (at varying degrees) on coral extension rates, future AUTHOR CONTRIBUTIONS
studies may be able to delineate the “temperature-induced coral
bleaching” presented here further. NK and SH conceived the study, conducted the analysis, and
Our reconstruction includes corals from inshore and offshore wrote the paper.
areas of the GBR. It is possible that inshore corals may have
experienced more exposure to terrestrial run-off than offshore FUNDING
corals dependent on their proximity to point runoff sources.
Large scale climatic processes (ENSO, PDO, SOI) are important Independent Research Fellowships were funded by NERC for NK
in driving both thermal and precipitation patterns, yet despite and SH (NE/H010025, NE/K009028/1 and NE/K009028/2) and
this, no consistent spatial patterns (inshore vs. offshore) were the Royal Society of Edinburgh/Scottish Government to NK (RSE
present over the timescale of our reconstruction (Figure 1B) as 48701/1).
discussed previously.
We have had a limited understanding of centennial scale ACKNOWLEDGMENTS
bleaching dynamics, time scales that are key for determining
the future survival of corals reefs in a changing world IGBP PAGES/WDCA, NOAA National Climate Data Centre,
via adaptive and acclimation processes. Here we show that NASA and ReefBase curated and provided data. Where
corals bleached pre-industrially, but subsequently, bleaching appropriate, sampling permits are acknowledged in the original
has intensified. Importantly, reconstructions here are based submissions and host database (cited in section Methods). We
on tolerant coral species and conservative threshold values, also thank Jessica Carilli, Sandy Tudhope, and Joanie Kleypas for
meaning that frequency and prevalence of bleaching experienced helpful suggestions.
by other species may have been higher. While the processes
of acclimatization and adaptation indicate that, given enough SUPPLEMENTARY MATERIAL
time, the coral holobiont may be able to adapt to new, higher
thermal levels (Bay et al., 2017), post 1850 increases in bleaching The Supplementary Material for this article can be found
frequency and prevalence suggest corals may struggle to survive online at: https://www.frontiersin.org/articles/10.3389/fmars.
in the future as conditions continue to rapidly change. Our results 2018.00283/full#supplementary-material
REFERENCES Cantin, N. E., and Lough, J. M. (2014). Surviving coral bleaching events:
porites growth anomalies on the Great Barrier Reef. PLoS ONE 9:e88720.
AIMS (2014). Coral Bleaching Events [Online]. Available online at: https://www. doi: 10.1371/journal.pone.0088720
aims.gov.au/docs/research/climate-change/coral-bleaching/bleaching-events. Carilli, J., Donner, S. D., and Hartmann, A. C. (2012). Historical temperature
html (Accessed June 1, 2014). variability affects coral response to heat stress. PLoS ONE 7:e34418.
Bates, D., Maechler, M., Bolker, B., and Walker, S. (2014). lme4: Linear Mixed- doi: 10.1371/journal.pone.0034418
Effects Models Using Eigen and S4. R Package Version 1.1-7. Available online Carilli, J., Godfrey, J., Norris, R. D., Sandin, S. A., and Smith, J. E. (2010a). Periodic
at: http://CRAN.R-project.org/package=lme4 endolithic algal blooms in Montastrea faveolata corals may represent periods of
Bay, R. A., Rose, N. H., Logan, C. A., and Palumbi, S. R. (2017). Genomic models low-level stress. Bull. Mar. Sci. 86, 709–708. Available online at: https://goo.gl/
predict successful coral adaptation if future ocean warming rates are reduced. kaHktH
Sci. Adv. 3: e1701413. doi: 10.1126/sciadv.1701413 Carilli, J. E., Norris, R. D., Black, B., Walsh, S. M., and Mcfield, M. (2010b).
Bellantuono, A. J., Hoegh-Guldberg, O., and Rodriguez-Lanetty, M. (2012). Century-scale records of coral growth rates indicate that local stressors
Resistance to thermal stress in corals without changes in symbiont reduce coral thermal tolerance threshold. Glob. Change Biol. 16, 1247–1257.
composition. Proc. R. Soc. B Biol. Sci. 279, 1100–1107. doi: 10.1098/rspb. doi: 10.1111/j.1365-2486.2009.02043.x
2011.1780 Carilli, J. E., Norris, R. D., Black, B. A., Walsh, S. M., and Mcfield, M. (2009).
Bellwood, D. R., Hughes, T. P., Folke, C., and Nyström, M. (2004). Confronting the Local stressors reduce coral resilience to bleaching. PLoS ONE 4:e6324.
coral reef crisis. Nature 429:827. doi: 10.1038/nature02691 doi: 10.1371/journal.pone.0006324
Berkelmans, R., De’ath, G., Kininmonth, S., and Skirving, W. J. (2004). A Carricart-Ganivet, J. P., Cabanillas-Terán, N., Cruz-Ortega, I., and
comparison of the 1998 and 2002 coral bleaching events of the Great Barrier Blanchon, P. (2012). Sensitivity of calcification to thermal stress varies
Reef: spatial correlation, patterns and predictions. Coral Reefs 23, 74–83. among genera of massive reef-building corals. PLoS ONE 7:e32859.
doi: 10.1007/s00338-003-0353-y doi: 10.1371/journal.pone.0032859
Frontiers in Marine Science | www.frontiersin.org 10 August 2018 | Volume 5 | Article 283Kamenos and Hennige Centennial GBR Bleaching Chalker, B., Barnes, D., and Isdale, P. (1985). Calibration of X-ray densitometry Niño-induced coral bleaching and regional stress events. Sci. Rep. 6:32879. for the measurement of coral skeletal density. Coral Reefs 4, 95–100. doi: 10.1038/srep32879 doi: 10.1007/BF00300867 Hoegh-Guldberg, O. (1999). Climate change, coral bleaching and the future of the Clark, T. R., Roff, G., Zhao, J. X., Feng, Y. X., Done, T. J., Mccook, L. J., et al. world’s coral reefs. Mar. Freshw. Res. 50, 839–866. doi: 10.1071/MF99078 (2017). U-Th dating reveals regional-scale decline of branching Acropora corals Hoegh-Guldberg, O., Mumby, P. J., Hooten, A. J., Steneck, R. S., Greenfield, P., on the great barrier reef over the past century. Proc. Natl. Acad. Sci. U.S.A. 114, Gomez, E., et al. (2007). Coral reefs under rapid climate change and ocean 10350–10355. doi: 10.1073/pnas.1705351114 acidification. Science 318, 1737–1742. doi: 10.1126/science.1152509 Clark, T. R., Zhao, J.-X., Roff, G., Feng, Y.-X., Done, T. J., Nothdurft, L. D., Hofmann, M., and Schellnhuber, H. J. (2009). Oceanic acidification affects marine et al. (2014). Discerning the timing and cause of historical mortality events carbon pump and triggers extended marine oxygen holes. Proc. Natl. Acad. Sci. in modern Porites from the great barrier reef. Geochim. Cosmochim. Acta 138, U.S.A. 106, 3017–3022. doi: 10.1073/pnas.0813384106 57–80. doi: 10.1016/j.gca.2014.04.022 Hughes, T. P., Kerry, J. T., Álvarez-Noriega, M., Álvarez-Romero, J. G., Anderson, Coelho, V., Fenner, D., Caruso, C., Bayles, B., Huang, Y., and Birkeland, C. (2017). K. D., Baird, A. H., et al. (2017). Global warming and recurrent mass bleaching Shading as a mitigation tool for coral bleaching in three common Indo-Pacific of corals. Nature 543, 373–377. doi: 10.1038/nature21707 species. J. Exp. Mar. Biol. Ecol. 497, 152–163. doi: 10.1016/j.jembe.2017.09.016 IPCC (2013). Climate Change 2013: The Physical Science Basis. Contribution of Crueger, T., Zinke, J., and Pfeiffer, M. (2009). Patterns of pacific decadal Working Group I to the Fifth Assessment Report of the Intergovernmental variability recorded by indian ocean corals. Int. J. Earth Sci. 98, 41–52. Panel on Climate Change, Cambridge: Cambridge University Press. doi: 10.1007/s00531-008-0324-1 Kenkel, C. D., and Matz, M. V. (2016). Gene expression plasticity as a mechanism De’ath, G., Lough, J. M., and Fabricius, K. E. (2009). Declining coral calcification of coral adaptation to a variable environment. Nat. Ecol. Evol. 1:0014. on the Great Barrier Reef. Science 323, 116–119. doi: 10.1126/science.1165283 doi: 10.1038/s41559-016-0014 Dishon, G., Fisch, J., Horn, I., Kaczmarek, K., Bijma, J., Gruber, D. F., et al. (2015). Knutson, D. W., Buddemeier, R. W., and Smith, S. V. (1972). Coral A novel paleo-bleaching proxy using boron isotopes and high-resolution laser chronometers: seasonal growth bands in reef corals. Science 177, 270–272. ablation to reconstruct coral bleaching events. Biogeosciences 12, 5677–5687. doi: 10.1126/science.177.4045.270 doi: 10.5194/bg-12-5677-2015 Können, G. P., Jones, P. D., Kaltofen, M. H., and Allan, R. J. (1998). D’Olivo, J. P., and Mcculloch, M. T. (2017). Response of coral calcification and Pre-1866 extensions of the southern oscillation index using early calcifying fluid composition to thermally induced bleaching stress. Sci. Rep. Indonesian and Tahitian meteorological readings. J. Clim. 11, 2325–2339. 7:2207. doi: 10.1038/s41598-017-02306-x doi: 10.1175/1520-0442(1998)0112.0.CO;2 Donner, S. D., Skirving, W. J., Little, C. M., Oppenheimer, M., and Hoegh- Lajeunesse, T. C. (2005). “Species” radiations of symbiotic dinoflagellates in the Guldberg, O. V. E. (2005). Global assessment of coral bleaching and required Atlantic and indo-pacific since the miocene-pliocene transition. Mol. Biol. Evol. rates of adaptation under climate change. Glob. Change Biol. 11, 2251–2265. 22, 1158–1158. doi: 10.1093/molbev/msi042 doi: 10.1111/j.1365-2486.2005.01073.x Leder, J. J., Szmant, A. M., and Swart, P. K. (1991). The effect of prolonged Eakin, C. M., Morgan, J. A., Heron, S. F., Smith, T. B., Liu, G., Alvarez-Filip, L., “bleaching” on skeletal banding and stable isotopic composition in Montastrea et al. (2010). Caribbean corals in crisis: record thermal stress, bleaching, and annularis. Coral Reefs 10, 19–27. mortality in 2005. PLoS ONE 5:e13969. doi: 10.1371/journal.pone.0013969 Li, J., Xie, S.-P., Cook, E. R., Huang, G., D’arrigo, R., Liu, F., et al. (2011). Fabricius, K. E. (2005). Effects of terrestrial runoff on the ecology of corals Interdecadal modulation of El Niño amplitude during the past millennium Nat. and coral reefs: review and synthesis. Mar. Pollut. Bull. 50, 125–146. Clim. Change 1, 114–118. doi: 10.1038/nclimate1086 doi: 10.1016/j.marpolbul.2004.11.028 Liu, G., Strong, A. E., Skirving, W. J., and Arzayus, L. F. (2006). “Overview of GBRMPA (2018). Impacts of Sea Level Rise on the [Great Barrier] Reef (Great NOAA coral reef watch program’s near-real-time satellite global coral bleaching Barrier Reef Marine Park Authority. Available online at: http://www.gbrmpa. monitoring activities,” in Proceedings of the 10th International Coral Reef gov.au/managing-the-reef/threats-to-the-reef/climate-change/how-climate- Symposium (Okinawa), 1783–1793. change-can-affect-the-reef/sea-level-rise (Accessed May 3, 2018). Logan, C. A., Dunne, J. P., Eakin, C. M., and Donner, S. D. (2014). Incorporating Glynn, P. W. (1991). Coral reef bleaching in the 1980s and possible adaptive responses into future projections of coral bleaching. Glob. Change Biol. connections with global warming. Trends Ecol. Evol. 6, 175–179. 20, 125–139. doi: 10.1111/gcb.12390 doi: 10.1016/0169-5347(91)90208-F Lough, J. (2011). Measured coral luminescence as a freshwater proxy: comparison Glynn, P. W., and D’croz, L. (1990). Experimental evidence for high temperature with visual indices and a potential age artefact. Coral Reefs 30, 169–182. stress as the cause of El Niño coincident coral mortality. Coral Reefs 8, 181–191. doi: 10.1007/s00338-010-0688-0 doi: 10.1007/BF00265009 Lough, J., Barnes, D., Devereux, M., Tobin, B., and Tobin, S. (1999). Variability in Goreau, T. J., and Macfarlane, A. H. (1990). Reduced growth rate of Montastrea Growth Characteristics of Massive Porites on the Great Barrier Reef. CRC Reef annularis following the 1987–1988 coral-bleaching event. Coral Reefs 8, Research Technical Report. 211–215. doi: 10.1007/BF00265013 Lough, J. M., and Barnes, D. J. (1997). Several centuries of variation in skeletal Grottoli, A. G., Warner, M. E., Levas, S. J., Aschaffenburg, M. D., Schoepf, V., extension, density and calcification in massive Porites colonies from the Great Mcginley, M., et al. (2014). The cumulative impact of annual coral bleaching can Barrier Reef: a proxy for seawater temperature and a background of variability turn some coral species winners into losers. Glob. Change Biol. 20, 3823–3833. against which to identify unnatural change. J. Exp. Mar. Biol. Ecol. 211, 29–67. doi: 10.1111/gcb.12658 doi: 10.1016/S0022-0981(96)02710-4 Heikoop, J. M., Dunn, J. J., Risk, M. J., Schwarcz, H. P., Mcconnaughey, T. A., and Lough, J. M., and Barnes, D. J. (2000). Environmental controls on growth Sandeman, I. M. (2000). Separation of kinetic and metabolic isotope effects in of the massive coral Porites. J. Exp. Mar. Biol. Ecol. 245, 225–243. carbon-13 records preserved in reef coral skeletons. Geochim. Cosmochim. Acta doi: 10.1016/S0022-0981(99)00168-9 64, 975–987. doi: 10.1016/S0016-7037(99)00363-4 Loya, Y., Sakai, K., Yamazato, K., Nakano, Y., Sambali, H., and Van Woesik, R. Hendy, E. J., Lough, J. M., and Gagan, M. K. (2003). Historical mortality (2001). Coral bleaching: the winners and the losers. Ecol. Lett. 4, 122–131. in massive Porites from the central Great Barrier Reef, Australia: doi: 10.1046/j.1461-0248.2001.00203.x evidence for past environmental stress?. Coral Reefs 22, 207–215. Mann, M. E., Zhang, Z., Hughes, M. K., Bradley, R. S., Miller, S. K., Rutherford, doi: 10.1007/s00338-003-0304-7 S., et al. (2008). Proxy-based reconstructions of hemispheric and global surface Hennige, S. J., Mcginley, M. P., Grottoli, A. G., and Warner, M. E. (2011). temperature variations over the past two millennia. Proc. Natl. Acad. Sci. U.S.A. Photoinhibition of Symbiodinium spp. within the reef corals Montastraea 105, 13252–13257. doi: 10.1073/pnas.0805721105 faveolata and Porites astreoides: implications for coral bleaching. Mar. Biol. Mann, M. E., Zhang, Z., Rutherford, S., Bradley, R. S., Hughes, M. K., 158:2515. doi: 10.1007/s00227-011-1752-1 Shindell, D., et al. (2009). Global signatures and dynamical origins of Hetzinger, S., Pfeiffer, M., Dullo, W.-C., Zinke, J., and Garbe-Schönberg, D. the little ice age and medieval climate anomaly. Science 326, 1256–1260. (2016). A change in coral extension rates and stable isotopes after El doi: 10.1126/science.1177303 Frontiers in Marine Science | www.frontiersin.org 11 August 2018 | Volume 5 | Article 283
Kamenos and Hennige                                                                                                                                     Centennial GBR Bleaching

Marshall, J. F., and Mcculloch, M. T. (2002). An assessment of the                             Suggett, D. J., and Smith, D. J. (2011). Interpreting the sign of
   Sr/Ca ratio in shallow water hermatypic corals as a proxy for sea                              coral bleaching as friend vs. foe. Glob. Change Biol. 17, 45–55.
   surface temperature. Geochim. Cosmochim. Acta 66, 3263–3280.                                   doi: 10.1111/j.1365-2486.2009.02155.x
   doi: 10.1016/S0016-7037(02)00926-2                                                          Suzuki, A., Gagan, M. K., Fabricius, K., Isdale, P. J., Yukino, I., and Kawahata,
Marshall, P. A., and Baird, A. H. (2000). Bleaching of corals on the Great                        H. (2003). Skeletal isotope microprofiles of growth perturbations in Porites
   Barrier Reef: differential susceptibilities among taxa. Coral Reefs 19, 155–163.               corals during the 1997–1998 mass bleaching event. Coral Reefs 22, 357–369.
   doi: 10.1007/s003380000086                                                                     doi: 10.1007/s00338-003-0323-4
Mcculloch, M., Fallon, S., Wyndham, T., Hendy, E., Lough, J., and Barnes, D.                   Tierney, J. E., Abram, N. J., Anchukaitis, K. J., Evans, M. N., Giry, C.,
   (2003). Coral record of increased sediment flux to the inner Great Barrier Reef                Kilbourne, K. H., et al. (2015). Tropical sea surface temperatures for the past
   since European settlement. Nature 421, 727–730. doi: 10.1038/nature01361                       four centuries reconstructed from coral archives. Paleoceanog. Paleoclim. 30,
Mieog, J. C., Olsen, J. L., Berkelmans, R., Bleuler-Martinez, S. A., Willis,                      226–252. doi: 10.1002/2014PA002717
   B. L., and van Oppen, M. J. (2009). The roles and interactions of                           Van Hooidonk, R., Maynard, J. A., and Planes, S. (2013). Temporary refugia
   symbiont, host and environment in defining coral fitness. PLoS ONE 4:e6364.                    for coral reefs in a warming world. Nat. Clim. Change 3, 508–511.
   doi: 10.1371/annotation/e06b31ef-6b29-44ae-aec1-1740daa93f4b                                   doi: 10.1038/nclimate1829
Muggeo, V. M. R. (2008). Segmented: an R package to Fit Regression Models With                 Veron, J. E. N. (2000). Corals of the World. Vol 1-3. Townsville, QLD: Australian
   Broken-line Relationships. R News, 8/1, 20-25. Available online at: http://cran.r-             Institute of Marine Science.
   project.org/doc/Rnews                                                                       Weis, V. M. (2008). Cellular mechanisms of Cnidarian bleaching: stress causes the
NASA Goddard Space Flight Center OEL Ocean Biology Processing Group (2017).                       collapse of symbiosis. J. Exp. Biol. 211, 3059–3066. doi: 10.1242/jeb.009597
   Moderate-Resolution Imaging Spectroradiometer (MODIS) Aqua Sea Surface                      West, J. M., and Salm, R. V. (2003). Resistance and resilience to coral bleaching:
   Temperature 11µ Daytime Data. (Accessed May 26, 2017)                                          implications for coral reef conservation and management. Conserv. Biol. 17,
NOAA (2018). NOAA Coral Reef Watcht. Available online at: http://www.                             956–967. doi: 10.1046/j.1523-1739.2003.02055.x
   coralreefwatch.noaa.gov                                                                     Wiedenmann, J., D’angelo, C., Smith, E. G., Hunt, A. N., Legiret, F. E., Postle,
Oliver, J. K., Berkelmans, R., and Eakin, C. M. (2009). “Coral bleaching in space                 A. D., et al. (2013). Nutrient enrichment can increase the susceptibility
   and time,” in Coral Bleaching Patterns, Processes, Causes and Consequences, eds                of reef corals to bleaching. Nat. Clim. Change 3, 160–164. doi: 10.1038/
   J. Lough and M. J. H. Van Oppen (Berlin: Springer-Verlag), 21–39.                              nclimate1661
Pages WDCA. (2015). From the NOAA National Climatic Data Centre. Available                     Wilkinson, C. (2006). Status of the Coral Reefs of the World: 2004. (Townsville,
   online at: https://www.ncdc.noaa.gov/paleo/study/1863                                          QLD: Australian Institute of Marine Science).
Palumbi, S. R., Barshis, D. J., Traylor-Knowles, N., and Bay, R. A. (2014).                    Yu, K., Zhao, J.-X., Shi, Q., and Price, G. J. (2012). Recent massive coral mortality
   Mechanisms of reef coral resistance to future climate change. Science 344,                     events in the South China Sea: Was global warming and ENSO variability
   895–898. doi: 10.1126/science.1251336                                                          responsible?. Chem. Geol. 320–321, 54–65. doi: 10.1016/j.chemgeo.2012.
Ridd, P. V., Da Silva, E. T., and Stieglitz, T. (2013). Have coral calcification                  05.028
   rates slowed in the last twenty years?. Mar. Geol. 346, 392–399.                            Yu, K.-F., Zhao, J.-X., Shi, Q., Chen, T.-G., Wang, P.-X., Collerson, K. D., et al.
   doi: 10.1016/j.margeo.2013.09.002                                                              (2006). U-series dating of dead Porites corals in the South China sea: evidence
Rodrigues, L. J., and Grottoli, A. G. (2006). Calcification rate and the stable carbon,           for episodic coral mortality over the past two centuries. Quat. Geochron. 1,
   oxygen, and nitrogen isotopes in the skeleton, host tissue, and zooxanthellae                  129–141. doi: 10.1016/j.quageo.2006.06.005
   of bleached and recovering Hawaiian corals. Geochim. Cosmochim. Acta 70,                    Zinke, J., Loveday, B. R., Reason, C. J., Dullo, W. C., and Kroon, D.
   2781–2789. doi: 10.1016/j.gca.2006.02.014                                                      (2014a). Madagascar corals track sea surface temperature variability in the
Rosenberg, E., Koren, O., Reshef, L., Efrony, R., and Zilber-Rosenberg, I. (2007).                Agulhas Current core region over the past 334 years. Sci. Rep. 4:4393.
   The role of microorganisms in coral health, disease and evolution. Nat. Rev.                   doi: 10.1038/srep04393
   Microbiol. 5, 355–362. doi: 10.1038/nrmicro1635                                             Zinke, J., Rountrey, A., Feng, M., Xie, S. P., Dissard, D., Rankenburg, K.,
RRCT. (2014). A Language and Environment for Statistical Computing. R                             et al. (2014b). Corals record long-term Leeuwin current variability
   Foundation for Statistical Computing, Vienna. Available online at: http://www.                 including Ningaloo Niño/Niña since 1795. Nat. Commun. 5:3607.
   R-project.org/                                                                                 doi: 10.1038/ncomms4607
Rstudio (2014). RStudio: Integrated Development Environment for R (Version
   0.96.122) [Computer software]. Boston, MA.                                                  Conflict of Interest Statement: The authors declare that the research was
Scheufen, T., Krämer, W. E., Iglesias-Prieto, R., and Enríquez, S. (2017). Seasonal            conducted in the absence of any commercial or financial relationships that could
   variation modulates coral sensibility to heat-stress and explains annual changes            be construed as a potential conflict of interest.
   in coral productivity. Sci. Rep. 7:4937. doi: 10.1038/s41598-017-04927-8
Skirving, W., Enríquez, S., Hedley, J., Dove, S., Eakin, C., Mason, R., et al.                 Copyright © 2018 Kamenos and Hennige. This is an open-access article distributed
   (2018). Remote sensing of coral bleaching using temperature and light: progress             under the terms of the Creative Commons Attribution License (CC BY). The use,
   towards an operational algorithm. Remote Sens. 10:18. doi: 10.3390/rs10010018               distribution or reproduction in other forums is permitted, provided the original
Smith, T. M., Reynolds, R. W., Peterson, T. C., and Lawrimore, J. (2008).                      author(s) and the copyright owner(s) are credited and that the original publication
   Improvements to NOAA’s historical merged land-ocean surface temperature                     in this journal is cited, in accordance with accepted academic practice. No use,
   analysis (1880-2006). J. Clim. 21, 2283–2296. doi: 10.1175/2007JCLI2100.1                   distribution or reproduction is permitted which does not comply with these terms.

Frontiers in Marine Science | www.frontiersin.org                                         12                                                  August 2018 | Volume 5 | Article 283
You can also read