INVESTIGATIONS ON THE LUMINESCENCE PROPERTIES OF QUARTZ AND FELDSPARS EXTRACTED FROM LOESS IN THE CANTERBURY PLAINS, NEW ZEALAND SOUTH ISLAND
←
→
Page content transcription
If your browser does not render page correctly, please read the page content below
GEOCHRONOMETRIA                   48 (2021): 46–60
DOI 10.2478/geochr-2021-0005

                                                                                Available online at
                                                      https://content.sciendo.com/view/journals/geochr/geochr-overview.xml

   INVESTIGATIONS ON THE LUMINESCENCE PROPERTIES OF QUARTZ
 AND FELDSPARS EXTRACTED FROM LOESS IN THE CANTERBURY PLAINS,
                  NEW ZEALAND SOUTH ISLAND
                            D. BREZEANU1,2, A. AVRAM1,2 , A. MICALLEF3,4 , S. CINTA PINZARU5,6 , A. TIMAR-GABOR1,2,*
                               1
                                 Faculty of Environmental Science and Engineering, Babes-Bolyai University, Cluj-Napoca, Romania
                   2
                       Interdisciplinary Research Institute on Bio-Nano-Sciences, Environmental Radioactivity and Nuclear Dating Centre,
                                                          Babes-Bolyai University, Cluj-Napoca, Romania
                                                  3
                                                    Helmholtz Centre for Ocean Research, GEOMAR, Kiel, Germany
                                  4
                                    Marine Geology & Seafloor Surveying, Department of Geosciences, University of Malta, Malta
                                  5
                                    Biomolecular Physics Department, Babes-Bolyai University, RO-400084 Cluj-Napoca, Romania
                             6
                               RDI Laboratory of Applied Raman Spectroscopy, RDI Institute of Applied Natural Sciences (IRDI-ANS),
                                             Babeş-Bolyai University, Fântânele 42, RO-400293, Cluj-Napoca, Romania

                   Received 30 September 2020    Accepted 18 March 2021

                   Abstract
                   The applicability of the single-aliquot regenerative-dose (SAR) protocol, by using the optically stimulated lumi-
                   nescence (OSL) signal of quartz as well as the post-infrared–infrared (pIRIR) signals of polymineral fine grains,
                   namely pIRIR225 and pIRIR290, was assessed for dating loess in New Zealand South Island. OSL signals of quartz
                   grains displayed low sensitivity. However, the application of repeated irradiation/bleaching cycles did not result in
                   an increase in sensitivity; annealing in the 300–500°C temperature range generated the sensitisation of both the
                   110°C thermoluminescence (TL) peak as well as the OSL signal, likely by activation of yet unidentified luminescence
                   centres. After heating, the quartz signal is comparable to that of ideal samples, but the annealing is precluding
                   successful dating. On the other hand, feldspar infrared-stimulated signals displayed satisfactory properties, al-
                   lowing estimation of ages ranging from 14 ± 1–29 ± 3 ka for the investigated deposit. It was shown that pIRIR225
                   and pIRIR290 methods have potential for dating loess in the South Island of New Zealand, based on the following
                   observations: (i) Dose recovery tests were successful with recovered-to-given dose ratios with a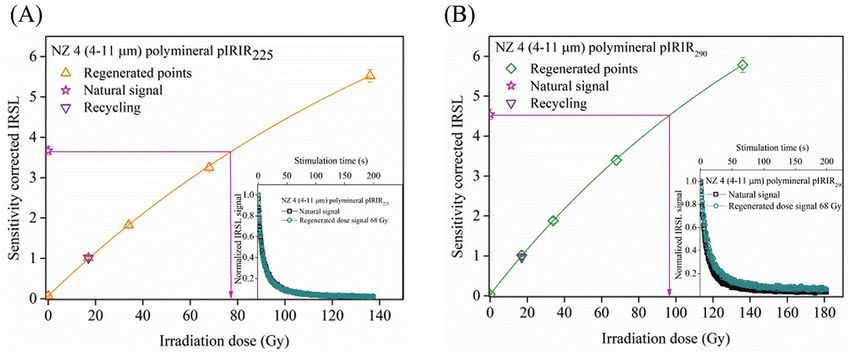
D. BREZEANU ET AL.

have shown that both organic material and charcoal that is            limit its application, namely the weak sensitivity of the
interbedded within loess may be contaminated by younger               signal, with the signal apparently arising from many dim
mobile organic compounds (Goh et al., 1978; Hammond                   grains and the unsatisfactory behaviour in the SAR pro-
et al., 1991). In later studies, Hormes et al. (2003) con-            tocol (Preusseur et al., 2006). The recent developments
cluded that the radiocarbon ages reported by Almond                   of the pIRIR protocols based on the SAR procedure have
et al. (2007) for Birdlings Flat loess at Ahuriri Quarry,             increased the interest in using feldspars. While a number
Banks Peninsula, are inconsistent with the optically                  of studies reported the use of the infrared-stimulated lumi-
stimulated luminescence (OSL) ages as well as with the                nescence (IRSL) dating method on coarse-grained K-rich
isochrone established by Kawakawa tephra. The varia-                  feldspars (Preusseur et al., 2005) or on polymineral fine
tions recorded in magnetic susceptibility on loess paleo-             grains (e.g. Berger et al., 2001, 2002; Hormes et al., 2003;
sol sequences are usually allowing for secure correlations            Rother et al., 2009; Almond et al., 2001, 2007; Shulmeister
with marine isotope stages (MIS) chronology, as the sig-              et al., 2010), the potential of the pIRIR protocols for dating
nal is influenced by the climatic conditions. However, for            sediments in South Island was not fully explored. To our
soils in areas such as the eastern part of the South Island,          knowledge, the only exceptions are the studies conducted
where the mean annual rainfall is less than 1200 mm,                  by Sohbati et al. (2016) and Borella et al. (2016), which
Pillans (1991, 1994) concluded that fluctuations record-              have applied the pIRIR290 method on K-rich feldspars
ed in the magnetic susceptibility are shielded due to iron            extracted from palaeo-rockfall boulders and loessic depos-
remobilisation. For Canterbury, the mean annual rainfall              its south of Christchurch.
is 645 mm. Widespread tephra bed layers can play a cru-                   The aim of this study is to further explore the lumines-
cial role for establishing chronological frameworks, but              cence properties of quartz extracted from a loess deposit
because of the long distance from the volcanic sources in             from Canterbury Plains, in the South Island, and to assess
North Island, South Island is poor in tephra marker hori-             the applicability of two pIRIR stimulated luminescence
zons, with only two widespread tephra marker layers rec-              protocols on polymineral fine grains extracted from the
ognized in the loess deposits: the Aokautere Ash Member               same samples.
of Kawakawa Tephra Formation (22,590 ± 230 yr BP, ca.
26,500 cal. yr BP – Wilson et al., 1988), identified in the
upper loess units throughout most of South Island (e.g.               2. Study Site
Campbell, 1986, Eden et al., 1992; Almond et al., 2007)
and the Rangitawa Tephra, dated at ≅340 ka (Kohn et al.,              Apart from the Ross (2.4–2.6 Ma) and Porika (2.1–2.2 Ma)
1992; Alloway et al., 1993; Plillans 1996) and detected               glaciations, New Zealand has undergone at least five gla-
only by microscopic grain counting (Eden et al., 1992).               ciations during the Quaternary (Suggate, 1990). The most
    The OSL dating method has been successfully applied               extensive deposits of loess are located across the foothills
on quartz and feldspars extracted from various sediments              of the Southern Alps and in the lowlands of the Canterbury
on both the Northern and Southern Hemisphere during                   Plains (Yates et al., 2018). The most developed loess de-
the last decades. The precision and the accuracy of the               posits, reaching a thickness of >20 m, are located on the
ages obtained have increased due to the development of                lowlands south of Timaru (south Canterbury) and on Banks
the single-aliquot regenerative-dose (SAR) protocol on                Peninsula (Bell and Trangmar, 1987). Based on mineral-
quartz (Murray and Wintle, 2000, 2003), as well as the                ogical composition, the main source material for loess
versions of the protocol developed for feldspars, especial-           deposits from Canterbury Plains is eroded from the Southern
ly the post-infrared–infrared protocols (pIRIR), pIRIR225             Alps (Raeside, 1964; Sparrow, 1948; Young, 1964). Using
(Buylaert, 2009) and pIRIR290 (Thiel, 2011). However,                 thermoluminescence (TL), Berger et al. (2001) dated loess
relatively few luminescence dating studies have been re-              deposits from the south Canterbury Plains and Banks
ported on sediments of various origins from South Island,             Peninsula, reporting ages ranging from 246 ± 91 ka (oldest
New Zealand (e.g. Berger et al., 2001, 2002; Hormes                   age reported for Barrys Bay) to 21.4 ± 2 ka (youngest age
et al., 2003; Litchfield and Lian 2004; Preusser et al., 2005;        reported for Cust section).
Almond et al., 2007; Rowan et al., 2012; Sohbati et al.,                  The study site (44.018870°S, 171.882054°E) is located
2016). For dating relatively young sediments, the preferred           in the southern Canterbury Plains, on the eastern side of
natural dosimeter is quartz, due to the higher bleachabil-            central South Island (Fig. 1). Modern Rakaia, Ashburton
ity of the signal. However, there are a few studies that              and Rangitata rivers flow perpendicularly to the eastern
reported luminescence ages using quartz (e.g. Holdaway                coastal cliff in the Canterbury Plains, discharging into the
et al., 2002; Nichol et al., 2003; Litchfield and Rieser,             Pacific Ocean. The coastline at the study site consists of
2005; Rowan et al., 2012), and there is evidence that                 a steep cliff, up to m high and comprises poorly sorted
quartz from South Island suffers from major problems that             and uncemented matrix-supported outwash gravel that is

                                                                 47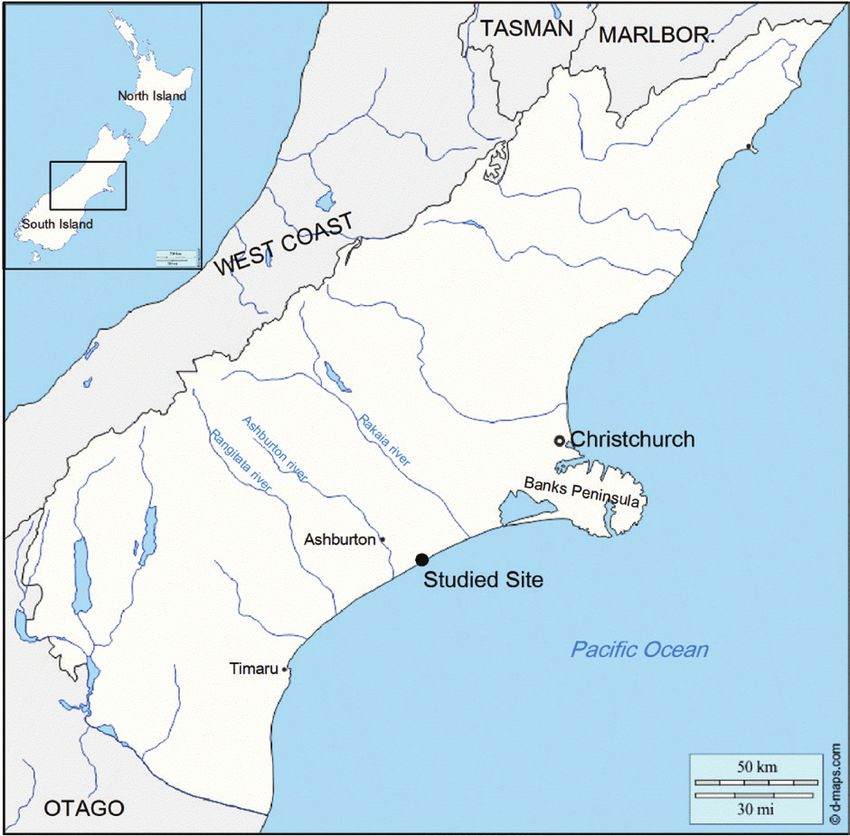
GEOCHRONOMETRIA | LUMINESCENCE PROPERTIES OF QUARTZ AND FELDSPARS IN NEW ZEALAND LOESS

                                                                                after Stoke’s law, settling and centrifuging in distilled wa-
                                                                                ter (Frechen et al., 1996; Lang et al., 1996). The coarser
                                                                                (63–90 mm, 90–125 mm, 125–180 mm and 180–250 mm)
                                                                                grain fractions were obtained by dry sieving. To isolate
                                                                                the coarse quartz fraction from the polymineral mixture, a
                                                                                density separation using heavy liquid was performed (2.62
                                                                                and 2.75 g/cm3). To remove any remaining feldspars and
                                                                                the outer alpha-irradiated portion of grains, the quartz-rich
                                                                                fraction was obtained by etching with hydrofluoric acid
                                                                                (40% concentration for 40 min) followed by a rinse with
                                                                                hydrochloric acid (10%) for 60 minutes to dissolve any in-
                                                                                soluble fluorides that may have formed. For luminescence
                                                                                measurements polymineral fine grains were mounted on
                                                                                aluminium discs, whereas for coarse quartz stainless steel
                                                                                discs were used.

                                                                                3.2 Analytical Facilities
                                                                                All luminescence measurements were carried out using
                                                                                two Risø TL/OSL readers (model DA-20), equipped with
Fig 1. The map of the Canterbury Plains. The studied site is represented by    a classic or automated detection and stimulation head
       filled circle (map source: www.d-maps.com).
                                                                                (DASH) (Lapp et al., 2015). EMI 9235QA and PSM
                                                                                9107Q-AP-TTL-03 (160–630 nm) photomultipliers were
capped by a few metres of loess and modern soil. The cliff                      used for luminescence signals detection. Quartz signals
is eroded by a series of wide coastal gullies (locally known                    were detected using a 7.5-mm-thick Hoya U-340 UV fil-
as dongas). The sampling site is located halfway between                        ters, while for polymineral fine grain signals a blue filter
Rakaia and Ashburton rivers, on the southern flank of one                       combination (Schott BG3 + Corning 7-59, with transmis-
of these coastal gullies.                                                       sion between 320–460 nm) was used. Beta irradiations
    For luminescence investigations, five samples were                          were carried out by 90Sr-90Y radioactive sources mounted
collected from the top section of the flank. The uppermost                      on the readers and calibrated for both fine and coarse frac-
sample was discarded from the analysis due to its proxim-                       tions using gamma-irradiated calibration quartz (Hansen
ity to the modern disturbed surface. The uppermost three                        et al., 2015).
samples analysed (NZ 2, NZ 3 and NZ 4) were collected at                            The natural luminescence signal of the polymineral fine
depths of 30 cm, 50 cm and 70 cm, whereas the last sample                       grain aliquots used for bleaching experiments and residual
(NZ 5) was collected from a depth of 140 cm. According to                       dose measurements was erased by exposing the disks to
Berger et al. (2001), they are expected to belong to L1 unit.                   window light under natural conditions in March (latitude
                                                                                46° 47’ N).
                                                                                    Raman spectra have been recorded using a Renishaw
3. Methodology                                                                  InVia Reflex Confocal Raman system with a Leica mi-
                                                                                croscope using the 100× (NA 0.9) long working-distance
3.1 Sample Preparation                                                          objective. For excitation, a Cobolt DPSS laser emitting at
Luminescence samples were collected in stainless steel                          532 nm was employed. Wavenumbers’ calibration has been
tubes and were prepared under subdued red-light labora-                         achieved using the internal silicon standard. An edge filter
tory conditions. The material from the end of each tube was                     was employed for removing the Rayleigh line and the spec-
removed and used for gamma spectrometry measurements.                           tra were recorded in the 50–1840 cm-1 range with 0.5 cm-1
The material from the inner part of the tubes was used for                      resolution. The acquisition conditions were 1s exposure, 1
63–90 mm, 90–125 mm, 125–180 mm, 180–250 mm quartz                              accumulation and 100% of the output laser power (≅200
and 4–11 mm polymineral grains’ extraction. Treatments                          mW). A Rencam CCD was employed for signal detection
with hydrochloric acid (10% concentration) and hydrogen                         and data acquisition, and processing has been achieved us-
peroxide (10% concentration followed by 30%) were em-                           ing the WIRE 3.4 and Origin 9.2 software.
ployed for calcium carbonate and organic matter removal.
Finer (63 mm) grains were separat-                        3.3 Equivalent Dose Determination
ed through wet sieving. Polymineral fine grains (4-11 mm)                       The single-aliquot regenerative-dose optically stimulated
were separated from the finer polymineral fraction obtained                     luminescence (SAR-OSL) protocol (Murray and Wintle

                                                                               48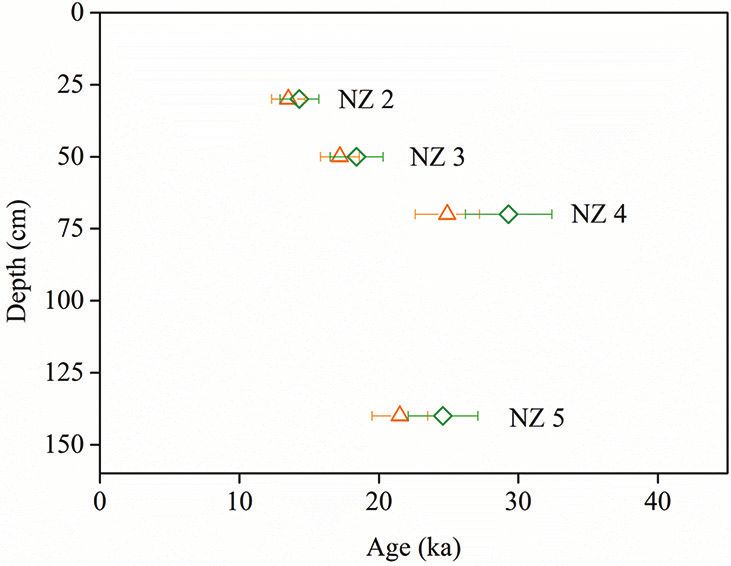
D. BREZEANU ET AL.

2000, 2003) was applied on coarse quartz grains. Full details          was estimated as a function of depth, altitude and geomag-
on the protocol are given in Table S1A in Supplementary                netic latitude (Prescott and Hutton, 1994).
Material. Optical stimulation was carried out with blue
light-emitting diodes for 40 s at 125°C. For analysis, the
signal integrated over the first 0.308 s was used after an             4. Results And Discussion
early background subtraction from 1.69–2.30 s interval,
unless otherwise mentioned. A preheat temperature of                   4.1. Luminescence Properties – Quartz
220°C for 10 s and a cutheat (ramp heating) of 180°C were              We have checked the purity of the quartz mineral extracts
employed. At the end of each SAR cycle, a high tempera-                and their crystallinity by conducting RAMAN spectroscopy
ture bleach of 280°C for 40 s was performed. To check the              on sample NZ 5 63–90 mm. Fig. 2 compares the spectrum
robustness of the SAR protocol, intrinsic tests (recycling             of the sample to that obtained on calibration quartz. The
and recuperation) were included in every measurement as                results confirm that our extracted material is indeed crys-
well as infrared (IR) depletion tests (Duller, 2003).                  talline quartz, according to the characteristic sharp bands
    Equivalent doses measured on polymineral fine grains               observed in all the recorded spectra, similar to the quartz
were carried out by applying two elevated-temperature in-              calibration sample. The 15 bands—observed in the Raman
frared-stimulation methods based on the SAR procedure                  spectra recorded with minimal acquisition time (1s) and
and the pIRIR225 (Buylaert et al., 2009; Wacha and Frechen,            1 accumulation—resembled those observed by Krishnan
2011; Vasiliniuc et al., 2012) (Table S1B in Supplementary             since early Raman studies on quartz that were published
Material) and pIRIR290 (Buylaert et al., 2011a, 2012; Thiel            (Krishnan, 1945). The observed bands from microcrystals
et al., 2011) (Table S1C in Supplementary Material) proto-             are located at 128 (s), 206 (s), 265 (m), 356 (m), 394 (m),
cols. To reduce the signal susceptible to fading by allowing           404 (m), 452 (sh), 464 (vs), 696 (m), 793 (w), 804 (w),
recombination of near-neighbour trap and centre pairs, a               1063 (w), 1082 (w), 1160 (m) and 1230 cm-1 (w).
stimulation with IR diodes for 200 s at 50°C was performed                 To check if the quartz extracted from the investigated
after a preheat of 60 s at 250°C in the case of pIRIR225 proto-        samples is suitable for OSL dating, the SAR-OSL proto-
col and 320°C in the case of pIRIR290 protocol, respectively.          col labelled in Table S1A in Supplementary Material was
The signal of interest was recorded during a subsequent IR             applied. Fig. 3A shows a typical OSL decay curve for the
stimulation for 200 s at 225°C in the case of pIRIR225 pro-            natural signal, while in Fig. 3B, the decay of the signal
tocol and at 290°C in the case of pIRIR290 protocol. The net           measured after a regenerative dose of 100 Gy is compared
signal used for analysis was integrated from the initial 2.5 s         to that of calibration quartz. Based on the comparison to
of stimulation minus a background evaluated from the last              calibration quartz, it can be observed that the fast compo-
50 s. A high temperature bleach was performed for 100 s at             nent does exist in the OSL signal. However, its intensity
290°C (pIRIR225 protocol) and 325°C (pIRIR290 protocol) at             is very weak. All investigated grain sizes displayed low
the end of each cycle of measurements. The size of the test            sensitivity, with no more than 1500 cts recorded in the
dose was 17 Gy for all measurements.                                   first 1.2 s of stimulation in the case of the natural signal
                                                                       (see Table S2 in Supplementary Material). A weak signal
3.4 Dosimetry
High-resolution gamma spectrometry was applied to deter-
mine the radionuclide specific activities using a well-type
HPGe detector. For 226Ra-222Rn equilibrium to be reached,
the samples were stored for 1 month before measurement.
Annual dose rates were determined using the conversion
factors tabulated by Guérin et al. (2011). An alpha efficien-
cy factor of 0.08 ± 0.02 was considered for the 4–11 mm
polymineral fraction (Rees-Jones, 1995). The time-aver-
aged water content was assumed to be 15% with a relative
error of 25%. The water content was chosen to represent
the mean water content over the depositional history of the
sediments. Similar values for water content were used by
Rowan et al. (2012) and Sohbati et al. (2016) for sediments
from Canterbury Plains and Banks Peninsula, respectively.
The external contribution from beta, gamma and alpha ra-
diation, as well as from the cosmic background radiation,              Fig 2. Comparison of calibration quartz (filled squares) RAMAN spectra
                                                                               with that of the 63–90 µm quartz (filled circles) extracted from
was included in the total dose rates. The cosmic dose rate                     sample NZ5.

                                                                  49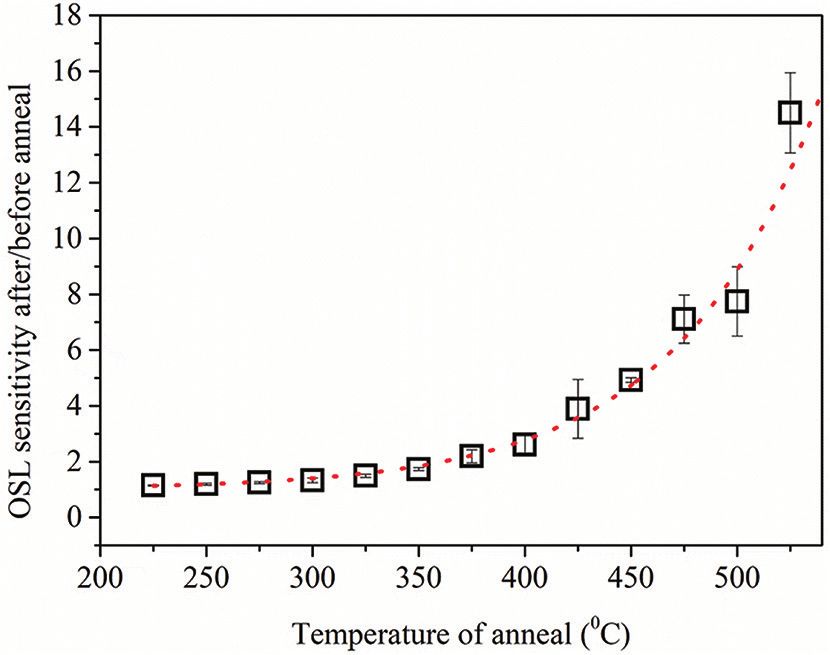
GEOCHRONOMETRIA | LUMINESCENCE PROPERTIES OF QUARTZ AND FELDSPARS IN NEW ZEALAND LOESS
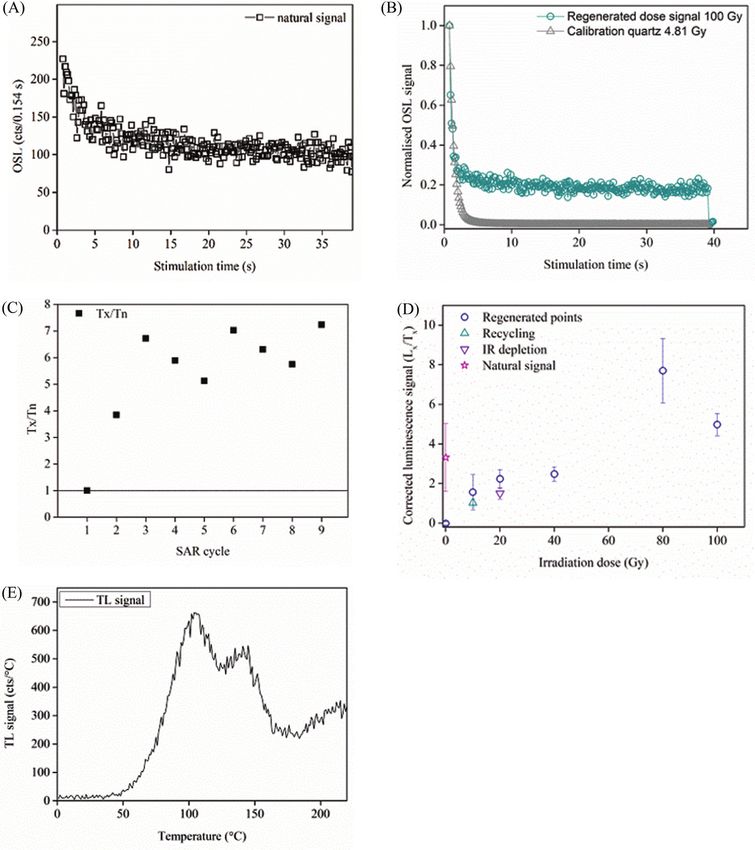
Fig 3. Representative luminescence behaviour of 63–90 µm quartz extracted from sample NZ 3. (A) the decay curve of natural continuous-wave
optically stimulated luminescence (CW-OSL) signal (open squares); (B) comparison between the decay curve of a regenerated dose of 100 Gy
(open circles) and the typical decay curve of a calibration quartz (open triangles); data is normalised to the number of counts collected in the
first channel of stimulation; (C) variation of the Tx/Tn ratio during SAR cycles; (D) representative sensitivity-corrected dose response curve. The
sensitivity corrected natural signal is depicted as a star. Recycling and IR depletion points are represented as an upward triangle and inverse tri-
angle, respectively; (E) TL signal recorded during the preheat to 220°C employed in a typical SAR cycle after irradiation with a regenerative dose
of 100 Gy. SAR, single-aliquot regenerative-dose; TL, thermoluminescence.
50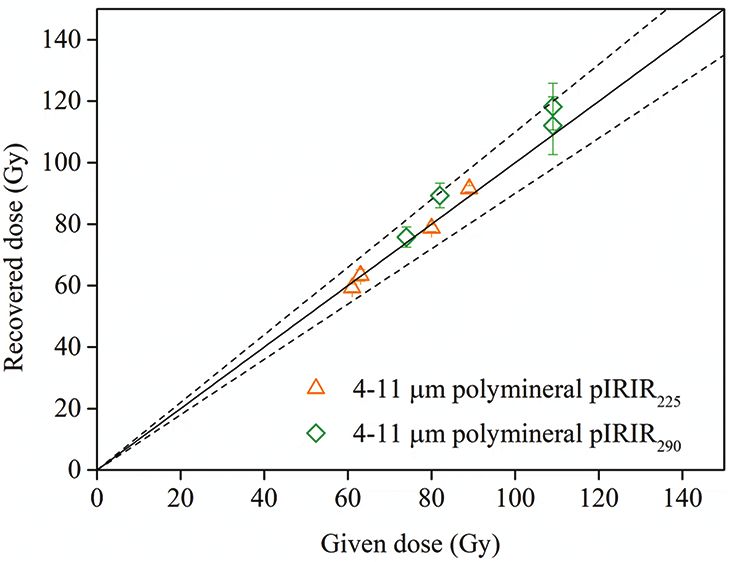
D. BREZEANU ET AL.

could result in obtaining an equivalent dose of low preci-                                 Preusser et al. (2006) for sedimentary quartz of metamor-
sion, but it should not affect the accuracy of the result. As                              phic origin from the forefield of Franz Joseph Glacier in the
the signals were found to be above the detection limit, we                                 western part of South Island. The above-mentioned study
have attempted to apply the SAR protocol to the various                                    attributed this behaviour to the short sedimentary history
grain sizes of quartz that were available. However, sig-                                   of the grains, as it was reported that sensitisation of the
nificant sensitivity changes were observed to occur. The                                   OSL signal was achieved by repeated bleaching/irradiation
response to the administered test dose was found to vary                                   cycles.
significantly from one cycle to another, the response in-                                      To test whether OSL properties of the samples investi-
creasing significantly during measurement cycles as indi-                                  gated here can be improved by the application of different
cated by Fig. 3C. The SAR protocol is not able to correct                                  irradiation and stimulation steps, we have conducted a dose
for sensitivity changes and a well-defined dose response                                   recovery test on sample NZ 3 63-90 mm under the same
curve could not be constructed; an example of this can                                     conditions as presented above, except that the whole proce-
be observed in Fig. 3D. Consequently, equivalent doses                                     dure was carried out subsequent to the application of three
could not be confidently determined using quartz SAR-                                      different treatments:
OSL. Another important observation was made while
recording the TL signals during the preheat procedures                                     (i) 		 the repetition of 5 bleach (blue diodes stimulation for
applied in the SAR protocol following laboratory given                                             100 s at room temperature)/dose (100 Gy) cycles,
doses. Unlike the case of well-behaved OSL samples,                                        (ii) 		 irradiating the sample with a dose of 100 Gy followed
where well-defined 110°C TL peaks are always observed,                                             by heating to 500°C five times and
the TL signals recorded for these samples displayed weak                                   (iii) simply by repeating five times the heat treatment that
110°C TL peaks along with a second peak at 150°C.                                                  consistied of a ramp heating to 500°C. The results
While the existence of the 150°C TL peak in quartz is                                              of the dose recovery test performed following these
well known (see e.g. Chruścińska et al., 1996, Veronese et                                         treatments are presented in Table 2.
al. 2004, Preusser et al., 2009) we have never identified it
visually so far in samples that are displaying bright OSL                                      Contrary to the findings of Preusser et al. (2006), we
signals due to the dominance of the 110°C TL peaks. Fig.                                   have not observed an increase in sensitivity or an improve-
3E presents such a typical example for quartz from New                                     ment in the results of the dose recovery test – in other
Zealand for a heating rate of 5°C/s.                                                       words, a better behaviour of the material in the SAR proto-
    We have further tested the behaviour of sample NZ 3                                    col in accordance with the following treatment, namely (i)
63-90 mm quartz by performing a dose-recovery test. Three                                  the application of repeated bleach/dose cycles. However,
aliquots were bleached with blue diodes twice at room tem-                                 the sensitivity is increased by one order of magnitude fol-
perature for 100 s with a 10000 s pause in between the two                                 lowing dosing and annealing, with the heat treatment ac-
stimulations. A dose of 100 Gy was then administered and                                   counting for most of the effect, as can be seen from the
measured as unknown, using the SAR protocol as described                                   results of experiment (ii) where irradiations have not been
in Section 3.3. Table 1 summarises the results that were                                   carried out. Following the application of the annealing to
obtained. One can ascertain that an increase in sensitivity                                500°C, the behaviour of the OSL signals in the SAR pro-
occurs and sensitivity changes are not properly corrected                                  tocol is improved, with satisfactory recycling and dose re-
by the measurement protocol, as observed form recycling                                    covery tests results (Table 2).
tests. This results in an unsatisfactory recovered-to-given                                    Another important observation is that significant sen-
dose ratio.                                                                                sitisation of the 110°C TL signals was observed following
    The failure of the quartz from New Zealand to accurate-                                annealing to 500°C (Fig. S1 and Fig. S2 in Supplementary
ly measure a given dose in the SAR protocol, as well as                                    Material). During experiment (ii) presented above, it was
its poor OSL sensitivity, have been previously reported by                                 observed that, while the 110°C peak is weak in intensity

Table 1. Results of dose recovery tests on NZ 3 63–90 µm quartz.

            Signal sensitivity for   Average signal sensi-       Signal sensitivity       Average          Recycling ratio   IR depletion ratio    Recovered/given dose
           the dose to be recov-     tivity (cts in 1.2 s) for   for 100 Gy in SAR    signal sensitivity
              ered (cts in 1.2 s)    dose to be recovered           (cts in 1.2 s)      for 100 Gy in
                                                                                      SAR (cts in 1.2 s)

 aliq 1            3789                    2571± 684                   6268                4472 ± 930           1.13               0.78                    0.81

 aliq 2            1422                                                3154                                     0.83               0.76                    0.60

 aliq 3            2502                                                3993                                     1.11               0.78                    0.94
 IR, infrared.

                                                                                      51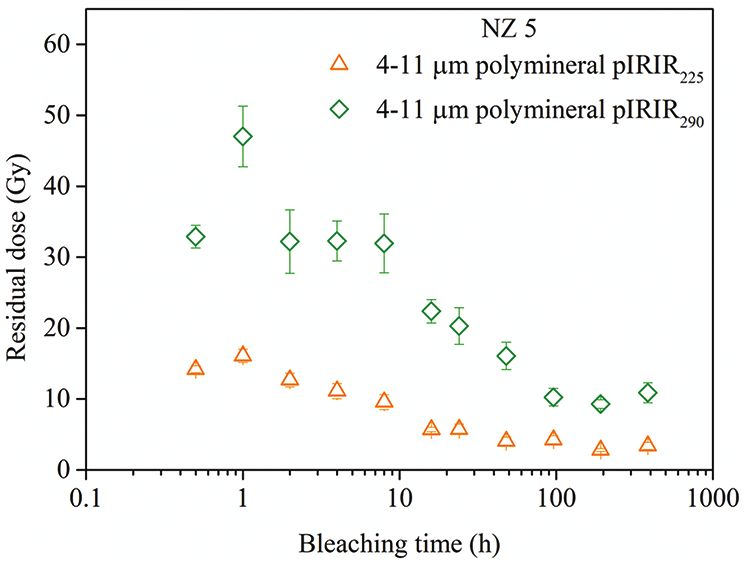
GEOCHRONOMETRIA | LUMINESCENCE PROPERTIES OF QUARTZ AND FELDSPARS IN NEW ZEALAND LOESS

Table 2. Results of dose recovery tests after repeated cycles of bleaching and irradiation and heating and irradiation.

 Treatment        Aliq No.   Signal sensi-    Average signal sen-     Signal sensitivity     Average signal     Recycling    IR depletion   Recovered/given dose
 applied be-                 tivity for the   sitivity for the dose   for 100 Gy in SAR      sensitivity for      ratio          ratio
 fore the dose                dose to be      to be recovered (cts       (cts in 1.2 s)      100 Gy in SAR
 recovery test                 recovered             in 1.2 s)                                (cts in 1.2 s)
                             (cts in 1.2 s)
 Experiment (i)      1           2685             2858 ± 718                2869               3015 ± 565         1.06           1.23               0.91
 Bleach/dose         2           1710                                       2119                                  1.14           0.89               0.66
 (100 Gy) × 5
                     3           4180                                       4058                                  0.82           0.57               1.08
 Experiment          1          34665           49960 ± 12765              41173             60220 ± 16152        1.00           0.97               0.94
 (ii) Heat to        2          39905                                      47148                                  0.98           1.01               0.95
 500°C/dose
                     3          75311                                      92339                                  1.00           0.99               0.92
 (100 Gy) × 5
 Experiment          1          10406            20287 ± 6244              11556              25794 ± 8760        0.98           0.99               0.97
 (iii) Heat to       2          18612                                      24073                                  1.02           0.98               0.92
 500°C× 5            3          31842                                      41754                                  0.98           1.01               0.94
 IR, infrared.

during the first TL recorded (Fig. S2A in Supplementary                                  The effect of varying the annealing temperature was
Material), once the sample was heated to 500°C, the TL                               tested, as well. Aliquots of sample NZ 3 63–90 mm quartz
glow-curve shape changes dramatically. In the second TL/                             were bleached and subjected to the following measurement
dose measurement cycle the 110°C, the TL peak is well                                steps: irradiation with 100 Gy, preheat for 10 s at 220°C,
represented, and the glow curve is repetitive during sub-                            OSL measurement (for 40 s at 125°C), anneal to Ta (ramp
sequent irradiation read-out steps in the annealing process                          heating to a temperature between 225°C and 525°C), ir-
(Fig. S2B in Supplementary Material). In the case of the                             radiation with 100 Gy, preheat for 10 s at 220°C, OSL
dose recovery test without previous annealing, a com-                                measurement (for 40 s at 125°C). The OSL response after
posite 110–150°C peak is observed in the low tempera-                                annealing can be compared to the OSL response before the
ture region during the preheat of the signals (Fig. S2C in                           application of the thermal treatment. This was carried out
Supplementary Material), and the OSL signals are weak in                             on three aliquots for each anneal temperature employed
intensity (Fig. S2E in Supplementary Material). If the sam-                          and the results of the average ratio between the post an-
ple is annealed to 500°C before the dose recovery test, the                          nealing and pre-annealing signals are presented in Fig. 5.
OSL signals increase by one order of magnitude (Fig. S2F
in Supplementary Material) and so does the 110°C TL peak
(Fig. S2D in Supplementary Material). Annealing the sam-
ple to 500°C results in the sensitisation of both the 110°C
TL peak as well as the OSL fast component. While the heat
treatment is making the quartz signal comparable to that
employed in standard OSL dating, the annealing removes
the desirable natural signal, precluding successful dating of
the material.
    The effect of repeating the annealing cycles on the
OSL signal is shown in Fig. 4 for the response of sample
NZ 3 63–90 mm quartz to a dose of 100 Gy. The sample
was bleached (room-temperature blue-diode stimulation
for 100 s, pause of 10000 s, room-temperature blue-di-
ode stimulation for 100 s) and then subjected repeatedly
to the following measurement cycle: irradiation (100 Gy),
preheat for 10 s to 220°C, OSL measurement (blue diode
stimulation at 125°C), annealing (TL measurement) to                                    Fig 4. The OSL signal sensitisation after repeated annealing to 500°C. The
                                                                                                luminescence signal intensities were measured after an irradiation
500°C. Data presented in Fig. 4 show that the first thermal                                     to 100 Gy and a preheat to 220°C for 10 s. The OSL signal recorded
treatment enhances the sensitivity by one order of magni-                                       before the first annealing is presented as an open square whereas
                                                                                                the luminescence signals recorded following repeated annealing
tude and subsequent annealing treatments do not have a                                          irradiation cycles are represented as solid squares. OSL, optically
further significant effect.                                                                     stimulated luminescence.

                                                                                   52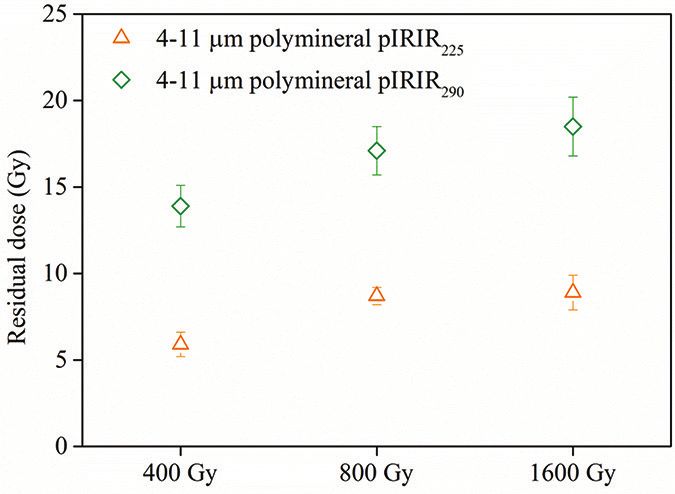
D. BREZEANU ET AL.

                                                                                   for radioluminescence signals reported by Martini et al.
                                                                                   (2014) for natural quartz. Consequently, the results present-
                                                                                   ed indicate that the heating process is most likely affecting
                                                                                   the luminescence pathway and not the trapping process, by
                                                                                   the creation of recombination centres. Investigations for
                                                                                   gaining further understanding on these matters by employ-
                                                                                   ing electron spin resonance measurements are currently
                                                                                   underway.

                                                                                   4.2 Luminescence Properties – Polymineral Grains

                                                                                   4.2.1. Equivalent doses
                                                                                   Unlike OSL signals of quartz, the IRSL signals of polymin-
                                                                                   eral fine grains displayed a satisfactory behaviour in the
                                                                                   SAR protocol. Equivalent doses were obtained by interpo-
Fig 5. Sensitivity increase of the OSL signal as function of the annealing        lating the natural sensitivity corrected luminescence signal
        temperature. The dotted line represents an exponential depend-             on the dose response curve constructed for each sample
        ence. OSL, optically stimulated luminescence.
                                                                                   using both pIRIR protocols. Fig. 6 shows a representative
                                                                                   growth curve for sample NZ 4 using pIRIR225 (Fig. 6A) and
    An exponential increase is reported as a function of an-                       the pIRIR290 (Fig. 6B) protocols, respectively. The insets of
nealing temperature, significant sensitisation occurring for                       Fig. 6 present the comparison of decay curves of the natu-
heating temperatures above ≅350°C. This sensitisation with                         ral signals to those measured following regenerative doses.
heating is intriguing, given the fact that the quartz analysed                         The dose response curves were best fitted by a sum of
should have an important metamorphic (sub-greenschist)                             two saturating exponential functions. The values for the
component from the Eastern greywacke basement rocks.                               equivalent doses range from 64 ± 2 Gy to 92 ± 23 Gy in the
For this reason, the crystal should have been subjected                            case of pIRIR225 protocol and from 83 ± 3 Gy to 120 ± 6 Gy
to moderate heating 300–100 Ma. Poor OSL properties                                in the case of pIRIR290 protocol, respectively. The measured
of metamorphic quartz were also reported by Guralnik                               equivalent doses along with the results of recycling and re-
et al., 2015, with the authors inferring that only samples                         cuperation tests for each sample are shown in Table S3 in
from a low-grade metamorphic context (heated to less than                          Supplementary Material.
≅380°C) are displaying satisfactory OSL properties.
    Sensitisation by heating, and not due to pre-dose activa-                      4.2.2. Residual signals
tion, was previously reported to occur in partially fired (i.e.                    It is well known that the post-IR IRSL signals are diffi-
annealed only to moderate temperatures) quartz (Yang and                           cult to bleach, as residual doses of a few grays have been
McKeever, 1990; Bøtter-Jensen et al., 1995). However, a                            reported even after prolonged exposure to daylight or
physical mechanism was not proposed as it was conclud-                             light in a solar simulator (e.g Buylaert et al., 2011b, 2012;
ed that it is not possible to distinguish between a model                          Stevens et al., 2011; Murray et al., 2012, 2014; Yi et al.,
that calls for the creation of luminescence centres or one                         2016, 2018; Sohbati et al., 2016; Veres et al., 2018; Avram
that calls for the removal of non-luminescence centres due                         et al., 2020). Also, by measuring samples of modern dust
to annealing (Bøtter-Jensen et al., 1995). In a later multi                        and samples with an equivalent dose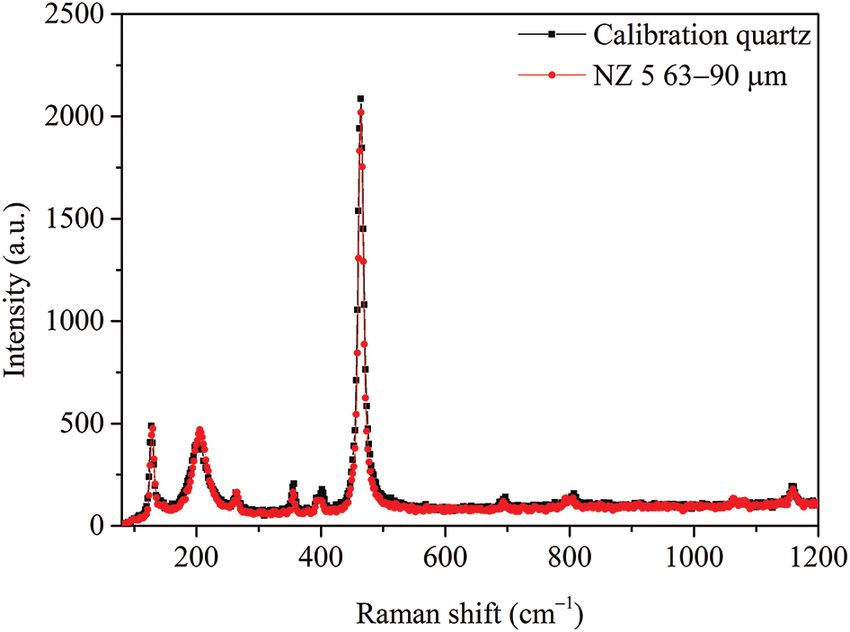
GEOCHRONOMETRIA | LUMINESCENCE PROPERTIES OF QUARTZ AND FELDSPARS IN NEW ZEALAND LOESS

Fig 6. Representative sensitivity-corrected dose-response curves constructed for one aliquot from sample NZ 4 on polymineral fine (4–11 µm) grains
        using (A) pIRIR225 and (B) pIRIR290 protocol. The sensitivity corrected natural signals are depicted as stars interpolated on the dose response curves
        for indicating the equivalent doses. The recycling point is represented as an inverse triangle. Insets show typical decay curves of natural CW-OSL
        signals (open squares) in comparison to a regenerated signals (open circles) induced by a beta dose approximately equal to the equivalent dose.
        pIRIR, post-infrared–infrared protocol.

                                                                                (e.g. Sohbati et al., 2012; Buylaert et al., 2012, Yi et al.,
                                                                                2016), suggesting a possible dose dependency of the
                                                                                residual. For the different samples investigated here, the
                                                                                residual doses measured after 30 days of exposure do not
                                                                                differ significantly (Table S4 in Supplementary Material)
                                                                                and neither do the equivalent doses. To investigate wheth-
                                                                                er the residual signal is dose dependent, eight bleached
                                                                                aliquots of samples NZ2, NZ3 and NZ 4 were irradiated
                                                                                with different beta doses of 400 Gy, 800 Gy and 1600 Gy
                                                                                and subsequently exposed to windowlight. After an expo-
                                                                                sure of 30 days, four aliquots from each sample were mea-
                                                                                sured using pIRIR225 protocol, whereas for the other four
                                                                                aliquots, the pIRIR290 protocol was used. The results are
                                                                                displayed in Fig. 8. An increase of the residual dose with
Fig 7. Residual doses measured using pIRIR225 (upward triangle) and
                                                                                the size of the previously given dose can be observed in the
        pIRIR290 (diamond) after different bleaching times. The natural         case of both pIRIR225 and pIRIR290 protocols. The magni-
        signal was bleached under natural conditions under window light.        tude of the residuals range from 5.9 ± 0.7 Gy (for a dose of
        The shortest bleaching time was 0.5 h while the longest was 192 h.
        pIRIR, post-infrared–infrared protocol.                                 400 Gy) to 8.9 ± 1 Gy (for a dose of 1600 Gy) in the case
                                                                                of pIRIR225 and from 13.9 ± 1.2 Gy (for a dose of 400 Gy)
    To check whether this is indeed the minimum residual                        to 18.5 ± 1.7 Gy (for a dose of 1600 Gy) in the case of
level that can be achieved as function of exposure time,                        pIRIR290, respectively.
sets of five fresh aliquots of sample NZ5 were exposed                              We compare the data obtained for 1600 Gy (8.9 ± 1 Gy
to window light for different periods of time (from 0.5 h                       for pIRIR225 and 18.5 ± 1.7 Gy for pIRIR290) to the val-
to 192 h). The results are shown in Fig. 7. In the case of                      ues obtained in the bleaching experiment for the natural
pIRIR225 protocol, a constant residual dose of 3.7 ± 0.5 Gy                     signals (corresponding to a measured equivalent dose of
is achieved after 48 h of exposure, while in the case of                        ≅60–120 Gy), namely average values on all samples of
the pIRIR290, signals’ residual values reach a constant                         3.5 ± 0.2 Gy for pIRIR225 and 9.2 ± 2.0 Gy for pIRIR290,
value of 9.8 ± 0.5 Gy only after a bleaching time of 96 h.                      respectively. We conclude that (i) different doses accrued
These results are in line with the values obtained for the                      by the mineral grain before the bleaching event should not
30-day-experiment.                                                              result in dramatically different residual doses and (ii) per-
    Several studies have reported that the magnitude of                         forming bleaching experiments on natural samples instead
the residual dose is dependent on the equivalent dose                           of using a modern analogue should not result in an offset of

                                                                              54
D. BREZEANU ET AL.
more than a few Grays. Bleaching corrections should not pIRIR290 they range from 1.02 ± 0.04 (NZ 2) to 1.09 ± 0.05
cause significant inaccuracies unless very young samples (NZ 3), suggesting that both pIRIR225 and pIRIR290 protocols
are dated. However, since a dose dependence is reported, can successfully recover the laboratory doses given.
and since it remains questionable whether the conditions
in the laboratory fully reproduce the bleaching process in 4.2.4. Anomalous fading tests
nature, it is advisable to measure a modern analogue for The greatest disadvantage of using feldspars as lumines-
residual dose estimation, as well. Here, a modern sample cence dosimeters is the loss of the signal during burial
was collected from a nearby site (latitude 44.014973° S, time. This loss of the signal is known as anomalous fad-
longitude 171.891569° E). Following the same method- ing and can be usually quantified in terms of fading rates
ology, an equivalent dose of 7.5 ± 0.5 Gy was measured (percentage of the signal lost per decade; Aitken, 1985).
using pIRIR225 protocol; on the other hand, using pIRIR290 Thiel et al. (2011) have reported for the first time a natural
protocol, a dose of 22.8 ± 1.5 Gy was obtained. Based on pIRIR290 signal in saturation for a sample collected below
the results of the laboratory experiments presented above, the B/M boundary and concluded that pIRIR290 signal is a
we consider these residual doses as maximum values. We stable signal and the pIRIR290-ages do not need any further
have chosen to perform residual corrections using both lab- fading correction. Similar observations have been made
oratory obtained values, as well as by the modern analogue by other researchers for pIRIR290 protocol on both poly-
approach (Table 3). mineral fine grains and K-feldspars (e.g. Buylaert et al.,
Uncertainties were determined following Aitken and 2011b; Thomsen et al., 2011; Veres et al., 2018; Avram et
Alldred (1972). A 15% water content was assumed with al., 2020). Based on laboratory fading experiments, other
a relative error of 25%. Errors quoted on equivalent doses studies reported fading rates ofGEOCHRONOMETRIA | LUMINESCENCE PROPERTIES OF QUARTZ AND FELDSPARS IN NEW ZEALAND LOESS
polymineral aliquot was irradiated with a beta dose of
100 Gy. A test dose of 17 Gy was used. Four consecutive
prompt reads-out were carried out prior to storage. The
aliquots were preheated before storage. The maximum time
delay was 38 days (912 h). Three consecutive prompt meas-
urements were employed after the read-out corresponding to
the longest storage time (Fig. S4 in Supplementary Material
presents individual results obtained on all aliquots). A fad-
ing rate 1%/decade (Buylaert et quartz as well as the feldspar-SAR–based pIRIR225 and
al., 2009; Zhang et al., 2018) while other works reported pIRIR290 protocols on polymineral fine grains was inves-
fading rates ofD. BREZEANU ET AL.
in the 300–500°C range, likely by the activation of lu- experiments. The ages obtained by the application of the
minescence centres. However, the same effect could not two pIRIR protocols are generally in agreement, with val-
be achieved by repeated irradiation and bleaching cycles ues ranging from 14 ± 1 ka to 29 ± 3 ka, suggesting that
as previously suggested. While equivalent doses could loess from the investigated site was deposited during the
not be securely obtained using quartz, the application of last glacial maximum.
pIRIR225 and pIRIR290 methods were successful in achiev-
ing the following outcomes, namely: (i) dose recovery
tests resulted in satisfactory results for both these proto- Acknowledgement
cols, results being consistent to unity at a 95% confidence
level; (ii) fading rates of pIRIR225 signals were generally D. Brezeanu acknowledges the financial support obtained
negligible, with measured values of less than 1%; (iii) from Babeș-Bolyai University in the form of a research
although pIRIR290 signals are more difficult to bleach scholarship for students. This project has received fund-
than pIRIR225 signals, constant residual values of ≅4 and ing from the European Research Council (ERC) under the
≅10 Gy were achieved after exposure under window light European Union’s Horizon 2020 research and innovation
exposure for 48 h in the case of pIRIR225 and 96 h in the programme (grant agreements No. 678106 (INTERTRAP)
case of pIRIR290 signals, respectively; and (iv) a depen- and No. 677898 (MARCAN)).
dence of the residual on the previous given dose was ob-
served; however, for a dose as large as 1600 Gy, the re-
siduals obtained for the two methods are ≅9 and ≅19 Gy, Supplementary information
respectively. Thus, the equivalent dose of the sample used
in the bleaching experiment should not have a significant Supplementary information are available online at:
effect when the residual dose is determined by laboratory DOI: 10.2478/geochr-2021-0005
References
Aitken MJ and Alldred JC, 1972. The assessment of error limits in post-IR IRSL and quartz SAR-OSL protocols on Middle to Late
thermoluminescent dating. Archaeometry 14: 257–267. Pleistocene loess at Batajnica, Serbia. Boreas 49(3): 615–633,
Aitken MJ, 1985. Thermoluminescence Dating. Academic Press, DOI: 10.1111/bor.12442.
London: 360pp. Balescu S, Jordanova D, Brisson LF, Hardy F, Huot S and Lam-
Almond PC, Moar NT and Lian OB, 2001. Reinterpretation of othe M, 2020. Luminescence chronology of the Northeast-
the glacial chronology of South Westland, New Zealand. ern Bulgarian loess-paleosol sequences (Viatovo and Kaoli-
New Zealand Journal of Geology and Geophysics 44(1): 1–15, novo). Quaternary International 552: 15–24, DOI: 10.1016/j.
DOI: 10.1080/00288306.2001.9514917. quaint.2019.04.020.
Almond PC, Shanhun FL, Rieser U and Shulmeister J, 2007. Bell DH and Trangmar BB, 1987. Regolith materials and erosion
An OSL, radiocarbon and tephra isochron-based chronology processes on the Port Hills, Christchurch, New Zealand. In: 5th
for Birdlings Flat loess at Ahuriri Quarry, Banks Peninsula, Can- International Conference & Field Workshop on Landslides.
terbury, New Zealand. Quateranary Geochronology 2(1–4): Christchurch, pp. 93–105.
4–8, DOI: 10.1016/J.QUAGEO.2006.06.002. Berger GW, Pillans BJ and Tonkin PJ, 2001. Luminescence chronolo-
Alloway BV, Pillans BJ, Sandhu AS and Westgate JA, 1993. gy of loess-paleosol sequences from Canterbury, South Island,
Revision of the marine chronology in the Wanganui Basin, New Zealand. New Zealand Journal of Geology and Gheophys-
New Zealand, based on isothermal plateau fission-track ics 44(4): 501–516, DOI: 10.1080/00288306.2001.9514952.
dating of tephra horizons. Sedimentary Geology 82(1–4): Berger GW, Pillans BJ, Bruce JG and McIntosh PD, 2002. Lumines-
299–310, DOI: 10.1016/0037-0738(93)90128-R. cence chronology of loess-paleosol sequences from southern
Alloway BV, Lowe DJ, Barrell DJ, Newnham RM, Almond PC, Au- South Island, New Zealand. Quaternary Science Reviews 21(16–
gustinus PC, Bertler NA, Carter L, Litchfield NJ, McGlone MS, 17): 1899–1913, DOI: 10.1016/S0277-3791(02)00021-5.
Shulmeister J, Vandergoes M, Williams P and NZ-INTIMATE Borella J, Quigley M, Sohbati R, Almond P, Gravley DM and
Members, 2007. Towards a climate event stratigraphy for Murray A, 2016. Chronology and processes of late Quater-
New Zealand over the past 30,000 years (NZ-INTIMATE nary hillslope sedimentation in the Eastern South Island,
project). Journal of Quaternary Science 22(1): 9–35, New Zealand. Journal of Quaternary Science 31(7): 691–712,
DOI: 10.1002/JQS.1079. DOI: 10.1002/JQS.2905.
Avram A, Constantin D, Veres D, Kelemen S, Obreht I, Hambach Bøtter-Jensen L, Larsen NA, Mejdahl, V, Poolton NR, Morris, MF,
U, Marković SB and Timar-Gabor A, 2020. Testing polymineral McKeever, SW, 1995. Luminescence sensitivity changes in
57GEOCHRONOMETRIA | LUMINESCENCE PROPERTIES OF QUARTZ AND FELDSPARS IN NEW ZEALAND LOESS
quartz as a result of annealing. Radiation Measurement 24(4): man F, 2015. OSL-thermochronometry using bedrock quartz:
535–541, DOI: 10.1016/1350-4487(95)00006-Z. A note of caution. Quaternary Geochronology 25: 37–48,
Buylaert JP, Murray AS and Thomsen KJ, 2009. Testing the po- DOI: 10.1016/j.quageo.2014.09.001.
tential of an elevated temperature IRSL signal from K-feldspar. Hammond AP, Goh KM, Tonkin PJ and Manning MR, 1991.
Radiation Measurements 44(5–6): 560–565, DOI: 10.1016/J. Chemical pretreatments for improving the radiocarbon
RADMEAS.2009.02.007. dates of peats and organic silts in a gley podzol envi-
Buylaert JP, Huot S, Murray AS and Van Den Haute P, 2011a. ronment: Grahams Terrace, North Westland. New Zea-
Infrared stimulated luminescence dating of an Eemian (MIS land Journal of Geology and Geophysics 34(2): 191–194,
5e) site in Denmark using K-feldspar. Boreas 40(1): 46–56, DOI: 10.1080/00288306.1991.9514456.
DOI: 10.1111/J.1502-3885.2010.00156.X. Hansen V, Murray A, Buylaert JP, Yeo EY and Thomsen K, 2015.
Buylaert JP, Thiel C, Murray A, Vandenberghe D, Yi S and Lu A new irradiated quartz for beta source calibration. Radi-
H, 2011b. IRSL and post-IR IRSL residual doses recorded ation Measurements 81: 123–127, DOI: 10.1016/J.RAD-
in modern dust samples from the Chinese loess plateau. MEAS.2015.02.017.
Geochronometria 38(4): 432–440, DOI: 10.2478/s13386- Holdaway RN, Roberts RG, Beavan-Athfield NR, Olley JM and
011-0047-0. Worthy TH, 2002. Optical dating of quartz sediments and
Buylaert JP, Jain M, Murray AS, Thomsen KJ, Thiel C and Sohba- accelerator mass spectrometry 14C dating of bone gel-
ti R, 2012. A robust feldspar luminescence dating method atin and moa eggshell: A comparison of age estimates
for Middle and Late Pleistocene sediments. Boreas 41(3): for non-archaeological deposits in New Zealand. Jour-
435–451, DOI: 10.1111/J.1502-3885.2012.00248.X. nal of the Royal Society of New Zealand 32(3): 463–505,
Campbell IB, 1986. New occurrences and distribution of Ka- DOI: 10.1080/03014223.2002.9517705.
wakawa Tephra in South Island, New Zealand. New Zea- Hormes A, Preusser F, Denton G, Hajdas I, Weiss D, Stocker TF
land Journal of Geology and Geophysics 29(4): 425–435, and Schlüchter C, 2003. Radiocarbon and luminescence dat-
DOI: 10.1080/00288306.1986.10422164. ing of overbank deposits in outwash sediments of the Last
Chruścińska A, Oczkowski HL, Przegiętka K, 1996. Trap spectra Glacial Maximum in North Westland, New Zealand. New
of annealed quartz. Acta Physica Polonica A 4(89): 555–568. Zealand Journal of Geology and Geophysics 46(1): 95–106,
http://repozytorium.umk.pl/handle/item/1917. DOI: 10.1080/00288306.2003.9514998.
Dietze M, Kreutzer S, Fuchs MC, Burrow C, Fischer M and Schmidt Huntley DJ and Lamothe M, 2001. Ubiquity of anomalous fad-
C, 2013. A practical guide to the R package luminescence. An- ing in K-feldspars and the measurement and correction for
cient TL 31(1): 11–18. it in optical dating. Canadian Journal of Earth Sciences 38(7):
Duller GA, 2003. Distinguishing quartz and feldspars in single 1093–1106, DOI: 10.1139/E01-013.
grain luminescence measurements. Radiation Measurements Kohn BP, Pillans B and McGlone MS, 1992. Zircon fission track
37(2): 161–165, DOI: 10.1016/S1350-4487(02)00170-1. age for middle Pleistocene Rangitawa Tephra, New Zealand:
Eden DN, Froggatt PC and Mclntosh PD, 1992. The distribution Stratigraphic and paleoclimatic significance. Palaeogeog-
and composition of volcanic glass in late Quaternary loess de- raphy, Palaeoclimatology, Palaeoecology 95(1–2): 73–94,
posits of Southern South Island, New Zealand, and some pos- DOI: 10.1016/0031-0182(92)90166-3.
sible correlations. New Zealand Journal of Geology and Geo- Krishnan RS, 1945. Raman spectrum of quartz. Nature 155(3937):
physics 35(1): 69–79, DOI: 10.1080/00288306.1992.9514501. 452, DOI: 10.1038/155452a0.
Eden DN and Hammond AP, 2003. Dust accumulation in the Lang A, Lindauer S, Kuhn R and Wagner GA, 1996. Procedures
New Zealand region since the last glacial maximum. Quater- used for optically and infrared stimulated luminescence dat-
nary Science Reviews 22(18–19): 2037–2052, DOI: 10.1016/ ing of sediments in Heidelberg. Ancient TL 14(3): 7–11.
S0277-3791(03)00168-9. Lapp T, Kook M, Murray AS, Thomsen KJ, Buylaert JP and Jain M,
Frechen M, Schweitzer U and Zander A, 1996. Improvements in 2015. A new luminescence detection and stimulation head
sample preparation for the fine grain technique. Ancient TL for the Risø TL/OSL reader. Radiation Measurements 81: 178–
14(2): 15–17. 184, DOI: 10.1016/J.RADMEAS.2015.02.001.
Goh KM, Tonkin PJ and Rafter TA, 1978. Implications of improved Litchfield NJ and Lian OB, 2004. Luminescence age estimates of
radiocarbon dates of Timaru peats on Quaternary loess stra- Pleistocene marine terrace and alluvial fan sediments associ-
tigraphy. New Zealand Journal of Geology and Geophysics ated with tectonic activity along coastal Otago, New Zealand.
21(4): 463–466, DOI: 10.1080/00288306.1978.10424071. New Zealand Journal of Geology and Geophysics 47(1): 29–37,
Guérin G, Mercier N and Adamiec G, 2011. Dose-rate conversion DOI: 10.1080/00288306.2004.9515035.
factors: Update. Ancient TL 29(1): 5–8. Litchfield NJ and Rieser U, 2005. Optically stimulated lumines-
Guralnik B, Ankjærgaard C, Jain M, Murray AS, Müller A, Wälle M, cence age constraints for fluvial aggradation terraces and
Lowick SE, Preusser F, Rhodes EJ, Wu TS, Mathew G, Her- loess in the Eastern North Island, New Zealand. New Zea-
58D. BREZEANU ET AL.
land Journal of Geology and Geophysics 48(4): 581–589, Reviews 24(20–21): 2207–2227, DOI: 10.1016/J.QUASCI-
DOI: 10.1080/00288306.2005.9515135. REV.2004.12.005.
Martini M, Fasoli M and Villa, I, 2014. Defect studies in quartz: Preusser F, Ramseyer K and Schlüchter C, 2006. Characterisation
Composite nature of the blue and UV emissions. Nuclear In- of low OSL intensity quartz from the New Zealand Alps. Radi-
struments and Methods in Physics Research B, 327: 15–21, ation Measurements 41(7–8): 871–877, DOI: 10.1016/J.RAD-
DOI 10.1016/J.NIMB.2013.09.048. MEAS.2006.04.019.
Murray AS, 1996. Developments in optically stimulated lumi- Preusser F, Chithambo ML, Götte T, Martini M, Ramseyer K, Send-
nescence and photo-transferred thermoluminescence dat- ezera EJ, Susino GJ, Wintle AG, 2009. Quartz as a natural lumi-
ing of young sediments: Application to a 2000-years of flood nescence dosimeter. Earth Science Reviews 97(1/4): 184–214.
deposits. Geochimica et Cosmochimica Acta 60(4): 565–576, DOI: 10.1016/j.earscirev.2009.09.006.
DOI: 10.1016/0016-7037(95)00418-1. Raeside JD, 1964. Loess deposits of the South Island,
Murray AS and Wintle AG, 2000. Luminescence dating using New Zealand, and soils formed on them. New Zea-
an improved single-aliquot regenerative-dose protocol. land Journal of Geology and Geophysics 7(4): 811–838,
Radiation Measurements 32: 57–73, DOI: 10.1016/S1350- DOI: 10.1080/00288306.1964.10428132.
4487(99)00253-X. Rees-Jones J, 1995. Optical dating of young sediments using fine-
Murray AS and Wintle AG, 2003. The single aliquot regenerative grain quartz. Ancient TL 13(2): 9–13.
dose protocol: Potential for improvements in reliability. Radi- Rother H, Shulmeister J and Rieser U, 2009. Stratigraphy, optical
ation Measurements 37(4–5): 377–381, DOI: 10.1016/S1350- dating chronology (IRSL) and depositional model of pre-LGM
4487(03)00053-2. glacial deposits in the Hope Valley, New Zealand. Quaternary Sci-
Murray AS, Thomsen KJ, Masuda N, Buylaert JP and Jain M, 2012. ence Reviews, 1–17, DOI: 10.1016/J.QUASCIREV.2009.11.001.
Identifying well-bleached quartz using the different bleach- Rowan AV, Roberts HM, Jones MA, Duller GA, Covey-Crump SJ
ing rates of quartz and feldspar luminescence signals. Radi- and Brocklehurst SH, 2012. Optically stimulated luminescence
ation Measurements 47(9): 688–695, DOI: 10.1016/J.RAD- dating of glaciofluvial sediments on the Canterbury Plains,
MEAS.2012.05.006. South Island, New Zealand. Quaternary Geochronology 8:
Murray AS, Schmidt ED, Stevens T, Buylaert JP, Marković SB, 10–22, DOI: 10.1016/J.QUAGEO.2011.11.013.
Tsukamoto S and Frechen M, 2014. Dating middle pleistocene Schilles T, Poolton NRJ, Bulur EN, Bøtter-Jensen L, Murray AS,
loess from Stari Slankamen (Vojvodina, Serbia) – Limitations Smith GM, Riedi PC and Wagner GA, 2001. A multi-spectro-
imposed by the saturation behaviour of an elevated temper- scopic study of luminescence sensitivity changes in natural
ature IRSL signal. Catena 117: 34–42, DOI: 10.1016/J.CATE- quartz induced by high-temperature annealing. Journal of
NA.2013.06.029. Physics D 34(5): 722–731, DOI: 10.1088/0022-3727/34/5/310.
Nichol SL, Lian OB and Carter CH, 2003. Sheet-gravel evidence Shulmeister J, Thackray GD, Rieser U, Hyatt OM, Rother H, Smart
for a late Holocene tsunami run-up on beach dunes, Great CC and Evans DJ, 2010. The stratigraphy, timing and climat-
Barrier Island, New Zealand. Sedimentary Geology 155(1–2): ic implications of glaciolacustrine deposits in the middle
129–145, DOI: 10.1016/S0037-0738(02)00191-4. Rakaia Valley, South Island, New Zealand. Quaternary Science
Pillans B, 1991. New Zealand Quaternary stratigraphy: An Reviews 29(17–18): 2362–2381, DOI: 10.1016/J.QUASCI-
overview. Quaternary Science Reviews 10(5): 405–418, REV.2010.06.004.
DOI: 10.1016/0277-3791(91)90004-E. Sohbati R, Murray AS, Buylaert JP, Ortuno M, Cunha PP and
Pillans B, 1994. Direct marine-terrestrial correlations, Wan- Masana E, 2012. Luminescence dating of Pleistocene alluvial
ganui Basin, New Zealand: The last 1 million years. Quater- sediments affected by the Alhama de Murcia fault (eastern
nary Science Reviews 13(3): 189–200, DOI: 10.1016/0277- Betics, Spain) – A comparison between OSL, IRSL and post-
3791(94)90024-8. IR IRSL ages. Boreas 41(2): 250–262, DOI: 10.1111/J.1502-
Pillans B, Kohn BP, Berger G, Froggatt P, Duller G, Alloway B and 3885.2011.00230.X.
Hesse P, 1996. Multi-method dating comparison for mid-Pleis- Sohbati R, Borella J, Murray A, Quigley M and Buylaert JP, 2016.
tocene Rangitawa Tephra, New Zealand. Quaternary Sci- Optical dating of loessic hillslope sediments constrains timing
ence Reviews (Quaternary Geochronology) 15(7): 641–654, of prehistoric rockfall, Christchurch, New Zealand. Journal of
DOI: 10.1016/0277-3791(96)00035-2. Quaternary Science 31(7): 678–690, DOI: 10.1002/JQS.2895.
Prescott JR and Hutton JT, 1994. Cosmic ray contributions to Sparrow CL, 1948. Loess Deposits of Banks Peninsula. Unpub-
dose rates for luminescence and ESR dating: Large depths and lished MA Thesis University of New Zealand.
long-term variations. Radiation Measurements 23: 497–500, Stevens T, Marković SB, Zech M, Hambach U and Sümegi P, 2011.
DOI: 10.1016/1350-4487(94)90086-8. Dust deposition and climate in the Carpathian Basin over an
Preusser F, Andersen BG, Denton GH and Schlüchter C, 2005. independently dated last glacial-interglacial cycle. Quaternary
Luminescence chronology of Late Pleistocene glacial de- Science Reviews 30(5–6): 662–681, DOI: 10.1016/J.QUASCI-
posits in North Westland, New Zealand. Quaternary Science REV.2010.12.011.
59GEOCHRONOMETRIA | LUMINESCENCE PROPERTIES OF QUARTZ AND FELDSPARS IN NEW ZEALAND LOESS
Suggate RP, 1990. Late pliocene and quaternary glaciations of Wallinga J, Murray A and Duller G, 2000. Underestimation of
New Zealand. Quaternary Science Reviews 9(2–3): 175–197, equivalent dose in single-aliquot optical dating of feldspars
DOI: 10.1016/0277-3791(90)90017-5. caused by preheating. Radiation Measurements 32(5–6):
Thiel C, Buylaert JP, Murray A, Terhorst B, Hofer I, Tsukamoto S 691–695, DOI: 10.1016/S1350-4487(00)00127-X.
and Frechen M, 2011. Luminescence dating of the Stratzing Wilson CJ, Switsur VR and Ward AP, 1988. A new 14C age for the
loess profile (Austria) – Testing the potential of an elevated Oruanui (Wairakei) eruption, New Zealand. Geological Mag-
temperature post-IR IRSL protocol. Quaternary International azine 125(3): 296–300, DOI: 10.1017/S0016756800010232.
234(1–2): 23–31, DOI: 10.1016/J.QUAINT.2010.05.018. Yang XH and McKeever SW, 1990. The pre-dose effect in
Thomsen K, Murray A and Jain M, 2011. Stability of IRSL signals crystalline quartz. Journal of Physics D 23(2): 237–244,
from sedimentary K-feldspar samples. Geochronometria DOI: 10.1088/0022-3727/23/2/017.
38(1): 1–13, DOI: 10.2478/s13386-011-0003-z. Yates K, Fenton CH and Bell DH, 2018. A review of the geotech-
Toyoda S, Hattori W, 2000. Formation and decay of the E1’ center nical characteristics of loess and loess-derived soils from Can-
and of its precursor. Applied Radiation and Isotopes 52(5): terbury, South Island, New Zealand. Engineering Geology 236:
1351–1356. DOI: 10.1016/S0969-8043(00)00094-4. 11–21, DOI: 10.1016/J.ENGGEO.2017.08.001.
Vasiliniuc Ș, Vandenberghe DA, Timar-Gabor A, Panaiotu C and Yi S, Buylaert JP, Murray AS, Lu H, Thiel C and Zeng L, 2016. A de-
Cosma C, 2012. Testing the potential of elevated temperature tailed post-IR IRSL dating study of the Niuyangzigou loess site
post-IR IRSL signals for dating Romanian loess. Quaternary Ge- in northeastern China. Boreas 45(4): 644–657, DOI: 10.1111/
ochronology 10: 75–80, DOI: 10.1016/J.QUAGEO.2012.02.014. BOR.12185.
Veres D, Tecsa V, Gerasimenko N, Zeeden C, Hambach U and Yi S, Li X, Han Z, Lu H, Liu J and Wu J, 2018. High resolution lu-
Timar-Gabor A, 2018. Short-term soil formation events in last minescence chronology for Xiashu Loess deposits of South-
glacial east European loess, evidence from multi-method lu- ern China. Journal of Asian Earth Sciences 155: 188–197,
minescence dating. Quaternary Science Reviews 200: 34–51, DOI: 10.1016/J.JSEAES.2017.11.027.
DOI: 10.1016/J.QUASCIREV.2018.09.037. Young DJ, 1964. Stratigraphy and petrography of North-East
Veronese I, Giussani A, Goksu HY, Martini M, 2004. The trap pa- Otago Loess. New Zealand Journal of Geology and Geo-
rameters of electrons in intermediate energy levels in quartz. physics 7(4): 839–863, DOI: 10.1080/00288306.1964.
Radiation Measurements 38(4–6): 743–746, DOI: 10.1016/j. 10428133.
radmeas.2004.01.012. Zhang J, Rolf C, Wacha L, Tsukamoto S, Durn G and Frechen M,
Wacha L and Frechen M, 2011. The geochronology of the 2018. Luminescence dating and palaeomagnetic age con-
“Gorjanović loess section” in Vukovar, Croatia. Quater- straint of a last glacial loess-paleosol sequence from Istria,
nary International 240(1–2): 87–99, DOI: 10.1016/J. Croatia. Quaternary International 494: 19–33, DOI: 10.1016/J.
QUAINT.2011.04.010. QUAINT.2018.05.045.
60You can also read


