Highly time-resolved characterization of carbonaceous aerosols using a two-wavelength Sunset thermal-optical carbon analyzer - Recent
←
→
Page content transcription
If your browser does not render page correctly, please read the page content below
Atmos. Meas. Tech., 14, 4053–4068, 2021
https://doi.org/10.5194/amt-14-4053-2021
© Author(s) 2021. This work is distributed under
the Creative Commons Attribution 4.0 License.

Highly time-resolved characterization of carbonaceous aerosols
using a two-wavelength Sunset thermal–optical carbon analyzer
Mengying Bao1,2,3 , Yan-Lin Zhang1,2,3 , Fang Cao1,2,3 , Yu-Chi Lin1,2,3 , Yuhang Wang4 , Xiaoyan Liu1,2,3 ,
Wenqi Zhang1,2,3 , Meiyi Fan1,2,3 , Feng Xie1,2,3 , Robert Cary5 , Joshua Dixon5 , and Lihua Zhou6
1 Yale–NUIST   Center on Atmospheric Environment, Joint International Research Laboratory of Climate and Environment
Change (ILCEC), Nanjing University of Information Science and Technology, Nanjing 210044, China
2 Key Laboratory of Meteorological Disaster Ministry of Education (KLME), Collaborative Innovation Center on Forecast

and Evaluation of Meteorological Disasters (CIC-FEMD), Nanjing University of Information Science and Technology,
Nanjing 210044, China
3 School of Applied Meteorology, Nanjing University of Information Science and Technology, Nanjing 210044, China
4 School of Earth and Atmospheric Sciences, Georgia Institute of Technology, Atlanta, GA 30332, USA
5 Sunset Laboratory, 1080 SW Nimbus Avenue, Suite J/5, Tigard, OR 97223, USA
6 College of Global Change and Earth System Science, Beijing Normal University, Beijing 100875, China

Correspondence: Yan-Lin Zhang (dryanlinzhang@outlook.com)

Received: 24 August 2020 – Discussion started: 9 November 2020
Revised: 22 April 2021 – Accepted: 26 April 2021 – Published: 3 June 2021

Abstract. Carbonaceous aerosols have great influence on         ever, dEC was significantly affected by regional or long-
the air quality, human health and climate change. Except        range transport. The dEC/OC and OC/EC ratios showed
for organic carbon (OC) and elemental carbon (EC), brown        similar diurnal patterns, and the dEC/OC increased when the
carbon (BrC) mainly originates from biomass burning as a        OC/EC ratios increased, indicating strong secondary sources
group of OC, with strong absorption from the visible to near-   or biomass burning contributions to dEC. A total of two
ultraviolet wavelengths, and makes a considerable contribu-     biomass burning events both in summer and winter were
tion to global warming. Large numbers of studies have re-       analyzed, and the results showed that the dEC concentra-
ported long-term observation of OC and EC concentrations        tions were obviously higher on biomass burning days; how-
throughout the world, but studies of BrC based on long-         ever, no similar levels of the OC and EC concentrations were
term observations are rather limited. In this study, we es-     found both in biomass burning days and normal days in sum-
tablished a two-wavelength method (658 and 405 nm) ap-          mer, suggesting that biomass burning emissions made a great
plied in the Sunset thermal–optical carbon analyzer. Based      contribution to dEC, and the sources of OC and EC were
on a 1-year observation, we firstly investigated the charac-    more complicated. Large number of open fire counts from
teristics, meteorological impact and transport process of OC    the northwestern and southwestern areas of the study site
and EC. Since BrC absorbs light at 405 nm more effec-           were observed in winter and significantly contributed to OC,
tively than 658 nm, we defined the enhanced concentrations      EC and dEC. In addition, the nearby Yangtze River Delta
(dEC = EC405 nm − EC658 nm ) and gave the possibility of pro-   area was one of the main potential source areas of dEC,
viding an indicator of BrC. The receptor model and MODIS        suggesting that anthropogenic emissions could also be im-
fire information were used to identify the presence of BrC      portant sources of dEC. The results proved that dEC can be
aerosols. Our results showed that the carbonaceous aerosol      an indicator of BrC on biomass burning days. Our modified
concentrations were the highest in winter and lowest in sum-    two-wavelength instrument provided more information than
mer. Traffic emission was an important source of carbona-       the traditional single-wavelength thermal–optical carbon an-
ceous aerosols in Nanjing. Receptor model results showed        alyzer and gave a new idea about the measurement of BrC;
that strong local emissions were found for OC and EC; how-      the application of dEC data needs to be further investigated.

Published by Copernicus Publications on behalf of the European Geosciences Union.
4054                                          M. Bao et al.: Highly time-resolved characterization of carbonaceous aerosols

1   Introduction                                                    shifts this separation towards EC, resulting in overestimated
                                                                    EC values and underestimated OC values (Chen et al., 2015;
Carbonaceous aerosols, including organic carbon (OC) and            Birch and Cary, 1996).
elemental carbon (EC), which have significant influence on             Sandradewi et al. (2008) pointed out that light absorption
the global radiative transfer, human health and atmospheric         measurements at different wavelengths by the Aethalome-
visibility, have been the focus of research in the atmospheric      ter can be used to quantify the contributions of wood com-
environment field for many years (Lelieveld et al., 2015; Wu        bustion and traffic emissions to aerosols since wood smoke
and Yu, 2016; Wang et al., 2018; Zhang et al., 2017, 2019;          contains organic compounds which enhance the light ab-
Liu et al., 2019). EC mainly originates from fossil fuel and        sorption in the ultraviolet wavelength. But traffic emis-
biomass combustion and is estimated to be the second-largest        sions produce more black carbon (BC), which dominates the
warming factor behind CO2 contributing to climate change            light absorption in the near-infrared wavelength. They used
(Liu et al., 2015; Zhang and Kang, 2019; Cao and Zhang,             Aethalometer data measured at 470 and 950 nm to quantify
2015). OC originates both from primary emissions and gas-           the BC distinction between wood burning and traffic emis-
to-particle conversion as secondary organic carbon (SOC)            sion. With a similar principle, Wang et al. (2011) used a
and can scatter the solar radiation, which causes negative          two-wavelength Aethalometer (370 and 880 nm) to identify
forcing globally (Zhou et al., 2014; Huang et al., 2014).           the presence of residential wood combustion (RWC) parti-
   In recent decades, brown carbon (BrC), as a kind of light-       cles which were closely associated with BrC. Organic com-
absorbing organic carbon which can absorb light especially          ponents of wood smoke particles absorb light at 370 nm –
from near-UV to visible wavelength, has caused global con-          more effectively than 880 nm in two-wavelength Aethalome-
cern due to its positive climate effect (Andreae and Gelenc-        ter measurements. They believed that the enhanced absorp-
sér, 2006; Zhang et al., 2020). BrC is mainly emitted from          tion (1-C = BC370 nm − BC880 nm ) can serve as an indicator
anthropogenic and biogenic emissions (Zhang et al., 2011).          of RWC particles. This method was further used by Wang
Previous studies have proved that biomass burning and bio-          et al. (2012a, b). Chen et al. (2015) used a modified seven-
fuel combustion are the most important sources of primary           wavelength thermal–optical transmittance/thermal–optical
BrC (Saleh et al., 2014; Wu et al., 2020; Lei et al., 2018). Re-    reflectance (TOT/TOR) instrument (Thermal Spectral Anal-
cent researches reported that, in developing countries such as      ysis – TSA) allowing the determination of the OC–EC
China and India, the contribution of fossil fuel combustion to      split at different wavelengths and light absorption measure-
BrC cannot be ignored (Satish et al., 2017; Yan et al., 2017;       ments to be made with wavelength-specific loading correc-
Kirillova et al., 2014). Secondary BrC is mainly produced           tions, providing additional information including the opti-
by heterogeneous photo-oxidation reactions or aqueous re-           cal properties of BC and BrC from the infrared (IR) to
actions of anthropogenic and biogenic precursors (Zhang et          the ultraviolet (UV) parts of the solar spectrum and their
al., 2011, 2020; Li et al., 2020). However, due to the lack of      contributions. Massabò et al. (2016) further corrected the
understanding of BrC at the molecular level and in situ BrC         OC/EC split point using the multi-wavelength absorbance
data, there are still large uncertainties in the estimates of the   analyzer (MWAA), which provides the aerosol absorbance
distribution and the magnitude of the BrC climate effect in         values at five wavelengths from IR to UV, together with a
both remote sensing and modeling (Arola et al., 2011; Feng          Sunset OC/EC analyzer to achieve the BrC concentration.
et al., 2013).                                                      With a set of samples collected during wintertime in the Lig-
   The thermal–optical analysis (TOA) method is one of the          urian Apennines in Italy, clear correlations were found be-
most widely used quantitative methods for OC and EC mak-            tween the BrC and levoglucosan mass concentration. A fur-
ing use of the difference between the thermal–optical proper-       ther step in BrC quantification, taking the use of TSA, was
ties of OC and EC (Birch and Cary, 1996; Chow et al., 2004).        reported by Chow et al. (2018), further proving that the use of
OC and EC will be volatilized at different heating protocols.       seven wavelengths in thermal–optical carbon analysis allows
The reflectance or transmittance of one laser source (near-         contributions from biomass burning and secondary organic
infrared wavelength) through the sample filter is continu-          aerosols to be estimated. Their results clearly demonstrated
ously monitored, and the return of the reflectance or trans-        the role of BrC in the thermal–optical analysis. However,
mittance to its initial value on the thermograph is taken as        these techniques focus on the light absorption measurement
the split point between OC and EC. In this way, the forma-          of BrC and are still reported in a limited way in previous re-
tion of pyrolyzed carbon, which can also absorb the light           searches, though they provide quartz fiber filter samples that
and make the sample darker, is corrected. This method has           are currently being characterized for OC and EC by thermal–
been widely used in studies employing the National Insti-           optical analysis. These abovementioned methods still can-
tute for Occupational Safety and Health (NIOSH) protocol            not achieve the observation of long-term, real-time BrC mass
or IMPROVE_A protocol (Ji et al., 2016; Chow et al., 2007).         concentrations.
However, the thermal–optical approach assumed that EC is               Since the establishment of the TOT method by Sunset
the only light-absorbing species, and the presence of BrC,          Laboratory, the Sunset OC/EC instrument, as part of the
which is part of OC but also a light-absorbing component,           Chemical Speciation Network (CSN), with over 100 mon-

Atmos. Meas. Tech., 14, 4053–4068, 2021                                              https://doi.org/10.5194/amt-14-4053-2021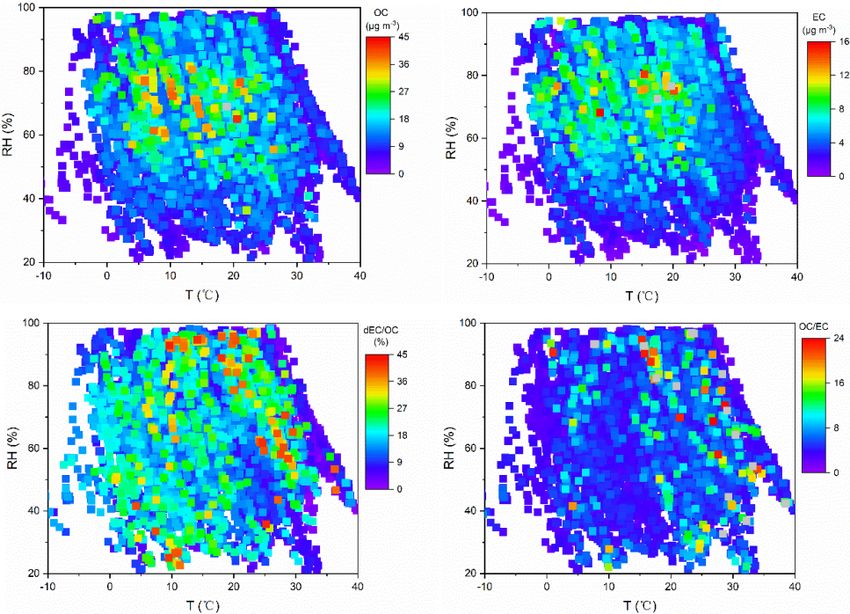
M. Bao et al.: Highly time-resolved characterization of carbonaceous aerosols                                               4055

itors across the United States over 15 years, offering long-       to the east. Therefore, this region has intense human activi-
term measurement of OC and EC concentrations, has been             ties, industrial emissions and heavy traffic flow.
widely used in the United States and throughout the world,
providing important in situ data of OC and EC (US EPA,             2.2   A two-wavelength TOT measurement
2019; Birch and Cary, 1996). This instrument had been de-
signed with a tuned diode laser (red – 660 nm) to correct          Hourly concentrations of OC and EC in PM2.5 were sampled
the formation of pyrolyzed carbon. In this study, we mod-          and measured by a semi-continuous carbon analyzer (Model-
ified the Sunset instrument to a two-wavelength (658 and           4; Sunset Laboratory, USA). Air samples were collected con-
405 nm) Sunset carbon analyzer by adding one more violet           tinuously with a sample flow of ∼ 8 L min−1 through a PM2.5
diode laser at λ = 405 nm. The violet diode laser together         cyclone. The collection time was set at 45 min for each cy-
with the red diode laser focus through the sample chamber,         cle. The airstream passed through a parallel plate organic
and then the laser beam passes through the filter to correct for   denuder to reduce the effect of volatile organic compounds
the pyrolysis-induced error. Previous work reported by Chen        and, finally, deposited on a quartz filter with a diameter of
et al. (2015), as mentioned above, was integrating the optical     ∼ 17 mm.
instrument like the Aethalometer to the traditional OC/EC             After a sample was collected, OC and EC were deter-
analyzer; in this way, they provided the light absorption con-     mined using the TOT method by applying a slightly modi-
tributions of BC and BrC. The enhanced carbon analyzer pro-        fied NIOSH 5040 protocol. The details of the heating setup
vided new insight into more accurate OC and EC measure-            are shown in Table S1 in the Supplement. Figure 1 shows
ments. Their work was conducted in offline mode; based on          the structure and operational principle of the instrument.
their work, our instrument can obtain the real-time OC and         Briefly, it consists of the following two-stages: the oven is
EC mass concentrations at both 658 and 405 nm. BrC parti-          first purged with helium, and the oven temperature increased
cles absorb light at 405 nm, more effectively than 658 nm in       in a stepped ramp to 840 ◦ C; OC is volatilized in this stage.
the two-wavelength Sunset carbon measurements. We define           Then the oven temperature is kept at 840 ◦ C for a while and
dEC = EC405 nm − EC658 nm and hope it can be an indicator          goes down to 550 ◦ C. In the second stage, EC is volatilized in
of BrC aerosols so that we can divide real-time BrC mass           a second temperature ramp to 850 ◦ C, while purging the oven
concentration measurement from the two-wavelength mea-             with a mixture containing 2 % oxygen and 98 % helium. The
surement.                                                          pyrolysis products are converted to carbon dioxide (CO2 ),
    Nanjing, as one of the largest cities in the Yangzi River      which is quantified using a self-contained nondispersive in-
Delta region, represents a heavy industry area with a dense        frared (NDIR) system.
population. In addition, due to its topography, Nanjing is            Also, in this study, we used a two-diode laser-equipped
very sensitive to regional transport of air masses from its        (658 and 405 nm) Sunset analyzer; thus, mass concentrations
surrounding areas. OC, EC and dEC were measured from               of OC and EC at different wavelengths can be measured with
June 2015 to July 2016 at Nanjing University of Informa-           the two-laser system. The split point between OC and EC
tion Science and Technology (NUIST). Based on the abun-            is detected automatically by the RTCalc731 software pro-
dant data, together with MODIS fire information, we can an-        vided by Sunset Laboratory. The principle is the same as
alyze the temporal variation, transport processes and sources      for the traditional Sunset carbon analyzer (Birch and Cary,
of carbonaceous aerosols in northern Nanjing and evaluate          1996). An example thermogram of sample analysis using the
the biomass burning impact on dEC, which can be the scien-         two-wavelength Sunset semi-continuous carbon analyzer is
tific basis of pollution control policy.                           shown in Fig. 2. During the sample analysis, the laser beam at
                                                                   658 and 405 nm are both sent through the filter, and the trans-
                                                                   mitted light signal is monitored to correct the undesired for-
2     Methods                                                      mation of pyrolyzed carbon (PyrC) and then to determine the
                                                                   split point of OC and EC at both wavelengths. BrC aerosols
2.1    Study site                                                  absorb light at 405 nm more significantly than 658 nm in the
                                                                   two-laser system. Due to the strong absorption of BrC at
In this study, the sampling site is located at Nanjing Uni-        the near-ultraviolet wavelength, the enhanced absorption at
versity of Information Science and Technology (NUIST) in           405 nm can serve as an indicator of BrC aerosols (Liu et al.,
the northern suburb of Nanjing (32◦ 2070 N, 118◦ 7170 E). The      2015). We define dEC data as the difference in EC concen-
study site is surrounded by housing and industrial areas.          trations at two wavelengths (dEC = EC405 nm − EC658 nm ) to
Many chemical enterprises, for example, Yangzi Petrochem-          identify the presence of BrC aerosols. Our study provides a
ical, Nanjing Chemical Industry and Nanjing Iron and Steel         1-year measurement of dEC mass concentrations. Addition-
Group are located at the northeast of the study region, which      ally, OC and EC represent the OC and EC concentrations at
produces exhaust fumes with large amounts of aerosol par-          658 nm in this paper without a special explanation.
ticles. The study site is adjacent to a heavily trafficked road       At the end of each analysis, a fixed volume of an inter-
(Ningliu road) located near the site and approximately 600 m       nal standard, containing 5 % methane and 95 % helium, is

https://doi.org/10.5194/amt-14-4053-2021                                            Atmos. Meas. Tech., 14, 4053–4068, 2021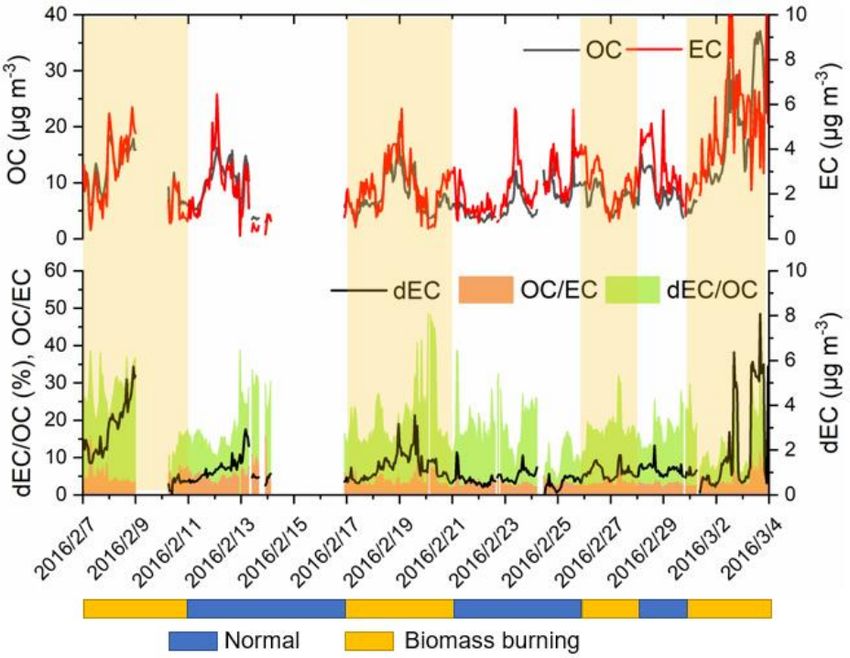
4056                                           M. Bao et al.: Highly time-resolved characterization of carbonaceous aerosols

Figure 1. Principle and structure of the Sunset semi-continuous carbon analyzer.

Figure 2. Example thermogram of sample analysis using the two-wavelength Sunset semi-continuous carbon analyzer.

injected, and thus, a known carbon mass can be derived.                 2.3   Test of the new dEC data
The external sucrose standard (4.207 µg µL−1 ) calibration
was conducted every week to insure repeatable quantifica-               To evaluate the new dEC data, parallel BC concentrations
tion. Calibration with an instrument blank was conducted                were measured with a seven-wavelength Aethalometer with
every day. The detection limit for both OC and EC of the                dEC concentrations in December 2019. Radiation attenua-
instrument was 0.5 µg m−3 . We also did the measurements                tion of an aerosol deposition on a filter (ATNλ ) is determined
of OC and EC in PM2.5 filter samples using the same method              by the Beer–Lambert law as follows:
followed by the NIOSH protocol. All data were corrected                                  I0,λ
to blank measurement before comparison. Figure S1 in the                ATNλ = ln             ,                                        (1)
                                                                                          Iλ
Supplement shows the correlations between the real-time OC
and EC concentrations and sampling OC and EC concentra-                 where I0,λ and Iλ are the measured wavelength-specific laser
tions at the same time. The results showed that the online              reflectance signals. ATNλ is used to calculate the attenuation
and offline data during the corresponding periods had good              coefficient with Eq. (2) as follows:
correlations, with R 2 of 0.8 for OC, R 2 of 0.4 for EC and
R 2 of 0.8 for total carbon (TC). In order to evaluate the im-                     A
                                                                        bATN =       ,                                                 (2)
pact of PyrC, we calculated the PyrC at 658 nm fraction of                         V
dEC, and the average PyrC/dEC was 4.4 %, indicating the                 where A is the filter area, and V is the sampled air volume.
little influence of PyrC.                                               Then a simplified two-component model is used to calculate

Atmos. Meas. Tech., 14, 4053–4068, 2021                                                           https://doi.org/10.5194/amt-14-4053-2021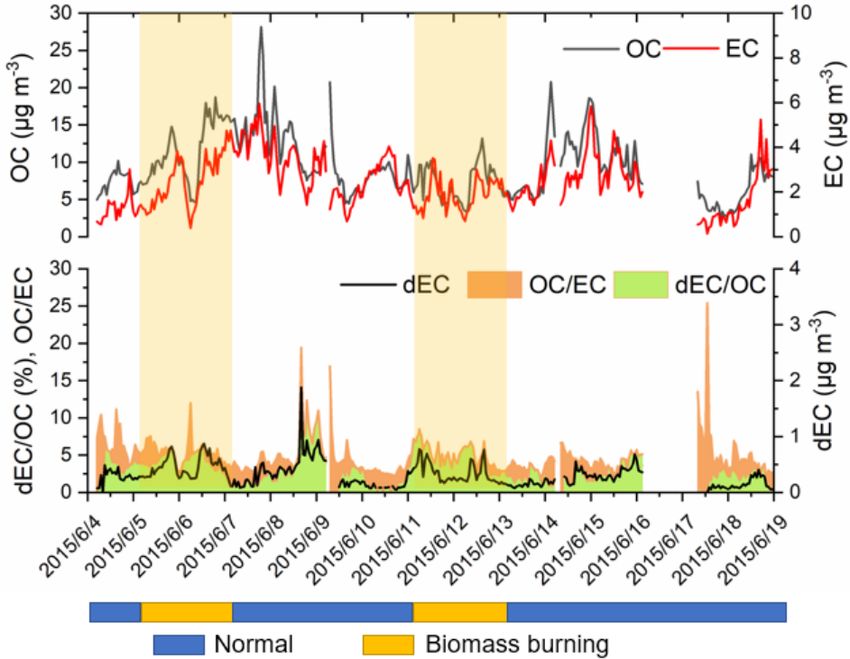
M. Bao et al.: Highly time-resolved characterization of carbonaceous aerosols                                              4057

                                                                  2.4.2    Sample collections

                                                                  PM2.5 in the atmosphere was collected on 8 · 10 inch (0.2 ·
                                                                  0.25 m prebaked quartz fiber filters (QFFs; Pall Corporation,
                                                                  USA) by a high-volume air sampler (KC-1000; Qingdao,
                                                                  China) at a flow rate of 999 L min−1 in 4 months, namely
                                                                  4 to 18 June, 6 October to 2 November, 10 to 31 Decem-
                                                                  ber 2015 and 10 to 31 May 2016. Sampling started and ended
                                                                  at around 08:00 and 20:00 LT (local time), respectively, every
                                                                  day; each sample was collected for 12 h. A total of 148 sam-
                                                                  ples were collected, including four field blanks in the four
                                                                  seasons using 10 min exposure to ambient air without active
                                                                  sampling.
                                                                     All QFFs were prebaked at 450 ◦ C for 6 h before sampling
                                                                  to remove residual carbon. Before and after sampling, all
Figure 3. Relationship between the bATN , due to BrC at 405 nm,   QFFs were weighed with an electronic balance (0.1 mg; Sar-
and the dEC concentrations.                                       torius, Germany). After weighting, the filters were wrapped
                                                                  in aluminum foil, packed in air-tight polyethylene bags and
the contribution of light attenuation to both BC and BrC as       stored at −20 ◦ C until further analysis. All procedures during
follows (Chow et al., 2018; Chen et al., 2015; Sandradewi et      handling of filters were strictly quality controlled to avoid
al., 2008; Hareley et al., 2008):                                 any possible contamination.

bATN (λ) = qBC × λ−AAEBC + qBrC × λ−AAEBrC ,               (3)    2.5     Identification of potential regional sources

where qBC and qBrC are fitting coefficients, and AAE is           The Hybrid Single-Particle Lagrangian Integrated Trajec-
the absorption Ångström exponent, which represents the            tory (HYSPLIT 4.8) model, provided by the National
wavelength-dependent characteristics of light absorption ca-      Oceanic and Atmospheric Administration (NOAA), was
pability of aerosols. The AAE of BC was assumed to be 1.          used to investigate the air mass origins of carbonaceous
Fitting coefficients in Eq. (3) were obtained for potential       aerosols. The 48 h back trajectories at Nanjing (32.2◦ N,
AAEBrC between 1 and 8 by a least squares linear regression,      118.7◦ E) were calculated every hour (Draxler and Hess,
and the AAEBrC leading to the overall best fit in terms of r 2    1998; Rolph et al., 2017; Cohen et al., 2015). In order to
is selected as the effective AAEBrC . Using these fitting coef-   evaluate the behavior of the air mass circulation in the plan-
ficients, the bATN due to BC and BrC are calculated at each       etary boundary layer (PBL), the trajectories at 500 m, cor-
wavelength. Figure S2 shows that the fitted bATN at 405 nm        responding to the upper-middle height of the PBL, were
are within ±5 % of the measured values for bATN > 0.01.           calculated, representing a well-mixed convective boundary
Figure 3 shows the relationship between the bATN due to BrC       layer for regional transport investigation (Xu and Akhtar,
at 405 nm and the dEC. Good correlation between them is           2010). The National Center for Environmental Prediction
found with R 2 of 0.64, indicating that dEC was associated        Global Data Assimilation System (NCEP GDAS) data ob-
with BrC.                                                         tained from NOAA, with a spatial resolution of 1◦ × 1◦ and
                                                                  24 levels of the vertical resolution, were used as meteorologi-
2.4     Sampling                                                  cal data input to the model. The potential source contribution
                                                                  function (PSCF) model was usually applied to localize the
2.4.1    Real-time PM2.5 observation                              potential sources of pollutants. The details about the setup of
                                                                  the model can be found in Bao et al. (2017).
The real-time PM2.5 concentrations were measured through
the tapered element oscillating microbalance (TEOM)
method (TEOM 1405-DF; Thermo Scientific, USA) from                3     Results and discussion
August 2015 to July 2016. The resolution of the measured
data was 6 min. The instrumental operation maintenance,           3.1     Characteristics of carbonaceous aerosols
data assurance and quality control were performed according
to the Chinese Ministry of Environmental Protection Stan-         3.1.1    Concentrations of carbonaceous aerosols
dards for PM10 and PM2.5 , which was named “HJ 653-2013”
(Zhang and Cao, 2015b).                                           The statistics for the PM2.5 , OC, EC and dEC mass
                                                                  concentrations at the NUIST site are summarized in Ta-
                                                                  ble 1. The hourly OC concentrations ranged from 0.5 to
                                                                  45.8 µg m−3 (average of 8.9 ± 5.5 µg m−3 ), and the EC con-

https://doi.org/10.5194/amt-14-4053-2021                                             Atmos. Meas. Tech., 14, 4053–4068, 2021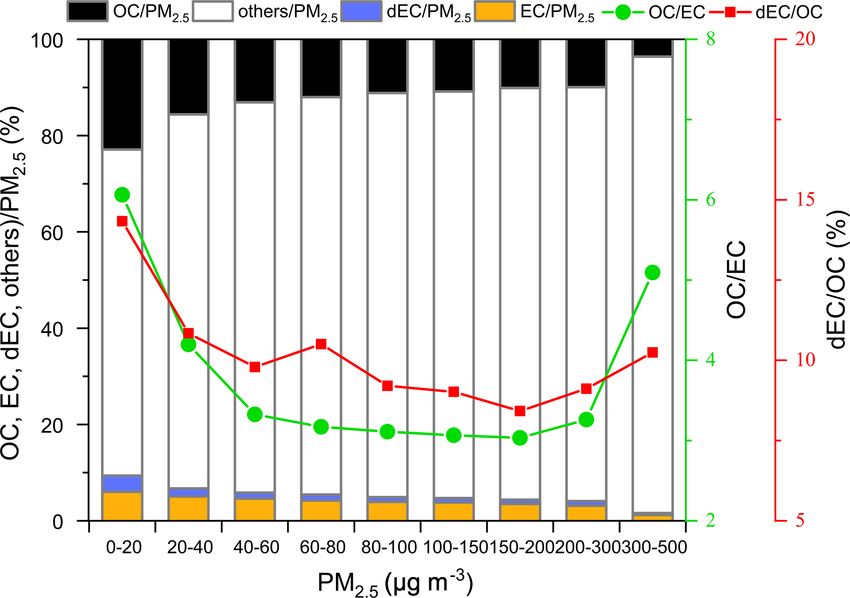
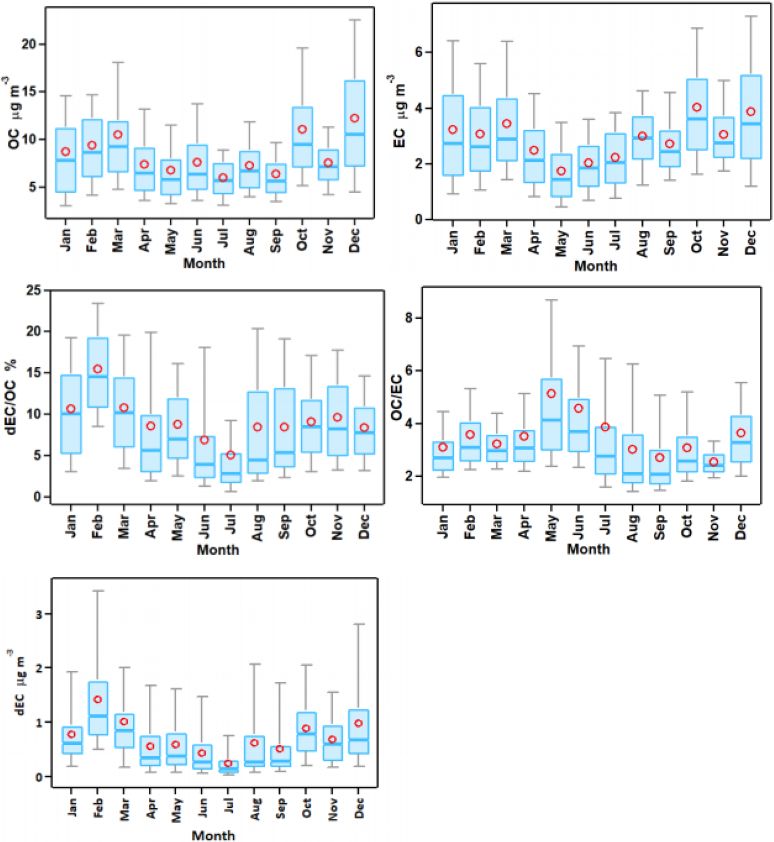
4058                                          M. Bao et al.: Highly time-resolved characterization of carbonaceous aerosols

centrations ranged from 0.0 to 17.6 µg m−3 (average of 3.1 ±
2.0 µg m−3 ). The results are comparable to those reported by
Chen et al. (2017) in the Xianlin Campus of Nanjing Univer-
sity (5.7 µg m−3 for OC and 3.2 µg m−3 for EC), for which
the site was located in the southeastern suburb of Nanjing
and close to the G25 highway and was also affected by traf-
fic sources. The higher OC concentrations in this study are
probably due to the chemical enterprise emissions. The aver-
age contributions of OC and EC to the total measured PM2.5
mass were 12.8 % and 4.3 %, respectively, suggesting that
carbonaceous fraction made an important contribution to fine
particulate matter. The average dEC mass concentration was
0.8 µg m−3 , contributing 10.0 % to OC, 22.3 % to EC and
1.3 % to the PM2.5 concentrations, with a maximum con-
centration of 8.1 µg m−3 contributing 48.2 % to OC, 97.8 %
to EC and 17.6 % to total PM2.5 concentrations. This infor-         Figure 4. Carbonaceous species fractions of PM2.5 and OC/EC
mation can be further applied in the positive matrix factoriza-     ratios at different PM2.5 concentration intervals at NUIST from
tion (PMF) analysis to evaluate the sources of the carbona-         June 2015 to August 2016.
ceous aerosols (Zhu et al., 2014; Sahu et al., 2011; Yan et al.,
2019).
   Compared with carbonaceous aerosol levels in other cities        events in Nanjing, which was also found in other cities in
(Table S2), the OC and EC concentrations in Nanjing were            the Yangtze River Delta area (Yang et al., 2011; Zhang and
generally lower than those observed in urban sites, such as         Zhang, 2019). The contribution of dEC to OC decreased with
Beijing and Shanghai, and inland cities, like Chengdu and           the increase in PM2.5 concentrations between 0–200 µg m−3
Chongqing, which are affected by the basin terrain character-       and then increased with the increase in PM2.5 concentra-
istics, with static wind and unfavorable diffusion conditions,      tions between 200–500 µg m−3 . The dEC contributed most
but higher than those observed in the southern coastal cities       significantly to OC of 14.3 % for PM2.5 concentrations be-
such as Guangzhou, which is a megacity in China. The rea-           low 20 µg m−3 . A similar trend was found for the OC/EC
son for this could be that the site in Guangzhou is a rural site.   ratios, which showed a sharp increase along with enhanced
In general, the level of carbonaceous aerosol concentrations        PM2.5 level above 150 µg m−3 . Previous studies have re-
in China is higher than that in developed countries, such as        ported that high OC/EC ratios were related to SOC for-
the United States and countries in Europe, and lower than           mation or biomass burning emissions, whereas low OC/EC
that in developing countries, like India, though the sampling       ratios were related to vehicle exhaust (Wang et al., 2015).
period in India was from late autumn to winter, and the much        We divided the dEC/OC at different intervals of OC/EC ra-
higher concentrations in India indicated the heavy pollution        tios and found that the dEC/OC increased when the OC/EC
level. The average OC/EC ratio in this study was 3.6, which         ratios increased in the four seasons, indicating strong sec-
is lower than most of those reported in other studies, indicat-     ondary sources or biomass burning contributions to dEC dur-
ing the important impact of vehicle emissions at our study          ing heavy pollution periods (Fig. S3).
site.
   Figure 4 shows the mass fractions of hourly carbonaceous         3.1.2   Seasonal variations in carbonaceous aerosols
aerosols and OC/EC ratios at different PM2.5 concentra-
tion intervals during the study period. During that period,         As shown in Fig. 5, the OC, EC and dEC concentrations and
84.2 % of the PM2.5 samples exceeded the daily averaged             dEC/OC ratios showed similar variations, with the highest in
Chinese National Ambient Air Quality Standard (NAAQS)               winter and lowest in summer. The average OC and EC con-
of 35.0,µg m−3 for the first grade and 40.1 % of the total          centration in winter was ∼ 1.4 times and 1.5 times higher
samples exceeded the NAAQS of 75.0 µg m−3 for the second            than that in summer, and the average dEC concentrations and
grade, reflecting heavy aerosol pollution in the study area.        dEC/OC in winter were approximately 1.4 and 1.6 times
Generally, the fractions of carbonaceous components de-             higher than those in summer (Table 1). High dEC/OC was
creased with increasing PM2.5 pollution level. A larger mass        found in January and February in winter, indicating the
fraction (about 32.3 %) of carbonaceous aerosols in PM2.5           strong influence of anthropogenic sources on dEC, such as
was found for relatively lower PM2.5 levels (0–20 µg m−3 )          coal combustion. In addition, we found strong biomass burn-
compared to high PM2.5 levels (300–500 µg m−3 ), with a             ing activities in February, which significantly contributed to
carbonaceous aerosol mass fraction of 5.2 %. The results            the high concentrations of dEC in February; more details
indicate that other components, like secondary inorganic            can be found in Sect. 3.3. The seasonality of carbonaceous
aerosol (SIA), contribute more significantly to heavy haze          species in PM2.5 was strongly influenced by the seasonal

Atmos. Meas. Tech., 14, 4053–4068, 2021                                              https://doi.org/10.5194/amt-14-4053-2021
M. Bao et al.: Highly time-resolved characterization of carbonaceous aerosols                                                 4059

Table 1. Statistical summary on the PM2.5 and carbon species concentrations.

            N = 5113                                Annual
                                Average    Standard    Median     Min     Max     Spring   Summer     Autumn     Winter
                                           deviation                             average    average   average   average
            PM2.5 (µg m−3 )        77.2         48.6      65.0    2.5    458.1      72.1      47.9       70.5      91.8
            OC (µg m−3 )            8.9          5.5       7.5    0.5     45.8       8.4       7.2        8.4      10.2
            EC (µg m−3 )            3.1          2.0       2.6    0.0     17.6       2.6       2.3        3.3       3.4
            OC/EC                   3.5          2.4       2.9    1.0     29.3       3.9       4.0        2.8       3.4
            dEC (µg m−3 )           0.8          0.8       0.6    0.0      8.1       0.8       0.5        0.7       1.1
            dEC/OC (%)             10.0          7.2       8.6    0.0     48.2       9.5       6.9        9.0      11.3
            dEC/EC (%)             22.3         16.7      18.5    0.1     97.8      24.5      18.2       18.7      25.9
            OC/PM2.5 (%)           12.8          5.6      11.6    0.7     66.2      13.2      14.4       14.1      11.1
            EC/PM2.5 (%)            4.3          2.3       3.9    0.0     33.2       3.9       4.7        5.8       3.7
            dEC/PM2.5 (%)           1.3          1.2       0.9    0.0     17.6       1.4       1.3        1.2       1.3

Figure 5. Monthly variations in OC, EC and dEC and dEC/OC and OC/EC ratios at NUIST from June 2015 to August 2016. The boundary
of the box indicates the 25 % and 75 % percentile, respectively. The lower and upper whiskers indicate the 10 % and 90 % percentile,
respectively. The red circle within the box marks the average, while the line within the box marks the median.

https://doi.org/10.5194/amt-14-4053-2021                                               Atmos. Meas. Tech., 14, 4053–4068, 2021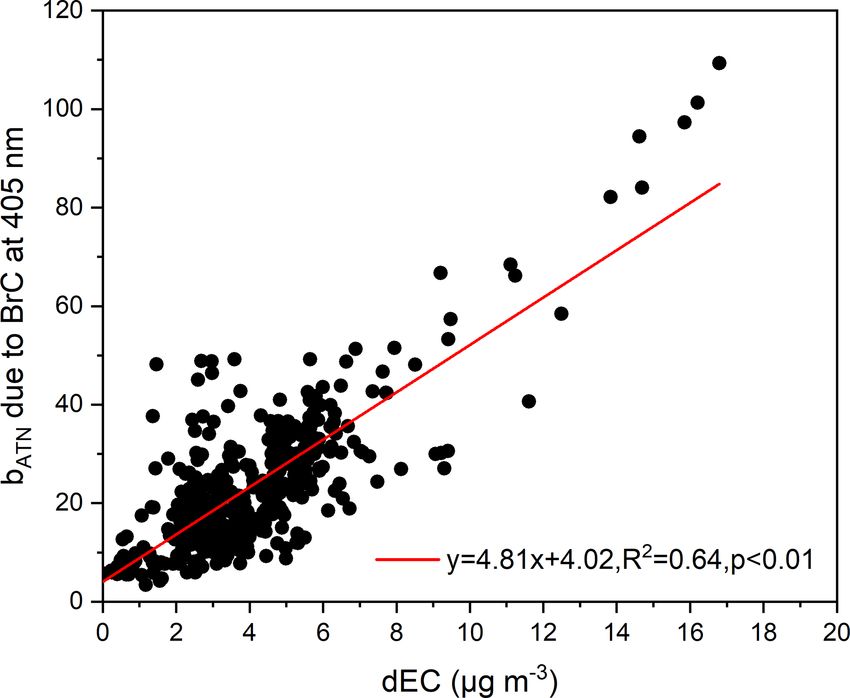
4060 M. Bao et al.: Highly time-resolved characterization of carbonaceous aerosols
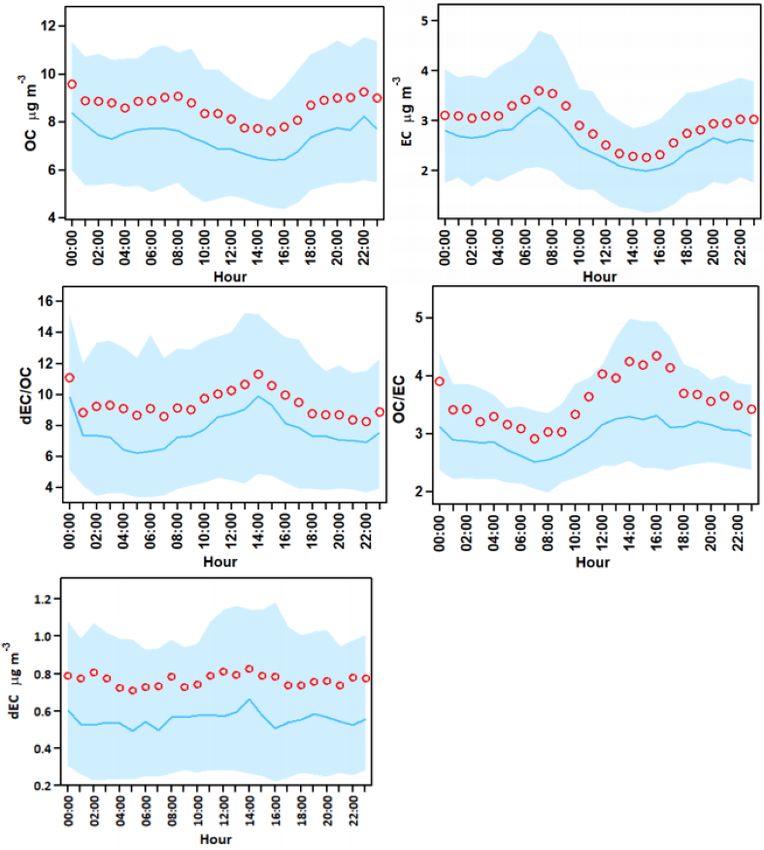
Figure 6. Diurnal variations in OC, EC and dEC concentrations and dEC/OC and OC/EC ratios during the study period. The boundary of
the shaded area indicates the 25 % and 75 % percentile, respectively. The red circle marks the average, while the blue line marks the median.
variations in emission intensities and meteorological param- 1995; Lim and Turpin, 2002). In summer, strong convective
eters. Table S3 summarizes the meteorological parameters in activities in the atmospheric boundary layer and solar radi-
the four seasons during the study period. The high carbona- ation, high temperature and plenty of moisture in the atmo-
ceous aerosol concentrations in winter were mainly a result sphere were favorable for the formation of SOC. On the other
of relatively stable atmospheric conditions with low temper- hand, the high OC/EC ratios in June in this study were also
ature, relative humidity and boundary layer on the one hand strongly related to biomass burning, which will be discussed
and, on the other hand, increasing emissions from fossil fuel in Sect. 3.3. The lower ratios of OC to EC in autumn and
combustion for heating from the chemical enterprises nearby. winter indicate strong primary sources in these two seasons.
In summer, the higher boundary layer resulted in the disper- It should be noted that the OC/EC ratios were a rough indi-
sion of aerosols in the atmosphere, and the higher tempera- cator to estimate the primary and secondary organic carbon;
ture promoted the partitioning of semi-volatile organic com- further analysis of the formation of SOC needs to be con-
pounds (SVOCs) into the gaseous phase (Yang et al., 2011). ducted in the future (Pio et al., 2011; Wu and Yu, 2016).
In addition, heavy precipitation in summer (586 mm in total)
favored the wet scavenging processes of aerosols. 3.1.3 Diurnal variation in carbonaceous aerosols
The average OC/EC ratios in spring, summer, autumn and
winter were 3.9, 4.0, 2.8 and 3.4, respectively (Table 1). The diurnal pattern of carbonaceous aerosols can be affected
The OC/EC ratio could give some information about pri- by both meteorological parameters and sources (Ji et al.,
mary and secondary organic carbon (Turpin and Huntzicker, 2016). Figure 6 depicts the diurnal variation in OC, EC and
dEC and dEC/OC and OC/EC ratios during the study pe-
Atmos. Meas. Tech., 14, 4053–4068, 2021 https://doi.org/10.5194/amt-14-4053-2021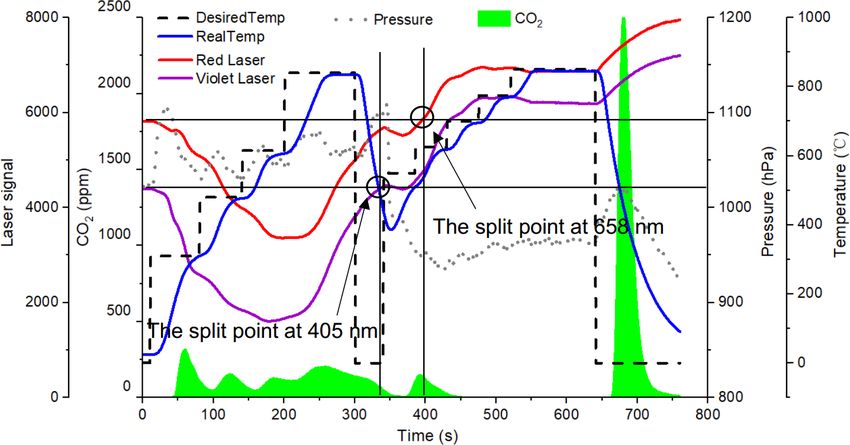
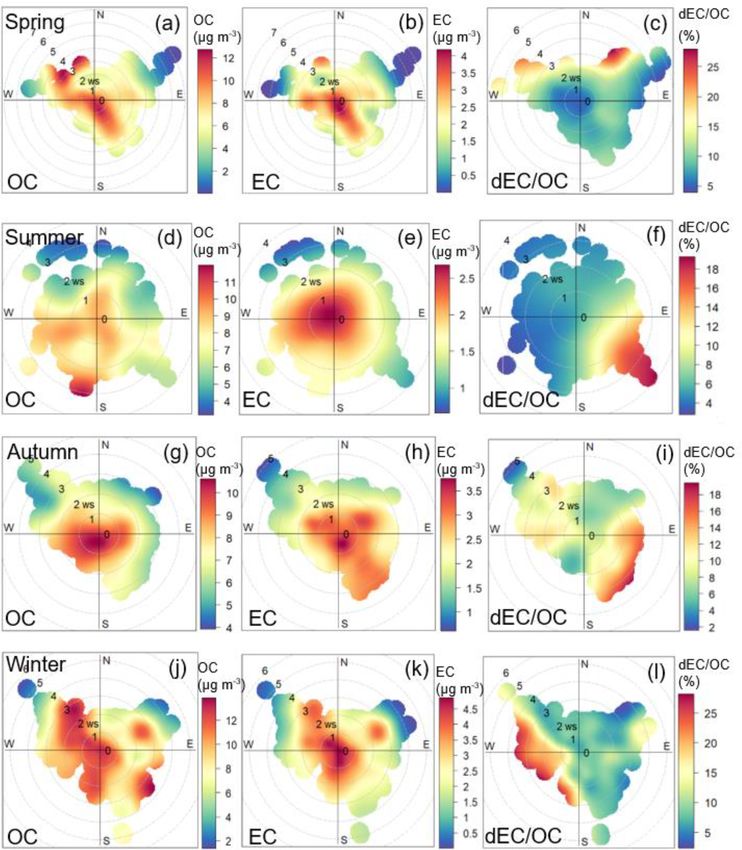
M. Bao et al.: Highly time-resolved characterization of carbonaceous aerosols                                                4061

Figure 7. RH/T dependence of OC and EC and dEC/OC and OC/EC ratios during the study period.

riod. Clear diurnal variations were observed in OC and EC.          80 % and T at 10–20 ◦ C, and the third area appears for RH
Both the OC and EC concentrations kept high levels at night         below 30 % and T at about 10 ◦ C, corresponding to nighttime
and low levels in the daytime, indicating the strong influence      and winter afternoon. In general, dEC had no strong depen-
of the atmospheric boundary layer on air quality in north-          dence on the RH and T distribution, indicating the complex
ern Nanjing. The peak occurred in the morning for both OC           formation mechanism of dEC. OC and EC show similar dis-
and EC, indicating the significant impact of traffic sources        tributions with the highest mass loading (OC is > 20 µg m−3 ;
on the OC and EC concentrations. The dEC/OC and OC/EC               EC is > 8 µg m−3 ) at relatively high RH at 60 %–80 %, which
ratios showed similar trends in the daytime, with a gradual         usually occurred at night with relatively low boundary layer
increase from morning till afternoon, indicating the impor-         height, leading to the accumulation of aerosols. However, the
tance of the contribution of secondary sources to dEC. Sim-         corresponding OC/EC ratios were low, suggesting the im-
ilar, though not so obvious, diurnal variations were found in       portance of primary sources to OC and EC in northern Nan-
dEC. It should be noted that the vehicle emissions and the          jing, which will be verified in the wind rose of OC and EC
boundary layer height had no significant effect on the diurnal      (Fig. 8).
variation in dEC/OC, suggesting there were no significant
local sources of dEC. There was a small peak in dEC/OC at           3.2     Air mass transport
03:00 LT, which might be related to the aqueous secondary
organic aerosol formation during nighttime (Sullivan et al.,        3.2.1    Wind rose of carbonaceous aerosols
2016).
   The relative humidity (RH) and temperature (T )-                 To investigate the influence of air mass transport on the study
dependent distributions of OC, EC mass concentrations and           site, the wind rose of OC, EC and dEC/OC, using hourly data
dEC/OC and OC/EC throughout the study period are shown              in the four seasons, is shown in Fig. 8 (Carslaw and Ropkins,
in Fig. 7. High dEC/OC (> 30 %) can be found in three ar-           2012). There are two points that should be noted. First, high
eas; the first is shown in the right area, with relatively high T   OC and EC mass concentrations were found near the field
at 25–40 ◦ C and RH at 40 %–60 %, which were usually found          site (indicated by wind speed (WS) < 1 m s−1 ), suggesting
in the summer afternoon, which was closely related to the           that local and primary emissions (e.g., industrial and vehicle
strong formation of SOC. This distribution was also seen in         emissions) were stable and important sources contributing
OC/EC. The second area is in the upper region, with RH over         to atmospheric OC and EC mass concentrations in northern

https://doi.org/10.5194/amt-14-4053-2021                                              Atmos. Meas. Tech., 14, 4053–4068, 2021
4062 M. Bao et al.: Highly time-resolved characterization of carbonaceous aerosols
Figure 8. Wind rose of OC, EC and dEC/OC in spring (a–c), summer (d–f), autumn (g–i) and winter (j–l).
Nanjing. The OC mass concentrations from the southwest in- and EC. In spring, the potential source areas of OC and EC
creased with the increase of WS in summer, indicating that were mainly from the southwest of Nanjing; however, the po-
the sources of OC are complicated in summer, including sec- tential source areas of dEC were from the east of Nanjing, in-
ondary reaction during long-range or regional transport. Sec- dicating obvious different sources between OC, EC and dEC.
ond, compared with OC and EC, dEC showed no significant In summer, local areas were the main source areas of EC,
local sources. The dEC/OC increased with increasing WS, and the nearby Yangtze River Delta City Group from the
and the highest dEC/OC were found for WS over 3 m s−1 . southeast of Nanjing, including developed cities like Shang-
Long-range or regional transport were highly likely the main hai, were the main sources areas of OC and dEC. The an-
sources contributing to the dEC mass concentrations. thropogenic emissions from these areas might be important
sources of OC and dEC. Besides, both the potential source
3.2.2 The potential source areas of carbonaceous areas of dEC and EC were in the northwest of Nanjing in
aerosols summer, suggesting strong primary sources of dEC from this
area, which were very likely associated with biomass burn-
The possible source contributions were evaluated using the ing; more details are given in Sect. 3.3. In autumn, local
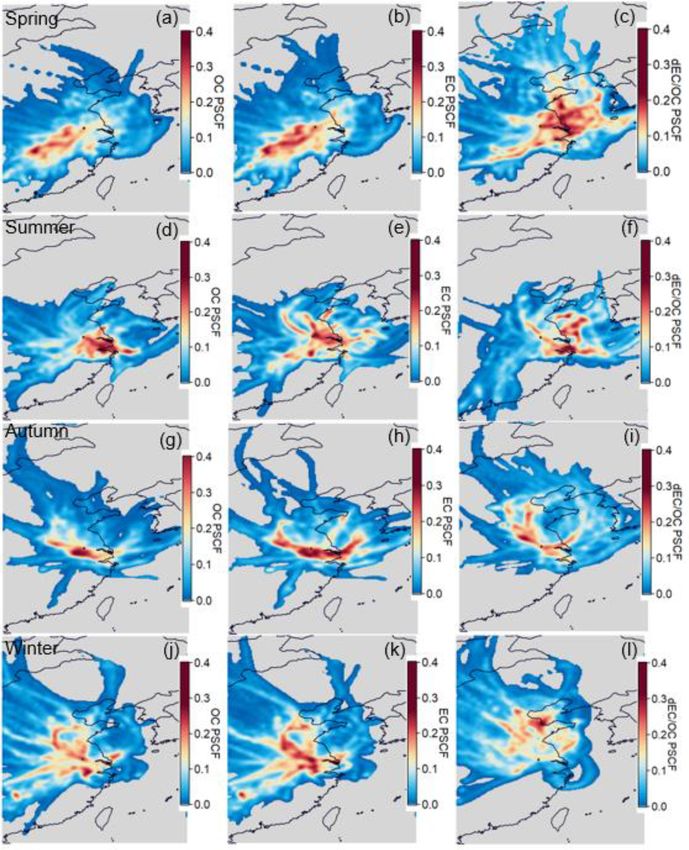
PSCF model, and the PSCF maps are shown in Fig. 9 (Pe- sources from the study site were strongest for OC and EC.
tit et al., 2017). The areas with high PSCF values were However, dEC mainly originated from regional transport
highly likely the potential pollution source areas. As shown from the northwestern and southeastern areas of Nanjing.
in Fig. 9, the PSCF results further proved the strong regional Biomass burning has been proved to be an important source
transport contribution to dEC and local contributions to OC
Atmos. Meas. Tech., 14, 4053–4068, 2021 https://doi.org/10.5194/amt-14-4053-2021M. Bao et al.: Highly time-resolved characterization of carbonaceous aerosols 4063
Figure 9. PSCF map for OC, EC and dEC/OC in spring (a–c), summer (d–f), autumn (g–i) and winter (j–l).
of air pollutants in the Yangtze River Delta (YRD) area, es- 3.3 The characteristics of carbonaceous aerosols
pecially in the wheat harvest seasons (e.g., June and Octo- during biomass burning periods
ber; Cheng et al., 2014; Zhang and Cao, 2015a). In addition,
the YRD area is the most economically developed region in Biomass burning emissions have been proved to be an im-
China and has lots of industrial cities, which means that in- portant source of BrC on a global scale; they are consis-
dustrial emissions and anthropogenic sources contribute to tently observed in large-scale forest fire events (Laskin et al.,
high carbonaceous aerosol pollution levels. In winter, dEC 2015). Based on the Fire Information for Resource Manage-
was mainly from long-range transport from northern cities ment System (FIRMS) derived from the Moderate Resolu-
and regional transport from the southwestern areas of Nan- tion Imaging Spectroradiometer (MODIS), we found that the
jing, while both long-range transport and local sources were fire points amounted to 2028, 1773 and 967 on 11 June 2015,
found in OC and EC concentrations. 7 February 2016 and 2 March 2016, respectively, in the areas
around our study site, suggesting there were strong biomass
burning events on these days (Fig. S4). To further investigate
the biomass burning impact on dEC, we analyzed the tempo-
ral trends of carbonaceous aerosols from 4 to 19 June 2015
and 7 February to 3 March 2016, respectively. Combining
https://doi.org/10.5194/amt-14-4053-2021 Atmos. Meas. Tech., 14, 4053–4068, 20214064 M. Bao et al.: Highly time-resolved characterization of carbonaceous aerosols
Table 2. Statistics of OC, EC, OC/EC, dEC and dEC/OC during biomass burning days and normal days. The values represent the average
( ± ) standard deviation.
OC EC OC/EC dEC dEC/OC
(µg m−3 ) (µg m−3 ) (µg m−3 ) (%)
4–19 June Normal days 9.5 ± 4.5 2.6 ± 1.3 4.3 ± 2.3 0.2 ± 0.1 2.5 ± 1.3
Biomass burning days 9.0 ± 3.6 2.0 ± 0.9 4.8 ± 1.6 0.4 ± 0.2 4.6 ± 1.4
7 February–3 March Normal days 7.5 ± 3.3 2.5 ± 1.2 3.3 ± 1.3 0.8 ± 0.3 12.7 ± 5.6
Biomass burning days 11.2 ± 7.2 3.1 ± 1.9 4.0 ± 1.8 1.7 ± 1.4 15.4 ± 7.8
unique biomass burning impact on dEC and the sources
of OC and EC were more complicated. It should be noted
that there were peaks of dEC on 9 June 2015 and 13 Febru-
ary 2016, which were not biomass burning days, suggest-
ing that biomass burning was not the only source of dEC.
As mentioned in Sect. 3.1 and 3.2, anthropogenic emissions
could be the sources of dEC, and the secondary sources can-
not be ignored, either. Summarized in Table 2 are the aver-
age and standard deviation values of OC, EC, OC/EC, dEC
and dEC/OC during biomass burning and normal days. The
OC/EC, dEC concentrations and dEC/OC were obviously
higher on biomass burning days than in normal days, but
similar levels of the OC and EC concentrations were found
on both biomass burning days and normal days in summer,
suggesting the great contribution of biomass burning emis-
sions to dEC, and there were other sources of OC and EC
Figure 10. Time series of OC, EC, dEC/OC, dEC and OC/EC from in summer. All the carbonaceous aerosols were higher on
4 to 19 June 2015. The period was divided into normal days (blue biomass burning days in winter; in addition, the locations of
bars) and biomass burning days (yellow bars). The yellow shading open-fire counts were mainly in the northwestern and south-
represents the biomass burning periods. western area of the study site (Fig. S5c and d), which were
the potential source areas of OC, EC and dEC in winter, as
discussed in Sect. 3.2.2, indicating strong contributions of
the observed aerosol concentrations and fire information, we biomass burning emissions to all the carbonaceous aerosols
divided the periods into normal days and biomass burning in winter.
days. It should be noted that the biomass burning days are
not determined based only on fire points. We also consid-
ered the 48 h backward trajectories and open biomass burn- 4 Conclusions
ing areas. For example, we found lots of fire points from
11 to 12 June 2015 and from 7 to 10 February 2016, re- In this study, the characteristics and sources of carbonaceous
spectively, and the 48 h back trajectories passed over these aerosols in northern Nanjing were investigated, and we in-
biomass burning areas (Fig. S5b and c). However, although troduced a two-wavelength method by modifying the Sun-
there were large amounts of fire points in the northwest of set carbon analyzer. We incorporated a new diode laser at
Nanjing from 8 to 9 June 2015, the backward trajectories λ = 405 nm in the instrument, making it possible to detect
showed that the air masses during the periods came from the laser beam passing through the filter, at both wavelength
the southeastern areas where no open fire points were found λ = 658 nm and λ = 405 nm, so that we can obtain the dEC
(Fig. S5a). In contrast, there were only a few fire points found concentrations. Our study illustrated the feasibility of using
near the study site from 26 to 27 February 2016; the 48 h dEC to characterize the BrC aerosols, providing a new idea
backward trajectories showed the air masses came from the about the measurement of BrC. The results showed that high
area (Fig. S5d). (low) OC, EC and dEC concentrations were found in winter
As shown in Figs. 10 and 11, we found that dEC con- (summer), indicating the significant impact of the increase
centrations and dEC/OC and OC/EC ratios showed peaks in various emission sources in winter and wet scavenging by
during each biomass burning period which were not that rain in summer. Similar diurnal cycles for OC and EC con-
obvious in OC and EC concentrations, suggesting that the centrations were found to be high at night and low in the
Atmos. Meas. Tech., 14, 4053–4068, 2021 https://doi.org/10.5194/amt-14-4053-2021M. Bao et al.: Highly time-resolved characterization of carbonaceous aerosols 4065
different sources, and more accurate and quantitative source
apportionment can be done (Bhattaraia et al., 2019; Wu et al.,
2018, 2019). We also hope that the dEC data can be further
applied in more research.
Data availability. All the original research data used in
this paper are available from the Open Science Framework
(https://doi.org/10.17605/OSF.IO/MA8CU; Bao, 2021).
Supplement. The supplement related to this article is available on-
line at: https://doi.org/10.5194/amt-14-4053-2021-supplement.
Author contributions. YLZ designed the study. MB, YLZ and
FC contributed to the data collection and analysis. MB and
Figure 11. Time series of OC, EC, dEC/OC, dEC and OC/EC from YLZ prepared the article with contributions from the other authors.
7 February to 3 March 2016. The period was divided into normal
days (blue bars) and biomass burning days (yellow bars). The yel-
low shading represents the biomass burning periods. Competing interests. The authors declare that they have no conflict
of interest.
daytime and strongly affected by the boundary layer. Traffic
emissions were found to have a significant influence on the Acknowledgements. This research was financially supported by
concentrations of OC and EC. Similar trends were found in the National Natural Science Foundation of China (grant
the diurnal cycle of dEC/OC and OC/EC, and the dEC/OC no. 41977305), the Provincial Natural Science Foundation of
increased when the OC/EC ratio increased, indicating strong Jiangsu (grant no. BK20180040) and the Postgraduate Research
secondary sources or biomass burning impact on dEC. The and Practice Innovation Program of Jiangsu Province (grant
wind rose and receptor model results showed that strong lo- no. KYCX18_1014). This study was supported by the funding of
Jiangsu Innovation and Entrepreneurship Team. The authors would
cal emissions were found for OC and EC; however, dEC
also like to thank the China Scholarship Council for the support
was significantly affected by regional or long-range trans- of Mengying Bao. We would also like to express our gratitude to
port. The nearby YRD area was one of the main potential Yuanyuan Zhang, Zufei Xu and Tianran Zhang, for their assistance
source areas of dEC, suggesting that anthropogenic emis- in the instrument maintenance throughout the observation period.
sions could be the sources of dEC. Together with the back Additionally, we are grateful for Yunhua Chang, who made consid-
trajectories analysis and MODIS fire information, we ana- erable comments and suggestions for this paper.
lyzed two biomass burning events in both summer and win-
ter. The results showed that the sources of OC and EC were
more complicated than those of dEC in summer. Biomass Financial support. This research has been supported by the Na-
burning emissions made a great contribution to dEC concen- tional Natural Science Foundation of China (grant no. 41977305),
trations in summer. A large number of open-fire counts from the Provincial Natural Science Foundation of Jiangsu (grant
the northwestern and southwestern areas of the study site was no. BK20180040), and the Postgraduate Research and Practice In-
observed; these fires significantly contributed to the carbona- novation Program of Jiangsu Province (grant no. KYCX18_1014).
ceous aerosol pollution.
Our modified two-wavelength instrument provided more
Review statement. This paper was edited by Willy Maenhaut and
information than the traditional single-wavelength thermal–
reviewed by three anonymous referees.
optical carbon analyzer. The results proved that dEC can
be an indicator of BrC on biomass burning days. It should
be noted that the sources of dEC were complicated, and
the anthropogenic emissions and secondary formations of
dEC aerosols could not be ignored; further chemical analysis
needs to be conducted in the future. The evaluation of SOC
formation and the relationship between dEC and SOC can be
conducted. In addition, more chemical analysis, such as the
analysis for ions, organic matter or sugars in PM2.5 can be
made; thus, we can obtain some information of the tracers of
https://doi.org/10.5194/amt-14-4053-2021 Atmos. Meas. Tech., 14, 4053–4068, 20214066 M. Bao et al.: Highly time-resolved characterization of carbonaceous aerosols
References Chow, J. C., Watson, J. G., Green, M. C., Wang, X., Chen, L. A.,
Trimble, D. L., Cropper, P. M., Kohl, S. D., and Gronstal, S. B.:
Andreae, M. O. and Gelencsér, A.: Black carbon or brown car- Separation of brown carbon from black carbon for IMPROVE
bon? The nature of light-absorbing carbonaceous aerosols, At- and Chemical Speciation Network PM2.5 samples, J. Air Waste
mos. Chem. Phys., 6, 3131–3148, https://doi.org/10.5194/acp-6- Manage. Assoc., 68, 494–510, 2018.
3131-2006, 2006. Cohen, M. D., Stunder, B. J. B., Rolph, G. D., Draxler, R. R., Stein,
Arola, A., Schuster, G., Myhre, G., Kazadzis, S., Dey, S., and A. F., and Ngan, F.: NOAA’s HYSPLIT atmospheric transport
Tripathi, S. N.: Inferring absorbing organic carbon content and dispersion modeling system, B. Am. Meteorol. Soc., 96,
from AERONET data, Atmos. Chem. Phys., 11, 215–225, 2059–2077, https://doi.org/10.1175/bams-d-14-00110.1, 2015.
https://doi.org/10.5194/acp-11-215-2011, 2011. Draxler, R. R. and Hess, G. D.: An overview of the HYSPLIT_4
Bao, M.: Highly time-resolved characterization of carbonaceous modelling system for trajectories, dispersion, and deposition,
aerosols using a two-wavelength Sunset thermal-optical carbon Aust. Meteorol. Mag., 47, 295–308, 1998.
analyzer, OSF, https://doi.org/10.17605/OSF.IO/MA8CU, 2021. Feng, Y., Ramanathan, V., and Kotamarthi, V. R.: Brown car-
Bao, M., Cao, F., Chang, Y., Zhang, Y.-L., Gao, Y., Liu, X., Zhang, bon: a significant atmospheric absorber of solar radiation?, At-
Y., Zhang, W., Tang, T., Xu, Z., Liu, S., Lee, X., Li, J., and Zhang, mos. Chem. Phys., 13, 8607–8621, https://doi.org/10.5194/acp-
G.: Characteristics and origins of air pollutants and carbonaceous 13-8607-2013, 2013.
aerosols during wintertime haze episodes at a rural site in the Hareley, O. L., Corrigan, C. E., and Kirchstetter, T. W.:
Yangtze River Delta, China, Atmos. Pollut. Res., 8, 900–911, Modified thermal-optical analysis using spectral absorp-
https://doi.org/10.1016/j.apr.2017.03.001, 2017. tion selectivity to distinguish black carbon from pyrolized
Bhattaraia, H., Saikawac, E., Wana, X., Zhue, H., Ram, K., Gao, S., organic carbon, Environ. Sci. Technol., 42, 8459–8464,
Kang, S., Zhanga, Q., Zhang, Y., Wu, G., Wang, X., Kawamura, https://doi.org/10.1021/es800448n, 2008.
K., Fui, P., and Cong, Z.: Levoglucosan as a tracer of biomass Huang, R. J., Zhang, Y., Bozzetti, C., Ho, K. F., Cao, J. J., Han, Y.,
burning recent progress and perspectives, Atmos. Res., 220, 20– Daellenbach, K. R., Slowik, J. G., Platt, S. M., Canonaco, F., Zot-
33, https://doi.org/10.1016/j.atmosres.2019.01.004, 2019. ter, P., Wolf, R., Pieber, S. M., Bruns, E. A., Crippa, M., Ciarelli,
Birch, M. E. and Cary, R. A.: Elemental carbon-based method for G., Piazzalunga, A., Schwikowski, M., Abbaszade, G., Schnelle-
occupational monitoring of particulate diesel exhaust: methodol- Kreis, J., Zimmermann, R., An, Z., Szidat, S., Baltensperger, U.,
ogy and exposure issues, Analyst, 121, 1183–1190, 1996. El Haddad, I., and Prevot, A. S.: High secondary aerosol contri-
Cao, F. and Zhang, Y.-L.: Principle, method development and ap- bution to particulate pollution during haze events in China, Na-
plication of radiocarbon (14 C) – based source apportionment of ture, 514, 218–222, https://doi.org/10.1038/nature13774, 2014.
carbonaceous aerosols: a review, Adv. Earth Sci., 30, 425–432, Ji, D. S., Zhang, J. K., He, J., Wang, X. J., Pang, B.,
2015. Liu, Z. R., Wang, L. L., and Wang, Y. S.: Characteris-
Carslaw, D. C. and Ropkins, K.: openair – An R package for air tics of atmospheric organic and elemental carbon aerosols
quality data analysis, Environ. Model. Softw., 27–28, 52–61, in urban Beijing, China, Atmos. Environ., 306, 293–306,
https://doi.org/10.1016/j.envsoft.2011.09.008, 2012. https://doi.org/10.1016/j.atmosenv.2015.11.020, 2016.
Chen, D., Cui, H., Zhao, Y., Yin, L., Lu, Y., and Wang, Kirillova, E. N., Andersson, A., Han, J., Lee, M., and Gustafs-
Q.: A two-year study of carbonaceous aerosols in am- son, O.: Sources and light absorption of water-soluble organic
bient PM2.5 at a regional background site for western carbon aerosols in the outflow from northern China, Atmos.
Yangtze River Delta, China, Atmos. Res., 183, 351–361, Chem. Phys., 14, 1413–1422, https://doi.org/10.5194/acp-14-
https://doi.org/10.1016/j.atmosres.2016.09.004, 2017. Chen, L. 1413-2014, 2014.
W. A., Chow, J. C., Wang, X. L., Robles, J. A., Sumlin, B. J., Laskin, A., Laskin, J., and Nizkorodov, S. A.: Chemistry of
Lowenthal, D. H., Zimmermann, R., and Watson, J. G.: Multi- atmospheric brown carbon, Chem. Rev., 115, 4335–4382,
wavelength optical measurement to enhance thermal/optical https://doi.org/10.1021/cr5006167, 2015.
analysis for carbonaceous aerosol, Atmos. Meas. Tech., 8, 451– Lei, Y., Shen, Z., Zhang, T., Zhang, Q., Wang, Q., Sun, J.,
461, https://doi.org/10.5194/amt-8-451-2015, 2015. Gong, X., Cao, J., Xu, H., Liu, S., and Yang, L.: Opti-
Cheng, Z., Wang, S., Fu, X., Watson, J. G., Jiang, J., Fu, Q., Chen, cal source profiles of brown carbon in size-resolved par-
C., Xu, B., Yu, J., Chow, J. C., and Hao, J.: Impact of biomass ticulate matter from typical domestic biofuel burning over
burning on haze pollution in the Yangtze River delta, China: a Guanzhong Plain, China, Sci. Total. Environ., 622–623, 244–
case study in summer 2011, Atmos. Chem. Phys., 14, 4573– 251, https://doi.org/10.1016/j.scitotenv.2017.11.353, 2018.
4585, https://doi.org/10.5194/acp-14-4573-2014, 2014. Lelieveld, J., Evans, J. S., Fnais, M., Giannadaki, D., and Pozzer,
Chow, J. C., Watson, J. G., Chen, L.-W. A., Arnott, W. P., Moos- A.: The contribution of outdoor air pollution sources to pre-
müller, H., and Fung, K.: Equivalence of elemental carbon mature mortality on a global scale, Nature, 525, 367–371,
by thermal/optical reflectance and transmittance with different https://doi.org/10.1038/nature15371, 2015.
temperature protocols, Environ. Sci. Technol., 38, 4414–4422, Li, C., He, Q., Hettiyadura, A. P. S., Kafer, U., Shmul, G.,
https://doi.org/10.1021/es034936u, 2004. Meidan, D., Zimmermann, R., Brown, S. S., George, C.,
Chow, J. C., Watson, J. G., Chen, L. W., Chang, M. C., Robin- Laskin, A., and Rudich, Y.: Formation of secondary brown
son, N. F., Trimble, D., and Kohl, S.: The IMPROVE_A tem- carbon in biomass burning aerosol proxies through NO3
perature protocol for thermal/optical carbon analysis: main- radical reactions, Environ. Sci. Technol., 54, 1395–1405,
taining consistency with a long-term database, J. Air Waste https://doi.org/10.1021/acs.est.9b05641, 2020.
Manage. Assoc., 57, 1014–1023, https://doi.org/10.3155/1047-
3289.57.9.1014, 2007.
Atmos. Meas. Tech., 14, 4053–4068, 2021 https://doi.org/10.5194/amt-14-4053-2021M. Bao et al.: Highly time-resolved characterization of carbonaceous aerosols 4067 Lim, H.-J. and Turpin, B. J.: Origins of primary and secondary or- Indo-Gangetic Plain, Environ. Sci. Technol., 51, 6765–6772, ganic aerosol in Atlanta: results of time-resolved measurements https://doi.org/10.1021/acs.est.7b00734, 2017. during the Atlanta supersite experiment, Environ. Sci. Technol., Sullivan, A. P., Hodas, N., Turpin, B. J., Skog, K., Keutsch, F. 36, 4489–4496, https://doi.org/10.1021/es0206487, 2002. N., Gilardoni, S., Paglione, M., Rinaldi, M., Decesari, S., Fac- Liu, S., Aiken, A. C., Gorkowski, K., Dubey, M. K., Cappa, chini, M. C., Poulain, L., Herrmann, H., Wiedensohler, A., Ne- C. D., Williams, L. R., Herndon, S. C., Massoli, P., Fortner, mitz, E., Twigg, M. M., and Collett Jr., J. L.: Evidence for am- E. C., Chhabra, P. S., Brooks, W. A., Onasch, T. B., Jayne, bient dark aqueous SOA formation in the Po Valley, Italy, At- J. T., Worsnop, D. R., China, S., Sharma, N., Mazzoleni, C., mos. Chem. Phys., 16, 8095–8108, https://doi.org/10.5194/acp- Xu, L., Ng, N. L., Liu, D., Allan, J. D., Lee, J. D., Flem- 16-8095-2016, 2016. ing, Z. L., Mohr, C., Zotter, P., Szidat, S., and Prevot, A. Turpin, B. J. and Huntzicker, J.: Identification of secondary organic S. H.: Enhanced light absorption by mixed source black and aerosol episodes and quantitation of frimary and secondary or- brown carbon particles in UK winter, Nat. Commun., 6, 8435, ganic aerosol concentrations during SCAQS, Atmos. Environ., https://doi.org/10.1038/ncomms9435, 2015. 29, 3527–3544, 1995. Liu, X., Zhang, Y.-L., Peng, Y., Xu, L., Zhu, C., Cao, F., Zhai, X., US EPA: Review of sunset organic and elemental carbon (OC Haque, M. M., Yang, C., Chang, Y., Huang, T., Xu, Z., Bao, M., and EC) measurements during EPA’s sunset carbon evaluation Zhang, W., Fan, M., and Lee, X.: Chemical and optical proper- project, Sonoma Technology, Inc., CA, US Environmental Pro- ties of carbonaceous aerosols in Nanjing, eastern China: region- tection Agency, NC, 2019. ally transported biomass burning contribution, Atmos. Chem. Wang, J., Nie, W., Cheng, Y., Shen, Y., Chi, X., Wang, J., Huang, Phys., 19, 11213–11233, https://doi.org/10.5194/acp-19-11213- X., Xie, Y., Sun, P., Xu, Z., Qi, X., Su, H., and Ding, A.: Light ab- 2019, 2019. sorption of brown carbon in eastern China based on 3-year multi- Massabò, D., Caponi, L., Bove, M. C., and Prati, P.: wavelength aerosol optical property observations and an im- Brown carbon and thermal–optical analysis: A correc- proved absorption Ångström exponent segregation method, At- tion based on optical multi-wavelength apportionment mos. Chem. Phys., 18, 9061–9074, https://doi.org/10.5194/acp- of atmospheric aerosols, Atmos. Environ., 125, 119–125, 18-9061-2018, 2018. https://doi.org/10.1016/j.atmosenv.2015.11.011, 2016. Wang, P., Cao, J. J., Shen, Z. X., Han, Y. M., Lee, S. C., Huang, Petit, J. E., Favez, O., Albinet, A., and Canonaco, F.: A Y., Zhu, C. S., Wang, Q. Y., Xu, H. M., and Huang, R. J.: user-friendly tool for comprehensive evaluation of the ge- Spatial and seasonal variations of PM2.5 mass and species dur- ographical origins of atmospheric pollution: Wind and tra- ing 2010 in Xi’an, China, Sci. Total. Environ., 508, 477–487, jectory analyses, Environ. Model. Softw., 88, 183–187, https://doi.org/10.1016/j.scitotenv.2014.11.007, 2015. https://doi.org/10.1016/j.envsoft.2016.11.022, 2017. Wang, Y., Hopke, P. K., Rattigan, O. V., Xia, X., Chalupa, D. C., Pio, C., Cerqueira, M., Harrison, R. M., Nunes, T., Mirante, F., and Utell, M. J.: Characterization of residential wood combustion Alves, C., Oliveira, C., Sanchez de la Campa, A., Artíñano, particles using the two-wavelength aethalometer, Environ. Sci. B., and Matos, M.: OC/EC ratio observations in Europe: Re- Technol., 45, 7387–7393, https://doi.org/10.1021/es2013984, thinking the approach for apportionment between primary and 2011. secondary organic carbon, Atmos. Environ., 45, 6121–6132, Wang, Y., Hopke, P. K., and Rattigan, O. V.: A new indicator of https://doi.org/10.1016/j.atmosenv.2011.08.045, 2011. fireworks emissions in Rochester, New York, Environ. Monit. Rolph, G., Stein, A., and Stunder, B.: Real-time environmental ap- Assess., 184, 7293–7297, https://doi.org/10.1007/s10661-011- plications and display system: READY, Environ. Model. Softw., 2497-5, 2012a. 95, 210–228, https://doi.org/10.1016/j.envsoft.2017.06.025, Wang, Y., Hopke, P. K., Rattigan, O. V., Chalupa, D. C., 2017. and Utell, M. J.: Multiple-year black carbon measure- Sahu, M., Hu, S., Ryan, P. H., Le Masters, G., Grinshpun, S. ments and source apportionment using delta-C in Rochester, A., Chow, J. C., and Biswas, P.: Chemical compositions and New York, J. Air Waste Manage. Assoc., 62, 880–887, source identification of PM2.5 aerosols for estimation of a https://doi.org/10.1080/10962247.2012.671792, 2012b. diesel source surrogate, Sci. Total. Environ., 409, 2642–2651, Wu, C. and Yu, J. Z.: Determination of primary combustion source https://doi.org/10.1016/j.scitotenv.2011.03.032, 2011. organic carbon-to-elemental carbon (OC/EC) ratio using am- Saleh, R., Robinson, E. S., Tkacik, D. S., Ahern, A. T., Liu, bient OC and EC measurements: secondary OC–EC correla- S., Aiken, A. C., Sullivan, R. C., Presto, A. A., Dubey, tion minimization method, Atmos. Chem. Phys., 16, 5453–5465, M. K., Yokelson, R. J., Donahue, N. M., and Robinson, A. https://doi.org/10.5194/acp-16-5453-2016, 2016. L.: Brownness of organics in aerosols from biomass burning Wu, G., Wan, X., Gao, S., Fu, P., Yin, Y., Li, G., Zhang, linked to their black carbon content, Nat. Geosci., 7, 647–650, G., Kang, S., Ram, K., and Cong, Z.: Humic-like sub- https://doi.org/10.1038/ngeo2220, 2014. stances (HULIS) in aerosols of central Tibetan Plateau Sandradewi, J., Prévôt, A. S. H., Szidat, S., Perron, N., Alfarra, M. (Nam Co, 4730 m asl): Abundance, light absorption proper- R., Lanz, V. A., Weingartner, E., and Baltensperger, U.: Using ties, and sources, Environ. Sci. Technol., 52, 7203–7211, aerosol light absorption measurements for the quantitative de- https://doi.org/10.1021/acs.est.8b01251, 2018. termination of wood burning and traffic emission contributions Wu, G., Ram, K., Fu, P., Wang, W., Zhang, Y., Liu, X., Stone, E. A., to particulate matter, Environ. Sci. Technol., 42, 3316–3323, Pradhan, B. B., Dangol, P. M., Panday, A. K., Wan, X., Bai, Z., https://doi.org/10.1021/es702253m, 2008. Kang, S., Zhang, Q., and Cong, Z.: Water-soluble brown carbon Satish, R., Shamjad, P., Thamban, N., Tripathi, S., and Rastogi, in atmospheric aerosols from Godavari (Nepal), a regional repre- N.: Temporal characteristics of brown carbon over the central https://doi.org/10.5194/amt-14-4053-2021 Atmos. Meas. Tech., 14, 4053–4068, 2021
You can also read


