Environmental Science - Atmospheres
←
→
Page content transcription
If your browser does not render page correctly, please read the page content below
Volume 1
                                                                            Number 1

Environmental
                                                                            January 2021
                                                                            Pages 1–58

Science
Atmospheres
rsc.li/esatmospheres

                       ISSN 2634-3606

                       PAPER
                       Jianhuai Ye, Scot T. Martin et al.
                       Near-canopy horizontal concentration heterogeneity
                       of semivolatile oxygenated organic compounds and
                       implications for 2-methyltetrols primary emissions
Environmental Science:
Atmospheres
View Article Online
PAPER View Journal | View Issue
Near-canopy horizontal concentration
This article is licensed under a Creative Commons Attribution 3.0 Unported Licence.
Cite this: Environ. Sci.: Atmos., 2021, 1,
heterogeneity of semivolatile oxygenated organic
Open Access Article. Published on 21 December 2020. Downloaded on 09/06/2021 20:54:08.
8 compounds and implications for 2-methyltetrols
primary emissions†
Jianhuai Ye, *a Carla E. Batista,bc Patricia C. Guimarães,bc Igor O. Ribeiro,bc
Charles Vidoudez,d Rafael G. Barbosa,c Rafael L. Oliveira,c Yongjing Ma,ae
Kolby J. Jardine,f Jason D. Surratt, g Alex B. Guenther,h Rodrigo A. F. Souzabc
and Scot T. Martin *ai
Semivolatile oxygenated organic compounds (SV-OVOCs) are important atmospheric species, in particular
for the production and chemistry of atmospheric particulate matter and related impacts on air quality and
climate. In this study, SV-OVOCs were collected in the horizontal plane of the roughness layer over the
tropical forest in the central Amazon during the wet season of 2018. A sampler mounted to a copter-
type, hovering unmanned aerial vehicle was used. Underlying the collection region, a plateau forest
transitioned into a slope forest across several hundred meters. The concentrations of pinonic and pinic
acids, which are monoterpene oxidation products, had no statistical difference over the two forests. By
comparison, across the study period, differences in the concentration of 2-methyltetrols, which are
products of isoprene oxidation, ranged from 70% to +480% over the two forests. The chemical lifetime
of 2-methyltetrols in the atmosphere is sufficiently long that heterogeneity in the isoprene emission rate
from the two forests followed by atmospheric oxidation does not explain the concentration
heterogeneity of 2-methyltetrols. Standing waves and local meteorology also cannot account for the
heterogeneity. Of the possibilities considered, the most plausible explanation is the direct emission from
the forest of 2-methyltetrols produced through biological processes within the plants. Under this
Received 3rd September 2020
Accepted 17th November 2020
explanation, the rate of direct SV-OVOC emissions should be modulated by forest type and related
environmental stressors. Direct emissions of SV-OVOCs should be more broadly considered for
DOI: 10.1039/d0ea00006j
constraining and improving models of atmospheric composition, transport, and chemistry over tropical
rsc.li/esatmospheres forests.
Environmental signicance
Semivolatile oxygenated organic compounds (SV-OVOCs) are key precursors of atmospheric particulate matter and play crucial roles in regional and global
climate. Over forests, SV-OVOCs are largely considered as produced through in situ atmospheric oxidation and functionalization of volatile organic compounds
emitted from forests. The evolution of SV-OVOCs in the atmosphere is, therefore, treated in that way in models of chemical transport and climate. Based on eld
observations and model simulations, the results herein highlight the possibility of direct emission from the forests of 2-methyltetrols, which is a family of SV-
OVOC products from isoprene oxidation. The results also demonstrate how mapping out near-canopy SV-OVOC heterogeneity can be an effective strategy for
isolating atmospheric SV-OVOC secondary production from direct primary forest emissions.
a
School of Engineering and Applied Sciences, Harvard University, Cambridge, g
Department of Environmental Sciences and Engineering, Gillings School of Global
Massachusetts, 02138, USA. E-mail: scot_martin@harvard.edu; jye@seas.harvard. Public Health, University of North Carolina at Chapel Hill, Chapel Hill, North
edu Carolina, 27599, USA
b
Post-graduate Program in Climate and Environment, National Institute of h
Department of Earth System Science, University of California, Irvine, California,
Amazonian Research, Manaus, Amazonas, 69060-001, Brazil 92697, USA
c
School of Technology, Amazonas State University, Manaus, Amazonas, 69065-020, i
Department of Earth and Planetary Sciences, Harvard University, Cambridge,
Brazil Massachusetts, 02138, USA
† Electronic supplementary
d
Harvard Center for Mass Spectrometry, Harvard University, Cambridge, information (ESI) available. See DOI:
Massachusetts, 02138, USA 10.1039/d0ea00006j
e
College of Atmospheric Sciences, Lanzhou University, Lanzhou, 730000, China
f
Climate and Ecosystem Sciences Division, Earth Science Division, Lawrence Berkeley
National Laboratory, Berkeley, California, 94720, USA
8 | Environ. Sci.: Atmos., 2021, 1, 8–20 © 2021 The Author(s). Published by the Royal Society of Chemistry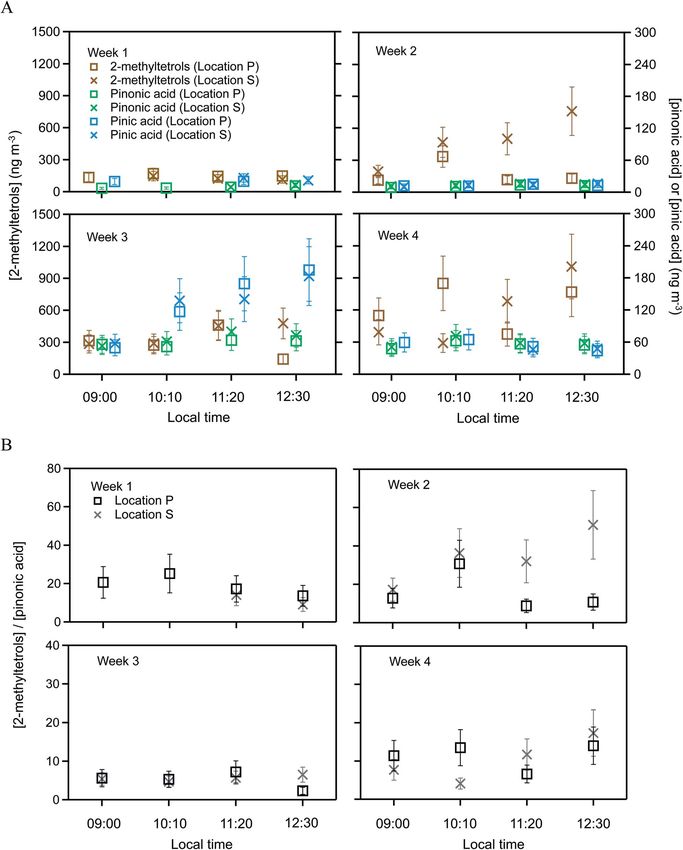
View Article Online
Paper Environmental Science: Atmospheres
Of OVOCs, semivolatile oxygenated organic compounds (SV-
1. Introduction OVOCs) are a further sub-classication. SV-OVOCs are dened
Oxygenated volatile organic compounds (OVOCs) emitted from as OVOC species that have a vapor pressure between 10 and
vegetation are important components in forest ecosystem 1010 Pa.15 Over forests, SV-OVOCs are largely regarded as the
functioning, atmospheric chemistry, and climate.1–4 They have secondary products of atmospheric oxidation. More specically,
an annual estimated emission of around 200 Tg and contribute they are produced through multi-generation oxidation by ozone
a signicant part of the organic carbon ux into the atmo- and hydroxyl radical in the atmosphere of VOCs previously
sphere.5,6 Among biogenic OVOCs, methanol is the most emitted from the forest.16 The SV-OVOCs in turn are key
emitted, estimated as 100 Tg per year globally. Some other precursors of atmospheric particulate matter (PM).17 Submicron
This article is licensed under a Creative Commons Attribution 3.0 Unported Licence.
important OVOCs include acetone, ethanol, short-chain alde- PM can regulate cloud properties over forests, among other
Open Access Article. Published on 21 December 2020. Downloaded on 09/06/2021 20:54:08.
hydes and acids, and long-chain terpenoid compounds.5 features, and play crucial roles in regional and global climate
These biogenic OVOCs are typically metabolic by-products or systems.18 The atmospheric reactions to produce SV-OVOCs can
intermediates of biochemical processes in plants.1–3 As such, take place in the gas phase and in the condensed phase. The
the emission rates are variable, both with plant and forest type latter is represented in the atmosphere by humid aerosol
as well as environmental stress (e.g., pathogen attack, wound- particles and cloud droplets.
ing, exposure to high ozone concentrations, ooding, and so Although SV-OVOCs are widely regarded as produced in situ
on).1–4 As an example of the latter, ethanol emissions from plant in the atmosphere and simulated in that way in chemical
roots greatly increase when ooding induces anoxic conditions transport models of atmospheric chemistry, increasing
and fermentation.4 As another example, emissions of C6- and evidence shows that SV-OVOCs can also be biologically
C9-aldehydes and alcohols such as hexenal and nonadienol, produced. Biological emissions may thus be another important
which are produced by lipoxygenase action in plants, increase category of direct emissions of SV-OVOCs. For example, semi-
during times of plant stress.2 Emission of a suite of OVOCs (i.e., volatile fatty acids, fatty alcohols, and long-chain n-alkanals
3-methyl furan and 2-methyl-3-buten-2-ol) was also observed (e.g., C12 to C26 aldehydes) are produced in plants and subse-
from plants, such as mango branches, in response to environ- quently released in some fraction to the atmosphere, both as
mental stress, such as high temperature or high light intensity.7 vegetative detritus in the form of coarse particles and as evap-
More recently, direct emissions of OVOCs of isoprene orated species from plant waxes if sufficiently volatile.19–22
oxidation products and related organic species have been re- For isoprene, the 2-methyltetrols family is an important class
ported.7–10 Direct emissions are also called primary emissions. of SV-OVOCs. 2-Methyl-D-erythritol, which is one of the diaste-
Aer methane, isoprene is the most abundant volatile organic reomers of 2-methyltetrols, is an isoprene metabolism byprod-
compound (VOC) emitted by vegetation globally.5 A link uct in plants of deoxyxylulose phosphate and methylerythritol
between the rate of isoprene emission and the rate of photo- phosphate pathways.23–27 This compound and 2-methylthreitol
synthesis is a common feature of many different tree genera in are diastereomers that together make up the 2-methyltetrols
tropical forests, although not all.11,12 Isoprene is important both family. The 2-methyltetrols family has four members, including
for anabolism in plants and for emission and subsequent the two aforementioned diastereomers, each of which also has
chemistry in the atmosphere.11,12 Isoprene also has an impor- two enantiomers (i.e., 2-methyl-D-threitol, 2-methyl-L-threitol, 2-
tant role in plant thermotolerance. Several different antioxidant methyl-D-erythritol, and 2-methyl-L-erythritol). This family is
pathways are associated with isoprene, such as the consump- identied as produced by isoprene oxidation in the atmo-
tion of the excess products of photosynthesis (i.e., ATP and sphere.28,29 Specically, the heterogeneous chemical reactions
NADPH) through a tight coupling of isoprene biosynthesis with of isoprene epoxydiols (IEPOX, rst-generation oxidation
photochemical electron transport, direct antioxidant reactions products of isoprene) in acidic sulfate aerosol particles can
between isoprene and reactive oxygen species, and the produce 2-methyltetrols and the 2-methyltetrols organo-
enhancement of the physical stability of membranes.8,13,14 sulfates.28,30,31 González et al.32 performed chiral analysis of the
Pyruvate-2-13C leaf and branch feeding experiments show that 2-methyltetrols family for atmospheric PM collected on lters
methyl vinyl ketone (MVK) and methacrolein (MACR) can be during the wet and dry seasons of the central Amazon. Non-
emitted from plants to the atmosphere.8 These species had biological atmospheric oxidation of isoprene mainly produces
previously been considered as produced through the atmo- racemic mixtures whereas biological metabolism produces non-
spheric oxidation of isoprene. This mechanism is referred to as racemic mixtures. This principle allowed the authors to
a secondary atmospheric source, as distinguished from the conclude that direct emissions of 2-methyltetrols from the
primary emissions from the forest to the atmosphere. Reactions forest accounted under some conditions for more than half of
between ozone and diterpenes stored in glandular trichomes of the atmospheric PM concentrations of this species.33 Cahill
plants (e.g., tobacco) can also lead to direct emissions of MVK.9 et al.34 observed a strong correlation between the concentrations
Cappellin et al.10 likewise showed that methyl ethyl ketone of 2-methyltetrols and sugars, such as glucose and fructose, over
(MEK), which had been considered mostly an anthropogenic a temperate coniferous forest, also suggesting that 2-methylte-
species, can also be produced via in-plant transformation of trols, to some extent, may arise from similar biological sources
MVK and then released from the plant into the atmosphere. as the sugars, which are biomarkers for airborne fungal
spores.35,36
© 2021 The Author(s). Published by the Royal Society of Chemistry Environ. Sci.: Atmos., 2021, 1, 8–20 | 9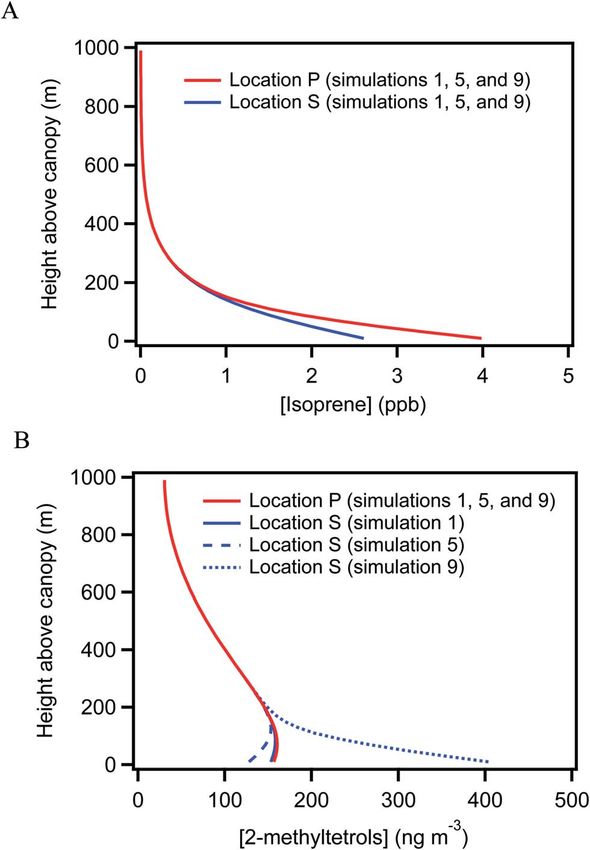
View Article Online
Environmental Science: Atmospheres Paper
Assessment of the relative importance of primary SV-OVOC Forest Reserve, Manaus, Brazil. The collected SV-OVOCs were
emissions compared to secondary production in the atmo- analyzed off-line by thermal-desorption gas chromatography
sphere is technically and scientically challenging. Leaf-level coupled with on-line derivatization. VOCs were also analyzed,
measurements have demonstrated emission and quantied and this complementary work was previously reported in Batista
the rate for specic plants across a range of environmental et al.40 Herein, the SV-OVOC analysis is presented. The atmo-
conditions.7,9 Despite this success, scaling from leaf, to plant, spheric observations are employed to probe heterogeneity in SV-
and further to forest has large uncertainties because of OVOC concentration in the near-canopy atmosphere and, in
immense forest biodiversity, especially in tropical regions. combination with a two-dimensional gradient transport model
Shiing environmental stressors with seasons is a further of SV-OVOC production and transport, to probe the contribu-
This article is licensed under a Creative Commons Attribution 3.0 Unported Licence.
complicating factor. tion of direct emissions.
Open Access Article. Published on 21 December 2020. Downloaded on 09/06/2021 20:54:08.
An alternative observational strategy for isolating the
contribution of in situ atmospheric production of SV-OVOCs
from direct emissions of the underlying forest could be to 2. Methods
map out the near-canopy horizontal heterogeneity in the 2.1 Flight platform and sampling locations
concentration of SV-OVOCs. The assumption for this strategy is A sampler for SV-OVOCs was mounted to a hexacopter hovering-
that uniform atmospheric production should not contribute to type UAV (DJI Matrice 600). The custom-built sampler used
near-canopy heterogeneity of SV-OVOC concentrations because adsorbent cartridges, and further details can be found in
SV-OVOCs have atmospheric lifetimes of several hours to days. McKinney et al.41 Analysis of the disturbance of the local
By comparison, different emission rates with changes in concentration eld by the UAV propellers was also discussed
underlying forest composition and environmental stressors can therein, and this disturbance was not signicant for the
induce near-canopy heterogeneity of SV-OVOC concentrations. conditions of the present study. The UAV ights took place at
Even so, this observational strategy, including its possible the Adolfo Ducke Forest Reserve located on the northern
limitations, remains not fully tested and evaluated in real-world outskirts of Manaus city (Brazil; Fig. 1). Two sampling locations,
practice, largely because of the absence of appropriate plat- shown as points P and S in Fig. 1 and separated by 711 m,
forms to investigate the spatiotemporal variations of SV-OVOCs corresponded to two different underlying forests.40 The forest
at intermediate scales over forests. For example, traditional under location P resided in a plateau region with well-drained
tower measurements are excellent for long-term observations at soils. The forest under location S populated a slope between
xed forest locations (e.g., usually over plateau forests charac- plateau and valley regions. The plants making up the plateau,
terized by rm soils),37 yet by being in one location towers do slope, and valley forests differed considerably (Section 3.2.3).
not capture the variability inherent over the surrounding Canopy height varied from 25 to 35 m for both locations P and S.
heterogeneous forests. Aircra measurements obtain valuable The UAV was launched and recovered atop a tower at location P
chemistry data sets, but in a heterogeneous landscape these at the Manaus Botanical Gardens within the reserve. To main-
data sets necessarily average across different types of landcover tain visual contact between the UAV operator and the UAV,
given the height and the speed of the aircra.38 Satellite-based sampling at both locations was conducted at the same absolute
sensors have unprecedented views across 10's of km, yet they altitude, which was 15 m above local canopy at location P and 47
are limited to just a few detectable organic species.39 The m above it at location S. For the four weeks of measurements,
emerging technology of hovering unmanned aerial vehicles the variability in the meteorological parameters, such as
(UAVs) has the capability to collect data sets at intermediate temperature, relative humidity, wind speed, and wind direction,
scales and thus to map out the heterogeneity of SV-OVOC was small during the time periods that samples were obtained
concentrations in the roughness layer just over the forest (Table S1†). The implication is that meteorology did not
canopy.40,41 Those data in turn should lead to insights into signicantly contribute to the variability of relative SV-OVOC
direct emissions of SV-OVOCs. This strategy, when developed, concentrations between locations P and S.
well tested, and understood, could evolve into a good comple-
ment to the scaling-up approach of leaf-level emission rates.
To these ends, in this study a hovering UAV was equipped 2.2 Sampling methods
with sorbent cartridges for SV-OVOCs and own in the rough- SV-OVOC samples were collected by drawing atmospheric air
ness layer over a forest. The objective of this study is to inves- through adsorbent cartridges (Markes International, Inc. C2-
tigate and quantify the concentration distribution of SV-OVOCs AXXX-5149). The cartridges were packed with a combination
and provide insights into the relative importance of primary SV- of Tenax TA and Carbograph 5TD. These adsorbents were
OVOC emissions compared to their secondary production in the hydrophobic and suitable for atmospheric sampling at a wide
atmosphere. In this regard, near-canopy concentrations of 2- range of relative humidity. They collected a wide range of
methyltetrols (isoprene oxidation products) and pinonic and organic compounds from carbon numbers of C3 through C30
pinic acids (monoterpene oxidation products) were examined. (ref. 42) based on species affinity to the adsorbents. Prior to use,
The research was conducted in the central Amazon across four the cartridges were pre-conditioned at 320 C by passing 0.1
weeks during the wet season from 20 February to 15 March L min1 ultra-pure nitrogen (Airgas) for 8 h. During use on the
2018. Sampling was performed over two different forests hovering UAV, the sampling rate into a cartridge was 0.15 to
(namely, “plateau, P” and “slope, S” forests) at the Adolfo Ducke 0.20 L min1. This sampling rate allowed efficient collection of
10 | Environ. Sci.: Atmos., 2021, 1, 8–20 © 2021 The Author(s). Published by the Royal Society of ChemistryView Article Online
Paper Environmental Science: Atmospheres
This article is licensed under a Creative Commons Attribution 3.0 Unported Licence.
Open Access Article. Published on 21 December 2020. Downloaded on 09/06/2021 20:54:08.
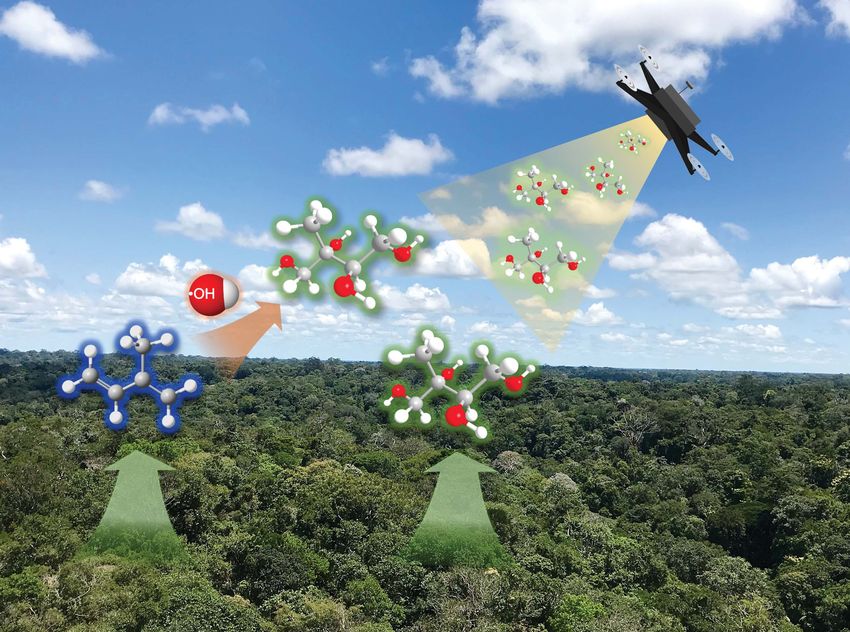
Fig. 1 Sampling site at the Adolfo Ducke Forest Reserve. The left panel shows the location of the reserve on the northern outskirts of Manaus city,
Amazonas, Brazil. The right panel shows the local topography in the region of the two sampling sites. Location P is over a plateau forest. Location
S is over a slope forest.
SV-OVOCs while maximizing the total sampling volume and locations S and P, and any decomposition would be similar for
thereby the total collected SV-OVOC mass. No lter was the samples collected at both locations and thus canceling out
installed prior to the sampling inlet. Therefore, both gas- and in the relative analysis.
particle-phase SV-OVOCs were collected by the cartridges.
UAV-facilitated samples were collected by hovering at loca-
tion S in four sequential time periods of a day, as follows: 09:00– 2.3 Analysis by thermal desorption gas chromatography
10:00, 10:10–11:10, 11:20–12:20, and 12:30–13:30, all in local mass spectrometry (TD-GC-MS)
time (4 h earlier than UTC). Two ights were carried out in each In the laboratory, for TD-GC-MS analysis the air samples
time period. Within a ight, a sampling duration of 2.5 min was collected on the sorbent cartridges were held at 320 C for
used for VOCs for one set of cartridges (work reported in Batista 20 min for thermal desorption. The desorbed SV-OVOCs were
et al.40) and 17.5 min for SV-OVOCs for another set of cartridges. chemically derivatized by reaction with N-methyl-N-(trime-
Specic sampling information, including time period of thylsilyl)triuoroacetamide (MSTFA; $98.5%, Sigma Aldrich) in
collection for each sample, appeared in Batista et al.,40 which a custom-built system. MSTFA derivatization improved the
focused on VOC analysis from the rst set of cartridges. SV- volatility and thermal stability of the targeted compounds,
OVOC collection was simultaneously performed at location P allowing efficient separation along the GC column of the ana-
by an operator using an air sampling pump (GilAir Plus, Gilian; lytes. For derivatization, helium gas owed over the headspace
0.20 L min1) at the top of the tower. For both locations, the of MSTFA, and a dilution ow with pure helium was added to
same set of SV-OVOC cartridges employed in the rst day in adjust the MSTFA concentration injected into the system.
a specic time window was used repeatedly in the same time During desorption and derivatization, the SV-OVOC derivatives
window for other days of the week until a total sample collection were re-concentrated at 0 C in a cold trap.
of >100 min (i.e., >15 L) was achieved for each cartridge. This The custom-built system was coupled to chemical analysis by
approach ensured that sufficient SV-OVOC mass was collected gas chromatography for analyte separation and electron-
on a cartridge so that off-line chromatographic analysis was ionization mass spectrometry for quantication (Quattro
possible. For comparison, multi-day lter collection of samples Micro GC-MS; Waters). Aer collection in the trap at 0 C, the
for organic analysis is a common approach for the Amazon SV-OVOC derivatives were subsequently transferred to the GC by
forest because of the low atmospheric concentrations of many heating the trap to 320 C. This step also converted 2-methyl-
species.32,43 Aer sample collection, the cartridges were sealed tetrols organosulfates into 2-methyltetrols,30 meaning that the
with Swagelok ttings and kept at room temperature before 2-methyltetrols family reported herein is inclusive of both
chromatographic analysis in the laboratory. Although some atmospheric 2-methyltetrols and atmospheric 2-methyltetrols
reactive SV-OVOCs can decompose at least in part during organosulfates. The GC inlet was operated at a split-mode ratio
storage and prior to analysis, the highly oxidized SV-OVOC of 1 : 1 during the analysis. The column ow was 2 mL min1.
compounds targeted in the present study were stable, as The temperature prole for the GC column was as follows:
conrmed by laboratory standards (Section 2.3). Moreover, the 3 min at 40 C, 4 C min1 to 170 C, 25 C min1 from 170 C to
analysis herein is based on the relative concentrations at 300 C, and 300 C for 5 min. The mass spectrometer began
sampling 16 min aer the start of the GC program to avoid
© 2021 The Author(s). Published by the Royal Society of Chemistry Environ. Sci.: Atmos., 2021, 1, 8–20 | 11View Article Online
Environmental Science: Atmospheres Paper
contamination from high concentrations of MSTFA (i.e., which derivatized oxygenated organic compounds also appeared in
elutes early). The sampling delay limited the GC-MS analysis to the chromatograms, such as for long-chain fatty acids (e.g.,
chemical species having retention times greater than 16 min, tetradecanoic acid), dicarboxyl acids (e.g., succinic acid), and
corresponding to a retention index greater than that of a C14 n- polyols (e.g., levoglucosan). These compounds were previously
alkane. observed for the Amazon forest,43 but quantication with
Authentic standards were used for identication and cali- authentic standards was beyond the scope of the current study.
bration of 2-methyltetrols, cis-pinonic acid (98%, Sigma The SV-OVOC concentrations at locations P and S are plotted
Aldrich), and pinic acid (99%, Sigma Aldrich). A 50 : 50 mix of 2- in Fig. 2A by hour for each week of measurements (Table S2†).
methylthreitol and 2-methylerythritol, prepared by the method Between the two locations, the concentrations of pinonic and
This article is licensed under a Creative Commons Attribution 3.0 Unported Licence.
of Bondy et al.,44 was used for the 2-methyltetrols calibration. pinic acids had no difference within the experimental uncer-
Open Access Article. Published on 21 December 2020. Downloaded on 09/06/2021 20:54:08.
Standards solutions (1 mL) were prepared in acetonitrile (HPLC tainty of 30% for the entire data set (Table S2†). In contrast, the
grade, Sigma Aldrich) and injected into a ow of helium at 100 concentration of the 2-methyltetrols family at location P
mL min1. This ow was collected on a cartridge for 5 min. The differed beyond the experimental uncertainty with that of
helium ow carried away the acetonitrile, which was not location S for 8 of the 15 samples. Across the data set, the
retained by the sorbent in the cartridge. concentrations at location S differed by 70% to +480% from
Internal standards of lauric-D23-acid ($98%, Sigma Aldrich) those at location P (Fig. 2A).
and 13C6-adipic acid (99%, Cambridge Isotope Laboratories, The concentration ratio of 2-methyltetrols to pinonic acid is
Inc.) were used to correct for any loss of analyte during the plotted in Fig. 2B. Similar results are obtained for the concen-
analysis sequence of thermal desorption, derivatization, sample tration ratio of 2-methyltetrols to pinic acid, and the plot is
transfer, and ionization. This approach improved the precision omitted herein. In an ideal scenario of constant chemical
of quantitative analysis for the TD-GC-MS system. These conditions and emission rates in constant proportion between
compounds have different volatilities and different numbers of the chemical species, this ratio should remain unchanged over
carboxyl functional groups. As a result, their co-use tested the time and have the same value at both locations P and S. The
analysis sequence for consistency across many compounds. value of the denominator (i.e., the concentration of pinonic
Fig. S3† shows a 1 : 1 line of integrated peak areas of authentic acid) is observed as the same at both locations even as the
analytes when adjusted for each of the two different internal absolute concentration varies over time (Fig. 2A), and it can thus
standards for concentrations of 5 to 20 mM. The correlation serve as a normalization factor for effects of shiing meteo-
coefficient of 0.99 conrms the effectiveness of the analysis rology (i.e., dilution) on the absolute concentrations. At a single
sequence across the range of tested compounds. Based on the location, such as location P, the ratio varied from 2 to 51 across
observed reproducibility in laboratory controls using the the different weeks. Given that this ratio acts as a normalization
authentic standards and the internal standards, as well as factor for dilution, precursor emissions, and the strength of
taking into account the ow accuracy of the UAV-based atmospheric oxidation, the implication to account for this
cartridge sampler, the overall propagated uncertainty for two- variability is that the value of the numerator has a component of
sigma accuracy was better than 30% for the analyte concentra- direct emissions (Section 3.2). Furthermore, the trends in
tions, starting from SV-OVOC sampling over the forest through Fig. 2A and B are similar. The ratios at location S were 70% to
TD-GC-MS analysis in the laboratory. +380% compared to those at location P across the four weeks of
measurements (Fig. 2B). Error propagation of 30% uncertainty
3. Results and discussion in the numerator and in the denominator suggests that this
ratio should be banded by 40% to +40%. Given that the
3.1 SV-OVOC concentrations at locations P and S observations exceed this range in uncertainty, the implication is
Targeted semivolatile organic compounds included 2-methyl- that the direct emissions differ between the two locations.
threitol, 2-methylerythritol, pinonic acid, and pinic acid. These
various SV-OVOCs were quantied by selecting the character-
istic ion fragments of their trimethylsilyl derivatives in the GC 3.2 Possible explanations of SV-OVOC 2-methyltetrols
mass spectra. Specically, signal intensities at m/z 129, m/z 171, heterogeneity
and m/z 219 were used to quantify pinic acid, pinonic acid, and Several factors could contribute to the heterogeneity of 2-
2-methyltetrols, respectively (Fig. S1†). Although m/z 219 was methyltetrols concentrations between locations P and S.
used for both 2-methylthreitol and 2-methylerythritol, their Different emission rates of precursor VOC compounds (i.e.,
trimethylsilyl derivatives had different retention times on the isoprene) from the different forests underlying locations P and
GC column. Moreover, 2-methyltetrols organosulfates also S, distinct deposition rates to the forests underlying the two
contributed to the 2-methyltetrols signals from the decompo- locations due to differences in turbulent mixing over each
sition of organosulfates during the high-temperature desorp- canopy, and different direct emission rates from the two
tion step.30 The 2-methyltetrols family is thus operationally underlying forests are all possible contributing factors.
dened herein as the combined group of 2-methyltetrols and 2- A two-dimensional gradient transport model (eqn (1)) is used
methyltetrols organosulfates. In the atmosphere, pinonic and to aid in the examination of these possible factors. The model
pinic acids are typically associated with monoterpene oxida- resolves atmospheric processes by taking into consideration
tion.45 In addition to the targeted SV-OVOCs, peaks for other emission and deposition rates, longitudinal advection, vertical
12 | Environ. Sci.: Atmos., 2021, 1, 8–20 © 2021 The Author(s). Published by the Royal Society of ChemistryView Article Online
Paper Environmental Science: Atmospheres
This article is licensed under a Creative Commons Attribution 3.0 Unported Licence.
Open Access Article. Published on 21 December 2020. Downloaded on 09/06/2021 20:54:08.
Fig. 2 SV-OVOC concentrations across the study period. (A) Concentrations of 2-methyltetrols, pinonic acid, and pinic acid over the plateau
forest at location P and the slope forest at location S. (B) Ratios of the concentrations of 2-methyltetrols and pinonic acid. Error bars on the data
points in Panel A represent 30% experimental uncertainty. Error bars on the points in Panel B are the propagated uncertainties from concen-
tration measurements of 2-methyltetrols and pinonic acid. Data are plotted for each hourly sampling period of each week. Local time was 4 h
earlier than UTC. Plotted concentrations are listed in Table S2.† The 2-methyltetrols concentration is the sum of 2-methylthreitol concentration
and 2-methylerythritol concentration. For clarity of presentation, the data markers for 2-methyltetrols and pinic acid are offset along the abscissa
to the left and to the right in Panel A, respectively. Within experimental uncertainty (i.e., 30%) with that of location S for 8 of the 15 samples.
© 2021 The Author(s). Published by the Royal Society of Chemistry Environ. Sci.: Atmos., 2021, 1, 8–20 | 13View Article Online
Environmental Science: Atmospheres Paper
Table 1 Simulations and sensitivity analysis for near-canopy heterogeneity in 2-methyltetrols concentration. A gradient transport model was
used (see ESI). Simulation 1 is the reference case. Other parameters for the reference case are listed in Table S3. “P” and “S” refer to locations P and
S (Fig. 1). “U” refers to the forests located at the upwind direction which contribute to the concentrations measured at locations P and S. *Forest
type changes on a horizontal scale of 800 m. †Forest type changes on a horizontal scale of 200 m. ‡Estimated from isoprene epoxydiols
(0.03 m s1) and isoprene hydroxy hydroperoxides (0.01 m s1), which are structurally similar to 2-methyltetrols.50 §Specification of the difference
of eddy diffusivity over canopy. Example: “30 to 10; 10” means an eddy diffusivity from 30 to 10 m2 s1 from canopy to 3h, which is followed by 10
m2 s1 for >3h where h is the canopy height. {Percent difference in the concentration at location S relative to that at location P. kFraction
contributed by primary emission to the total 2-methyltetrols concentration at location S
Isoprene 2-Methyltetrols 2-Methyltetrols
This article is licensed under a Creative Commons Attribution 3.0 Unported Licence.
emission rate emission rate deposition rate Isoprene 2-Methyltetrols concentration
(ppb m s1) (ppb m s1) (m s1) concentration (ppb) (ng m3)
Open Access Article. Published on 21 December 2020. Downloaded on 09/06/2021 20:54:08.
Eddy diffusivity
P S U P S U P S U (m2 s1) P S D{ (%) P S D{ (%) fprik (%)
1 1* 0.5 0.5 0 0 0 0.03‡ 0.03‡ 0.03‡ 30 to 10; 10§ 3.98 2.61 34 157 153 3 0
2 1.5† 0.5 0.5 0 0 0 0.03 0.03 0.03 30 to 10; 10 4.05 2.61 36 157 153 3 0
3 1 0.5 0.5 0 0 0 0.01 0.01 0.01 30 to 10; 10 3.98 2.61 34 193 189 2 0
4 1 0.5 0.5 0 0 0 0.03 0.03 0.03 15 to 5; 5 5.86 3.84 34 200 194 3 0
5 1 0.5 0.5 0 0 0 0.03 0.10 0.03 30 to 10; 10 3.98 2.61 34 157 128 18 0
6 1 0.5 0.5 0 0 0 0.01 0.10 0.01 30 to 10; 10 3.98 2.61 34 193 149 23 0
7 1 0.5 0.5 0 0.001 0 0.03 0.03 0.03 30 to 10; 10 3.98 2.61 34 157 170 +8 10
8 1 0.5 0.5 0 0.005 0 0.03 0.03 0.03 30 to 10; 10 3.98 2.61 34 157 237 +51 35
9 1 0.5 0.5 0 0.015 0 0.03 0.03 0.03 30 to 10; 10 3.98 2.61 34 157 404 +157 62
convection, and chemical reaction rates of VOCs (e.g., isoprene)
and corresponding SV-OVOCs (e.g., 2-methyltetrols). The gov-
erning equation is as follows:
vC vC v2 C
¼ u þK 2 þEDþR (1)
vt vx vz
where C is the concentration of a VOC or an SV-OVOC; t is time;
u is horizontal wind speed; K is vertical eddy diffusivity; E, D,
and R are rates of emission, deposition, and chemical reaction,
respectively; x is horizontal distance; and z is height above
canopy. The model is described further in the ESI† as well as in
Batista et al.40
3.2.1 Non-uniform VOC emission rates
Concurrent VOC measurements and analysis by Batista et al.40
observed weekly-average differences of 64% to 31% in
isoprene concentrations between locations S and P. For an
overall monthly-average difference of 44%, a difference in
isoprene emission rates of 220% to 330% between the two
underlying forests was implied to fully explain this concentra-
tion difference. The hypothesis explored in this section is that
the uneven distribution of isoprene concentration could lead to
differences in the production and hence the concentration of 2-
methyltetrols over the two forests.
Simulations 1 and 2 in Table 1 consider this possibility.
Simulation 1 is performed for a difference in emission rate of
200% between the two forests (i.e., EP ¼ 200% ES) and simula-
tion 2 for a difference of 300%. The baseline emission rate of
isoprene is from the Model of Emissions of Gases and Aerosols
from Nature (MEGAN, version 2.1) for tropical forests.5 The
isoprene concentrations in simulations 1 and 2 at locations P Fig. 3 Simulated vertical concentration profiles. Vertical concentra-
and S differ by 34% and 36% (Table 1 and Fig. 3A), respec- tion distribution for simulations 1, 5, and 9 at locations P and S for (A)
tively, and the concentrations and the differences are within the isoprene (B) 2-methyltetrols.
range of concurrent observations at these locations (i.e., 4.4
14 | Environ. Sci.: Atmos., 2021, 1, 8–20 © 2021 The Author(s). Published by the Royal Society of ChemistryView Article Online
Paper Environmental Science: Atmospheres
1.9 ppb at location P and 2.4 2.0 ppb at location S, as pre- heterogeneity in the overlying atmospheric SV-OVOC concen-
sented in Batista et al.40). By comparison, the simulated 2- trations. Strong coherent eddies in the turbulent mixing within
methyltetrols concentrations are 157 ng m3 at location P and the roughness sublayer over the forest can develop at the canopy
153 ng m3 at location S for both simulations 1 and 2. These edge when air sweeps into the forest, thereby promoting the
concentrations are within the range of the observations (Table exchange of air between the forest and the overlying atmo-
S2†). sphere.47 These eddies can increase the depositional loss of
For both simulations 1 and 2, the relative difference in 2- atmospheric species. The typical overlying eddies can differ
methyltetrols concentration over the two locations is negligible. with forest type because the air ow can respond to local
The simulation results thus do not agree with the observations. topography over the rolling hills of the plateau, slope, and valley
This article is licensed under a Creative Commons Attribution 3.0 Unported Licence.
The conclusion is that the atmospheric observations are not regions.48 Forest growth and plant structure likewise responds
Open Access Article. Published on 21 December 2020. Downloaded on 09/06/2021 20:54:08.
explained by a non-uniform emission rate of isoprene. The to this topography because of soil type and drainage, among
result can be understood by consideration of the atmospheric other factors.49 In this way, heterogeneity in eddies over
lifetime of 2-methyltetrols. The lifetime is estimated as 4 to 230 different forests can contribute to the heterogeneity in SV-OVOC
days for OH concentrations ranging from 0.2 to 11 1012 mol concentrations over those forests. Another mechanism for
m3 in the central Amazon (Table S3†). This lifetime of several heterogeneous deposition could be active uptake of an SV-
days or more exceeds the atmospheric residence time in the OVOC by plants, and a dependence of uptake rate on plant
region, and the lifetime thus anticipates a well-mixed back- type, number, and activity, which differ with forest type.
ground concentration across the central Amazon, at least in the Horstmann and McLachlan,49 for example, showed that lipo-
absence of any strong local sources or sinks. Neither a decrease philic SV-OVOCs such as dibenzo-p-dioxins and dibenzofurans
in the deposition rate of 2-methyltetrols by three-fold (simula- can be taken up from the atmosphere by plant stomata, as well
tion 3) nor a reduction in vertical convection by decreasing the as the leaf and needle cuticle, and the observed uptake rates
eddy diffusivity by two-fold (simulation 4) in both locations differed between coniferous and deciduous forests.
changes the conclusion. The difference between sampling The possibility of heterogenous SV-OVOC deposition was
heights at 15 m above local canopy for location P and at 47 m simulated by adjusting the deposition rate (i.e., D of eqn (1)) at
above local canopy for location S also cannot explain the location S to mimic the processes of turbulent mixing, coherent
observed heterogeneity in 2-methyltetrols concentration eddies, and enhanced species deposition. For location P, the
(Fig. 3B). tested deposition rates of 2-methyltetrols over the two forests
A separate possibility, but one that is mathematically related included 0.03 m s1 (estimated for IEPOX; simulation 5) and
and therefore also explored in this section, is that a heteroge- 0.01 m s1 (estimated for isoprene hydroxy hydroperoxides,
neous distribution of oxidant concentration (e.g., OH concen- ISOPOOHs; simulation 6).50 IEPOX and ISOPOOHs have chem-
tration) leads to an uneven distribution of reaction rates and ical structures that are similar to those of the 2-methyltetrols
hence 2-methyltetrols concentration in the atmosphere (see family. For location S, a deposition rate of 0.10 m s1, which is
Text S2 in ESI†). The simulations for the effects of non-uniform the upper limit reported in the literature for measurements over
isoprene emission rates are mathematically similar to the the forest canopy, was used in both simulations 5 and 6 to test
effects of the possible spatial heterogeneity in oxidation rates. for the effects of differential deposition because of strong
As such, the same conclusion is reached that the observed coherent eddies.51 The obtained heterogeneity in the SV-OVOC
heterogeneity in 2-methyltetrols concentration cannot be concentration was 18% and 23% in simulations 5 and 6,
explained in this way. In both cases, the multi-day lifetime of 2- respectively (Table 1). This simulated heterogeneity is not
methyltetrols implies that atmospheric turbulence evens out sufficient to explain the observed concentration difference of 2-
the 2-methyltetrols concentration across a spatial scale that is methyltetrols of 70% to +480% between the two locations.
much larger than the observed heterogeneity ofView Article Online
Environmental Science: Atmospheres Paper
families, including Arecaceae, Caryocaraceae, Lecythidaceae, the present study leads to estimated particle-phase diastereo-
Fabaceae, Mimosaceae, and Solanaceae. The forest for location meric ratios of 0.34 0.06 at location P and 0.32 0.06 at
S mainly had Arecaceae, Fabaceae, and Lecythidaceae. Although location S. These ratios are in good agreement with the results
there was overlap in the family supersets between the two of four other studies for the central Amazon during the wet
locations, there was limited overlap in the family subsets of the season (Table S4†). The present study was also carried out in the
actual growing plant species at each location.40,52 Biological wet season.
production of OVOCs differs among plant species as well as For comparison, the ratio is reported to shi signicantly for
local environmental conditions (e.g., water table). These several the dry season in the central Amazon. It ranges from 0.07 0.06
different factors can lead to differing 2-methyltetrols emission for background conditions to 0.37 0.06 for polluted condi-
This article is licensed under a Creative Commons Attribution 3.0 Unported Licence.
rates for the forests underlying locations P and S. tions (Table S4†). The seasonal differences might be explained
Open Access Article. Published on 21 December 2020. Downloaded on 09/06/2021 20:54:08.
This possibility was further evaluated by carrying out several by shis in the atmospheric chemistry as a result of higher
different simulations to test if this mechanism can quantita- concentrations of pollutants such as ozone and sulfate as well
tively account for the observed differences in 2-methyltetrols as other factors in the dry season. The results of the present
concentration. The introduction of direct emissions of 2- study, however, suggest that another contributing factor could
methyltetrols in the simulation signicantly enhances the be that the relative direct emission rates of the 2-methylthreitol
heterogeneity (Table 1 and Fig. 3). The concentration of 2- and 2-methylerythritol from forests differ between the seasons,
methyltetrols is +8%, to +51%, to +157% for location S possibly because of differing inuences of environmental stress
compared to location P, for respective direct emission rates of or possibly because of competing sources of direct emissions. In
0.001, 0.005, and 0.015 ppb m s1 underlying location S while regard to the latter, for China Fu et al.55 observed a high
maintaining no emission underlying location P (simulations 7, correlation between the diastereomeric ratio and the concen-
8, and 9). The simulated heterogeneity (e.g., +157% in simula- tration of levoglucosan, which is an important tracer of biomass
tion 9) is in good agreement with the atmospheric observations burning. This result could suggest that biomass burning can
(e.g., weekly-average differences of up to +176% in Table S2†). also serve as a source of direct emissions that favors 2-methyl-
Furthermore, for these direct emission rates the modeled frac- threitol over 2-methylerythritol.
tion of 2-methyltetrols contributed by direct emission to the A yield of particle-phase 2-methyltetrols from isoprene,
total 2-methyltetrols concentration at location S ranges from meaning [2-methyltetrols]particle/[isoprene]reacted, can be
10% to 62% (Table 1). This result is consistent with the report by dened. Laboratory gas-phase experiments for HO2-dominant
González et al.32 These several lines of evidence all support that conditions like the wet season of the Amazon estimate a yield of
direct emissions can explain the observed horizontal hetero- 0.6%.29 The measured 2-methyltetrols concentrations of this
geneity of 2-methyltetrols concentration in the near canopy over study imply apparent yields of 0.4 0.3% at location P and 1.2
the forest. 0.8% at location S (Table S5†) based on the concurrent
isoprene concentrations reported in Batista et al.40 and the gas/
particle partitioning fractions of Isaacman-VanWertz et al.16
3.3 Additional evidence: isomeric ratio and apparent yield of Within experimental uncertainty, the apparent yield at location
2-methyltetrols P is in agreement with the laboratory-measured yield. The
The methylthreitol-to-methylerythritol concentration ratio for apparent yield at location S is higher, however. The difference in
the particle phase has helped to identify the production path- apparent yields at locations P and S is robust within the
ways of 2-methyltetrols in the atmosphere.53,54 For a deciduous measurement uncertainty. An apparent yield can be explained
broadleaf forest, Miyazaki et al.53 found that diastereomeric as higher than the intrinsic yield of gas-phase chemistry in the
ratio was sensitive to sulfate and hydronium concentrations in vicinity of direct local emissions of 2-methyltetrols from the
atmospheric PM. The implication was that production path- forest.
ways in humid aerosol particles and cloud droplets in the
atmosphere must be important, at least in part, relative to 4. Conclusion
reactions in the gas phase as well as direct biological emissions.
In a chamber study of isoprene oxidation, under HO2-dominant The emission, deposition, and chemistry of SV-OVOCs are
conditions the ratio was sensitive to the relative concentrations dynamic over the heterogenous landscape of the Amazon
of OH and ozone.54 tropical forest. In this study, the concentration and distribution
Herein, the diastereomeric ratio of the total concentration, of SV-OVOCs from isoprene and monoterpene oxidation were
meaning without resolving into gas-phase and particle-phase investigated in the wet season of the central Amazon with the
concentrations, was 0.60 0.10 at location P and 0.57 0.10 aid of a hovering unmanned aerial vehicle. There was hetero-
at location S during the study period (mean one-sigma vari- geneity in the concentration of 2-methyltetrols over two forests
ation; Table S2 and Fig. S2†). Isaacman-VanWertz et al.16 sepa- that were several hundred meters apart from each other. By
rately measured the concentrations in both phases in the wet comparison, the concentrations of pinonic and pinic acids had
season of the central Amazon. 2-Methylthreitol partitioned as no statistical difference.
69% in the gas phase and 31% in the particle phase, and 2- Results from a gradient transport model suggest that non-
methylerythritol partitioned as 45% in the gas phase and 55% uniform isoprene emission over the two forests does not
in the particle phase. Applying these fractions to the results of explain the heterogeneity of 2-methyltetrols concentration.
16 | Environ. Sci.: Atmos., 2021, 1, 8–20 © 2021 The Author(s). Published by the Royal Society of ChemistryView Article Online
Paper Environmental Science: Atmospheres
Chemical yields are too low and atmospheric lifetimes are too of 2-methyltetrols, incorporation of 2-methyltetrols organo-
long. The lifetime of 2-methyltetrols against chemical loss is on sulfates in the measurement protocols could be fruitful as
the order of a week for typical OH concentrations. Differences in a strong chemical tracer of secondary processes.
deposition rates because of distinct local forest micrometeo- Building upon earlier work for VOCs, ozone, and black
rology and associated coherent eddies can contribute to but not carbon,40,41,57,58 the SV-OVOC ndings of the present study
fully explain the magnitude of the heterogeneity in 2-methylte- demonstrate the capability of using UAVs as valuable mobile
trols concentration. Furthermore, other species such as pinonic sampling platforms for atmospheric chemical sensing and
and pinic acids would be expected to have differences in addressing scientic unknowns in atmospheric chemistry. The
concentrations, too, if heterogeneity in deposition were a domi- heterogeneity in 2-methyltetrols concentration observed in this
This article is licensed under a Creative Commons Attribution 3.0 Unported Licence.
nant mechanism, whereas the observations show homogeneity in study in the horizontal plane of the atmospheric boundary layer
Open Access Article. Published on 21 December 2020. Downloaded on 09/06/2021 20:54:08.
the concentrations of these two acids. Simulations show that of the central Amazon highlights the more general need for
heterogeneity in the emission rate depending on the underlying understanding and quantifying emissions and atmospheric
forest can quantitatively account for the differences observed in process of SV-OVOCs, especially at intermediate scales.
the overlying atmospheric concentrations.
More generally, these results demonstrate how mapping out Data availability
the near-canopy horizontal heterogeneity in the concentration
of SV-OVOCs can be an effective strategy for isolating the Results for simulations 1 to 9 of Table 1 are available at DOI:
contribution of in situ atmospheric production of SV-OVOCs 10.7910/DVN/RROEDO. Concentrations of SV-OVOCs measured
from direct emissions of the underlying forest. This strategy by the TD-GC-MS system are summarized in Table S2.†
can serve as a complementary approach for traditional bottom-
up leaf-level emission measurements. In a diverse forest such as Author contribution
the Amazon tropical forest where direct SV-OVOC emissions
may vary among plant species and families and under different J. Y. and S. T. M. designed the research; J. Y., C. E. B., P. C. G., I.
environmental conditions, a comprehensive program of leaf- O. R., R. G. B., and R. L. O. conducted the research; J. Y. and
level measurements for accurately scaling up can become C. V. performed the chemical analysis; J. Y. and Y. M. carried out
impractical. Near-canopy measurements can represent simulations using the gradient transport model; J. Y., K. J. J., J.
a complementary alternative approach that captures the D. S., A. B. G., R. A. F. S., and S. T. M. analyzed the data; and J. Y.
combined effects of local forest emissions, albeit without the and S. T. M. wrote the paper.
detailed view of leaf-level measurements.
Further development, improvement, and quantication of Conflicts of interest
this strategy to infer heterogeneity in emissions based on near-
canopy horizontal concentration heterogeneity is thus well The authors declare no conict of interest.
motivated, and several recommendations can be considered. In
particular, a complementary focus on vertical proles of SV- Acknowledgements
OVOC concentrations at each horizontal sampling point
might prove quite valuable. Simulation 1, representing an This work was funded by the Division of Atmospheric and
absence of emissions, shows that the 2-methyltetrols concen- Geospace Sciences (AGS) of the USA National Science Founda-
tration changes little in the lower part of the atmospheric tion (AGS-1829025 and AGS-1829074). The Brazilian Federal
boundary layer of a few hundred meters, mostly because of the Agency for Support and Evaluation of Graduate Education
long lifetime of 2-methyltetrols. Many other SV-OVOCs of (CAPES), the Brazilian National Council for Scientic and
common interest have similarly long lifetimes. Strong deposi- Technological Development (CNPq), a Senior Visitor Research
tion to the forest or strong direct emission from the forest can Grant of the Amazonas State Research Foundation (FAPEAM)
change the shape of the concentration prole for these SV- (062.00568/2014 and 062.00491/2016), and the Harvard Climate
OVOCs (simulations 5 and 9). Collection of vertical proles Change Solutions Fund are acknowledged. Jianhuai Ye
can thus be complementary in a scientic sense to horizontal acknowledges support from a postdoctoral fellowship from the
mapping of SV-OVOC concentrations. Natural Sciences and Engineering Research Council of Canada
Another recommendation for future efforts is that the and a fellowship in Environmental Chemistry from the Dreyfus
concentrations of strong biomarkers of direct forest emissions Foundation. The synthesis of 2-methyltetrols was supported
only, such as sugars and sugar alcohols,34,35 and the concen- through a grant from the USA National Science Foundation
trations of strong chemical tracers of atmospheric secondary (AGS-1703535).
processes, such as inorganic nitrate and sulfate salts,56 could be
simultaneously measured. In a combined data set, a correlation References
analysis between the SV-OVOC concentrations produced by the
two mechanisms and the concentrations of species produced 1 R. Seco, J. Peñuelas and I. Filella, Short-chain oxygenated
dominantly by one mechanism (i.e., primary or secondary) VOCs: emission and uptake by plants and atmospheric
might provide additional robustness and quantication with sources, sinks, and concentrations, Atmos. Environ., 2007,
respect to atmospheric SV-OVOCs sources. For the specic case 41, 2477–2499.
© 2021 The Author(s). Published by the Royal Society of Chemistry Environ. Sci.: Atmos., 2021, 1, 8–20 | 17View Article Online
Environmental Science: Atmospheres Paper
2 A. C. Heiden, K. Kobel, C. Langebartels, G. Schuh-Thomas rates are a key mechanism of thermal tolerance in the
and J. Wildt, Emissions of oxygenated volatile organic tropical species Vismia guianensis, Glob. Change Biol.,
compounds from plants Part I: emissions from 2020, 1–14.
lipoxygenase activity, J. Atmos. Chem., 2003, 45, 143–172. 14 E. L. Singsaas, M. Lerdau, K. Winter and T. D. Sharkey,
3 J. Kesselmeier, Exchange of short-chain oxygenated volatile Isoprene increases thermotolerance of isoprene-emitting
organic compounds (VOCs) between plants and the species, Plant Physiol., 1997, 115, 1413–1420.
atmosphere: a compilation of eld and laboratory studies, 15 R. Harkov, in Air Pollution. The Handbook of Environmental
J. Atmos. Chem., 2001, 39, 219–233. Chemistry, ed. H. Brauer, J. S. Gaffney, R. Harkov, M. A. K.
4 P. Perata and A. Alpi, Plant responses to anaerobiosis, Plant Khalil, F. W. Lipfert, N. A. Marley, E. W. Prestbo and G. E.
This article is licensed under a Creative Commons Attribution 3.0 Unported Licence.
Sci., 1993, 93, 1–17. Shaw, Springer Berlin Heidelberg, Berlin, Heidelberg, 1989,
Open Access Article. Published on 21 December 2020. Downloaded on 09/06/2021 20:54:08.
5 A. B. Guenther, X. Jiang, C. L. Heald, T. Sakulyanontvittaya, vol. 4/4B, pp. 39–68.
T. Duhl, L. K. Emmons and X. Wang, The model of 16 G. Isaacman-VanWertz, L. D. Yee, N. M. Kreisberg,
emissions of gases and aerosols from nature version 2.1 R. Wernis, J. A. Moss, S. V. Hering, S. S. De Sá,
(MEGAN2.1): an extended and updated framework for S. T. Martin, M. L. Alexander, B. B. Palm, W. Hu,
modeling biogenic emissions, Geosci. Model Dev., 2012, 5, P. Campuzano-Jost, D. A. Day, J. L. Jimenez, M. Riva,
1471–1492. J. D. Surratt, J. Viegas, A. Manzi, E. Edgerton, K. Baumann,
6 H. B. Singh, L. J. Salas, R. B. Chateld, E. Czech, A. Fried, R. Souza, P. Artaxo and A. H. Goldstein, Ambient gas-
J. Walega, M. J. Evans, B. D. Field, D. J. Jacob, D. Blake, particle partitioning of tracers for biogenic oxidation,
B. Heikes, R. Talbot, G. Sachse, J. H. Crawford, M. A. Avery, Environ. Sci. Technol., 2016, 50, 9952–9962.
S. Sandholm and H. Fuelberg, Analysis of the atmospheric 17 J. H. Kroll and J. H. Seinfeld, Chemistry of secondary organic
distribution, sources, and sinks of oxygenated volatile aerosol: formation and evolution of low-volatility organics in
organic chemicals based on measurements over the Pacic the atmosphere, Atmos. Environ., 2008, 42, 3593–3624.
during TRACE-P, J. Geophys. Res.: Atmos., 2004, 109, D15S07. 18 U. Pöschl, S. T. Martin, B. Sinha, Q. Chen, S. S. Gunthe,
7 K. J. Jardine, K. Meyers, L. Abrell, E. G. Alves, A. M. Yanez J. A. Huffman, S. Borrmann, D. K. Farmer, R. M. Garland,
Serrano, J. Kesselmeier, T. Karl, A. Guenther, G. Helas, J. L. Jimenez, S. M. King, A. Manzi, E. Mikhailov,
J. Q. Chambers and C. Vickers, Emissions of putative T. Pauliquevis, M. D. Petters, A. J. Prenni, P. Roldin,
isoprene oxidation products from mango branches under D. Rose, J. Schneider, H. Su, S. R. Zorn, P. Artaxo and
abiotic stress, J. Exp. Bot., 2013, 64, 3697–3708. M. O. Andreae, Rainforest aerosols as biogenic nuclei of
8 K. J. Jardine, R. K. Monson, L. Abrell, S. R. Saleska, A. Arneth, clouds and precipitation in the Amazon, Science, 2010, 329,
A. Jardine, F. Y. Ishida, A. M. Y. Serrano, P. Artaxo, T. Karl, 1513–1516.
S. Fares, A. Goldstein, F. Loreto and T. Huxman, Within- 19 I. G. Kavouras, N. Mihalopoulos and E. G. Stephanou,
plant isoprene oxidation conrmed by direct emissions of Secondary organic aerosol formation vs. primary organic
oxidation products methyl vinyl ketone and methacrolein, aerosol emission: in situ evidence for the chemical
Glob. Change Biol., 2012, 18, 973–984. coupling between monoterpene acidic photooxidation
9 W. Jud, L. Fischer, E. Canaval, G. Wohlfahrt, A. Tissier and products and new particle formation over forests, Environ.
A. Hansel, Plant surface reactions: an opportunistic ozone Sci. Technol., 1999, 33, 1028–1037.
defence mechanism impacting atmospheric chemistry, 20 L. L. D. Cooper, J. E. Oliver, E. D. De Vilbiss and R. P. Doss,
Atmos. Chem. Phys., 2016, 16, 277–292. Lipid composition of the extracellular matrix of Botrytis
10 L. Cappellin, F. Loreto, F. Biasioli, P. Pastore and cinerea germlings, Phytochemistry, 2000, 53, 293–298.
K. McKinney, A mechanism for biogenic production and 21 E. G. Stephanou and N. Stratigakis, Oxocarboxylic and a,u-
emission of MEK from MVK decoupled from isoprene dicarboxylic acids: photooxidation products of biogenic
biosynthesis, Atmos. Chem. Phys., 2019, 19, 3125–3135. unsaturated fatty acids present in urban aerosols, Environ.
11 K. J. Jardine, R. F. Zorzanelli, B. O. Gimenez, L. R. d. Oliveira Sci. Technol., 1993, 27, 1403–1407.
Piva, A. Teixeira, C. G. Fontes, E. Robles, N. Higuchi, 22 A. Kubátová, R. Vermeylen, M. Claeys, J. Cafmeyer,
J. Q. Chambers and S. T. Martin, Leaf isoprene and W. Maenhaut, G. Roberts and P. Artaxo, Carbonaceous
monoterpene emission distribution across hyperdominant aerosol characterization in the Amazon basin, Brazil: novel
tree genera in the Amazon basin, Phytochemistry, 2020, dicarboxylic acids and related compounds, Atmos. Environ.,
175, 112366. 2000, 34, 5037–5051.
12 A. M. Yáñez-Serrano, E. Bourtsoukidis, E. G. Alves, 23 T. Duvold, J.-M. Bravo, C. Pale-Grosdemange and
M. Bauwens, T. Stavrakou, J. Llusià, I. Filella, A. Guenther, M. Rohmer, Biosynthesis of 2-C-methyl-D-erythritol,
J. Williams, P. Artaxo, K. Sindelarova, J. Doubalova, a putative C5 intermediate in the mevalonate independent
J. Kesselmeier and J. Peñuelas, Amazonian biogenic pathway for isoprenoid biosynthesis, Tetrahedron Lett.,
volatile organic compounds under global change, Glob. 1997, 38, 4769–4772.
Change Biol., 2020, 1–30. 24 S. Sagner, W. Eisenreich, M. Fellermeier, C. Latzel, A. Bacher
13 T. B. Rodrigues, C. R. Baker, A. P. Walker, N. McDowell, and M. H. Zenk, Biosynthesis of 2-C-methyl-D-erythritol in
A. Rogers, N. Higuchi, J. Q. Chambers and K. J. Jardine, plants by rearrangement of the terpenoid precursor, 1-
Stimulation of isoprene emissions and electron transport
18 | Environ. Sci.: Atmos., 2021, 1, 8–20 © 2021 The Author(s). Published by the Royal Society of ChemistryYou can also read