Reimplementation of the Biome-BGC model to simulate successional change
←
→
Page content transcription
If your browser does not render page correctly, please read the page content below
Tree Physiology 25, 413–424
© 2005 Heron Publishing—Victoria, Canada

Reimplementation of the Biome-BGC model to simulate successional
change
BEN BOND-LAMBERTY,1,2 STITH T. GOWER,1 DOUGLAS E. AHL1 and PETER E.
THORNTON3
1
    Department of Forest Ecology and Management, University of Wisconsin-Madison, 1630 Linden Drive, Madison, WI 53706, USA
2
    Corresponding author (bpbond@wisc.edu)
3
    The National Center for Atmospheric Research, Climate and Global Dynamics Division, 1850 Table Mesa Drive, Boulder, CO 80305, USA

Received June 15, 2004; accepted September 10, 2004; published online February 1, 2005

                                                                                                                                               Downloaded from http://treephys.oxfordjournals.org/ by guest on March 5, 2015
Summary Biogeochemical process models are increasingly                    2002). Ecophysiological process models, running on increas-
employed to simulate current and future forest dynamics, but              ingly cheap and powerful computers, estimate NPP and NEE
most simulate only a single canopy type. This limitation means            by simulating processes such as photosynthesis, respiration,
that mixed stands, canopy succession and understory dynamics              nutrient and water cycling, growth and mortality, and decom-
cannot be modeled, severe handicaps in many forests. The                  position. Such models permit estimates of these processes at
goals of this study were to develop a version of Biome-BGC                landscape to global scales, at which field sampling is impracti-
that supported multiple, interacting vegetation types, and to as-         cal, and can simulate ecosystem responses to future climate
sess its performance and limitations by comparing modeled re-             change (Waring and Running 1998).
sults to published data from a 150-year boreal black spruce                  Biome-BGC is a non-spatial biogeochemical and eco-
(Picea mariana (Mill.) BSP) chronosequence in northern                    physiological model that uses daily meteorological data and
Manitoba, Canada. Model data structures and logic were modi-              general stand soil information, to simulate energy, carbon (C),
fied to support an arbitrary number of interacting vegetation             water and nitrogen (N) cycling (Running and Coughlin 1988,
types; an explicit height calculation was necessary to prioritize         Running and Hunt 1993, Thornton 1998, White et al. 2000).
radiation and precipitation interception. Two vegetation types,           Leaf area index controls radiation absorption and a Farquhar
evergreen needle-leaf and deciduous broadleaf, were modeled               photosynthesis model for a homogeneous canopy separated
based on site-specific meteorological and physiological data.             into sunlit and shaded leaves (Kimball et al. 1997a). Respira-
The new version of Biome-BGC reliably simulated observed                  tion components (heterotrophic and autotrophic growth, and
changes in leaf area, net primary production and carbon stocks,           autotrophic maintenance) are treated separately, and governed
and should be useful for modeling the dynamics of mixed-spe-              by Q10 response values. Net primary production is partitioned
cies stands and ecological succession. We discuss the strengths           into biomass compartments following dynamic allocation pat-
and limitations of Biome-BGC for this application, and note               terns that reflect nitrogen limitations. We do not describe fur-
areas in which further work is necessary for reliable simulation          ther the inner processes and logic of Biome-BGC, because
of boreal biogeochemical cycling at a landscape scale.                    they have been discussed in detail (Running and Coughlin
Keywords: black spruce, boreal forest, carbon, ecological                 1988, Running and Gower 1991, Kimball et al. 1997a, Thorn-
modeling.                                                                 ton 1998). The model’s parameter sensitivities and other char-
                                                                          acteristics have also been analyzed extensively (White et al.
                                                                          2000, Amthor et al. 2001, Potter et al. 2001, Thornton et al.
                                                                          2002).
Introduction                                                                 The current version (4.1.2) of Biome-BGC operates on a
Field measurements and simulation modeling are complemen-                 single vegetation type; here, vegetation type refers to a particu-
tary, necessary approaches to studying ecosystem dynamics.                lar set of the ecophysiological parameters used by Biome-
This is particularly true given the mismatch between the slow             BGC to simulate biota biogeochemical cycling. These vegeta-
rate of ecosystem change and the brevity of most research pro-            tion types are intended to represent coarse distinctions be-
jects (Powers and Van Cleve 1991, Grace 2004). The key                    tween functional groups, e.g., evergreen needle-leaf and de-
descriptors of forest and other terrestrial ecosystems—notably            ciduous broadleaf C3 woody plants, rather than species-spe-
autotrophic net primary production (NPP) and net ecosystem                cific distinctions (Running and Coughlin 1988). The treatment
production (NEP) or exchange (NEE)— can be laborious, de-                 of the ecosystem as a single canopy is a powerful simplifica-
structive, time-consuming and expensive to measure (Wofsy et              tion but poses several problems. First, mixed-species systems
al. 1993, Clark et al. 2001, Gower et al. 2001, Randerson et al.          cannot be modeled. Forest models have traditionally focused
414 BOND-LAMBERTY, GOWER, AHL AND THORNTON
on even-aged single-species stands (Porté and Bartelink
2002), but most forests are heterogeneous in age and species
(Landsberg and Gower 1997). Second, understory and over-
story processes cannot be distinguished. This is problematic
when modeling systems where the understory or ground cover
plays an important role in biogeochemical cycles. For exam-
ple, in the boreal forest, bryophytes sequester a large amount
of carbon and form a crucial part of the water and nitrogen cy-
cles, yet their presence, abundance and species mix depend on
the overstory leaf area index (Vogel and Gower 1998,
Swanson and Flanagan 2001, O’Connell et al. 2003, Turetsky
2003, Bond-Lamberty et al. 2004b). Third, stand succession
cannot be modeled using a single vegetation type as in
Biome-BGC Version 4.1.2, because the definition of succes-
sion involves replacement of one vegetation type with another
(Waring and Schlesinger 1985). Such succession is an impor-
tant process in most terrestrial ecosystems, and limits the tem-
Downloaded from http://treephys.oxfordjournals.org/ by guest on March 5, 2015
poral utility of Biome-BGC.
The goals of this study were to: (1) develop a version of
Biome-BGC that supports multiple, interacting vegetation
types; and (2) assess the performance and limitations of this
extension to Biome-BGC by comparing the model’s results to
field data from multiple studies and results from the unmodi-
fied single-vegetation model. We focus here on field data, par-
ticularly published stand structural characteristics and carbon
fluxes, from a 150-year boreal chronosequence in northern
Manitoba, Canada. Figure 1. Simplified schematic of nitrogen (N) cycling in Biome-
BGC, showing pools and fluxes. Ovals represent ecosystem sources
or sinks. Pools and fluxes were categorized as vegetation- (light boxes
Materials and methods and dashed lines) or site-specific (dark boxes and solid lines).
Constraint on changes to Biome-BGC
We imposed an important constraint on structural and func- code has extensive internal documentation and is available
tional changes to Biome-BGC: running the new (modified) from the Numerical Terradynamic Simulation Group at the
version, hereafter termed Biome-BGC-MV, with a single veg- School of Forestry, University of Montana (http://www.ntsg.
etation type had to produce results completely identical to the umt.edu).
4.1.2 version. This simplified assessment of the effects of add- Input and output of the modified model function largely as
ing multiple vegetation types, and comparison with published in the 4.1.2 version. Instead of reading a single set of eco-
single-vegetation results using the older model. physiological constants (EPC), Biome-BGC-MV reads the
number of vegetation types to model and then a list of EPC
Structural changes to Biome-BGC files. These EPC files are identical to the older-version files
The source code of Biome-BGC Version 4.1.2 was modified to except for two extra parameters, discussed below. Initial C and
allow for multiple concurrent vegetation types. The model’s N values for leaves, wood, litter, and woody debris are speci-
internal data structures were divided into two groups: those fied on a vegetation-specific, not a site-specific, basis. There is
that tracked only site variables (e.g., meteorological data, soil no change in how output variables are specified, but variables
carbon and nitrogen pools), and thus required no modification; are tracked and written on a vegetation-specific basis. Site-
and those that tracked vegetation-specific variables (e.g., veg- level variables (e.g., NEP or soil respiration) can of course still
etation pools and fluxes). Leaf litter, woody litter and coarse be output.
woody debris were considered specific to a particular vegeta-
tion type until entering soil pools via decomposition. For ex- Functional changes to Biome-BGC
ample, Figure 1 shows the division between site- and vegeta- Many Biome-BGC processes required few changes or none.
tion-specific variables for the model’s internal nitrogen cycle. For example, modeled N deposition, snow melt and water out-
Internally, the static data structures tracking vegetation-spe- flow do not directly depend on vegetation, and operate as in
cific information were replaced by pointers to arrays of such version 4.1.2. Conversely, photosynthesis, carbon allocation
structures; the only limit to the number of vegetation types the and respiration are vegetation-specific processes, and in
model can track are the computational resources. For more de- Biome-BGC-MV, are computed separately on the vegetation-
tails, see the Appendix and the Biome-BGC source code; this specific data structures. Similarly, daily updating of state vari-
TREE PHYSIOLOGY VOLUME 25, 2005BIOME-BGC AND SUCCESSIONAL CHANGE 415
ables is done separately for each vegetation type, and once for (Bond-Lamberty et al. 2002b, Wang et al. 2003), leaf area
non-vegetation-specific (primarily soil) pools. More funda- (Bond-Lamberty et al. 2002b), soil and woody debris CO2
mental modifications were required in areas where vegetation fluxes (Bond-Lamberty et al. 2002a, Wang et al. 2002b), car-
types compete for resources. The implementation of competi- bon distribution (Wang et al. 2003), net primary production
tion between vegetation types for light and precipitation inter- and net ecosystem production (Bond-Lamberty et al. 2004b),
ception was based on vegetation height. Two EPC parameters heterotrophic soil respiration (Bond-Lamberty et al. 2004a)
were added to describe the relationship between mass (m; kg C and net ecosystem exchange (Litvak et al. 2002). The stands
m –2) and height (h; m) for each vegetation type. An exponen- were dominated by three tree species: trembling aspen
tial equation of the form: (Populus tremuloides Michx), black spruce, and to a lesser ex-
tent jack pine (Pinus banksiana Lamb.). Early successional
–
5
m
deciduous tree species give way to black spruce in the older
m h max
h = h max(1 – e ) (1) chronosequence stands; the black spruce canopy closure, at
50–60 years, is associated with drastic thinning of the under-
story and growth of thick feather mosses (usually Ptilium,
was chosen to describe this relationship. The two parameters
Pleurozium or Hylocomium spp.). The chronosequence was
supplied for each vegetation type are h max, the maximum vege-
unreplicated, but (1) its understory and overstory succession
tation height, and m hmax, the vegetation mass at which this
patterns were similar to those seen in other studies of boreal
height is attained. This equation form has the advantage that
Downloaded from http://treephys.oxfordjournals.org/ by guest on March 5, 2015
black spruce (Black and Bliss 1978, Foster 1985); and (2) it
both parameters have easily understandable meanings (in con-
was found to be representative of an additional 14 stands sam-
trast, for example, to a polynomial equation) (Bates and Watts
pled in the 500 × 500 km BOREAS northern study area
1988). The constant value of 5 in Equation 1 ensures that h will
(Bond-Lamberty et al. 2004b).
rise to within 1% of h max by m = m max. At the beginning of each
simulation year, Biome-BGC-MV computes the height of
each vegetation type based on current stem (for woody plants) Model data sources: site, soil and meteorological parameters
or leaf (for nonwoody plants) mass. All light and precipitation All parameters needed to reproduce the results reported below
interception for the subsequent year occurs using this height are given in Tables 1 and 2, except for the daily meteorological
order, with the tallest vegetation intercepting first; light or pre- data, for which summaries are presented. Site-specific param-
cipitation that is not intercepted becoming available to the next eters (Table 1) used to model the black spruce chronosequence
tallest vegetation type. The height order is not currently used generally follow the values given by Amthor et al. (2001) and
by any other process. Kimball et al. (1997a). Effective soil depth was set to 0.5 m,
Competition among plants for N and soil water is more following those authors. Atmospheric CO2 concentration was
complex and less well understood than for light (Lambers et al. treated as a constant 320 ppm, approximately the historical
1998), and the existing Biome-BGC logic regarding these pro- value ‘halfway’ through the chronosequence (i.e., about 1930)
cesses was not changed. For N, total demand from plant up- (IPCC 2001).
take, litter decomposition and soil processes is assessed; if The primary source of meteorological data was the regional
demand is greater than the available soil mineral N pool, every and global coverage of meteorological parameters available
potential demand flux (calculated beforehand, based on vege- from the NCEP/NCAR Reanalysis Project (Kalnay et al.
tation type growth and soil decomposition potential) is re- 1996, Kistler et al. 2001). These data span the period from
duced by the same proportion, such that all available N will be 1948 to the present with a global grid resolution of 192 × 94
used. ‘Spinup’ mode, where extra N is added to the system to (~2°); only 20 years (1980–1999) were used for the BOREAS
satisfy a portion of total demand, was unchanged. A similar region simulated here. Two supplementary datasets were used
logic is followed for soil water uptake. In Biome-BGC-MV, as as checks on the applicability of the NCEP/NCAR data: (1)
in the 4.1.2 version, plants receive no benefit in N or water up- the site-specific surface meteorological and radiation parame-
take from photosynthate investment in fine roots (White et al. ters collected during BOREAS (Osborne et al. 1998); and (2)
2000), with plant uptake treated as a function only of demand each chronosequence stand was instrumented for four years
versus supply (Thornton 1998). The Appendix highlights ma- (1999–2003) with micrometeorological stations recording air
jor changes in internal model logic. and soil temperatures, photosynthetically active radiation
(PAR), relative humidity and soil water content. These data
Comparison with field chronosequence data were used to verify that the NCEP/NCAR data accurately rep-
Results of the modified Biome-BGC model were compared resented local conditions.
with data from a well-drained black spruce (Picea mariana We used monthly precipitation data from the Global Precip-
(Mill.) BSP)-dominated fire chronosequence west of Thomp- itation Climatology Project (GPCP) (Adler et al. 2003). Grid
son, Manitoba, Canada, near the BOREAS Northern Study size for these data is 144 × 72 cells, with a spatial resolution of
Area (55°53′ N, 98°20′ W). The chronosequence consisted of 2.5°. To apportion these values into the daily time step re-
seven different-aged black spruce forests; the oldest stand in quired by Biome-BGC, we used the precipitation interval (i.e.,
the chronoseqence (151 years) was the BOREAS NSA tower days between precipitation events) recorded by the on-site
site (Sellers et al. 1997, Goulden et al. 1998). The stands have micrometeorological stations noted previously; these precipi-
been studied extensively, and differed in their species mix tation patterns generally matched data recorded at the BOR-
TREE PHYSIOLOGY ONLINE at http://heronpublishing.com416 BOND-LAMBERTY, GOWER, AHL AND THORNTON
Table 1. Simulation site parameters for the black spruce chronose- r 2 = 0.98) and J. Martin (University of Wisconsin, Madison,
quence in BOREAS NSA. Meteorological data summarize the cli- WI, unpublished data) for P. tremuloides (n = 13, r 2 = 0.37).
mate file that drove the simulation, and are given as annual means ± The P. mariana data were from the chronosequence described
1 SD (based on 20 years of daily data; see text). and the P. tremuloides data were collected in aspen-dominated
boreal forests 100 km to the south.
Parameter Value Reference
Model data sources: initial site C and N pools
Site and soil
Elevation (m) 260 Halliwell and Apps (1997) Initial site carbon and nitrogen conditions were set to mimic
Latitude (°) 55.9 Halliwell and Apps (1997) those of a mature boreal black spruce forest after stand-killing
Albedo (%) 10.0 Betts and Ball (1997) wildfire—generally observed values from the youngest stand
Effective soil 0.5 Steele et al. (1997) in the chronosequence. Coarse woody debris values for the ev-
depth (m) ergreen needle-leaf and deciduous broadleaf vegetation types
Sand:silt:clay ratio 26:29:45 Burke et al. (1997) were set to 4.7 and 0.0 kg C m –2, respectively (Bond-Lamberty
Nitrogen deposition 0.0004 Peng and Apps (1998) et al. 2002a, Wang et al. 2003); the latter value was zero be-
(kg N m –2 year –1)
cause mature black spruce stands are single-species stands af-
Nitrogen fixation 0.0006 Peng and Apps (1998)
(kg N m –2 year –1)
ter canopy closure at 50–60 years (Black and Bliss 1978,
Bond-Lamberty et al. 2002b, Wang et al. 2003). All fine litter
Downloaded from http://treephys.oxfordjournals.org/ by guest on March 5, 2015
Meteorological data C and N values, as well as soil mineral N (which differs from
Mean annual air –3.7 ± 1.0 total soil N; cf. Figure 1), were set to 0.0 kg m –2, assuming
temperature (°C)
complete volatilization in fire (Stocks and Kauffman 1997,
Mean January air –23.5 ± 3.8
Wang et al. 2003). We used the same value for initial soil C
temperature (°C)
Mean July air 15.6 ± 1.3 (8.7 kg C m –2, with the four soil pools containing 0.0, 0.2, 2.0
temperature (°C) and 6.5 kg C m –2) as that used by Kimball et al. (1997a, 2000).
Mean annual 487.6 ± 52.7
precipitation (mm) Single-vegetation simulation and ensembling
Mean annual 317.8 ± 46.0 All simulations were performed with Biome-BGC-MV, the
rainfall (mm) modified multi-vegetation Biome-BGC. For comparison, sin-
gle-vegetation simulations were also performed with the ever-
green needle-leaf and deciduous broadleaf parameters given in
EAS NSA flux tower and available through the ORNL/DAAC Table 2; as noted previously, these results were identical to re-
and Ameriflux web sites. These observed data (mean monthly sults obtained with the current 4.1.2 version of the model. For
precipitation intervals of 15, 12, 15, 3, 3, 2, 2, 2, 2, 3, 9 and all simulations, we used the ensembling method of Thornton et
16 days for January to December, respectively) were used to al. (2002) to remove the effects of interannual climate variabil-
“space” the monthly NCEP/NCAR precipitation data to daily ity from the modeled results. The ensembling method factors
values. out the relative timing of disturbance vis-à-vis climate varia-
tion by taking the mean of 20 simulations, with each simula-
tion commencing at a different year in the meteorological data
Model data sources: plant ecophysiological parameters
file. The results presented here thus represent the mean of an
Two tree vegetation types were simulated, evergreen needle- ensemble of model simulations.
leaf (primarily P. mariana in the chronosequence) and broad-
leaf deciduous (primarily P. tremuloides). Plant ecophysio-
logical parameters are summarized in Table 2. We used the Results
same or similar values as those given by Kimball et al. (1997a,
1997b, 2000), except in the following cases when site-specific Computational speed of the new model
data were available. Annual fire mortality was set to zero, be- When simulating one and two vegetation types, Biome-BGC-
cause this simulation was designed to replicate 150 years of MV execution required approximately 110 and 190%, respec-
fire-free growth in these stands, and was not concerned with tively, of the time required by the single-vegetation 4.1.2 ver-
fire losses at larger temporal or spatial scales. Fine root turn- sion. A test run with three vegetation types, not discussed
over was set to 1.0 year –1, the default behavior of Biome-BGC further here, required 260% of the original version’s execution
4.1.2. Nitrogen concentrations, and thus C:N ratios of stem time.
wood, foliage and leaf litter, were taken from Gower et al.
(2000) as well as from the chronosequence sites (Bond-Lam- Net primary production, leaf area index and stem mass
berty, unpublished data). The days of the year on which to start Biome-BGC-MV simulated NPP of deciduous broadleaf trees
new growth and end litterfall, not shown in Table 2, were auto- reasonably well across the chronosequence (Figure 2). Simu-
matically calculated by Biome-GC. lated evergreen needle-leaf NPP matched the field data well
The two new parameters that defined the mass-to-height re- for the two oldest and three youngest chronosequence stands,
lationship for each vegetation type (Table 2) were computed but was significantly lower than measured NPP in the 19- and
from data given by Wang et al. (2003) for P. mariana (n = 24, 37-year-old stands. The single-vegetation evergreen needle-
TREE PHYSIOLOGY VOLUME 25, 2005BIOME-BGC AND SUCCESSIONAL CHANGE 417
Table 2. Simulation ecophysiological parameters by vegetation type (evergreen needle-leaf (ENL) and deciduous broadleaf (DBL)). Where no
reference is given, the value listed is the default value distributed with Biome-BGC. Abbreviations: C = carbon; N = nitrogen; LAI= leaf area in-
dex; SLA = specific leaf area; gs = stomatal conductance; ΨL = leaf water potential; and VPD = vapor pressure deficit.
Parameter ENL DBL Reference
Phenology and turnover
Transfer growth period (% growing season) 30 20
Litterfall period (% growing season) 30 20
Leaf turnover (year – 1) 0.12 1.0 Bond-Lamberty et al. (2004b), Gower et al. (1997),
Steele et al. (1997)
Live wood turnover (year – 1) 0.7 0.7
Whole-plant mortality (year – 1) 0.01 0.01 Bond-Lamberty et al. (2004b)
Fire mortality (year – 1) 0.0 0.0 See text
Allocation and N requirements
Fine root C:leaf C 1.6 1.5 Bond-Lamberty et al. (2004b)
Stem C:leaf C 2.3 2.0 Bond-Lamberty et al. (2004b)
Live wood C:total wood C 0.1 0.1
Downloaded from http://treephys.oxfordjournals.org/ by guest on March 5, 2015
Coarse root C:stem C 0.3 0.4 Bond-Lamberty et al. (2004b)
Growth C:storage C 0.5 0.5
Leaf C:leaf N 59.6 19.8 Gower et al. (1997, 2000)
Leaf litter C:leaf litter N 90.0 34.6 Gower et al. (1997, 2000)
Fine root C:fine root N 60.0 19.8 Gower et al. (1997, 2000)
Live wood C:live wood N 151.5 92.6 Gower et al. (1997, 2000)
Dead wood C:dead wood N 714.3 625.0 Gower et al. (1997, 2000)
Leaf litter labile:cellulose:lignin (%) 32:44:24 39:44:17
Fine root labile:cellulose:lignin (%) 30:45:25 30:45:25
Dead wood cellulose:lignin (%) 76:24 76:24
Canopy parameters
Water interception (LAI – 1 day – 1) 0.01 0.01
Light extinction –0.5 –0.5
SLA (projected area basis) (m 2 kg – 1 C) 8.3 38.7 Bond-Lamberty et al. (2002b)
Shaded/sunlit SLA 2.0 2.0
All sided:projected leaf area 3.1 2.0 Bond-Lamberty et al. (2003)
Maximum vegetation height (m) 15.8 13.2 See text
Mass at maximum height (kg C m – 2) 12.0 12.5 See text
Leaf N in Rubisco (%) 6.0 14.0 Field and Mooney (1986), Fan et al. (1995)
Maximum gs (mm s – 1) 3.0 5.0 Nobel (1991), B.E. Ewers (University of Wyoming,
unpublished data)
Cuticular conductance (mm s – 1) 0.01 0.01 Kimball et al. (1997a) Nobel (1991)
Boundary layer conductance (mm s – 1) 80.0 20.0 Nobel (1991), B.E. Ewers (University of Wyoming,
unpublished data)
ΨL start of gs reduction (MPa) –0.5 –0.5 Kimball et al. (1997a), Nobel (1991)
ΨL complete gs reduction (MPa) –1.7 –2.3 Kimball et al. (1997a), Nobel (1991)
VPD start of gs reduction (kPa) 1.0 1.0 Kimball et al. (1997a), Nobel (1991)
VPD complete gs reduction (kPa) 4.1 4.0 Kimball et al. (1997a), Nobel (1991)
leaf simulation (here termed ENL-1, Figure 2) simulated (cor- based on comparison with the measured field data, before de-
rectly) high NPP in the 19-year-old stand before declining, by clining. Biome-BGC-MV generally under-predicted ever-
150 years after wildfire, to a value similar to that of evergreen green needle-leaf stem mass and over-predicted deciduous
needle-leaf in the multi-vegetation simulation. The single- broadleaf stem mass (Figure 4), although the values for the
vegetation deciduous broadleaf simulation (DBL-1, not oldest stands were close to observed values. Both ENL-1 and
shown) was similar to ENL-1, with high (200–300 g C m –2 DBL-1 (not shown, but similar to ENL-1 shown) simulated
year –1) NPP 10–15 years after wildfire, declining thereafter. stem mass values that were far higher than observed values,
Biome-BGC-MV simulated leaf area index (LAI) well for particularly in the younger stands.
both vegetation types (Figure 3), although deciduous broad-
leaf LAI was somewhat higher than measured values in the Growth limitations from light, nitrogen, water and VPD
youngest stands. The ENL-1 and DBL-1 simulations reached The Biome-BGC-MV simulation became increasingly N-defi-
high LAI values (5–6) by 20 years after wildfire, far too early cient over time: in the oldest stands, N supply was less than
TREE PHYSIOLOGY ONLINE at http://heronpublishing.com418 BOND-LAMBERTY, GOWER, AHL AND THORNTON
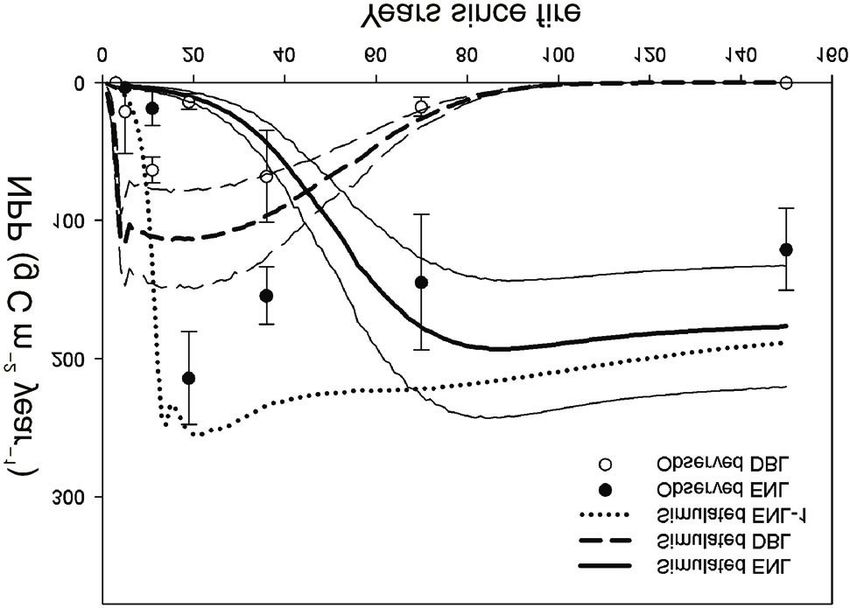
Figure 2. Comparison of simulated and observed net primary produc- Figure 3. Comparison of simulated and observed leaf area index
tion (NPP) across the chronosequence, for evergreen needle-leaf (LAI) across the chronosequence, by vegetation type. Biome-BGC
Downloaded from http://treephys.oxfordjournals.org/ by guest on March 5, 2015
(ENL) and deciduous broadleaf (DBL) vegetation types. Thin lines LAI output was converted to the standard m 2 m –2, displayed, based on
bracketing main ENL and DBL lines show standard deviations of a carbon to biomass ratio of 0.45 (Atjay et al. 1977). Observed data
ensembling procedure (i.e., show effect of interannual meteorological are from Bond-Lamberty et al. (2002b).
variability; see text). Results of a single-vegetation ENL simulation
(ENL-1) are also shown. Observed data are from the well-drained
black spruce chronosequence discussed by Bond-Lamberty et al.
(2004b). Error bars show plot-to-plot standard deviation (n = 4).
half of the combined demand of vegetation and decomposition
processes (Figure 5a). After removing meteorological vari-
ability, the effects of leaf water potential (ΨL) and atmospheric
vapor pressure deficit (VPD) on stomatal conductance were
almost constant (Figures 5b and 5c), with the evergreen nee-
dle-leaf vegetation type slightly more sensitive to ΨL and the
deciduous broadleaf vegetation type slightly more sensitive to
VPD (as specified in the initial parameters, Table 2). A notice-
able improvement in the latter occurred when the deciduous
broadleaf vegetation type was overtopped by the evergreen
needle-leaf vegetation type. This overtopping had a marked ef-
fect on deciduous broadleaf shortwave interception, which
dipped suddenly 50–60 years after fire (Figure 5d).
Figure 5. (a) Nitrogen (N) shortfall, computed as mineral N supply di-
vided by total demand; (b) leaf water potential (ΨL ) effect on stomatal
conductance (gs), where 1.0 is no effect and 0.0 is full stomatal clo-
sure; (c) vapor pressure deficit (VPD) effect on gs, where 1.0 is no ef-
fect and 0.0 is full stomatal closure; and (d) absorbed shortwave
radiation per unit projected leaf area (SWabs ). Figures show mean of
Figure 4. Comparison of simulated and observed stem carbon (C) daily values for each simulation year, for evergreen needle-leaf (ENL)
across the chronosequence, by vegetation type. Observed data are and deciduous broadleaf (DBL) vegetation types. The ENL and DBL
from Wang et al. (2003). values overlap in (a).
TREE PHYSIOLOGY VOLUME 25, 2005BIOME-BGC AND SUCCESSIONAL CHANGE 419
Discussion plification for the older chronosequence stands (Wang et al.
2003), but the younger stands are much more diverse in their
Comparing a simulation and a chronosequence species mix, and have a highly productive (100–150 g C m –2
year –1 or 40–100% of total NPP) understory (Bond-Lamberty
The chronosequence used in the simulation comparisons pre-
et al. 2004b) that was unaccounted for in our model. Some of
sented here has been shown to be representative of a large
this production is subsumed in the evergreen needle-leaf and
group of regional stands (Bond-Lamberty et al. 2004b), but
deciduous broadleaf results, in the sense that young overstory
there is no guarantee that any process model—however per-
trees face more competition for resources in the field than sim-
fectly parameterized, flawless its internal logic or exact the
ulated here.
field measurements to which it is compared—could replicate
each chronosequence member correctly; even if it did, this
would not ‘verify’ the model (Oreskes et al. 1994). In addition, Species succession
species’ successional patterns tend to be relatively variable in Most simulation studies of the Canadian boreal forest using
younger stands (Landsberg and Gower 1997). Thus, this dis- process models have focused on mature stands of single spe-
cussion focuses less on why particular stands in the chrono- cies (Peng et al. 1998, Liu et al. 1999, Peng and Apps 1999,
sequence were ‘missed’ than on the broader trends, sensitivi- Price et al. 1999, Amthor et al. 2001, Wang et al. 2002c). Even
ties, strengths and limitations of Biome-BGC. when younger stands or stand development is considered, spe-
Downloaded from http://treephys.oxfordjournals.org/ by guest on March 5, 2015
cies succession is generally ignored (Keyser et al. 2000, Zhu-
Model parameterization ang et al. 2003, Thornley and Cannell 2004). Biome-BGC was
not originally designed to simulate species succession. None-
The Biome-BGC model family has known parameter sensitiv-
theless, the simulated transition from deciduous broadleaf to
ities, most notably to stomatal conductance, allocation ratios,
evergreen needle-leaf overstory dominance (55–60 years after
C:N ratios and leaf turnover (White et al. 2000, Potter et al.
fire) matched field results well (Bond-Lamberty et al. 2002b,
2001). Precipitation and soil water had strong effects on both
Wang et al. 2003). The deciduous broadleaf decline was driven
NPP and species composition, yet the dynamics of soil water
by several factors. Low temperatures and long winters (Ta-
evaporation and drainage in the model differed considerably
ble 1) increase the advantage of an evergreen leaf habit, be-
from those in the field; this point is discussed further below.
cause deciduous plants have a shorter growing season in which
Nitrogen fixation was treated as a constant low value (Table 1),
to accumulate carbon (Fan et al. 1995, Baldocchi and Vogel
but almost certainly varied across the chronosequence, be-
1996, Black et al. 1996, Linder et al. 1997). The simulated sys-
cause several boreal understory and moss species are known to
tem was quite N-deficient (Figure 5a), as are many boreal for-
symbiotically fix N (Mäkipää 1995, Vogel and Gower 1998,
ests (Linder et al. 1987, Schimel et al. 1996), increasing the
DeLuca et al. 2002, Turetsky 2003). Green alder (Alnus crispa
cost of building an N-rich (Table 2) broadleaf canopy. Low soil
(Ait.) Pursh), for example, was present in the 70-year-old
water frequently constrained stomatal conductance during the
stand (Bond-Lamberty et al. 2002b), but unaccounted for in
growing season, again increasing the advantage of an ever-
our simulation. The presence of Alnus can strongly affect bo-
green needle-leaf habit.
real forest growth (Vogel and Gower 1998, Gower et al. 2000),
Once the height of the evergreen needle-leaf vegetation type
and its absence from the simulation may provide a partial ex-
exceeded that of the deciduous broadleaf vegetation type,
planation for why Biome-BGC-MV could not replicate the
available radiation dropped abruptly in the broadleaf vegeta-
high evergreen needle-leaf stem mass observed in this stand
tion type (Figure 5d). Such an abrupt transition may be unreal-
(Figure 4).
istic, and we acknowledge that the entire mechanism of con-
More generally, many ecophysiological properties are fixed
verting stem biomass per unit area to vegetation height is sim-
at the beginning of a simulation in Biome-BGC (cf. Table 2).
plistic (Landsberg and Gower 1997); it also has the disconcert-
In the real world, however, these values frequently change
ing effect of “shrinking” the deciduous broadleaf canopy as its
with stand age; e.g., specific leaf area (Hager and Sterba 1985,
stem mass declines in the middle of the chronosequence (Fig-
Bond-Lamberty et al. 2002b), leaf geometry (Bond-Lamberty
ure 4). Given the non-spatial nature of Biome-BGC (i.e., in the
et al. 2003), hydraulic characteristics (Ewers et al. 2000, Mc-
model, vegetation mass is expressed as kg C m –2, but no stock-
Dowell et al. 2002) or photosynthate allocation (Gower et al.
ing or density information is tracked), and the need to priori-
1994, Law et al. 2001, Bond-Lamberty et al. 2004b). We gen-
tize radiation and precipitation interception, a mass-to-height
erally chose to parameterize the model based on values from
conversion is necessary, albeit crude.
the oldest chronosequence stands, in particular the NOBS
tower site, which is well studied and had been modeled previ-
ously with Biome-BGC (Kimball et al. 1997a, 1997b, Amthor Medium- and long-term carbon dynamics
et al. 2001). This biased parameterization may be one reason, Biome-BGC has been extensively tested for simulating boreal
along with chronosequence artefacts and successional vari- forest carbon and hydrologic dynamics on the daily to annual
ability noted previously, why the model did not perform as timescale (Kimball et al. 1997a, 1997b, Amthor et al. 2001).
well at the younger stands as at the older stands. Similarly, our There have been fewer medium-term applications, i.e., on the
model results include only two overstory tree types, evergreen decade to century scale (Keyser et al. 2000, Law et al. 2001).
needle-leaf and deciduous broadleaf. This is a reasonable sim- In our study, Biome-BGC-MV was generally able to repro-
TREE PHYSIOLOGY ONLINE at http://heronpublishing.com420 BOND-LAMBERTY, GOWER, AHL AND THORNTON
duce tree NPP, leaf area and stem mass for a seven-stand,
150-year chronosequence, for both evergreen needle-leaf and
deciduous broadleaf vegetation types. We can thus answer af-
firmatively the question posed by Amthor et al. (2001):
Biome-BGC can, when initialized to a burned black spruce
forest and run for 150 years, generate a forest with the same
characteristics as the present NSA-OBS (150-year-old) site
(Gower et al. 1997, Sellers et al. 1997). The single- and multi-
vegetation simulations had similar values for NPP, LAI and
stem C after 151 years, but significantly different dynamics in
the younger stands. We conclude that accurately simulating
these variables over stand development based on a single vege-
tation type is unrealistic.
Challenges in using Biome-BGC to model boreal forest
Figure 6. Mean soil temperature at 10 cm (T10) as simulated by
biogeochemical cycling
Biome-BGC (with error lines showing the effect of interannual vari-
Downloaded from http://treephys.oxfordjournals.org/ by guest on March 5, 2015
Forest ecosystem modelers must choose how to simplify and ability, n = 20 years) compared with mean observed T10 (n = 4 years).
internally represent the real-world system under study, and Data from two chronosequence stands, similar in drainage and aspect,
their choices constrain subsequent model use (Jackson et al. are shown: a 12-year-old stand with an open canopy and no moss
cover, and a 71-year-old stand with continuous feathermoss cover and
2000, Porté and Bartelink 2002). Process-based models such a closed Picea mariana canopy.
as Biome-BGC offer advantages over inventory- or transition-
based models (Li et al. 2002, Yemshanov and Perera 2002) in
simulating boreal forest dynamics, particularly responses to
sequence stand, with its open canopy and lack of moss, reason-
future climate and disturbance conditions (Bonan 1989, Peng
ably well (Figure 6). Observed soil T10 at an older stand, which
and Apps 1999, Wang et al. 2002c, Yarie and Billings 2002).
is similar in most respects such as slope, aspect and drainage to
Nonetheless, several characteristics of Biome-BGC pose chal-
the younger stand, diverges significantly from the simulated
lenges in robustly modeling boreal forests across time and
value; this difference, in particular the relatively low tempera-
space.
tures observed in the first part of the growing season, is proba-
Biome-BGC has no provision for the mechanistic simula-
bly a result of the thick feathermoss ground cover (Wang et al.
tion of nonvascular plants, a trait it shares with several other
2003), closed canopy and high LAI (Bond-Lamberty et al.
models used to model boreal forests (Peng and Apps 1999,
2002b) of the site. Thus insulating effects on soil temperature
Yarie and Billings 2002, Zhuang et al. 2003, Thornley and
need to be considered.
Cannell 2004). This is a particular problem in the boreal forest,
Finally, in much of the Canadian boreal forest, well-drained
where bryophytes constitute an important, and often domi-
areas are the exception, not the rule (National Wetlands Work-
nant, part of C and N cycles (Camill et al. 2001, O’Connell et
ing Group 1988). Poorly drained areas often have high rates of
al. 2003, Bond-Lamberty et al. 2004b). Bryophytes have no
NPP and NEP (Harden et al. 1997, Camill et al. 2001, Vitt et al.
roots or stomates; they heavily insulate the soil beneath them;
2001, Bond-Lamberty et al. 2004b), low decomposition rates
and their litter lacks lignin yet is highly resistant to decay
and different successional pathways (Foster 1985, Wang et al.
(Turetsky 2003). These characteristics differ significantly
2003). Currently in Biome-BGC, soil water outflow always
from the Biome-BGC ecophysiological model. It is not clear if
occurs if soil water exceeds field capacity, and tree growth is
the existing photosynthesis, allocation, growth and decay
unaffected by excessive soil water; both of these behaviors are
logic can be used to approximate bryophyte dynamics, or if en-
problematic. Pietsch et al. (2003) extended Biome-BGC to ac-
tirely new model logic would be necessary.
count for seasonal flooding and groundwater infiltration.
Soil temperature (Tsoil ) presents a further difficulty. The
Their logic is complex but accounts for extra N deposition as a
large amount of C stored in boreal soils, and the dependence of
result of floodwater, as well as the effects of gravitation and
respiration on temperature, mean that Tsoil plays an important
soil matric water potential. For many applications, a much
role in boreal simulations. Its simulation may be more prob-
simpler mechanism—restricting outflow on a site-specific ba-
lematic in these systems (Zhuang et al. 2003) because of the
sis, for example—might be adequate, and should be explored.
insulating effects of bryophytes, poor soil drainage and high
LAI (O’Neill et al. 2002, Wang et al. 2002a), factors that are
frequently correlated (Harden et al. 1997, Bisbee et al. 2001).
For example, Biome-BGC uses soil temperature at 10-cm Conclusions
depth (T10) as a driver for autotrophic and heterotrophic below- The modified Biome-BGC is able to model multiple interact-
ground respiration. Comparing Biome-BGC’s simulated T10 ing and competing vegetation types at a single site, and thus is
with observed values from the chronosequence, we note that able to track forest succession through time. Although Biome-
simulated T10 tracks observed T10 for the 12-year-old chrono- BGC was not originally designed to simulate vegetation com-
TREE PHYSIOLOGY VOLUME 25, 2005BIOME-BGC AND SUCCESSIONAL CHANGE 421
petition, it reliably simulated changes in various biogeo- Bond-Lamberty, B., C. Wang and S.T. Gower. 2002b. Leaf area dy-
chemical cycling components (particularly leaf habit, NPP, C namics of a boreal black spruce fire chronosequence. Tree Physiol.
stocks and transpiration) seen in a boreal black spruce chrono- 22:993–1001.
sequence. Further work is necessary to develop reliable simu- Bond-Lamberty, B., C. Wang and S.T. Gower. 2003. The use of multi-
ple measurement techniques to refine estimates of conifer needle
lations of boreal biogeochemical cycling at the landscape
geometry. Can. J. For. Res. 33:101–105.
scale, but this new version should be useful for researchers in- Bond-Lamberty, B., C. Wang and S.T. Gower. 2004a. Contribution of
terested in modeling longer-term and more complex forest dy- root respiration to soil surface CO2 flux in a boreal black spruce fire
namics than were previously possible with Biome-BGC. chronosequence. Tree Physiol. 24:1387–1395.
Bond-Lamberty, B., C. Wang and S.T. Gower. 2004b. Net primary
Acknowledgments production and net ecosystem production of a boreal black spruce
fire chronosequence. Global Change Biol. 10:473– 487.
This research was supported by grants from NASA (NAG5-8069) and Burke, R.A., R.G. Zepp, M.A. Tarr, W.L. Miller and B.J. Stocks.
the National Science Foundation (Integrated Challenges in Environ- 1997. Effect of fire on soil–atmosphere exchange of methane and
mental Biology, DEB-0077881) to S.T. Gower. P.E. Thornton’s con- carbon dioxide in Canadian boreal sites. J. Geophys. Res.–Atmos.
tributions to this work were supported by NASA Grant No. W-19,953 102:29,289–29,300.
and by the National Center for Atmospheric Research (NCAR). The Camill, P., J.A. Lynch, J.S. Clark, J.B. Adams and B. Jordan. 2001.
NCAR is sponsored by the National Science Foundation. Biome- Changes in biomass, aboveground net primary production, and
BGC Version 4.1.2 was provided by the Numerical Terradynamic
Downloaded from http://treephys.oxfordjournals.org/ by guest on March 5, 2015
peat accumulation following permafrost thaw in the boreal peat-
Simulation Group (NTSG) at the University of Montana; NTSG as- lands of Manitoba, Canada. Ecosystems 4:461–478.
sumes no responsibility for the proper use of Biome-BGC by others. Clark, D.A., S. Brown, D.W. Kicklighter, J.Q. Chambers, J.R. Thom-
The GPCP combined precipitation data were developed and com- linson and J. Ni. 2001. Measuring net primary production in for-
puted by the NASA/Goddard Space Flight Center’s Laboratory for ests: concepts and field methods. Ecol. Appl. 11:356–370.
Atmospheres as a contribution to the GEWEX Global Precipitation DeLuca, T.H., O. Zackrisson, M.-C. Nilsson and A. Sellstedt. 2002.
Climatology Project. Quantifying nitrogen-fixation in feather moss carpets of boreal for-
ests. Nature 419:917–920.
References Ewers, B.E., R. Oren and J.S. Sperry. 2000. Influence of nutrient ver-
sus water supply on hydraulic architecture and water balance in
Adler, R.F., G.J. Huffman, A. Chang et al. 2003. The Version 2 Global Pinus taeda. Plant Cell Environ. 23:1055–1066.
Precipitation Climatology Project (GPCP) monthly precipitation Fan, S.-M., M.L. Goulden, J.W. Munger et al. 1995. Environmental
analysis (1979–Present). J. Hydrometeorol. 4:1147–1167. controls on the photosynthesis and repiration of a boreal lichen
Amthor, J.S., J.M. Chen, J.S. Clein et al. 2001. Boreal forest CO2 ex- woodland: a growing season of whole-ecosystem exchange mea-
change and evapotranspiration predicted by nine ecosystem pro- surements by eddy correlation. Oecologia 102:443– 452.
cess models: intermodal comparisons and relationships to field Field, C.B. and H.A. Mooney. 1986. The photosynthesis–nitrogen re-
measurements. J. Geophys. Res.–Atmos. 106:33,623–33,648. lationship in wild plants. In On the Economy of Plant Form and
Atjay, G.L., P. Ketner and P. Duvigneaud. 1977. Terrestrial primary Function. Ed. T.J. Givnish. Cambridge University Press, Cam-
production and phytomass. In The Global Carbon Cycle Eds. B.E. bridge, pp 25–55.
Bolin, T. Degens, S. Kempe and P. Ketner. John Wiley and Sons, Foster, D.R. 1985. Vegetation development following fire in Picea
New York, pp 129–181. mariana (black spruce)–Pleurozium forests of south-eastern Lab-
Baldocchi, D.D. and C. Vogel. 1996. Energy and CO2 flux densities
rador, Canada. J. Ecol. 73:517–534.
above and below a temperate broad-leaved forest and a boreal pine
Goulden, M.L., S.C. Wofsy, J.W. Harden et al. 1998. Sensitivity of
forest. Tree Physiol. 16:5–16.
boreal forest carbon balance to soil thaw. Science 279:214 –217.
Bates, D.M. and D.G. Watts. 1988. Nonlinear regression analysis and
Gower, S.T., J.G. Vogel, J.M. Norman, C.J. Kucharik, S. Steele and
its applications. John Wiley and Sons, New York, 365 p.
T.K. Stow. 1997. Carbon distribution and aboveground net pri-
Betts, A.K. and J.H. Ball. 1997. Albedo over the boreal forest. J. Geo-
mary production in aspen, jack pine, and black spruce stands in
phys. Res.–Atmos. 102:28,901–28,909.
Saskatchewan and Manitoba, Canada. J. Geophys. Res. 102:
Bisbee, K.E., S.T. Gower, J.M. Norman and E.V. Nordheim. 2001.
29,029–29,041.
Environmental controls on ground cover species composition and
Gower, S.T., H.L. Gholz, K. Nakane and V.C. Baldwin. 1994. Produc-
productivity in a boreal black spruce forest. Oecologia 129:
261–270. tion and carbon allocation patterns of pine forests. Ecol. Bull. 43:
Black, R.A. and L.C. Bliss. 1978. Recovery sequence of Picea mari- 115–135.
ana–Vaccinium uliginosum forests after burning near Inuvik, Gower, S.T., A. Hunter, J.S. Campbell, J.G. Vogel, H. Veldhuis,
Northwest Territories, Canada. Can. J. Bot. 56:2020–2030. J.W. Harden, S.E. Trumbore, J.M. Norman and C.J. Kucharik.
Black, T.A., G. den Hartog, H.H. Neumann et al. 1996. Annual cycles 2000. Nutrient dynamics of the southern and northern BOREAS
of water vapour and carbon dioxide fluxes in and above a boreal as- boreal forests. Écoscience 7:481–490.
pen forest. Global Change Biol. 2:219–229. Gower, S.T., O.N. Krankina, R.J. Olson, M.J. Apps, S. Linder and
Bonan, G.B. 1989. A computer model of the solar radiation, soil C. Wang. 2001. Net primary production and carbon allocation pat-
moisture, and soil thermal regimes in boreal forests. Ecol. Model. terns of boreal forest ecosystems. Ecol. Appl. 11:1395–1411.
45:275–306. Grace, J. 2004. Understanding and managing the global carbon cycle.
Bond-Lamberty, B., C. Wang and S.T. Gower. 2002a. Annual carbon J. Ecol. 92:189–202.
flux from woody debris for a boreal black spruce fire chrono- Hager, H. and H. Sterba. 1985. Specific leaf area and needle weight of
sequence. J. Geophys. Res.–Atmos. 108: Article No. 8220 (WFX Norway spruce (Picea abies) in stands of different densities. Can.
1-1–1-10). J. For. Res. 15:389–392.
TREE PHYSIOLOGY ONLINE at http://heronpublishing.com422 BOND-LAMBERTY, GOWER, AHL AND THORNTON
Halliwell, D.H. and M.J. Apps. 1997. Boreal ecosystem–atmosphere McDowell, N.G., N. Phillips, C. Lunch, B.J. Bond and M.G. Ryan.
study (BOREAS) biometry and auxiliary sites: locations and des- 2002. An investigation of hydraulic limitation and compensation in
criptions. Forestry Canada, Northern Forestry Centre, Edmonton, large, old Douglas-fir trees. Tree Physiol. 22:763–774.
AB, Canada, 120 p. National Wetlands Working Group. 1988. Wetlands of Canada. Eco-
Harden, J.W., K.P. O’Neill, S.E. Trumbore, H. Veldhuis and B.J. Stocks. logical land classification series, No. 24. Sustainable Development
1997. Moss and soil contributions to the annual net carbon flux of a Branch, Environment Canada, Ottawa, ON, Canada, 452 p.
maturing boreal forest. J. Geophys. Res. 102:28,805–28,816. Nobel, P.S. 1991. Physiochemical and environmental plant physiol-
IPCC. 2001. Climate change 2001: the science of climate change. ogy. Academic Press, New York, 635 p.
Contribution of working group I to the second assessment report of O’Connell, K.E.B., S.T. Gower and J.M. Norman. 2003. Net ecosys-
the Intergovernmental Panel on Climate Change. Cambridge Uni- tem production of two contrasting boreal black spruce forest com-
versity Press, Cambridge, 20 p. munities. Ecosystems 6:248–260.
Jackson, L.J., A.S. Trebitz and K.L. Cottingham. 2000. An introduc- O’Neill, K.P., E.S. Kasischke and D.D. Richter. 2002. Environmental
tion to the practice of ecological modeling. Bioscience 50: controls on soil CO2 flux following fire in black spruce, white
694 –706. spruce, and aspen stands of interior Alaska. Can. J. For. Res. 32:
Kalnay, E., M. Kanamitsu, R. Kistler et al. 1996. The NCEP/NCAR 1525–1541.
40-year reanalysis project. Bull. Am. Meteorol. Soc. 77:437– 471. Oreskes, N., K. Shrader-Frechette and K. Belitz. 1994. Verification,
Keyser, A.R., J.S. Kimball, R.R. Nemani and S.W. Running. 2000. validation, and confirmation of numerical models in the earth sci-
Simulating the effects of climate change on the carbon balance ences. Science 263:641–646.
Downloaded from http://treephys.oxfordjournals.org/ by guest on March 5, 2015
of North American high-latitude forests. Global Change Biol. 6: Osborne, H., K. Young, V. Wittrock and S. Shewchuck. 1998. BOR-
185–195. EAS/SRC AMS Suite A surface meteorological and radiation data:
Kimball, J.S., P.E. Thornton, M.A. White and S.W. Running. 1997a. 1994/1995/1996. Oak Ridge National Laboratory Distributed Ac-
Simulating forest productivity and surface-atmosphere carbon ex- tive Archive Center, Oak Ridge, TN. http://www.daac.ornl.gov.
change in the BOREAS study region. Tree Physiol. 17:589–599. Peng, C. and M.J. Apps. 1998. Simulating carbon dynamics along the
Kimball, J.S., M.A. White and S.W. Running. 1997b. BIOME-BGC Boreal Forest Transect Case Study (BFTCS) in central Canada. II.
simulations of stand hydrological processes for BOREAS. J. Geo- Sensitivity to climate change. Global Biogeochem. Cycles 12:
phys. Res.–Atmos. 102:29,043–29,051. 393– 402.
Kimball, J.S., A.R. Keyser, S.W. Running and S.S. Saatchi. 2000. Re- Peng, C. and M.J. Apps. 1999. Modelling the response of net primary
gional assessment of boreal forest productivity using an ecological productivity (NPP) of boreal forest ecosystems to changes in cli-
process model and remote sensing parameter maps. Tree Physiol. mate and fire disturbance regimes. Ecol. Model. 122:175–193.
20:761–775. Peng, C., M.J. Apps, D.T. Price, I.A. Nalder and D.H. Halliwell.
Kistler, R., E. Kalnay, W. Collins et al. 2001. The NCEP-NCAR 1998. Simulating carbon dynamics along the Boreal Forest Tran-
sect Case Study (BFTCS) in central Canada. I. Model testing.
50-year reanalysis: monthly means CD-ROM and documentation.
Global Biogeochem. Cycles 12:381–392.
Bull. Am. Meteorol. Soc. 82:247–267.
Pietsch, S.A., H. Hasenauer, J. Kuèera and J. Èermák. 2003. Model-
Lambers, H., F.S. Chapin, III and T.L. Pons. 1998. Plant Physiologi-
ing effects of hydrological changes on the carbon and nitrogen bal-
cal Ecology. Springer-Verlag, New York, 540 p.
ance of oaks in floodplains. Tree Physiol. 23:735–746.
Landsberg, J.J. and S.T. Gower. 1997. Applications of physiological
Porté, A. and H.H. Bartelink. 2002. Modelling mixed forest growth: a
ecology to forest management. In Physiological Ecology. Ed.
review of models for forest management. Ecol. Model. 150:
H.A. Mooney. Academic Press, San Diego, 354 p.
141–188.
Law, B.E., P.E. Thornton, J. Irvine, P.M. Anthoni and S. Van Tuyl.
Potter, C.S., S. Wang, N.T. Nikolov et al. 2001. Comparison of boreal
2001. Carbon storage and fluxes in ponderosa pine forests at differ-
ecosystem model sensitivity to variability in climate and forest site
ent developmental stages. Global Change Biol. 7:755–777.
parameters. J. Geophys. Res.–Atmos. 106:33,671–33,687.
Li, Z., M.J. Apps, E. Banfield and W.A. Kurz. 2002. Estimating net
Powers, R.F. and K. Van Cleve. 1991. Long-term ecological research
primary production of forests in the Canadian prairie provinces us- in temperate and boreal ecosystems. Agron. J. 83:11–24.
ing an inventory-based carbon budget model. Can. J. For. Res. 32: Price, D.T., C. Peng, M.J. Apps and D.H. Halliwell. 1999. Simulating
161–169. effects of climate change on boreal ecosystem carbon pools in cen-
Linder, S., M.L. Benson, B.J. Myers and R.J. Raison. 1987. Canopy tral Canada. J. Biogeogr. 26:1237–1248.
dynamics and growth of Pinus radiata. 1. Effects of irrigation and Randerson, J.T., F.S.I. Chapin, J.W. Harden, J.W. Neff and M.E. Har-
fertilization during a drought. Can. J. For. Res. 17:1157–1165. mon. 2002. Net ecosystem production: a comprehensive measure
Linder, P., B. Elfving and O. Zackrisson. 1997. Stand structure and of net carbon accumulation by ecosystems. Ecol. Appl. 12:937–947.
successional trends in virgin boreal forest reserves in Sweden. For. Running, S.W. and J.C. Coughlin. 1988. A general model of forest
Ecol. Manage. 98:17–33. ecosystem processes for regional applications. I. Hydrological bal-
Litvak, M., S. Miller, S.C. Wofsy and M.L. Goulden. 2002. Effect of ance, canopy gas exchange and primary production processes.
stand age on whole ecosystem CO2 exchange in the Canadian bo- Ecol. Model. 42:125–154.
real forest. J. Geophys. Res.–Atmos. 108: Article No. 8225 (WFX Running, S.W. and S.T. Gower. 1991. FOREST-BGC, a general
6-1–6-11). model of forest ecosystem processes for regional applications. II.
Liu, J., J.M. Chen, J. Cihlar and W. Chen. 1999. Net primary produc- Dynamic carbon allocation and nitrogen budgets. Tree Physiol. 9:
tivity distribution in the BOREAS region from a process model us- 147–160.
ing satellite and surface data. J. Geophys. Res.–Atmos. 104: Running, S.W. and R.E. Hunt. 1993. Generalization of a forest eco-
27,735–27,754. system process model for other biomes, BIOME-BGC, and an ap-
Mäkipää, R. 1995. Effect of nitrogen input on carbon accumulation of plication for global-scale models. In Scaling Physiologic Pro-
boreal forest soils and ground vegetation. For. Ecol. Manage. 79: cesses: Leaf to Globe. Eds. J.R. Ehleringer and C.B. Field. Aca-
217–226. demic Press, San Diego, pp 141–158.
TREE PHYSIOLOGY VOLUME 25, 2005BIOME-BGC AND SUCCESSIONAL CHANGE 423
Schimel, D.S., B.H. Braswell, R. McKeown, D.S. Ojima, W.J. Parton Vogel, J.G. and S.T. Gower. 1998. Carbon and nitrogen dynamics of
and W.M. Pulliam. 1996. Climate and nitrogen controls on the ge- boreal jack pine stands with and without a green alder understory.
ography and timescales of terrestrial biogeochemical cycling. Ecosystems 1:386– 400.
Global Biogeochem. Cycles 10:677–692. Wang, C., B. Bond-Lamberty and S.T. Gower. 2002a. Environmental
Sellers, J., F.G. Hall, D. Kelly et al. 1997. BOREAS in 1997: experi- controls on CO2 flux from black spruce coarse woody debris.
ment overview, scientific results, and future directions. J. Geophys. Oecologia 132:374 –381.
Res. 102:28,731–28,769. Wang, C., B. Bond-Lamberty and S.T. Gower. 2002b. Soil surface
Steele, S., S.T. Gower, J.G. Vogel and J.M. Norman. 1997. Root mass, CO2 flux in a boreal black spruce fire chronosequence. J. Geophys.
net primary production and turnover in aspen, jack pine and black Res. 108: Article No. 8224 (WFX 5-1–5-8).
spruce forests in Saskatchewan and Manitoba, Canada. Tree Wang, S., R.F. Grant, D.L. Verseghy and T.A. Black. 2002c. Model-
Physiol. 17:577–587. ling carbon dynamics of boreal forest ecosystems using the Cana-
Stocks, B.J. and J.B. Kauffman. 1997. Biomass consumption and be- dian Land Surface Scheme. Climate Change 55:451–477.
havior of wildland fires in boreal, temperate, and tropical ecosys- Wang, C., B. Bond-Lamberty and S.T. Gower. 2003. Carbon distribu-
tems: parameters necessary to interpret historic fire regimes and tion of a well- and poorly-drained black spruce fire chronose-
future fire scenarios. In Sediment Records of Biomass Burning and
quence. Global Change Biol. 9:1–14.
Global Change. Eds. J.S. Clark, H. Cachier, J.G. Goldammer and
Waring, R.H. and S.W. Running. 1998. Forest ecosystems : analysis at
B.J. Stocks. Springer-Verlag, Berlin, pp 169–188.
multiple scales. Academic Press, San Diego, 370 p.
Swanson, R.V. and L.B. Flanagan. 2001. Environmental regulation of
Waring, R.H. and W.H. Schlesinger. 1985. Forest ecosystems: con-
carbon dioxide exchange at the forest floor in a boreal black spruce
Downloaded from http://treephys.oxfordjournals.org/ by guest on March 5, 2015
cepts and management. Academic Press, Orlando, FL, 340 p.
ecosystem. Agric. For. Meteorol. 108:165–181.
White, M.A., P.E. Thornton, S.W. Running and R.R. Nemani. 2000.
Thornley, J.H.M. and M.G.R. Cannell. 2004. Long-term effects of fire
Parameterization and sensitivity analysis of the BIOME-BGC ter-
frequency on carbon storage and productivity of boreal forests: a
restrial ecosystem model: net primary production controls. Earth
modeling study. Tree Physiol. 24:765–773.
Thornton, P.E. 1998. Regional ecosystem simulation: combining sur- Interactions 4, Paper No. 3:1–85.
face- and satellite-based observations to study linkages between Wofsy, S.C., M.L. Goulden, J.W. Munger, S.-M. Fan, P.S. Bakwin,
terrestrial energy and mass budgets. Ph.D. thesis. School of For- B.C. Daube, S.L. Bassow and F.A. Bazzaz. 1993. Net exchange of
estry, University of Montana, Missoula, MT, 280 p. CO2 in a mid-latitude forest. Science 260:1314–1317.
Thornton, P.E., B.E. Law, H.L. Gholz et al. 2002. Modeling and mea- Yarie, J. and S.A. Billings. 2002. Carbon balance of the taiga forest
suring the effects of disturbance history and climate on carbon and within Alaska: present and future. Can. J. For. Res. 32:757–767.
water budgets in evergreen needleleaf forests. Agric. For. Meteor- Yemshanov, D. and A.H. Perera. 2002. A spatially explicit stochastic
ol. 113:185–222. model to simulate boreal forest cover transitions: general structure
Turetsky, M.R. 2003. The role of bryophytes in carbon and nitrogen and properties. Ecol. Model. 150:189–209.
cycling. Bryologist 106:395– 409. Zhuang, Q., A.D. McGuire, K.P. O’Neill, J.W. Harden, V.E. Roman-
Vitt, D.H., L.A. Halsey, C. Campbell, S.E. Bayley and M.N. Thor- ovaky and J. Yarie. 2003. Modeling soil thermal and carbon dy-
mann. 2001. Spatial patterning of net primary production in wet- namics of a fire chronosequence in interior Alaska. J. Geophys.
lands of continental western Canada. Écoscience 8:499–505. Res.–Atmos. 108:FFR-3-1–FFR-3-23.
TREE PHYSIOLOGY ONLINE at http://heronpublishing.comYou can also read