Biodiversity of the Cocoa Agroforests of the Bengamisa-Yangambi Forest Landscape in the Democratic Republic of the Congo (DRC) - MDPI
←
→
Page content transcription
If your browser does not render page correctly, please read the page content below
Article
Biodiversity of the Cocoa Agroforests of the
Bengamisa-Yangambi Forest Landscape in the
Democratic Republic of the Congo (DRC)
Germain Batsi 1, *, Denis Jean Sonwa 2 , Lisette Mangaza 3 , Jérôme Ebuy 1 and
Jean-Marie Kahindo 4
 1    Faculty of Renewable Natural Resources Management, The University of Kisangani, Avenue Kitima 5110400,
      PO Box 2012 Kisangani, Democratic Republic of Congo; jebuyalip5@gmail.com
 2    Center for International Forestry Research (CIFOR), Yaoundé PO Box 2008 Messa, Cameroon;
      d.sonwa@cgiar.org
 3    Faculty of Science, University of Goma, Avenue de la Paix 6110103, PO Box 204 Goma,
      Democratic Republic of Congo; lisemangaza@gmail.com
 4    Faculty of Science, University of Kisangani, Avenue Kitima 5110400, PO Box 2012 Kisangani,
      Democratic Republic of Congo; jkahindo2@yahoo.fr
 *    Correspondence: germainbatsi@gmail.com

 Received: 9 August 2020; Accepted: 25 September 2020; Published: 15 October 2020

 Abstract: Cocoa agroforestry has evolved into an accepted natural resource conservation strategy in
 the tropics. It is regularly proposed as one of the main uses for REDD+ projects (Reducing Emissions
 from Deforestation and forest Degradation and the role of conservation, sustainable management of
 forests, and enhancement of forest carbon stocks in developing countries) in the Democratic Republic
 of the Congo. However, few studies have characterized the cocoa agroforestry systems in this country.
 Hence, this research proposes to determine the impact of distance from Kisangani (the unique
 city in the landscape) and land-use intensity on the floristic composition of cocoa agroforests in
 Bengamisa-Yangambi forest landscape in the Congo Basin. The results revealed that species diversity
 and density of plants associated with cocoa are influenced by the distance from Kisangani (the main
 city in the landscape and province). Farmers maintain/introduce trees that play one or more of several
 roles. They may host caterpillars, provide food, medicine, or timber, or deliver other functions such
 as providing shade to the cocoa tree. Farmers maintain plants with edible products (mainly oil palms)
 in their agroforests more than other plants. Thus, these agroforests play key roles in conserving
 the floristic diversity of degraded areas. As cocoa agroforestry has greater potential for production,
 biodiversity conservation, and environmental protection, it should be used to slow down or even
 stop deforestation and forest degradation.

 Keywords: floristic diversity; cocoa agroforests; Bengamisa-Yangambi; landscape; Democratic
 Republic of the Congo

1. Introduction
      Land-use activities, such as clearing tropical forests, practicing subsistence agriculture, and
intensifying farmland production, are the most important drivers of biodiversity loss and the associated
ecosystem services on the local- and landscape-scale [1,2]. Although the rate of tropical forest loss
is alarming, some agricultural systems offer a glimmer of hope. Systems using shade species offer
greater potential for production, biodiversity conservation, and long-term environmental protection [3].
Thus, agroforestry is proposed as one of the strategies for conserving natural resources in the tropics [4].
The agroforestry practice provides a potentially valuable conservation tool that can be useful for

Forests 2020, 11, 1096; doi:10.3390/f11101096                                    www.mdpi.com/journal/forests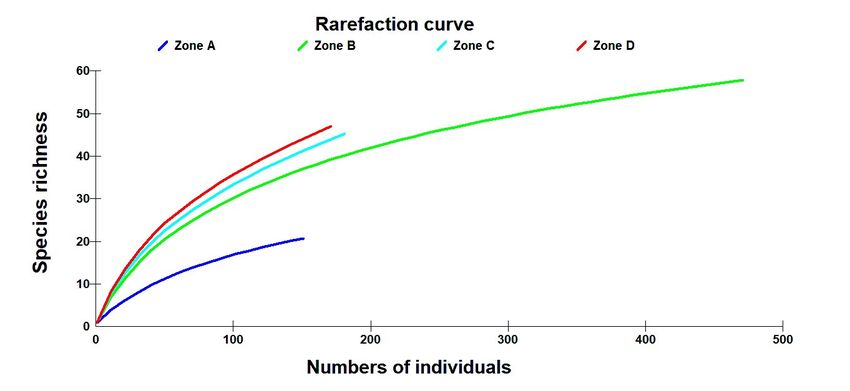
Forests 2020, 11, 1096                                                                               2 of 21

reducing land-use pressure and enhancing income from rural livelihoods in tropical countries [5].
Several examples across the tropics have shown that agroforests represent a substantial proportion of
biodiversity of forest reserves [3,6,7].
      Cocoa is one of the most important crops in agroforests [8]. Cocoa farming has played an important
role in the conservation of lowland tropical forest landscapes in Latin America, Africa and Asia over
the past centuries and continues to do so today [9]. It helps to reduce land-use pressure through
the availability of useful tree species and other non-timber forest products (NTFPs) and to improve
rural livelihoods [10]. Shade tree systems provide habitat diversity for plant and animal species that
do not strictly depend on natural forest. They also connect otherwise disjunctive fragments of the
remaining forest patches in the landscape [11]. Cocoa agroforests systems with a mixture of diverse
tree species provide more functions than other land-uses in forest landscapes. These functions include
maintenance of carbon stocks, biodiversity conservation, and locally relevant ecosystem services, such
as protection of the soil [12] and better water management [13]. The introduction of sustainable shade
tree management can make cocoa agroforestry an important agent of reforestation [14]. Shade tree
management has positive effects on pest outbreaks that may hold the key to breaking cocoa production
cycles and helping conserve valuable tropical biodiversity in agroforestry systems [15,16].
      Despite the benefits of agroforestry practices, cocoa agroforestry in natural habitats is an important
driver of forest degradation and deforestation [14,17]. Land-use planning is needed to reduce further
deforestation for the expansion of cocoa land. Such planning can determine areas to preserve under
forest cover for ecological reasons and also areas where cocoa might be planted [18].
      Introduced in Africa more than a century ago, cocoa production is a major contributor to the
economies of many African countries [19]. The continent supplies more than two-thirds of the world’s
cocoa, the majority being produced by Côte d’Ivoire and Ghana [20]. Full-sun systems are found
mostly in the Lower Guinean forest systems of Liberia, Ghana, Côte d’Ivoire and Nigeria; the more
complex systems are in the Congo Basin countries, mainly in Cameroon and the Democratic Republic
of the Congo (DRC) [21]. As cocoa production increases in DRC, the sector can learn a lot from its West
African neighbours about mistakes to avoid and priorities to emphasize, including the importance
of sustainable and climate-smart practices and good governance [22]. In DRC, cocoa agroforests
are frequently proposed in projects for REDD+ (reducing emissions from deforestation and forest
degradation and the role of conservation, sustainable management of forests, and enhancement of forest
carbon stocks in developing countries). The Wildlife Conservation Society, for example, has adopted
the idea of growing cocoa as a tool in forest conservation. In the Mambasa region, 1250 hectares (ha) of
forest-cover cocoa has planted within the context of the national REDD+ program [23].
      In DRC, conflicts and political instability have deeply affected the agricultural sector. For example,
there are insufficient data on initiatives in the cocoa sector [20]. Cocoa is generally cultivated by
small farmers, most often alongside other crops [22]. However, the quantities produced are small in
comparison to West Africa [24]. On the other hand, in Tshopo province, cocoa has been promoted
since the colonial era when it was planted under controlled forest cover from which cocoa pest species
had been eliminated [23]. However, cocoa cultivation has never been fully developed. Today, most
farmers spontaneously plant cocoa in the region by sourcing from former plantations in response to
market signals and rumors of market development in the east of DRC [25]. With adequate assistance,
cocoa can be produced sustainably without clearing new forest land and can help reduce household
poverty [21]. Further efforts are needed to rehabilitate existing cocoa farms to develop sustainable
cocoa agroforestry [25].
      In cocoa agroforests, species richness and vegetation structure are key components of structural
complexity and form the basis of biodiversity [26]. Therefore, good knowledge is needed of the plants
associated with cocoa trees in cocoa agroforests in DRC. However, no study on the contributions of
cocoa agroforests to the conservation of floristic diversity has focused on DRC.
      The choice of Tshopo province, more specifically the Bengamisa-Yangambi landscape, is based
on its inclusion of the Yangambi Biosphere Reserve. The United Nations Educational, Scientific and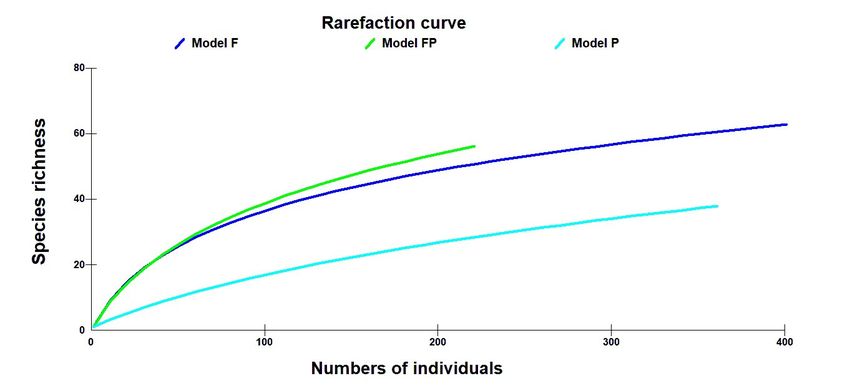
Forests 2020, 11, 1096 3 of 21
Cultural Organization (UNESCO) declared Yangambi a biosphere reserve in 1977 [27]. Thus, to preserve
the important biodiversity of the Yangambi reserve, agroforestry systems in the Bengamisa-Yangambi
forest landscape should be studied to understand their influence on the conservation of floristic diversity.
This study paid special attention to how distance from Kisangani (The main city in the landscape)
and thus the related disturbance and land-use intensity have affected the floristic composition of cocoa
agroforests in the forest landscape. The study is based on the hypothesis that native forest cover,
disturbance, land-use intensity, and market access influenced floristic composition of cocoa agroforests.
We thus recorded floristic composition of cocoa agroforest in four zones of 15 km each, defined along
the main road, from Kisangani city to Yangambi forest reserve landscape, via Bengamisa village.
2. Materials and Methods
2.1. Study Area
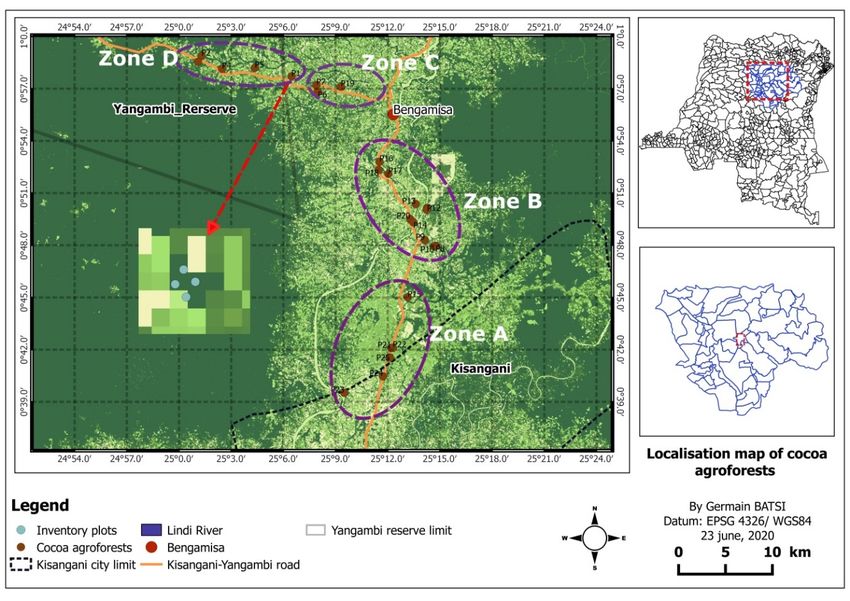
This study was conducted between June and July 2018 in 16 villages and recorded floristic
composition of cocoa agroforest in 4 zones of 15 km each, defined along the main road, from
Kisangani city to Yangambi forest reserve landscape, via Bengamisa village (Figure 1). This area is
located between the city of Kisangani (N 00◦ 310 ; E 25◦ 110 ) [28] and the Yangambi Biosphere Reserve
(N 00◦ 480 ; E 24◦ 290 ) [29] in Banalia territory, Tshopo province, DRC. The Tshopo province, with an area
of 200,240 km2 , is in the northeast of DRC and includes seven territories (Bafwasende, Banalia, Basoko,
Isangi, Opala, Ubundu and Yahuma) [28,30]. Kisangani, founded in 1883, is the capital of the Tshopo
province and is the main city of this province. Its population is estimated at about 1 million (around
20% of the 5,032,472 inhabitants of the province) [28,31]. It is among the five main cities of DRC.
Kisangani have an international airport, is the end of the water navigation road on the Congo river
and it is crossed by 4 main roads leading to different directions in the country. It has a road connection
with the other east part of the DRC and bordering countries such as Uganda. Several smallholders’
industries and shops are thus found in the city. In the Bengamisa-Yangambi forest landscape, it is the
main city with his urbanisation impacting the forest landscape between the city and the Yangambi
Biosphere reserve.
Forests 2020, 11, x FOR PEER REVIEW 4 of 21
Figure 1.Figure 1. Localization
Localization of cocoaof agroforests
cocoa agroforests and inventory
and inventory plotsplots
in theinBengamisa-Yangambi-landscape.
the Bengamisa-Yangambi-
landscape.
2.2. Methods
2.2.1. Study Design
To better understand the role of native forest cover, disturbance and land-use intensity on
floristic diversity of cocoa agroforests in the region, 4 Blocs/Zones of 15 km each were defined along
the main road, including Zone A (18–33 km from Kisangani city), Zone B (34–49 km from KisanganiForests 2020, 11, 1096 4 of 21
The region is still predominantly covered with moist forest and has an average population
density of 9.8 people per square kilometer (km2 ). The region has a hot and humid climate without a
marked dry season classified as Af in Köppen’s typology [28,30]. It receives an annual precipitation
of 1839.5 ± 205.7 millimeters (mm) with an average sub-dry season length of 3.3 ± 1.3 months with
monthly precipitation lower than 100 mm, during December–February. Temperatures are high and
constant throughout the year with a minimum of 24.2 ± 0.4 ◦ C in July and a maximum of 25.5 ± 0.6 ◦ C
in March [29].
The main economic activity in the region is agriculture, which is practiced in a shifting cultivation
system [28,31,32]. Cassava is the main staple crop. Furthermore, exploitation of NTFPs, such as bush
meat, caterpillars, and wild edible plants, as well as commercial and artisanal logging, artisanal mining,
and petty trade provide sources of income to rural households. Six major road axes cut through the
forest in a radial pattern starting from Kisangani, along which nearly all settlements are located [31].
In this region, which has excellent agricultural and climatic conditions, cocoa cultivation has
been encouraged since colonial times. In 1979, the African Development Bank (AfDB) financed the
development of 1750 ha of small peasant and commercial plantations in Bengamisa called CABEN
(Cacaoyères de Bengambisa) to increase Congolese cocoa production. CABEN did not achieve its
objectives and most of these plantations were abandoned [23].
2.2. Methods
2.2.1. Study Design
To better understand the role of native forest cover, disturbance and land-use intensity on floristic
diversity of cocoa agroforests in the region, 4 Blocs/Zones of 15 km each were defined along the main
road, including Zone A (18–33 km from Kisangani city), Zone B (34–49 km from Kisangani city),
Zone C (50–65 km from Kisangani city), and Zone D (66–81 km from Kisangani city). These zones
are arranged from the highly degraded area nearest Kisangani city (Zone A) to the less degraded
area in the forest zone (Zone D) (Figure 1). The Bengamisa-Yangambi landscape is still covered by a
vast rainforest [33]. The lowest proportion of this forest is found around Kisangani where we have
the nucleus of population pressure [34]. The agricultural system is characterized by slash-and-burn
agriculture, resulting from a shifting patchwork of cultivated fields, fallows, secondary forests,
and remnants of primary forests [33]. Cash crops such as oil palm and cocoa have been cultivated by
small farmers since several decades [23,35]. The forest of this landscape is gradually being converted
to agricultural land, roads or modified by timber and charcoal exploitation [27,34]. As with other
forests stands in DRC [36], the Bengamisa-Yangambi landscape is thus under the agricultural extension,
fuelwood collection, timber exploitation, urbanisation, and demography increase pressures.
2.2.2. Collection of Floristic Data
The criteria used to select agroforestry plantations are the net area of the plantation (at least
0.5 hectares) [37]. Four plots of 25 × 25 m (i.e., 625 m2 for each plot), corresponding to an area of
2500 m2 were established within each cocoa agroforest to record plant diversity. In small plantations,
the plots were installed successively, spaced 3–5 m apart. In large plantations, the plots were arranged
on a diagonal to represent the diversity of the cocoa farm. The diameter was measured at 30 cm from
the ground on each cocoa tree and at 1.30 m on the cocoa-associated plants as noted by [38]. A total of
25 cocoa agroforests were surveyed in the Bengamisa-Yangambi forest landscape.
In each cocoa agroforest, and within each plot (25 × 25 m), the number of cocoa trees were
counted. Each associated plant with a diameter at breast height (DBH) above/equal to 2.5 centimeter
(cm) was recorded. The scientific name of the plant was provided using the Catalogue—Flora of
Plants of Kisangani and Tshopo Districts [39]. The main use of each plant is noted. In this study,
“Cocoa associated species” refer to all plants (spontaneous or planted) except cocoa trees present
in cocoa agroforests. Thus, for their classification, we used the same approach (nature and mainForests 2020, 11, 1096 5 of 21
use of plants) of previous studies on biodiversity in cocoa agroforests [40–42]. All cocoa-associated
plant species inventoried were later sorted according to the list of suitable/useful and unsuitable
species to cocoa trees established by the National Institute of Agronomic Studies and Research
(INERA). Usefulness/suitability criteria used by INERA include production increase, providing light
and cocoa-friendly shade, and protection against pests and diseases. The non-suitability of the plant
was generally due to pest criteria, including cocoa tree pest housing, competition with cocoa trees,
intense shade, and same diseases with cocoa trees. Such criteria were already been used by many
cocoa research/extension services in west and central Africa [7].
2.2.3. Data Analysis
Preliminary analysis of cocoa agroforests help to determine three following models of cocoa
agroforests: Cocoa agroforests in which companion plants (associated with cocoa trees) were composed
primarily of forest/native species (residual species from the previous natural forest or from regeneration
of these species or regeneration of species from the adjacent forest), named in this study as Model F;
cocoa agroforests in which companion plants were split equally between forest/native species and oil
palms (named in this study as Model FP); lastly, cocoa agroforests in which companion plants were
composed primarily of oil palms (named in this study as Model P).
We measured the diversity of cocoa agroforests in the Bengamisa-Yangambi forest landscape
by evaluating base on the following: (i) species diversity (species richness, Shannon–Wiener index,
Piélou’s evenness index, Simpson’s index, rarefaction curve); (ii) relative abundance; (iii) structure
(density and basal area); and (iv) linkage between density and biodiversity. Each of these parameters is
generally used in the characterization of cocoa agroforest in other countries [15,40,41,43–47] and for
the characterization of forest stands [29,48,49].
The diversity and structure (basal area and density of associated plants) were calculated for each
of the 25 cocoa agroforests. Diversity was expressed using (a) species richness, (b) Shannon–Wiener
index, (c) Piélou’s evenness index, and (d) Simpson’s index [50]. Specific richness (S) is represented
by the total or average number of species counted in the cocoa agroforest (obtained by counting the
number of species). The Shannon–Wiener index provides an expression of diversity by considering
the number of species and the abundance of individuals within each of these species. It is calculated
by the following formula: H0 = − Si=1 pi log pi, where: pi = proportional abundance or percentage of
P
species importance, calculated as follows: pi = ni/N; ni is the number of individuals of a species in the
plot; N is the total number of individuals of all species in the plot; and S is the total number of species
in the plot. The Shannon–Wiener index is often accompanied by the Piélou’s evenness index, which is
expressed by the following formula: 0 = H0/H0 max, where: H0 max = log S and S is the total number
of species. This index is a measure of the distribution of individuals within species, independent of
species richness. Its value varies from 0 (dominance of a single species) to 1 (equitable distribution of
individuals within the species). These two indexes remain dependent on sample size and habitat type.
Simpson’s index measures the probability that two randomly selected individuals belong to the same
P
species. It is determined by the following formula: L = [ni(ni − 1)]/[N (N − 1)] , where ni is the
number of individuals in the species i and N is total number of individuals. As sometimes different
diversity indices do not all lead to the same conclusion [50], the rarefaction curves were associated
with these indices to make conclusions more robust.
Relative abundance was calculated (for each zone; for each cocoa agroforest models; and for the
suitability of associated plants for the agronomy of cocoa (Suitable species and Unsuitable species))
according to the following formula:
!
Number o f species stems
A(%) = 100 (1)
All stems o f the plot
Structure of each cocoa agroforest was evaluated based on the density (number of trees per ha)
and the basal area (sums of areas of sections of all trees measured at 1.3 m) of cocoa trees and associatedForests 2020, 11, 1096 6 of 21
plants. The basal area was calculated by the following formula:ST = π(Dbh)2 /4, where ST is the basal
area expressed in m2 per ha and DBH is expressed in meters. The density calculation concerned first
the whole tree population of cocoa agroforest and then the cocoa-associated plants.
Relation between density and species diversity: To establish a possible link between the stem
density of species used as associated plant for cocoa trees and species richness, we used the Pearson
correlation. This allowed us to correlate density and species richness by zone.
We also used statistical analysis to compare zones (Zones A, B, C, and D) and agroforest
models (Model F, Model FP, and Model P). Therefore, descriptive (mean and standard deviation) and
inferential analyses (one-way ANOVA, Kruskal test, Wilcoxon–Mann–Whitney test, and simple linear
regression) were used. We verified normality using the Shapiro test and verified the homoscedasticity
of variance using the Bartlett test. When the data distribution was nonparametric, Kruskal test,
and Wilcoxon–Mann–Whitney test were used as appropriate. Otherwise, we used One-way ANOVA
and Pearson’s correlation as appropriate. All these analyses were performed by the R software
version 4.0.2 [51] under its R studio interface. The acceptable error for the statistical analyses was 5%.
The graphs were produced using packages ggplot2 [52] (simple linear regression) and BioDiversity
Professional version 2.0 software (The Scottish Association for Marine Science, Oban, United Kingdom)
(rarefaction curves). Diversity indices were performed using the Biodiversity R Package [53] and the
Vegan Package [54] in the R software [51].
Findings are presented in the following way: (a) species richness and diversity; (b) abundance of
plants associated with cocoa; (c) suitable and unsuitable plant species for cocoa agronomy; (d) main
uses of plants associated with cocoa; (e) structure of cocoa agroforest; and (f) relation between density
and species richness of each cocoa agroforest. These results are later discussed in the context of DRC,
and in parallel with previous research across other forest landscapes of the tropics.
3. Results
3.1. Species Richness and Diversity Index
A total of 6558 stems, including 996 stems of cocoa-associated plants and 5562 cocoa trees. They are
distributed in 90 species including Theobroma cacao, and 78 genera and 38 families were inventoried
throughout the survey area. Each cocoa agroforest contains on average 13 species associated with
cocoa trees (Table 1). Species richness and diversity indexes (Shannon-Wiener and Simpson) and
Piélou’s equitability (the distribution of stems within species) increase with distance from Kisangani
city. Indeed, all these indices are low in Zone A (near Kisangani, between 18 and 33 km from Kisangani
city) and increase as one moves away from it. On the other hand, they are all high in Zone D (forest
zone, between 66 and 81 km from Kisangani city), except for specific richness, which is higher in Zone
C (situated between 50 and 65 km from Kisangani city). The rarefaction curve (Figure 2) shows a
low number of species in the area surrounding the city (Zone A). The species richness and indexes
are generally low in Model P (cocoa agroforests in which companion plants are dominated by oil
palms) compared to Model F (agroforests in which companion plants (associated with cocoa trees) are
dominated by forest species) and Model FP (cocoa agroforests in which companion plants are split
equally between forest species and oil palms) (Table 2). Looking at the entire landscape, Model FP
contains the most species followed by Model F (Figure 3).Forests 2020, 11, x FOR PEER REVIEW 7 of 21
Table 1. Average species richness and diversity (± standard deviation) of cocoa-associated plants per
Forestsagroforest
2020, 11, 1096
in four zones of the Bengamisa-Yangambi landscape. 7 of 21
Whole Region
Zone A (n = 6 Zone B (n = 11 Zone C (n = 3 Zone D (n = 5 p-
Indices/Index
Table 1. Average species richness Agroforests)
Agroforests) and diversity (±standard deviation) of
Agroforests) cocoa-associated(nplants
Agroforests)
= 25
perValue
Agroforests)
agroforest in four zones of the Bengamisa-Yangambi landscape.
Species Richness 5.83 (± 2.48) 12.55 (± 8.71) 20.67 (± 14.29) 16 (± 6.63) 12.6 (± 8.9) 0.0725
Zone A (n = 6 Zone B (n = 11 Zone C (n = 3 Zone D (n = 5 Whole Region
Shannon-Wiener
Indices/Index p-Value
Agroforests)
0.99 (± 0.5) Agroforests)
1.65 (± 1.2) Agroforests) (n = 25 Agroforests)
2.14 (± 1.51) Agroforests)2.3 (± 0.54) 1.68 (± 1.05) 0.1836
index
Species Richness
Piélou's 5.83 (±2.48) 12.55 (±8.71) 20.67 (±14.29) 16 (±6.63) 12.6 (±8.9) 0.0725
Shannon-Wiener 0.56 (± 0.19) 0.6 (± 0.37) 0.69 (± 0.38) 0.85 (± 0.09) 0.65 (± 0.3) 0.2828
equitability 0.99 (±0.5) 1.65 (±1.2) 2.14 (±1.51) 2.3 (±0.54) 1.68 (±1.05) 0.1836
index
Piélou’s
Simpson’s index 0.45 (± 0.22) 0.58 (± 0.39) 0.68 (± 0.45) 0.83 (± 0.12) 0.61 (± 0.33) 0.2142
0.56 (±0.19) 0.6 (±0.37) 0.69 (±0.38) 0.85 (±0.09) 0.65 (±0.3) 0.2828
equitability
Legend:index
Simpson’s Zone A0.45
(18–33 km from0.58
(±0.22) Kisangani
(±0.39) city), Zone
0.68 B (34–490.83
(±0.45) km(±0.12)
from Kisangani 0.61city), Zone C (50–
(±0.33) 0.2142
65 km from
Legend: Zone A Kisangani
(18–33 km city), Zone D city),
from Kisangani (66–81 km
Zone from km
B (34–49 Kisangani city) and
from Kisangani city),nZone
= number
C (50–65of
kmcocoa
from
Kisangani city), Zone D (66–81 km from Kisangani city) and n = number of cocoa agroforests.
agroforests.
Figure 2. Species
Figure 2. Species rarefaction
rarefaction curve
curve considering
considering the
the number
number of individuals sampled
of individuals sampled and the species
and the species
richness by cocoa agroforests in four zones of the Bengamisa-Yangambi landscape. Legend:
richness by cocoa agroforests in four zones of the Bengamisa-Yangambi landscape. Legend: Zone Zone A
(18–33 km from Kisangani city), Zone B (34–49 km from Kisangani city), Zone C (50–65
A (18–33 km from Kisangani city), Zone B (34–49 km from Kisangani city), Zone C (50–65 km from km from
Kisangani city) and
Kisangani city) and Zone
Zone DD (66–81
(66–81 km
km from
from Kisangani
Kisangani city).
city).
Table 2. Average
Table 2. Average species
species richness
richness and
and diversity
diversity (±standard
(± standard deviation)
deviation) of
of cocoa-associated
cocoa-associated plants
plants in
in
three models
three models of
of cocoa
cocoa agroforests
agroforests in
in Yangambi-Bengamisa
Yangambi-Bengamisalandscape.
landscape.
ModelFF
Model Model FP (n = 5 Model
ModelP P Whole region
Indices
(n = 10 Agroforests) Model FP (n = 5
Agroforests) (n = 10 Agroforests) (nWhole region (n = p-Value
= 25 Agroforests)
Indices (n = 10 (n = 10 p-Value
Species Richness 16.4 (±6.19) b Agroforests)
17.4 (±10.92) b 6.4 (±6.96) a 25 Agroforests)
12.6 (±8.9) 0.011
Agroforests) Agroforests)
Shannon-Wiener
Species Richness 16.4 (±(±0.63)
2.33 6.19) bb 17.4
2.29 (± 10.92)
(±0.78) bb 6.4(±0.79)
0.73 (± 6.96)
a a 12.6
1.68 (± 8.9)
(±1.05) 0.011
0.00011
index
Shannon-Wiener
Piélou’s 2.33 (±(±0.08)
0.85 0.63) bb 2.29 (± 0.78)bb
0.83 (±0.11) 0.73
0.36 (± 0.79)
(±0.25) a a 1.68(±0.3)
0.65 (± 1.05) 0.00011
0.002
index
equitability
Simpson’s index 0.83 −6
Piélou's equitability 0.85 (±(±0.14)
0.08) bb 0.81 (±0.16)
0.83 (± 0.11)bb 0.29 (±0.27)
0.36 a a
(± 0.25) 0.61 (±0.33)
0.65 (± 0.3) 8.50 × 10
0.002
Simpson’s
Legend:index 0.83 (± 0.14)in
Model F (agroforests b which companion
0.81 (± 0.16) b [associated
plants 0.29 (± 0.27)
with a trees] 0.61
cocoa (± 0.33)
are dominated 8.50 × 10⁻⁶
by forest
species); Model FP (cocoa agroforests in which companion plants [associated with cocoa
Legend: Model F (agroforests in which companion plants [associated with cocoa trees] are dominated trees] are split equally
between forest species and oil palms); and Model P (cocoa agroforests in which companion plants [associated with
by forest
cocoa trees]species); ModelbyFP
are dominated oil (cocoa
palms). agroforests in which
Models not sharing companion
a common plants
letter (a and b)[associated
in a row are with cocoa
significantly
trees] p = 0.05.
areatsplit
different equally between forest species and oil palms); and Model P (cocoa agroforests in which
companion plants [associated with cocoa trees] are dominated by oil palms). Models not sharing a
common letter (a and b) in a row are significantly different at p = 0.05.Forests 2020, 11, 1096 8 of 21
Forests 2020, 11, x FOR PEER REVIEW 8 of 21
Figure 3. Species
Figure 3. Species rarefaction
rarefactioncurve
curveconsidering
consideringthethe number
number of individuals
of individuals and and specific
specific richness
richness in
in three
three
modelsmodels
of cocoaofagroforests
cocoa agroforests in the Bengamisa-Yangambi
in the Bengamisa-Yangambi landscape. landscape.
Legend: ModelLegend: Model F
F (agroforests
(agroforests in which companion
in which companion plants [associated
plants [associated with cocoa with
trees]cocoa trees] are dominated
are dominated by forestModel
by forest species); species);
FP
Model FP (cocoa agroforests in which companion plants [associated with cocoa trees] are split
(cocoa agroforests in which companion plants [associated with cocoa trees] are split equally between equally
between forestand
forest species species and oiland
oil palms); palms);
Modeland Modelagroforests
P (cocoa P (cocoa agroforests in which companion
in which companion plants
plants [associated
[associated with cocoa
with cocoa trees] trees] are by
are dominated dominated by oil palms).
oil palms).
3.2. Abundance
3.2. Abundance of
of Plants
Plants Associated
Associated with
with Cocoa
Cocoa
The five
The fivemost
mostabundant
abundant species
species represent
represent around
around 60%60% ofplants
of the the plants associated
associated with These
with cocoa. cocoa.
These
five fiveabundant
most most abundant
species species represented
represented 84%, 59%, 84%, 59%,
53%, and53%,
47%and 47% ofassociated
of plants plants associated
with cocoa with
in
cocoa in Zones A, B, C, and D, respectively. Elaeis guineensis JACQ. (366 plants representing
Zones A, B, C, and D, respectively. Elaeis guineensis JACQ. (366 plants representing 36.75% of total 36.75%
of totalassociated
plants plants associated
to cocoa)toiscocoa)
the mostis the most abundant
abundant species inspecies in the
the entire entire
study study
area, area, followed
followed by Musanga by
Musanga cecropioides
cecropioides R. BR. (45R. BR. (45
plants or plants
4.52%).orConsidering
4.52%). Considering
each zone,each zone,
Elaeis Elaeis guineensis
guineensis (110orplants
(110 plants 84.62% or
84.62% in Zone A; 179 plants or 63.93 in Zone B; and 51 plants or 51% in Zone C) was
in Zone A; 179 plants or 63.93 in Zone B; and 51 plants or 51% in Zone C) was most abundant of all most abundant of
all species
species except
except in the
in the forest
forest area
area (Zone
(Zone D),D), whereit itwas
where wassurpassed
surpassedby Musangacecropioides
byMusanga cecropioides (35
(35 plants
plants
or 42.17%). Species planted by farmers such as Elaeis guineensis (oil palm), Persea
or 42.17%). Species planted by farmers such as Elaeis guineensis (oil palm), Persea americana MILLERamericana MILLER
(avocado) and
(avocado) Dacryodes edulis
and Dacryodes edulis (D.
(D. DON)
DON) H.J.H.J. LAM.
LAM. (African
(African pear)
pear) dominate
dominate in in cocoa
cocoa agroforests
agroforests
around Kisangani
around Kisangani city
city (Zone
(Zone A)A) in
in contrast
contrast toto other
other areas
areas where
where residual
residual forest
forest species
species dominate.
dominate.
However, the five most abundant species in the cocoa agroforests of four zones constitute
However, the five most abundant species in the cocoa agroforests of four zones constitute more than more than
half (59.54%)
half (59.54%) ofof the
the cocoa-associated
cocoa-associatedplant plantindividuals
individualsininthetheBengamisa-Yangambi
Bengamisa-Yangambi landscape
landscape (Table 3).
(Table
3).
Table 3. The five most abundant species by cocoa agroforests in four zones of Bengamisa-Yangambi landscape.
Table 3. The five most abundant species
Zoneby cocoa
A (n = 6 agroforests
Zone B (n= 11 in Zone
four Czones
(n = 3 of Zone
Bengamisa-Yangambi
D (n = 5 Whole Region
Species Local Names Main Uses
landscape. Agroforests) Agroforests) Agroforests) Agroforests) (25 Agroforests)
Elaeis guineensis Adjagale Edible 110 179 51 26 366
Musanga Zone A (n
Kombo Timber - - 10 35 45
cecropioides Local Main = 6 Zone B (n= 11 Zone C (n = 3 Zone D (n = 5 Whole Region
Species
Pycnanthus
Names
Gbotugbu Uses
Timber Agroforest- Agroforests)
35 Agroforests)
- Agroforests)
- (25 Agroforests)
35
angolensis
Ficus exasperata Kasage Medicinal s) 3 24 - - 27
Elaeis guineensis
Pseudospondias Adjagale Edible 110 179 51 26 366
Bume Medicinal - 25 - - 25
microcarpa
Musanga
Maesopsis eminii Kombo
Ngana Timber
Medicinal - - - - 10 12 35 6 45
18
cecropioides
Petersianthus
Pycnanthus Angbeche
Gbotugb Caterpillar - 17 - - 17
macrocarpus Timber - 35 - - 35
angolensis
Carapa procera u
Mbindo Medicinal - - 14 - 14
Medicina
Ficus exasperata Kasage 3 24 - - 27
l
Pseudospondias Medicina
Bume - 25 - - 25
microcarpa l
Medicina
Maesopsis eminii Ngana - - 12 6 18
l
Petersianthus Angbech Caterpill
- 17 - - 17
macrocarpus e arForests 2020, 11, 1096 9 of 21
Table 3. Cont.
Zone A (n = 6 Zone B (n= 11 Zone C (n = 3 Zone D (n = 5 Whole Region
Species Local Names Main Uses
Agroforests) Agroforests) Agroforests) Agroforests) (25 Agroforests)
Macaranga Abou
Timber - - 13 - 13
monandra chumbuge
Tetrorchidium
Aboligi Timber - - - 9 9
didymostemon
Persea americana Savoka Edible 8 - - - 8
Bridelia
Bubu Caterpillar - - - 7 7
atroviridis
Dacryodes edulis Angboka Edible 5 - - - 5
Senna siamea Ngbangaolaya Medicinal 4 - - - 4
Total of top five
130 280 100 83 593
species
Total of all
species in study 155 476 187 178 996
area
Percentage of
83.87 58.82 53.48 46.63 59.54
top five species
Legend: Zone A (18–33 km from Kisangani city), Zone B (34–49 km from Kisangani city), Zone C (50–65 km from
Kisangani city), Zone D (66–81 km from Kisangani city) and n (number of cocoa agroforests in each zone).
3.3. Suitable and Unsuitable Species for Cocoa
3.3.1. Suitable Species to Cocoa Agronomy
The suitable species for cocoa production (Table 4) represent 27.31% of cocoa-associated
plants recorded in the Bengamisa-Yangambi landscape’s cocoa agroforests. They belong to 19
species of the 90 species recorded (They thus represent 21.59% of species in the whole region).
Musanga cecropioides (with 57 plants representing 21% of the total plants associated with cocoa),
followed by Pycnanthus angolensis (WELW.) EXELL (with 38 plants representing 14% of the total plants
associated with cocoa), are the most abundant species for the entire studied area. Considering each
zone, Ficus exasperata VAHL (with 3 plants representing 42.9% of the plants associated with cocoa)
dominate in Zone A, Pycnanthus angolensis (with 35 plants representing 25% of the plants associated
with cocoa) dominate in Zone B, Macaranga monandra MULL. ARG. (with 13 plants representing 25%
of the plants associated with cocoa) dominate in Zone C and Musanga cecropioides (with 35 plants
representing 47.94% of the plants associated with cocoa) dominate in Zone D. However, a large
proportion of individuals (140 plants representing 51.47% of the plants associated with cocoa) of
these suitable species for cocoa trees are concentrated in Zone B and a small proportion (seven plants
representing 2.5% of the plants associated with cocoa) in Zone A.
Table 4. Abundance of suitable species for cocoa agronomy by cocoa agroforests in four zones in the
Bengamisa-Yangambi landscape.
Zone A (n = 6 Zone B (n = 11 Zone C (n = 3 Zone D (n = 5 Whole Region
Species
Agroforests) Agroforests) Agroforests) Agroforests) (n = 25 Agroforests)
Musanga cecropioides 2 10 10 35 57
Pycnanthus angolensis 0 35 3 0 38
Ficus exasperata 3 24 1 1 29
Petersianthus macrocarpus 0 17 6 4 27
Zanthoxylum gilletii 0 12 8 6 26
Macaranga monandra 0 2 13 4 19
Bridelia atroviridis 0 9 0 7 16
Macaranga spinosa 0 5 4 6 15
Albizia gummifera 0 10 1 1 12
Albizia adianthifolia 0 4 2 2 8
Alstonia boonei 1 4 0 1 6Forests 2020, 11, 1096 10 of 21
Table 4. Cont.
Zone A (n = 6 Zone B (n = 11 Zone C (n = 3 Zone D (n = 5 Whole Region
Species
Agroforests) Agroforests) Agroforests) Agroforests) (n = 25 Agroforests)
Albizia ferruginea 0 3 0 2 5
Canarium schweinfurthii 0 0 3 0 3
Croton haumanianus 0 2 0 0 2
Ficus elastica 0 1 1 0 2
Ficus mucuso 1 0 0 1 2
Ficus wildemaniana 0 1 0 1 2
Zanthoxylum lemairei 0 1 0 1 2
Harungana
0 0 0 1 1
madagascariensis
Total of suitable plants 7 140 52 73 272
Total of all plants in
155 476 187 178 996
study area
Percentage of suitable
4.52 29.41 27.81 41.01 27.31
plants
Legend: Zone A (18–33 km from Kisangani city), Zone B (34–49 km from Kisangani city), Zone C (50–65 km from
Kisangani city) and Zone D (66–81 km from Kisangani city).
3.3.2. Unsuitable Species for Cocoa Agronomy
Unsuitable species for cocoa production (Table 5) represented 13.35% of cocoa-associated plant
stems recorded in the Bengamisa-Yangambi landscape. They are grouped in 22 species out of 90 species
recorded (25% of the species of the whole region). Pseudospondias microcarpa (A. RICH.) ENGLER
(medicinal species) (26 plants or 19.5%) and Myrianthus arboreus P. BEAUV. (edible fruit species) (16
plants or 12%), are the most abundant species in that category in cocoa agroforests of the study area.
However, considering each zone, the highest representations are Dacryodes edulis (edible fruit species)
with five plants or 71.43% in Zone A, Pseudospondias microcarpa (medicinal species) with 26 plants or
38.46% in Zone B, Carapa procera GILBERT (timber species) with 14 plants or 45.16% in Zone C, and
both Vernonia conferta BENTHAM (medicinal species) and Pterocarpus soyauxii TAUB. (timber species)
with six plants or 20% each in Zone D. However, a large proportion (48.87%) of individuals of these
unsuitable species are concentrated in Zone B and are less represented (5.26%) in Zone A.
Table 5. Abundance of unsuitable species for cocoa agronomy by cocoa agroforests in four zones of the
Bengamisa-Yangambi landscape.
Zone A (n = 6 Zone B (n = 11 Zone C (n = 3 Zone D (n = 5 Whole Region
Species
Agroforests) Agroforests) Agroforests) Agroforests) (n = 25 Agroforests)
Pseudospondias microcarpa 1 25 0 0 26
Myrianthus arboreus 0 16 0 0 16
Carapa procera 0 1 14 0 15
Dacryodes edulis 5 3 1 3 12
Pterocarpus soyauxii 0 1 4 6 11
Rauvolfia vomitoria 0 4 1 3 8
Trichilia gilgiana 0 4 2 2 8
Vernonia conferta 0 0 0 6 6
Desplatsia dewevrei 0 4 1 0 5
Oncoba welwitschii 0 1 0 4 5
Blighia welwitschii 0 2 0 1 3
Synsepalum subcordatum 0 0 3 0 3
Uapaca guineensis 1 0 1 1 3
Barteria fistulosa 0 1 0 1 2
Canthium subcordatum 0 0 1 1 2Forests 2020, 11, 1096 11 of 21
Table 5. Cont.
Zone A (n = 6 Zone B (n = 11 Zone C (n = 3 Zone D (n = 5 Whole Region
Species
Agroforests) Agroforests) Agroforests) Agroforests) (n = 25 Agroforests)
Cola lateritia 0 2 0 0 2
Anonidium mannii 0 0 1 0 1
Cola marsupium 0 0 1 0 1
Drypetes gossweileri 0 0 1 0 1
Gilbertiodendron dewevrei 0 0 0 1 1
Homalium longistylum 0 1 0 0 1
Panda oleosa 0 0 0 1 1
Total of unsuitable plants 7 65 31 30 133
Total of all plants in study area 155 476 187 178 996
Percentage of
4.52 13.66 16.58 16.85 13.35
unsuitable plants
Legend: Zone A (18–33 km from Kisangani city), Zone B (34–49 km from Kisangani city), Zone C (50–65 km from
Kisangani city) and Zone D (66–81 km from Kisangani city).
3.4. Main Uses of Plants Associated with Cocoa
3.4.1. Main Uses of Plants Associated with Cocoa by Zone (i.e., Main Distance from Kisangani)
In the study area, we inventoried trees hosting caterpillars, trees with edible products, trees with
medicinal properties, timber, and other trees with secondary or unknown uses (Table 6). Within these
categories, trees with edible products were the most abundant (70.56 ± 50.4 trees per ha), especially in
Zone A. The least abundant use category was timber (5.76 ± 7.1 individuals per ha) for the entire study
area. Timber was most abundant in Zone C (13.33 ± 13.05 trees per ha) and Zone D (13 ± 4.69 trees
per ha).
Table 6. Average number of tree species (±standard deviation) by cocoa agroforests in four zones of
Yangambi-Bengamisa landscape according to their main uses.
Zone A (n = 6 Zone B (n = 11 Zone C (n = 3 Zone D (n = 5 Whole Region
Main Uses p-Value
Agroforests) Agroforests) Agroforests) Agroforests) (n = 25 Agroforests)
Edible 85.33 (±32.36) 78.91 (±49.48) 77.33 (±85.54) 30.4 (±39.76) 70.56 (±50.4) 0.265
Hosts for
0.67 (±1.63) 12 (±14.86) 9.33 (±6.11) 12.8 (±10.35) 9.12 (±11.75) 0.07834
caterpillars
Medicinal 11.33 (±8.55) 38.91 (±37.23) 76 (±79.9) 25.6 (±17.57) 34.08 (±39.38) 0.115
Timber 1.33 (±2.07) a 13.45 (±12.93) a 53.33 (±52.2) b 52 (±18.76) b 23.04 (±28.38) 0.002034
Others
(minor or no 4.67 (±7.34) 29.82 (±42.61) 33.33 (±34.02) 21.6 (±14.59) 22.56 (±31.91) 0.2558
known uses)
Total 103.33 (±37.64) a 173.09 (±56.23) b 249.33 (±13.44) b 142.4 (±7.45) ab 159.36 (±71.96) 0.01405
Legend: Zone A (18–33 km from Kisangani city), Zone B (34–49 km from Kisangani city), Zone C (50–65 km from
Kisangani city) and Zone D (66–81 km from Kisangani city). Zones not sharing a common letter (a and b) in a row
are significantly different at p = 0.05.
3.4.2. Main Uses of Plants Associated with Cocoa by Cocoa Agroforest Models
Table 7 shows that trees for medicinal use are more abundant (48.8 ± 31.88 individuals per ha)
in Model F, followed by tree species with secondary functions (fuelwood, construction wood, etc.)
or unknown (37.6 ± 41.06 individuals per ha). In Model FP, individuals in the medicinal category
have been most inventoried (52.8 ± 64.96 trees per ha), followed by those with individuals possessing
certain edible products (50.4 ± 35.05 trees per ha). Finally, in Model P, individuals of species with edible
products are more dominant (121.6 ± 24.6 trees per ha), followed by medicinal species (10 ± 12.82).
There is a significant difference between the different models in each of the main uses (p-value < 0.05).Forests 2020, 11, 1096 12 of 21
Table 7. Average number of tree species (±standard deviation) in three models of cocoa agroforests in
Yangambi-Bengamisa landscape according to their main uses.
Model F Model P
Model FP (n = 5 Whole Region
Main Uses (n = 10 (n = 10 p-Value
Agroforests) (n = 25 Agroforests)
Agroforests) Agroforests)
Edible 29.6 (±25.24) a 50.4 (±35.05) a 121.6 (±24.6) b 70.56 (±50.4) 0.0001507
Tree-hosting
15.6 (±13.91) a 11.2 (±11.1) ab 1.6 (±2.8) b 9.12 (±11.75) 0.01258
caterpillars
Medicinal 48.8 (±31.88) a 52.8 (±64.96) ab 10 (±12.82) b 34.08 (±39.38) 0.007181
Timber 30.4 (±25.38) ab 39.2 (±43.58) a 7.6 (±13.79) b 23.04 (±28.38) 0.04679
Others (minor or
37.6 (±41.06) a 28.8 (±25.2) ab 4.4 (±10.41) b 22.56 (±31.91) 0.0071
no known uses)
Whole region 162 (±77.98) 182.4 (±113.3) 145.2 (±38.69) 159.36 (±71.96) 0.653
Legend: Model F (agroforests in which companion plants [associated with cocoa trees] are dominated by forest
species); Model FP (cocoa agroforests in which companion plants [associated with cocoa trees] are split equally
between forest species and oil palms); and Model P (cocoa agroforests in which companion plants [associated with
cocoa trees] are dominated by oil palms). Models not sharing a common letter (a and b) in a row are significantly
different at p = 0.05.
3.5. Structure of Cocoa Agroforests
The average density and basal area of all species (cocoa trees and cocoa-associated plants) in the
study area (Table 8) are 1048.16 trees/ha and 17.28 m2 /ha, respectively. Of these, cocoa- associated
plants take up 15.20% of total density, but 55.84% of total basal area. The density and basal area of
cocoa-associated plants in the cocoa agroforests of the study area increase with distance from Kisangani
city, except in Zone D where they have decreased compared to the previous areas (Zone C and Zone B).
The average density and basal area of cocoa-associated plants in the study area are, respectively, 159.36
trees/ha (p-value = 0.01405) and 9.65 m2 /ha (p-value = 0.273).
Table 8. Average density and basal area of cocoa-associated plants (±standard deviation) by cocoa
agroforests in four zones of Yangambi-Bengamisa landscape.
Cocoa Agroforest Zone A (n = 6 Zone B (n = 11 Zone C (n =3 Zone D (n = 5 Whole Region
p-Value
Structure Agroforests) Agroforests) Agroforests) Agroforests) (n = 25 Agroforests)
Density of associated 249.33 (±113.44) 142.4 (±7.45)
103.33 (±37.64) a 173.09 (±56.23) b 159.36 (±71.96) 0.01405
plants (n/ha) b ab
Basal area of associated
5.59 (±5.28) 10.95 (±9.4) 15.36 (±3.35) 8.26 (±4.66) 9.65 (±7.52) 0.273
plants (m2 /ha)
Density of (n/ha) of cocoa 913.33 (±213.07) 959.27 (±154.07) 746.67 (±78.93) 789.6 (±92.81) 888.8 (±168.24) 0.107
Basal area of cocoa 10.91 (±2.63) 9.14 (±1.94) 8.2 (±2.04) 9.68 (±3.9) 9.56 (±2.58) 0.453
Density of whole region 1016.67 (±77.94) 1132.36(±187.62) 996 (±34.64) 932 (±77.82) 1048.16 (±70.36) 0.133
Basal area of whole region 13.13 (±3.04) 19.19 (±7.73) 17.28 (±2) 18.08 (±3.13) 17.28 (±5.91) 0.248
Legend: Zone A (18–33 km from Kisangani city), Zone B (34–49 km from Kisangani city), Zone C (50–65 km from
Kisangani city) and Zone D (66–81 km from Kisangani city). Zones not sharing a common letter (a and b) in a row
are significantly different at p = 0.05.
Table 9 shows that Model F had the highest density (1146 stems/ha) and basal area (22.99 m2 /ha),
while Model P recorded the lowest density (971 trees/ha) and basal area (12.1 m2 /ha). The difference of
density between the three models is not statistically significant, but the difference becomes significant
when comparing the basal area (p-value = 9.62 × 10⁻⁷ ).Forests 2020, 11, x FOR PEER REVIEW 13 of 21
Table 9. Average density and basal area of cocoa-associated plants (± standard deviation) in three
models of cocoa agroforests in the Bengamisa-Yangambi landscape.
ForestsCocoa
2020, 11, 1096
Agroforest Model F (n = 10 Model FP (n = 5 Model P (n = 10 Whole Region (n = 13 of 21
p-Value
Structures Agroforests) Agroforests) Agroforests) 25 Agroforests)
Density of associated
162 (± 77.98) 182.4 (± 113.3) 145.2 (± 38.69) 159.36 (± 71.96)
Table
plants Average density
9. (n/ha) and basal area of cocoa-associated plants (±standard deviation) in0.653
three
models
Basal ofareacocoa
of agroforests in the Bengamisa-Yangambi landscape.
associated plants 12.38 (± 9.48) 9.87 (± 4.83) 6.81 (± 5.77) 9.65 (± 7.52) 0.263
Cocoa(mAgroforest
2/ha) Model F (n = 10 Model FP (n = 5 Model P (n = 10 Whole Region (n = 25
p-Value
Structures Agroforests) Agroforests) Agroforests) Agroforests)
Density (n/ha) cocoa 984 (± 200.55) 824 (± 109.8) 826 (± 114.53) 888.8 (± 168.24) 0.0629
Density of associated
Basal area of cocoa
plants (n/ha)
9.6 (±(±77.98)
162 2.97) 9.81 (± (±113.3)
182.4 3.45) 9.4 (± (±38.69)
145.2 1.91) 9.56 (± (±71.96)
159.36 2.58) 0.961
0.653
Density
Basal area ofofassociated
whole
114612.38
(± 217.52)
(±9.48) 1006.4 (±(±4.83)
9.87 50.72) 971.26.81
(± (±5.77)
103.67) 1048.16
9.65(± 70.36)
(±7.52) 0.0525
0.263
plants (m2/ ha)
region
Density (n/ha) cocoa 984 (±200.55) 824 (±109.8) 826 (±114.53) 888.8 (±168.24) 0.0629
Basal area of whole
Basal area of cocoa 22.999.6
(±(±2.97)
3.86) a 16.229.81 (±3.45)
(± 2.77) b 12.19.4
(± (±1.91)
2.85) b 9.56(±(±2.58)
17.28 5.91) 9.620.961
× 10−7
Density region
of whole region 1146 (±217.52) 1006.4 (±50.72) 971.2 (±103.67) 1048.16 (±70.36) 0.0525
Basal area of whole
Legend: Model region 22.99 (±3.86)
F (Agroforests a
in which 16.22 (±2.77) bplants [associated
companion 12.1 (±2.85) b with cocoa
17.28trees] 9.62 × 10⁻⁷
(±5.91)are dominated
Legend:
by forestModel F (Agroforests
species); Model FP in (cocoa
which companion
agroforestsplants [associated
in which with cocoa
companion trees][associated
plants are dominated
withbycocoa
forest
species); Model FP (cocoa agroforests in which companion plants [associated with cocoa trees] are split equally
trees]
betweenare splitspecies
forest equally between
and forest
oil palms); and species
Model Pand oilagroforests
(cocoa palms); and Modelcompanion
in which P (cocoa agroforests in which
plants [associated with
companion plants
cocoa trees] are [associated
dominated with cocoa
by oil palms). trees]are
Models dominated
not sharing a commonby oil (a
letter palms). Models
and b) in notsignificantly
a row are sharing a
different at p = 0.05.
common letter (a and b) in a row are significantly different at p = 0.05.
3.6. Relationship
3.6. Relationship Between
between Density
Density and
and Species
Species Richness
Richness of
of Cocoa
Cocoa Agroforest
Agroforest
There is
There is strong
strongcorrelation = 76%)
correlation(r (r= 76%) between
between the species
the species richness
richness and the anddensity
the density of
of cocoa-
cocoa-associated
associated plants plants inagroforests
in cocoa cocoa agroforests in the Bengamisa-Yangambi
in the Bengamisa-Yangambi landscape
landscape (Figure (Figure 4)each
4) and in and
in each zone of distance (p-value = 9.4 × 10 −6 , R2 = 58%). Moreover, the specific richness in the
zone of distance (p-value = 9.4e-06, R = 58%). Moreover, the specific richness in the cocoa agroforests
2
cocoa
of agroforests of the above-mentioned
the above-mentioned landscape is strongly landscape
correlated is strongly
with thecorrelated
density ofwith the density
suitable of suitable
associated plants
associated
(r = 77%, p-value = 77%, p-value
plants =(r6.537e-06, = 6.537
R2 = 57.6%) (Figure
−6
× 10 4a) 2 = 57.6%)
, R and (Figure
with the 4a) of
density and with the associated
unsuitable density of
unsuitable
plants associated
(r = 84.8%, plants
p-value (r = 84.8%,
= 8.236 × 10⁻⁸, R p-value = 8.236
2 = 70.8%) × 10−8
to cocoa trees = 70.8%)
, R2(Figure to cocoa trees (Figure 4b).
4b).
Figure 4. Correlation
Figure 4. between species
Correlation between speciesrichness
richnessand
andplant
plantdensity
densitybybycocoa
cocoaagroforests
agroforests
in in four
four zones
zones of
of
thethe Bengamisa-Yangambi
Bengamisa-Yangambi landscape.
landscape. Correlation
Correlation betweenbetween
species species
richnessrichness
and cocoaand cocoa
suitable suitable
associated
associated
plants plants
density (a), density (a), cocoa
cocoa suitable suitableplants
associated associated
densityplants density
(b) and (b) associated
all cocoa and all cocoa associated
plants density
plants
(c). density
Legend: Zone(c).ALegend:
corresponds Zone A corresponds
to 18–33 to 18–33city,
km from Kisangani kmZone
from Kisangani city,
B corresponds Zonekm
to 34–49 B
corresponds
from Kisanganitocity,
34–49
Zonekm from Kisangani
C corresponds city, km
to 50–65 Zone C corresponds
from Kisangani city,to 50–65
Zone km from Kisangani
D corresponds to 66–81
km from Kisangani city and (•) corresponds to a cocoa agroforests.Forests 2020, 11, 1096 14 of 21
4. Discussion
This study reveals that distance from Kisangani (The main city in the landscape) influences the
plants composition (expressed here by species diversity and structure) of the cocoa agroforests. Market
access associated to the proximity of this city and land-use intensity and the related disturbance impact
the composition of plants associated with cocoa in the forest landscape.
4.1. Floristic Composition of Cocoa Agroforests
The cocoa agroforests of the Bengamisa-Yangambi landscape harbor substantial tree diversity. A
total of 996 plants associated to cocoa belonging to 89 species, 77 genera, and 38 families were recorded
in 25 cocoa agroforests across the Bengamisa-Yangambi landscape. An average of 13 species occurred
per cocoa agroforest. Furthermore, these cocoa agroforests have a high tree diversity as is the case in
other cocoa production systems in other parts of the tropics. For example, the authors of [55] inventoried
71 species and 32 families in the agroforestry systems in East Cameroon. Also, the authors of [56]
inventoried 27 families and 62 species in cocoa farms in the southern region of Cameroon. However,
these results are small compared to those of [57], who obtained 40 families, 112 genera, and 127 species
in the Bajo Caguän zone in Colombia. These variabilities can be explained, among others, by the
different ecosystems in which the cocoa agroforests were developed, the socio-economic of the
landscapes, and the type of cocoa farming systems promoted [57] and sample size.
The high abundance of oil palms (366 of 996 total plants surveyed, i.e., 37%) in cocoa agroforests
of the Bengamisa-Yangambi landscape may be explained by the fact that many cocoa trees were
established under old oil palm plantations. Indeed, the Bengamisa-Yangambi landscape was subject
to an intensification of oil palm cultivation during the colonial period [35]. Moreover, in that region,
oil palm is the main source of oil consumed by local people. It is also the main source of beverage
consumed (palm wine) in the region. These observations were made in other African countries like
Côte d’Ivoire [50] and Cameroon [7,41,42].
The species rarefaction curve, which considers the number of individuals and specific richness
(Figures 2 and 3), allows us to see that the number of species grows alongside the increase of cocoa
agroforest. This suggests that farmers do not necessarily grow the same species. Since individual
farmers have their own species interest [42,58] in separate cocoa agroforests, the combination of all their
farms allows for a longer list of species in the cocoa landscape created between the city of Kisangani
and the natural forest. The floristic composition of this cocoa landscape is a mixture of local forest
species and exotic plants (avocado, etc.). Among these species, those introduced by farmers (oil palm,
avocado, African pear) are more present in the cocoa agroforest near Kisangani. Conversely, native
species are mainly found within cocoa agroforests close to the forest. However, the abundance of such
introduced species indicates the degree of alteration of the cocoa agroforests compared to primary
forest [41].
4.2. Specific Diversity in the Cocoa Agroforests of the Study Area
Even though the difference between zones is not statistically significant (one-way ANOVA),
the diversity indices (Shannon-Wiener, Simpson’s, Piélou equitability) revealed that diversity is
increasing from Zone A (near Kisangani city) to Zone D (forest region). However, large agglomerations
like the city of Kisangani exert strong pressure on the forest for satisfying their multiple needs (fuel
wood, timber, NTFPs, etc.). This leads to forest fragmentation, followed by deforestation. Therefore,
the pressure exerted on the forest also influences the species composition of the cocoa agroforests [41].
It is well established that the distance between the cocoa agroforests and the forest stands may affect
the processes associated to forest tree species dissemination [42]. Moreover, when differences in forest
coverage change (mainly his disturbance) were considered, plant species richness in cocoa agroforest
decreased with increasing intensity of land-use [2], confirming previous studies [41] in the forest zone
of southern Cameroon.You can also read