Air2Rail Reducing CO2 from intra-European aviation by a modal shift from air to rail - Transport & Environment
←
→
Page content transcription
If your browser does not render page correctly, please read the page content below

Page 1 of 43

                                  Air2Rail
  Reducing CO2 from intra-European aviation
       by a modal shift from air to rail

Study commissioned by the European Federation for Transport and Environment

Delft, March 2020
Table 7 ‘Trains 10% faster’ partly revised July 2020

Arie Bleijenberg

mail@ariebleijenberg.nl
www.ariebleijenberg.nl/en

         Air2Rail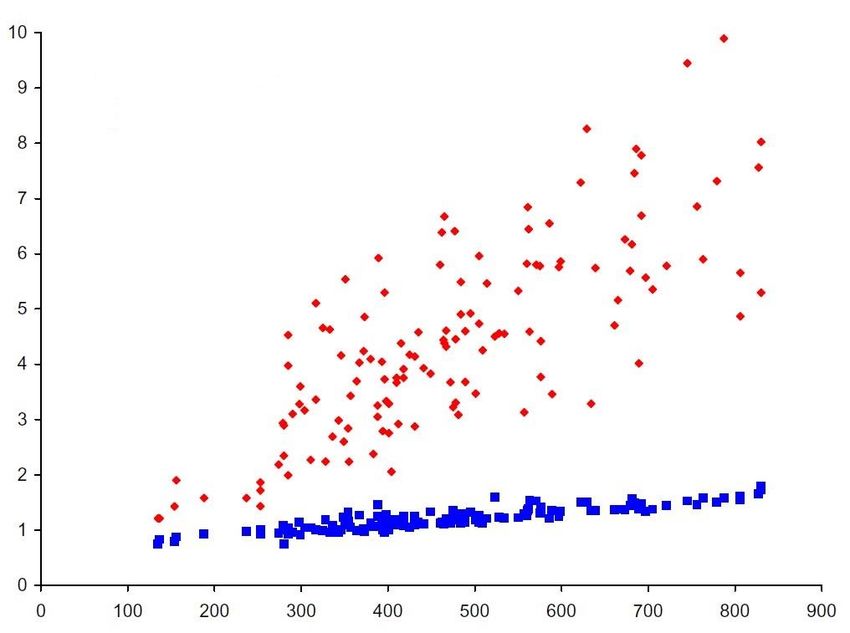
Page 2 of 43

Table of contents

Management summary                                  3

1. Introduction and acknowledgements                 4
2. Aim and research method                           5
3. Climate impact from aviation                      7
4. CO2 emissions from European aviation              9
5. Travel time and distance                         14
6. Estimate of the intra-European air/rail market   18
7. CO2 reduction by improved rail services          21
8. Dynamics in the European travel market           27
9. Conclusions and recommendations                  29

References                                          32

Annex A European Aviation CO2 Model                 35
Annex B City pairs aviation and railways            40

         Air2Rail
Page 3 of 43

Management summary
The contribution of global aviation to climate change is projected to triple by 2050. This is clearly
incompatible with the Paris Agreement. One way to curb this development, is to make people take
the train instead of the plane. Travel by aviation within Europe,1 emits on average 5 to 6 times more
CO2 per passenger-kilometre than by train. To reduce the growth in intra-European aviation,
improvements in the speed and quality of rail services are considered and implemented. The present
study estimates the potential reduction in CO2 from intra-European aviation, by a modal shift to rail.

The potential CO2 reduction is estimated for three assumed railway improvements:
- All railway services competing with aviation, have the modal split of the contemporary best high-
    speed rail connections. This implies HSR between all larger cities in Europe.
- All railway services competing with aviation become 10% faster.
- The number of intra-European night trains is increased by 50%.
The present study did not investigate measures and costs required for these improvements in rail
services.

The overall conclusion from this study is that 4 to 7 Mt CO2 from intra-European aviation may be
avoided by a modal shift from aviation to railways. This corresponds with 6% to 11% of the CO2
emissions from intra-European aviation and with 2% to 4% of CO2 from all fuel bunkers in Europe,
which includes departing intercontinental flights. To achieve this reduction in CO2, faster intra-
European rail services are required, in combination with policies which discourage flying. Train travel
in Europe on distances between 200 and 1000 km needs to increase by around 50% in 2040. This
includes the new passengers coming over from aviation plus the trend-wise growth of 1% per year.

The main recommendation for the railway industry is to develop a truly European strategy and
marketing. Governments need to implement policies which discourage flying. When considering
public funding for railway improvements, the dynamics and environmental impact in the entire intra-
European travel market need to be assessed. Travellers are advised to take the train instead of the
plane, whenever possible.

1
 Europe comprises in this study the EU-28 plus Switzerland, Norway and Iceland. The United Kingdom was still
member of the EU during most part of the present research.

         Air2Rail
Page 4 of 43
1. Introduction and acknowledgements
The growing contribution of aviation to climate change is a grave concern. One mitigation solution is
to make people shift trips from aviation to railways. The CO2 emissions per passenger-kilometre from
rail are, indeed, much lower than from air. Train travel on distances from 200 to 1000 km – European
scale – can be an alternative to flying. The present study estimates the potential reduction in CO2
from intra-European aviation, by a modal shift to rail.
An important backbone for this study is a detailed database of the intra-European aviation market,
including the related CO2 emissions. T&E developed this database in conjunction with the present
study. Annexes A and B describe the crucial contribution of Juliette Egal and Thomas Earl, both from
T&E. I thank them for their great effort and the fruitful exchange of information and ideas we had.
Furthermore, I thank Dimitrios Papaioannou from the International Transport Forum and Barth
Donners from RHDHV for their willingness to share data from their respective intercity travel models
with me and for answering my questions.
Finally, I am grateful to T&E, for giving me the opportunity to investigate the potential environmental
benefits of a modal shift from aviation to rail. However, the views expressed in this report are not
necessarily supported by T&E and are solely my responsibility.
Air2RailPage 5 of 43
2. Aim and research method
Aim of this study is:
To estimate the potential reduction in CO2 from intra-European aviation, by a modal shift from air
travel to railways
To gain the desired insight, information is required on these three topics:
- The intra-European aviation market, with the related CO2 emissions (chapter 4).
- The intra-European rail market on distances competing with aviation, including the CO2 emissions
(chapter 6).
- The determinants for people to choose rail over air travel, or the other way around (chapter 5).
Detailed information about the number of people traveling between airports in Europe, is available
from Eurostat (2019). These statistics form the basis of T&E’s ‘European Aviation CO2 database’
(Annex A). If a city has more than one airport, these airports are combined, resulting in passenger
volumes between city pairs. This being relevant for the competition with rail.
CO2 emissions per flight between specific airports and types of aircraft are derived from Plane Finder
and the ICAO CO2 Calculator Methodology.2 The combination of these data sources, results in a
database which can be used to gain insight in the passenger volumes and CO2 emissions between
specific city pairs, for different distance classes and for passenger volume classes. The following
chapters will use results obtained from this database.
Data on the intra-European rail market are, unfortunately, not available. Most railway companies
regard information about passenger volumes between city pairs, as business confidential. Through a
mix of sources, data are acquired on 34 city pairs (Annex B). To arrive at an estimate of the entire rail
market at distances between 200 and 1000 km, several statistics are combined. Eurostat data on all
intra-European rail passenger kilometres are taken as starting point (EC 2019). Subtracted from this is
the share of urban and regional rail – for which aviation is not an alternative – based on model
estimates by the International Transport Forum (ITF 2020). Finally, a linear diminution of the
passenger volume by rail is assumed between 200 and 1000 km.
The CO2 emissions per passenger-kilometre depend on train type, speed, occupancy and the CO2
from the electricity generation, which differs between countries. The present study doesn’t take
these differences into account and uses only a European average value of 0.025 kg CO2 per
passenger-kilometre for train travel.3
Two existing models of the intra-European passenger market have been considered as estimate for
the rail market (ITF 2020; RHDHV 2020). These models contain calculated estimates of the travel
volumes per mode and between different cities. Both models are not based on empirical data of
passenger volumes between city pairs. Comparing the calculated air travel volumes, with the data
from Eurostat, however, shows large differences. Therefore, these models are not used in the
present study as representation of the European passenger market. However, some specific uses are
made from calculations with these models.
The determinants for the choice people make between air and rail travel, are derived from the
international literature, including available empirical evidence (chapter 5).
2
See Annex A for details.
3
Somewhat below the 28.39 g CO2/pkm, being the last available official figure published by the European
Environmental Agency over 2014 (EEA 2017). Emissions for specific trips by different modes, can be estimated
with the EcoPassenger tool from the UIC.
Air2RailPage 6 of 43
The chapters 4 and 6 on the European travel market and 5 on determinants for mode choice, are the
main building blocks for the assessment of the potential CO2 reduction in chapter 7. Because this is a
static analysis with mainly 2017 data, relevant dynamics in the European travel market are reviewed
in chapter 8. The closing chapter 9 presents the main conclusions and recommendations. First, a brief
overview is sketched of the climate impact from aviation.
Air2RailPage 7 of 43
3. Climate impact from aviation
CO2 emitted by worldwide commercial aviation is estimated at 918 million-tonnes (Mt) CO2 in 2018
(ICCT 2019). This corresponds with 2.4% of global emissions. However, aviation is growing fast and its
CO2 emissions have grown by 5.7% a year since 2013. This growth is stronger than the projections by
ICAO, the UN organization for civil aviation. ICAO’s baseline projects an annual growth rate of 3.8% in
CO2 emissions until 2050 (ICAO 2019). Even this lower-than-actual growth, will more than triple the
emissions, resulting in around 1,900 Mt in 2050. In that same year, global emissions from all sectors
together need to be reduced to below 3,000 Mt CO2, in accordance with the Paris Agreement (IPCC
2019). So, under ICAO’s baseline projection, aviation’s share will rise to two thirds of the required
emissions level. ICAO also sketches an alternative scenario with additional measures to reduce
energy use and partly shift to sustainable fuels. This can lower the emissions from commercial
aviation to 900 Mt CO2 in 2050, which is still far too high. The CO2 emissions from aviation need to go
down to zero, not far beyond 2050, to be in line with the Paris Agreement.
The International Transport Forum developed scenarios for the growth in CO2 from global aviation
until 2050 (ITF 2019). The results of the Current Ambition and High Ambition scenarios are
summarized in table 1. The Current Ambition scenario includes a CO2 price of 100 USD per tonne, a
low share of low-cost carriers on long-haul flights and building all planned high-speed rail links. These
scenario assumptions are not yet current policy. The projected CO2 emission of more than 1,000 Mt
in 2050 are in line with ICAO’s ambitious scenario. Improved energy efficiency of aircraft and
operations contribute most to achieve this modest growth in emissions. Even the High Ambition
scenario – with a carbon price of 500 USD –, doesn’t reduce emissions far enough. Therefore, the ITF
explores also disruptive scenarios, with e.g. electric aircraft for distances below 1600 km and a
substantial use of zero-carbon synthetic fuels.
2015 2030 2050
Current High Ambition Current High Ambition
Ambition Ambition
Billion pkm 6,967 13,533 11,091 21,977 15,861
Mt CO2 714 995 656 1,062 399
Kg CO2/pkm 0.103 0.074 0.059 0.048 0.025
Table 1: Two projections of the global aviation CO2 emissions in 2030 and 2050 (ITF 2019).
The impact of aviation on climate change is not limited to its CO2 emissions. Climate relevant
emissions include nitrogen oxides (NOx), sulphur oxide (SO2), water vapor (H2O), aerosols, contrails
and contrail cirrus. The total climate impact of aviation is estimated to be two to four times higher
than the effect of CO2 emissions alone (IPCC 1999). However, the uncertainties concerning the
impact of some of these non-CO2 emissions are still large. Recent research indicates that the non-CO2
impact from aviation differs strongly between routes and can be partly mitigated by changes in flight
path and altitude (Scheelhaase 2019). The present report does not deal with the non-CO2 impact
from aviation.
This short review underlines that aviation needs to drastically lower its contribution to climate
change. A range of options is available to achieve this:
- Continued technical improvements in aircraft and engines, to reduce energy consumption.
- Improvements in Air Traffic Management and infrastructure use, also to reduce energy
consumption.
- Development and deployment of (hybrid) electric aircrafts, to reduce both the CO2 and non-CO2
impact from aviation.
Air2RailPage 8 of 43
- Use of advanced biokerosene, reducing the net CO2 emissions.
- Use of zero-CO2 synthetic kerosene.
- Reduced growth in air travel, through a shift toward train trips.
- Reduced growth in air travel through internalisation of external costs.
- Reduced growth in long distance travel in general.
From this range of options to reduce CO2 emissions from aviation, the present study only focuses on
the potential modal shift from air to rail within Europe.
Air2RailPage 9 of 43
4. CO2 emissions from European aviation
European aviation4 emitted 184 Mt CO2 in 2017 (UNFCCC 2017). This includes all jet fuel taken on
board in these 31 European countries, both for domestic and international flights (bunkers). So,
Europe is responsible for about one fifth of the global aviation emissions. Figure 1 below shows the
growth since 1990 in CO2 emissions from commercial aviation in EU-28.
CO2 emissions from aviation EU-28
200
150
Total
Mt CO2
100
International
Domestic
50
0
1990 1995 2000 2005 2010 2015
Figure 1: CO2 emissions from European commercial aviation 1990-2017 (UNFCCC 2017).
Domestic flights – within a single country – emitted 16 Mt CO2 in 2017, corresponding with 9% of the
EU-28 total from aviation. A few countries account for the largest share of domestic emissions, due
to their large size, being an island or difficult to access by surface transport (road and rail). Table 2
gives an overview of the countries with domestic aviation emissions larger than 1 Mt CO2. These
countries have a substantial scope to reduce aviation emission with national policies.
Country Mt CO2
France 5.0
Spain 2.8
Italy 2.2
Germany 2.1
United Kingdom 1.8
Norway 1.1
Total top 6 countries 15.1
Total EUR-31 17.6
Table 2: CO2 emissions from domestic aviation of countries with more than 1 Mt in 2017 (UNFCCC
2017).
4
Europe comprises in this study the EU-28 plus Switzerland, Norway and Iceland. This demarcation is chosen
because of data availability and political and geographic consistency. EUR-31 will be used as an acronym.
Flights to the so-called outermost regions of the EU are not included in the present study on intra-European
travel. Outermost regions include the Canary Islands, Madeira, the Azores and six French overseas territories.
CO2 from flights between EUR-31 and the outermost regions are estimated at 9 Mt.
Air2RailPage 10 of 43
Another way to look at the country data, is comparing aviation CO2 per person. High scores can be
caused by a high GDP/capita, being an island, difficult accessible for surface transport and having a
large transfer hub for international passengers. Table 3 shows the top-ranking countries.
Country tonne CO2/cap
Iceland 3.5
Luxembourg 2.9
Cyprus 1.2
Malta 0.9
Netherlands 0.7
Switzerland 0.6
Ireland 0.6
United Kingdom 0.6
EUR-31 average 0.5
Table 3: Countries with aviation CO2 larger than 0.6 tonne per capita in 2017 (calculated from
UNFCCC 2017 and Eurostat population data).
The future growth of the CO2 emissions from European aviation, depends on the projected growth in
transport volume and expected technical improvements. Figure 2 shows projected CO2 emissions till
2040 for six scenarios: three for passenger volume and two for technical progress (EU 2019).
Figure 2: Projected CO2 emission from European aviation in Mt till 2040 (EU 2019).
The present report will further be limited to emissions from intra-European flights, because there lies
the main potential for a modal shift from air to rail. T&E’s European Aviation database calculates the
emissions from intra-European flights at 62 Mt CO2.5 So, the remaining 122 Mt of the European
aviation emissions will not be dealt with in this report, because these are related to flights between
EUR-31 and countries in the rest of the world.
5
See Annex A. Because the database uses statistics which only cover ‘main airports’, 8.3% of the passengers
and 9.9% of the CO2 are not included in the analyses with the database in this report. This relates to small
travel volumes between some airports.
Air2RailPage 11 of 43
This demarcation to intra-EUR-31 flights, corresponds largely with the share of aviation covered by
the European Trading System (ETS) for CO2 allowances. Of the countries covered in the present study,
only Switzerland is not participating in the ETS.
Figure 3 presents an overview of the share of CO2 from intra-European flights per distance class.
Flight distance has a large impact on the modal split between air and rail.6 Up to a distance of 200 to
300 km, the contribution from aviation to climate change is very small. The reason is, of course, that
the number of passengers flying on these short distances is small, because cars, trains and buses
typically offer a faster and more frequent alternative. After a peak at distances around 500 km, the
share per 100 km class, only slightly decreases.7
Intra-EUR-31 aviation
% CO2 per distance class
10%
8%
6%
4%
2%
0%
Distance class km
Figure 3: CO2 share per distance class for intra-EUR-31 flights (calculated from database Annex A).
The CO2 emissions per passenger-kilometre are also related to flight distance. The emissions during
landing and take-off (LTO-cycle) weigh heavier on short flights than on long ones. Aircraft type and
occupancy too, have a large impact on specific emissions. Figure 4 shows the average CO2/pkm,
depending on distance, as derived from T&E’s database. The real emissions from a specific flight can
differ greatly from the average, especially for short flights and for city pairs with few passengers.
When comparing these specific emissions with train or car travel, it should be considered that the
global warming impact from aviation is two to four times larger than from its CO2 emissions alone.8
6
See chapter 5.
7
Note that these data refer to intra-EUR-31 flights only. Incorporating flights to and from the Middle East,
North Africa, the Balkan and Eastern European countries, will result in a somewhat different distribution.
8
See chapter 3.
Air2RailPage 12 of 43
kg CO2/pkm
0,30
0,20
0,10
0,00
0 1000 2000 3000
Distance km
Figure 4: Specific CO2 emission per passenger-kilometre (moving average of three 100 km distance
classes calculated from database Annex A).
Trains can be an alternative for flying at distances below 1000 km.9 The CO2 emissions from intra-
European flights shorter than 1000 km are calculated at 28 Mt. The number of passengers on these
flights was 359 million in 201710, connecting 1539 city pairs11 and covering 208 billion passenger-
kilometres. More than 1,000 city pairs have a volume of air travel below 200,000 passengers a year
(figure 5). The 18 city pairs with more than 2 million air passengers, account only for 14% of CO2 from
intra-EUR-31 aviation below 1000 km. These data show that aviation has a dense geographical
network, in which very many city pairs are relevant for a modal shift to rail. The air passenger
volumes are comparable to train passenger volumes. Four million passengers travel on the busiest
train service in Europe while the tenth busiest carries 1 million passengers a year (Annex B).
City pairs and CO2 per volume class
1200
900
600
City pairs
300 0.01 Mt CO2
0
0.0-0.1 0.1-0.5 0.5-1.0 1.0-1.5 1.5-2.0 2.0-2.5 2.5-3.0 > 3.0
Volume classes in million passenger/year
Figure 5: Number of city pairs and CO2 emissions per passenger volume class for intra-EUR-31 flights
below 1000 km (calculated from database Annex A).
9
This will be underpinned in Chapter 5. Night trains can be attractive on larger distances, up to 1200 km. The
potential for night trains will be discussed in Chapter 7.
10
Passenger volumes, passenger kilometres and CO2 emissions per city pair, are the combination of both
directions in the present study.
11
The actual number of routes is larger, because flights from smaller airports and with few passengers are not
included in Eurostat (2019). See Annex A.
Air2RailPage 13 of 43
For travel to and from islands12, it is hard for railways to offer a competitive service to aviation – both
in travel time and costs. Ireland is, of course, best accessible by air and many islands are popular
holiday destinations. Table 4 shows the top-10 aviation routes to an island. Total aviation CO2 on the
24 island routes with more than 600,000 passengers a year, is 2.0 Mt. Several routes below 600,000
passengers also serve islands.
City pair Distance km Million pax Billion pkm Mt CO2
Dublin-London 466 5.0 2.3 0.39
Belfast-London 530 2.5 1.3 0.20
Catania-Rome 539 2.0 1.1 0.15
Barcelona-Palma de Mallorca 202 1.9 0.4 0.06
Madrid-Palma de Mallorca 547 1.8 1.0 0.12
Palermo-Rome 409 1.6 0.6 0.10
Milano-Palermo 883 1.2 1.0 0.10
Cagliari-Milan 700 1.2 0.8 0.10
Amsterdam-Dublin 750 1.1 0.8 0.10
Cagliari-Rome 394 1.1 0.4 0.07
Total island routes with more
than 600,000 passengers/year 31.2 15.0 1.99
Table 4: Intra-European aviation routes to islands (from database Annex A).
Building a bridge or tunnel for trains, could be considered to improve the rail connection to islands.
However, the distances to cross are generally too large to make this feasible. An exception might be
a crossing of the strait of Messina, between Sicily and mainland Italy. Shifting to electric aircraft
might be a better option to decarbonize air travel to and from islands.
Subtracting the emissions from flights longer than 1000 km, as well as island connections, brings the
focus of this study down to a target 26 Mt CO2. This corresponds with 42% of the emissions from all
intra-EUR-31 flights and 14% of total CO2 from European aviation. The following chapters will
estimate which share of this 26 Mt can be avoided by a modal shift from air to rail.
12
Travel by ferry is required for both rail and road transport.
Air2RailPage 14 of 43
5. Travel time and distance
What makes people prefer a trip by train over an airplane? Or the other way around? The short
answer is travel time. Of course, costs, reliability and comfort are also relevant to some extent.
Traveling by train is generally more comfortable than by plane. The ticket price mostly favours a
choice for aviation. But the strongest determinant for the market share of rail in the air/rail market,
certainly is travel time (e.g. Steer Davies Gleave 2006; Dobruszkes et al 2014; Nordenholz et al 2017;
Savelberg and de Lange 2018). This holds at least under current prices and levels of comfort.
The dominant influence of travel time corresponds with the historic long-term trends in mobility.
Increased speed has been the main driving force in the succession of transport modes: from horse
carriage, via train and car to aviation (Bleijenberg 2017b). And because the average travel time
budget per person is in the long run constant, higher speed translates into longer travel distances
and thus mobility growth (e.g. Grübler 1990; Schafer and Victor 2000; Bleijenberg 2017a).
Travel times by rail and aviation are collected for 58 European city pairs (Annex B). Figure 6 presents
the comparison, including the required time at airports and railway stations. Only seven routes out of
58, have a shorter travel time by rail than by air. These are all connected by HSR. The travel time
advantage of aviation increases with the trip distance.
Travel time air and rail
16
14
12
10
Hour
8
Aviation
6
Railways
4
2
0
0 200 400 600 800 1000
Distance km
Figure 6: Travel time between airports and railway stations of 58 city pairs (from annex B).
When we compare travel times between city centres for the same city pairs, the competitive position
of the train is better. Figure 7 gives this overview. Up to a distance of 700 km, the train can offer an
equal travel time between city centres as aviation. It is not surprising that trips between the centres
of large cities have a favourable travel time by train, because traveling to and from the airports is
time consuming in large metropolitan areas. However, only part of the passenger’s travels between
city centres. Table 5 gives an overview of the 11 city pairs with a shorter travel time by rail than by
air. All connections are between the centres of two large cities.
Air2RailPage 15 of 43
Travel time air and rail between city centres
16
14
12
10
Hour
8
Aviation
6
Railways
4
2
0
0 200 400 600 800 1000
Distance km
Figure 7: Travel time between 58 European city centres for aviation and railways (from annex B).
City pair Distance Time rail Time air Rail Mpax Air Mpax Share rail
Milano - Rome 474 km 4:00 5:25 4.0 1.3 75%
Barcelona - Madrid 483 km 3:05 4:40 3.9 2.3 62%
Lyon - Paris 407 km 2:55 4:50 3.4 0.7 83%
London - Paris 348 km 3:15 5:05 2.4 2.4 50%
Amsterdam - Paris 402 km 4:10 4:50 2.0 1.4 58%
Brussels - Paris 251 km 2:00 4:25 1.5 0.2 89%
Marseille - Paris 638 km 4:20 5:05 1.3 1.6 56%
Brussels - London 350 km 2:45 4:55 0.8 0.7 55%
Bordeaux - Paris 508 km 3:00 5:00 1.5
Lisbon - Porto 277 km 3:20 4:30 1.1
Berlin - Hamburg 255 km 2:10 5:05 1.1
Table 5: Travel time between city centres at least 10 minutes shorter by railway than aviation (Annex
B).
Because it is impractical to collect travel times, for both air and rail, on all European city pairs, the
present study uses geographic distance as a proxy for travel time and as a main determinant for the
modal split air/rail. Travel time by air is a well correlated function of distance and in the range
considered here, only slightly increases with distance. This follows from the overview presented in
figure 8, of travel times between 130 city pairs within Europe (Dobruszkes et al 2014). Therefore,
there is no need to collect these data for each city pair.
Air2RailPage 16 of 43
Figure 8: Travel time in hours by high-speed rail (red) and aviation (blue) between 130 city pairs in
Europe connected by both HSR and aviation (Dobruszkes et al 2014).
The travel time by HSR also increases with distance, but it has a much greater variance, as figure 8
shows. This reflects the differences in net-speed of the 130 connections by HSR. Dobruszkes et al
(2014) consider rail connections between city pairs as high-speed when part of the journey is
travelled at a speed higher than 250 km/h. The net-speed is lower, because of the use of
conventional track on part of the trip, detours from the geographical distance and intermediate
stops. The net-speed between the investigated city pairs lies approximately between 100 and 200
km/h, which reflects an important variation in quality of the rail service.
As a next step, empirical data are presented on the modal split in the air/rail market, dependent on
distance. Figure 9 gives a recent overview of 17 global HSR connections (Savelberg and de Lange
2018). A similar analysis is made for 34 European city pairs as shown in figure 10. Both sets of
empirical data show a similar pattern. The best rail connections, have a mode share of 100% below
250 km and hardly any share above 1000 km. The line between these two points reflects the best rail
services. However, many connections don’t perform as well as the best.
The presented empirical data on the modal split in the air/rail market, will be used to assess the
impact of better rail services in chapter 7. As the resulting mode shares relate to the entire air/rail
market, an estimate of the size of this combined market is made first, in chapter 6.
Air2RailPage 17 of 43
Aviation share in air/rail market
100%
80%
60%
40%
20%
0%
0 200 400 600 800 1000 1200
Distance km
Figure 9: Share of aviation in the air/rail market for 17 worldwide HRS connections related to distance
(data from Savelberg and de Lange 2018, based on Cheng 2010 and Nash 2013).
Aviation share in air/ral market
100%
80%
60%
Domestic
Island
40%
Channel
Other
20%
0%
0 200 400 600 800 1000 1200
Distance km
Figure 10: Share of aviation in air/rail market for 34 city pairs related to distance (data from annex B).
Air2RailPage 18 of 43
6. Estimate of the intra-European air/rail market
Data on the intra-EUR-31 aviation market are part of T&E’s ‘European Aviation CO2 database’ (Annex
A). The number of passengers, passenger-kilometres and Mt CO2 are available for city pairs, distant
classes and volume classes. Unfortunately, similar data on the rail market are not available. To get an
estimate of the entire intra-European air/rail market, a proxy has been made of passenger volumes
by rail at distances between 200 and 1000 km.
The starting point is the 2017 figure of 470 billion passenger-kilometres by rail in the EU-28 of which
127 billion by HSR (EC 2019). Figure 11 shows the growth in rail and air volumes since 1995. Because
three more countries are considered in the present study, 2.7% is added, corresponding with their
population size.
A large share of travel by rail is within metropolitan areas and on short distances. This share isn’t part
of the air/rail market. Data from the ITF intercity passenger model are used to estimate the share of
rail travel relevant for competition with aviation (ITF 2020). Following these model calculations, 79%
of rail travel is on distances shorter than 200 km. The 21% passenger-kilometres on longer distances
is considered relevant for the air/rail market. This results in an estimated rail volume of 200 billion
passenger-kilometre in the intra-European air/rail market. This is divided over distance classes by
linear diminution between 200 and 1000 km.
The figures 12, 13, 14 and 15 present overviews of the estimated air/rail market between 200 and
1000 km distance.
Passenger mobility intra-EU-28
Billion passenger-kilometre
800
600
Aviation
400 Conv rail
HSR
200
0
1995 2000 2005 2010 2015
Figure 11: Passenger mobility 1995-2017 by conventional rail, high-speed rail and air intra-EU-28 (EU
2019).
Air2RailPage 19 of 43
Million passengers per distance class
250
200
150
Aviation
100
Railways
50
0
200-300 300-400 400-500 500-600 600-700 700-800 800-900 900-1000
km km km km km km km km
Figure 12: Passenger volume in the estimated air/rail market (own calculations).
Billion pkm per distance class
60
50
40
30 Aviation
20 Railways
10
0
200-300 300-400 400-500 500-600 600-700 700-800 800-900 900-1000
km km km km km km km km
Figure 13: Passenger-kilometres in the estimated air/rail market (own calculations).
Air2RailPage 20 of 43
Mt CO2 per distance class
5
4
3
Aviation
2
Railways
1
0
200-300 300-400 400-500 500-600 600-700 700-800 800-900 900-1000
km km km km km km km km
Figure 14: Mt CO2 from the estimated air/rail market (own calculations).
Air/rail market 200-1000 km
800
600
Aviation
400
Railways
200
0
Million pax Billion pkm 0.1 Mt CO2
Figure 15: Passengers, passenger-kilometres and Mt CO2 in the estimated air/rail market (own
calculations).
A recent paper by Rebel (2019) made an estimate of the potential CO2 reduction from intra-EU
aviation by modal shift from air to rail, without making an estimate of the air/rail market. They apply
a substitution factor on the aviation market, without taking account of the current share of rail
travel. This leads to an overestimation of the additional potential for modal shift for city pairs which a
contemporary favourable share of rail. This is illustrated with travel data between Milano and Rome
(table 5). The current air share is 25% and according to the Rebel paper, this could go further down
to 8% in their medium variant. This seems optimistic, because the best high-speed rail practise on
this distance indicates an attainable air share of only 23% (figure 16 in next chapter).
Air2RailPage 21 of 43
7. CO2 reduction by a modal shift from air to rail
There exists no European plan to improve the speed and quality of international rail services on
distances between 200 and 1000 km. Proposed improvements of railway services mainly focus at
national level, with some exceptions for cross border connections. This reflects the organization of
the railway sector in national companies, with strong involvement of national governments. The
European Court of Auditors (2018) summarizes the current situation in the title of one of their
reports as “A European high-speed rail network: not a reality but an ineffective patchwork.”
To overcome this lack of a comprehensive plan, three general variants for improved railway services
are assessed:
- Best practice. It is assumed that the modal split of the best performing rail links, apply to all
connections competing with aviation. In practice this implies having high-speed rail between
most large European cities.
- Trains 10% faster. This approach assumes that the net-speed between city pairs increases by 10%
on all connections competing with aviation.
- 50% more night trains.
The reduction in CO2 from aviation by these improvements is estimated, using the building blocks
developed in the former chapters. No assessment is made of associated measures, costs and
required time to realize these improvements.
Best practice
A first approach is to estimate the reduction in air travel when all rail services competing with air
routes would have the same quality as the current best. The best practices in rail share can be
derived from figures 9 and 10, corresponding with the line from ‘300 km/0% aviation’ to ‘1050
km/100% aviation’, as indicated in figure 16. Table 6 gives an overview of these ‘best’ rail links from
figure 16. ‘Best’ means the highest rail share related to distance or in other words, close to the
orange line in figure 16. All best connections are between large cities, benefitting from the fast
access from HSR to the city centres. This implies that under the ‘best practice’ assumption, all major
cities in Europe need to be connected by HSR. Additionally, it is assumed that all flights shorter than
300 km will shift to rail (except to and from islands).
Aviation share in air/rail market
100%
80%
60%
40%
20%
0%
0 200 400 600 800 1000 1200
Distance km
Figure 16: Best practice high-speed rail, dependent on distance.
Air2RailPage 22 of 43
City pair Distance Rail Mpax Air Mpax Share air
Tapeh - Koahsiung 291 km 1%
Madrid - Sevilla 390 km 1.8 0.3 17%
Lyon - Paris 407 km 3.4 0.7 17%
Milan - Rome 474 km 4.0 1.4 25%
Marseille - Paris 638 km 1.3 1.6 56%
Tokyo - Heroshima 681 km 53%
London - Lyon 747 km 0.6 0.3 65%
Rome - Stuttgart 801 km 0.1 0.1 62%
Table 6: Best practice city pairs, dependent on distance (Savelberg 2019 and Annex B).
Using the data from the estimated air/rail market, it is calculated that 110 million passengers will
shift under this assumption from air to rail, thus reducing the CO2 emissions from aviation by 7.4 Mt.
The shifted passenger kilometres add up to almost 50 billion. This is a 25% increase in rail travel on
distances between 200 and 1000 km. This estimate must be regarded as a maximum, because not all
air routes can be linked by HRS against reasonable costs. This estimate implies, the other way
around, that an additional 19 Mt CO2 from intra-European aviation can’t be avoided by a shift to rail,
unless a breakthrough in rail technology is realized.
Almost 9,000 km of high-speed rail track was operational in 2018, of which 8,000 in the four
countries with their own, mainly domestic, high-speed services: France, Spain, Germany and Italy (EC
2019). Since 2010 2,600 km were added. The last opened line was between Copenhagen and
Ringsted in Denmark. The transport volume on EU-28 HSR was 127 billion passenger kilometre in
2017 (EC 2019). The only border crossings by high-speed rail are Paris-London-Brussels-Amsterdam
and Barcelona-Perpignan, although the latter doesn’t (yet) offer a fast connection to the French high-
speed network. The high-speed rail network is only one tenth of the network of intra-European air
services, which can be estimated at 100,000 km between 170 city pairs.13 The number of direct
connections by air between European destinations, has grown by more than 6% per year, over the
last two decades (Airbus 2019).
Several new high-speed tracks have been proposed in Europe (UIC 2018). Some of these, however,
have been shelved. An assessment of the European modal shift policy concludes that the goal of
tripling the length of HRS-lines in 2030, as stated in the 2011 White paper, seems unlikely to be
achieved. Between 2011 and 2018 the network is enlarged by only 34% (TRT and TEPR 2019). High
investment costs and uncertainty about the revenues generate doubts. To make a reasonable
business case for new high-speed rail track, several million passengers are needed (Nash 2013).14 This
can be achieved by connecting two large cities, such as London and Paris, or by connecting several
cities along the new track (‘string of pearls’). Specific feasibility studies are required to assess which
new high-speed links are viable.
Donners (2016) designed an enlarged high-speed rail network for Europe. Calculations with the
RHDHV European passenger model, indicate that this will reduce aviation on distances between 200
and 1000 km by 18 billion pkm (RHDHV 2020). This reduction in air travel is calculated with as
reference a modelled ‘optimized’ existing rail network.15 Shifting 18 billion passenger-kilometres
from aviation, reduces CO2 by 2.5 Mt.16
13
Estimated with the model for city pairs between 250 and 1000 km, with at least 500,000 passenger a year.
14
The break-even point depends on several factors, of which the construction cost is the most important.
15
See Donners (2016) for description of the model and the two rail scenarios.
16
Average of 0.14 kg CO2/pkm on distances between 200 and 1000 km.
Air2RailPage 23 of 43
In assessing the environmental benefits of new HSR-links, the gains in modal shift from air and road,
will be partly offset by a shift from conventional rail and by generating extra mobility. Reducing rail
travel time from 4 to 2 hours, will typically attract travellers of which 50% are new, 40% come from
aviation and 10% from the car (UIC 2018).
Next, constructing a new track also causes emissions of CO2. These may add up to 1.5 Mt for building
a 300 km line. The carbon break-even point is estimated to be around 12 years after commissioning
of the project (UIC 2018).
Trains 10% faster
A second approach to assess the modal shift from air to rail, is to estimate the impact of faster train
connections on all links competing with aviation. Faster train services between city pairs can be
achieved by higher cruising speed, less or shorter stops, faster border crossings and better train
paths. To illustrate the impact of such improvements, it is assumed that all train services reduce their
travel time by 10%. Using the data from the estimated air/rail market, it is calculated that this can
make roughly 50 million passengers shift from air to rail.17 This corresponds with 27 billion
passenger-kilometre and a reduction in CO2 by 3.7 Mt. This equals 14% of the 26 Mt CO2 caused by
intra-EU city aviation, below 1000 km and excluding island connections. Intra-European rail travel will
increase by 13% on distances between 200 and 1000 km.
This calculated 14% reduction in CO2 from aviation, is higher than the 7% estimated for rail travel
time reductions in the German long-distance travel market (Nordenholz et al 2017). However, this
publication doesn’t state by how much the rail travel times were assumed to go down. Rail travel is
projected to increase 16% in this scenario, air travel declines by 6% and car driving by 2%. Mobility of
all modes combined, increases slightly, by 0.3%.
Another study assessed the impact of travel time reductions by on average 30% on 8 existing HSR-
lines (Steer Davies Gleave 2006). This is estimated to increase the market share of rail by on average
8%. If this would apply for the entire intra-European air/rail market, roughly 4.3 Mt CO2 will be
avoided.
It is not possible to indicate the required costs and measures, to achieve the assumed 10% reduction
in travel time on a large part of the European rail network. Despite this lack of information, the
estimated 3.7 Mt reduction in CO2, can serve as an indication of the impact from improved rail
services. Of course, larger increases in train speeds, will result in a stronger reduction in air travel.
Priorities in rail improvements can be made by analysing their impact on CO2 from aviation.
Night trains
Night trains can offer an alternative for daytime aviation trips. Most attractive are train departure
times between 19:00 and 23:00, which is in many cases later than the last departing flights. Arrival
times between 7:00 and 9:00 the next day are attractive, because this is earlier than many flights.
Within these timeframes, traveling by night train has less time loss than aviation. With an average
speed of around 80 km/h, this results in a potential market for night trains at distances between 800
to 1200 km (DB 2013; Savelberg 2019). The connected urban areas need to have at least one million
inhabitants to make a night train connection viable.
Currently, the Austrian railway company ÖBB offers most international night trains in Europe. 19
cities are connected through 7 main Nightjet services. The cities include Wien, München, Hamburg,
Berlin, Düsseldorf, Brussels, Venice, Milan and Rome. In 2018 1.4 million passengers travelled by
Nightjet. Domestic night trains are run in e.g. Italy, Romania, Poland, France, the UK and Sweden. The
17
The average current performance of rail services is estimated to correspond with the line between ‘200
km/100% rail’ to ‘950 km/0% rail’ in figure 16.
Air2RailPage 24 of 43
total passenger volume of night trains in Europe is estimated at 6 million a year, as far as data were
obtainable (Steer Davies Gleave and Politecnico di Milano 2017). This reduces CO2 from aviation by
around 0.6 Mt.18
ÖBB expanded its night services during the last years and intends further enlargements. On the other
hand, Deutsche Bahn ended its night trains in 2016 and SNCF limited its night services to two routes,
from Paris to Toulouse and Briançon. The market for rail travel during nights is slowly declining. Main
factors are the growth in daytime high-speed rail services and the rise of low-cost carriers. HSR and
night trains compete partly for the same passengers, which explains that Austria – without HSR –
increases its night services, while Germany and France reduce theirs. Other obstacles for the
operation of night trains are lack of track capacity during the night, due to maintenance works and
slow freight trains, and lack of capacity at main stations during the morning peak. National
differences in gauge width and power voltage also need to be overcome at many international
connections (Steer Davies Gleave and Politecnico di Milano 2017).
A night train network has been designed, connecting Germany with other European countries
(Walther et al 2017). Seven routes are proposed, e.g. from Hamburg to Milan, from Berlin to Paris
and from Amsterdam to Budapest. Next, the impact of these night services on the passenger
volumes for aviation, coach and car were assessed. The changes in travel volumes per mode are
translated in CO2 emissions. The reduction is calculated at 0.05 Mt CO2, with a maximum scenario of
0.10 Mt. These estimates include the diminished travel by car, bus and plane, as well as the extra
CO2 caused by the growth in rail traffic.
Another way to gain insight into the potential reduction of aviation CO2, is to assess the impact of
one extra night service. A night train typically boards 80,000 travellers a year (Savelberg 2019).
Assuming an average 1000 km trip per passenger, this corresponds with 80 million pkm per year.
With an average CO2 emission from aviation at these distances of 0.10 kg per passenger-kilometre,
this results in 0.008 Mt per extra night service. If 30 services are added between the larger cities in
Europe on the relevant distances, this would attract 2.4 million rail travellers from the air and roughly
reduce CO2 from aviation by 0.24 Mt. This is a small share of the current aviation market between
800 and 1200 km, which covers 130 million passengers with 13 Mt CO2 emitted.
Capacity of the rail network
It is not possible in the present study to assess whether existing rail capacity is sufficient for the
trend-wise annual growth of around 1.5%, plus the desired modal shift from air and car. In this
section it is assumed that 40 billion rail passenger-kilometres come over from aviation. Both factors
combined result in a growth of rail pkm from 483 in 2017 to 720 billion in 2040. This is a growth of
50% in 23 years. Considering only distances between 200 and 1000 km, relevant for the rail/air
competition, the rail market increases from 200 to 290 billion pkm.19 The impact of the trend-wise
annual growth is larger than that of the modal shift from air to rail.
Information about track utilization – train-kilometres per track-kilometre – indicate that most
countries have enough opportunities for growth on existing rail track (Steer Davies Gleave 2015). The
Netherlands has the highest track utilization in the EU-28 with almost 50,000 train-kilometres per
track-kilometre (data 2012). Most countries run less than half this number on their network and can
probably accommodate substantial growth. In 2012 seven countries had a utilization of more than
25,000 train-kilometres per track-kilometre and might run into capacity constraints with the
indicated growth in train travel. These countries are Belgium, Denmark, Germany, Luxembourg,
Netherlands, Austria and the United Kingdom. This approach, using national averages for track
18
Average of 0.10 kg CO2/pkm on distances between 800 and 1200 km.
19
Assuming a trend-wise growth by 1% a year on long-distance rail travel.
Air2RailPage 25 of 43
utilization, is of limited value, because specific tracks might face capacity constraints, while other
tracks are heavily underutilized. This can only be investigated in capacity studies for specific routes
and networks.
Existing HSR-links will generally not experience capacity constraints. The busiest high-speed section
in Europe is between Paris Gare de Lyon and the split Lyon/Dijon. 240 trains use this track each day
(2017), carrying 44 million passengers during the year (SNCF 2019). This corresponds with 400 flights
per day (300 seats per aircraft). SNCF indicates that the current maximum capacity on the section
Paris–junction Lyon/Dijon is approached, and therefore plans to expand the train capacity from 13
trains per hour in each direction, to 16 trains in 2030. This is achieved by implementing the advanced
European safety system (ERTMS, European Rail Traffic Management System). The capacity will then
be increased to about 54 million passengers a year. So, the capacity of high-speed rail track is large
compared to the number of passengers flying between the busiest city pair: almost 5 million
between Dublin and London. However, capacity bottlenecks may occur when rail travel between
several city pairs use the same track section. Such as the section between Paris and the Lyon/Dijon
split of the French high-speed rail network.
The Channel Tunnel might in the future limit the growth of rail traffic between England and mainland
Europe. In 2018 almost 11 million passengers crossed the Channel with Eurostar. In addition, the
tunnel is used by freight trains, as well as shuttles for cars, coaches and trucks. Another 11 million
passengers cross the channel by shuttle. It is hard to get information about the capacity of the tunnel
and to what extend this is currently used.20 A document from the European Commission (EC 2013)
states that 43% of the capacity of the Eurotunnel was unused at that time. With some growth since
2013 it is estimated that currently 12 out of the 20 available standard train paths are used. The
capacity can ultimately be increased to 30 paths per hour and per direction (Noultan 2001). This
requires deployment of moving block signalling. Further assuming that the split between shuttles,
freight trains and passenger trains, will not change, the maximum amount of train passengers is
estimated at 27 million a year. This results in a spare capacity of 16 million train travellers per year.
This is smaller than the number of passengers currently flying across the Channel (or North Sea) at
distances below 1000 km: 30 million a year.21 So, the capacity of the Channel Tunnel might become a
bottleneck when pursuing a substantial modal shift from air to rail. However, several solutions can be
considered:
- Expanding the capacity from 20 to 30 standard train paths should be realized in due time.
- Increasing the share of passenger trains, while reducing the share of shuttles. This might require
new arrangements between France, UK and the Eurotunnel company.
- Making short distance flights by zero-CO2 electric aircraft, so freeing up capacity in the tunnel for
modal shift for other city pairs. This is especially attractive for travel between cities where the
train makes a detour, such as Amsterdam-London (4.7 million passengers a year) and
Amsterdam-Manchester (1.0 million passengers a year).
Conclusion
Table 7 summarizes the results of the three developed approaches to estimate the CO2 reduction in
the air/rail market. Main conclusion is that around 4 to 7 Mt CO2 from intra-European aviation, may
be avoided by a modal shift from air to rail. This corresponds with 6% to 11% of the CO2 emissions
from intra-EUR-31 aviation and with 2% to 4% of CO2 from all aviation fuel bunkers in EUR-31. To
achieve this gain, faster intra-European rail services are required. In combination with the trend-wise
growth, train travel on distances between 200 and 1000 km will have to increase by 40% to 50% in
20
A request for this information in December 2019 at the Eurotunnel company – part of the Getlink Groupe –
has not been answered.
21
City pairs above 600,000 passengers per year and excluding islands. Therefore, excluding all air travel
between Ireland and the continent.
Air2RailPage 26 of 43
2040. The present study did not investigate measures and costs, needed for the assessed
improvements of rail services.
Reference Best practice Trains 10% faster Night train
+50%
Air passengers 317 Mpax 207 Mpax -35% 270 Mpax -15% -2.4 Mpax
Rail passenger 500 Mpax 613 Mpax +23% 547 Mpax +9% +2.4 Mpax
Air pkm 190 Bpkm 142 Bpkm - 25% 163 Bpkm -14% - 2.4 Bpkm
Rail pkm 200 Bpkm 248 Bpkm +24% 227 Bpkm +13% +2.4 Bpkm
Air CO2 25.7 Mt 18.3 Mt -7.4 Mt 22.0 Mt -3.7 Mt -0.24 Mt
Rail CO2 5.0 Mt 6.2 Mt +1.2 Mt 5.7 Mt +0.7 Mt +0.06 Mt
Table 7: Overview of the estimated impact of three assumed railway improvements on the air/rail
market between 200 and 1000 km.
Air2RailPage 27 of 43
8. Dynamics in the European travel market
The estimated potential CO2 reduction in the previous chapter, is based on a static analysis for the
year 2017. Before conclusions can be drawn, some important dynamics in the European travel
market will be discussed. Expected changes in travel volumes and specific emissions, might influence
the magnitude of environmental benefits from a modal shift from air to rail. When airport capacity is
constrained, environmental gains from modal shift will be lower. And improved railway services will
not only change the modal split but will – ceteris paribus – also induce new passenger travel.
Travel volumes and emissions
Intra-European aviation is expected to remain growing, while specific emissions per passenger-
kilometre will decline. These opposite developments result in projected CO2 from European aviation
between -18% and +85% in 2040 (Figure 2; EU 2019). Growing aviation emissions will enlarge the
positive impact from improved rail services. However, stronger policies to combat climate change,
will likely not only lead to improved rail services, but also to reduced specific emissions from aviation.
Therefore, it is not likely that anticipated developments in travel volumes and emissions, will have a
large impact on the estimated reduction potential.
Specific emissions for rail travel are estimated at 0.025 kg CO2/pkm (current EU average). This
number is expected to drop towards zero, as a consequence of further decarbonization of the
European power sector. The extra CO2 from more rail passengers, were not included in the estimated
4 to 7 Mt reduction. So, these were already implicitly set at zero.
Average CO2 emissions from aviation at distances between 200 and 1000 km are estimated at 0.140
kg CO2/pkm.22 Because the specific emissions from rail are much smaller than from aviation, travel by
rail is preferred from an environmental viewpoint. This advantage will likely remain for at least
several decades. On the long run and under fierce climate policies, specific aviation emissions might
go down to the current level of rail, as shown in table 1 (ITF 2019).
Airport capacity and short flights
If aviation growth is constrained by airport capacity, shifting passengers from air to rail, will free up
airport capacity for other flights. The expected environmental gain may partly, or even more than
fully, disappear. Eurocontrol (2018) projects a shortage of 1.5 million flights in 2040, or 8% of
unrestrained demand, in its most likely scenario. France, Germany, Netherlands and the United
Kingdom are expected to have the largest shortages, more than 250,000 flights per year.
Shifting short flights to rail has several benefits. Airline costs per pkm are higher for short flights than
for long-haul flights (Steer Davies Gleave 2006). The specific emissions from short flights are also
higher: average 0.17 kg CO2/pkm below 200 km, compared to 0.14 for flights between 200 and 1000
km. These advantages stimulate cooperation between airlines and railway companies, to offer
customers one ticket for train travel to the airport hub and the connecting flight. Among others,
Lufthansa and DB developed the Lufthansa Express Rail as Point-to-Point Feeder to Frankfurt airport
(DB 2020).
In case of shortage of airport capacity, shifting a short flight or feeder to rail, can result in higher
emissions. A 277-seater on a 1000 km trip, emits 8 times more CO2 than the 140-seater on a 200 km
trip, which was replaced by a train feeder. However, when the flight with the 277-seater, was
formerly flown from a nearby airport without capacity shortage, the environmental gain is positive.
22
Average derived from T&E’s ‘European Aviation CO2 Model’ (Annex A). Specific flights can have a much larger
or somewhat smaller emission factor. Non-CO2 emissions from aviation make its impact on climate change two
to four times larger (chapter 3).
Air2RailPage 28 of 43
So, airport capacity and the changes in the wider aviation market, must be considered, when
assessing the environmental impact of modal shift.
Intermodal travel market
The intermodal travel market is dynamic and flexible. Many people can easily change from one mode
to another, when the one becomes better (faster) or the other worse (slower). The quality of travel
also influences spatial behaviour of people and companies. The now classic example is the opening
of the high-speed rail link between Paris and Lyon, which made commuting feasible between these
two cities. In general, improving one mode – rail in the present study – will not only cause a shift
from other modes – aviation and road –, but will also generate new mobility. Faster travel doesn’t
save time, but results in longer distances, thus growth in overall mobility (Bleijenberg 2017a and b).
Shortening the travel time by rail from 4 to 3 hours, will attract new passengers of which 35% shift
from aviation, 25% from the car and 40% is induced travel (UIC 2018). Induced travel needs to be
incorporated in assessments of the environmental benefits of rail improvements.
Induced travel by faster trains can be counteracted by discouraging air travel. This contributes to the
modal shift from air to rail and reduces total mobility growth somewhat. A combination of
discouraging aviation and improving rail services is needed to realize the CO2 reduction of 4 to 7 Mt,
as estimated in chapter 7. Pricing aviation is an obvious way to reduce its attractiveness somewhat.
Several countries have or consider implementing ticket and fuel taxes on aviation (CE Delft and SEO
2019). This is supported by economic and environmental arguments. International aviation is
currently exempt from VAT and environmental costs are not included in the ticket price. Additional
to national aviation taxes, a tax scheme for aviation at European level is both feasible and effective.
Distortion of competition in the global aviation market can be avoided by a proper design of the
aviation charge (Bleijenberg and Wit 1998). There are no legal obstacles either for implementing a
European kerosene tax (Pache 2019).
Sustainable aviation
A modal shift from air to rail can only deliver a modest contribution in the pursuit of sustainable
aviation. Improvements in energy efficiency of engines, aircraft and operations will continue. Zero-
CO2 electric aircraft might become an option at distances below 1000 km, especially suited for island
routes, where rail is not an option. And synthetic kerosene from wind and solar power might become
available to replace fossil fuels. Views on how global aviation can decarbonize are developed and
presented by the International Transport Forum (ITF 2019) and the Energy Transitions Commission
(ETC 2018). Although many developments towards zero-CO2 aviation can’t be foreseen now, it is
important that the needed change is ignited now.
Air2RailYou can also read