Stand-level biomass models for predicting C stock for the main Spanish pine species
←
→
Page content transcription
If your browser does not render page correctly, please read the page content below
Aguirre et al. Forest Ecosystems    (2021) 8:29
https://doi.org/10.1186/s40663-021-00308-w

 RESEARCH                                                                                                                                          Open Access

Stand-level biomass models for predicting
C stock for the main Spanish pine species
Ana Aguirre1,2* , Miren del Río2,3, Ricardo Ruiz-Peinado2,3 and Sonia Condés1

  Abstract
  Background: National and international institutions periodically demand information on forest indicators that are
  used for global reporting. Among other aspects, the carbon accumulated in the biomass of forest species must be
  reported. For this purpose, one of the main sources of data is the National Forest Inventory (NFI), which together
  with statistical empirical approaches and updating procedures can even allow annual estimates of the requested
  indicators.
  Methods: Stand level biomass models, relating the dry weight of the biomass with the stand volume were
  developed for the five main pine species in the Iberian Peninsula (Pinus sylvestris, Pinus pinea, Pinus halepensis, Pinus
  nigra and Pinus pinaster). The dependence of the model on aridity and/or mean tree size was explored, as well as
  the importance of including the stand form factor to correct model bias. Furthermore, the capability of the models
  to estimate forest carbon stocks, updated for a given year, was also analysed.
  Results: The strong relationship between stand dry weight biomass and stand volume was modulated by the
  mean tree size, although the effect varied among the five pine species. Site humidity, measured using the
  Martonne aridity index, increased the biomass for a given volume in the cases of Pinus sylvestris, Pinus halepensis
  and Pinus nigra. Models that consider both mean tree size and stand form factor were more accurate and less
  biased than those that do not. The models developed allow carbon stocks in the main Iberian Peninsula pine
  forests to be estimated at stand level with biases of less than 0.2 Mg∙ha− 1.
  Conclusions: The results of this study reveal the importance of considering variables related with environmental
  conditions and stand structure when developing stand dry weight biomass models. The described methodology
  together with the models developed provide a precise tool that can be used for quantifying biomass and carbon
  stored in the Spanish pine forests in specific years when no field data are available.
  Keywords: Martonne aridity index, Dry weight biomass, Carbon stock, National Forest Inventory, Peninsular pine
  forest, Biomass expansion factor

* Correspondence: arnaiz9@hotmail.com
1
 Department of Natural Systems and Resources, School of Forest Engineering
and Natural Resources, Universidad Politécnica de Madrid, Madrid, Spain
2
 INIA, Forest Research Center, Department of Forest Dynamics and
Management, Madrid, Spain
Full list of author information is available at the end of the article

                                      © The Author(s). 2021 Open Access This article is licensed under a Creative Commons Attribution 4.0 International License,
                                      which permits use, sharing, adaptation, distribution and reproduction in any medium or format, as long as you give
                                      appropriate credit to the original author(s) and the source, provide a link to the Creative Commons licence, and indicate if
                                      changes were made. The images or other third party material in this article are included in the article's Creative Commons
                                      licence, unless indicated otherwise in a credit line to the material. If material is not included in the article's Creative Commons
                                      licence and your intended use is not permitted by statutory regulation or exceeds the permitted use, you will need to obtain
                                      permission directly from the copyright holder. To view a copy of this licence, visit http://creativecommons.org/licenses/by/4.0/.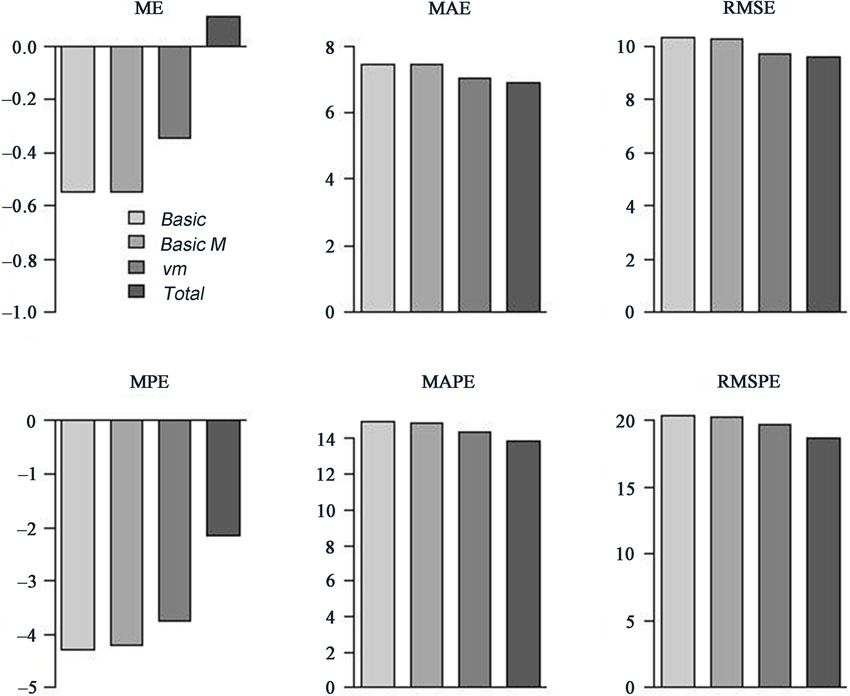
Aguirre et al. Forest Ecosystems   (2021) 8:29                                                                 Page 2 of 16

Background                                                    statistical empirical approach (Neumann et al. 2016).
Forests are fundamental in the global carbon cycle,           The second method is more common in forestry since it
which plays a key role in the global greenhouse gas bal-      uses inventory data such as that provided by NFI’s
ance (Alberdi 2015), and therefore in climate change. As      (Tomppo et al. 2010) and the data required does not
part of the strategy to mitigate climate change, forest       need to be as specific as for the biogeochemical-
carbon sinks were included in the Kyoto Protocol in           mechanism approach. Through this approach, biomass
1998 (Breidenich et al. 1998) and subsequent resolutions      and carbon estimates can be obtained using allometric
as the Paris Agreements in 2015. In accordance, coun-         biomass functions and/or biomass expansion factors
tries are requested to estimate forest CO2 emissions and      (BEFs). Biomass functions require variables for individ-
removals as one of the mechanisms for mitigating cli-         ual trees and/or stand variables (Dahlhausen et al. 2017),
mate change. Based on the international demands, some         while BEFs convert stand volume estimates to stand dry
international institutions request periodic reports on for-   weight biomass (Castedo-Dorado et al. 2012). The BEF
est indicators which are used in global reports. For ex-      method is widely used when little data is available, this
ample, the State of Europe’s Forest 2015 (SoEF 2015) or       being one of the methods recommended in the IPCC
Global Forest Resources Assessment 2020 (FRA 2020)            guidelines (Penman et al. 2003).
request five-yearly information on accumulated carbon           BEFs, including their generalization of stand biomass
in the biomass of woody species or the accumulated car-       functions depending on stand volume, can be affected by
bon in other sources or sinks. Since the development of       environmental conditions and stand characteristics, such
these international agreements, numerous countries            as the species composition (Lehtonen et al. 2004; Soares
have made efforts to achieve the main objective of miti-      and Tomé 2004; Lehtonen et al. 2007; Petersson et al.
gating climatic change. In Spain, for example, the Span-      2012; Jagodziński et al. 2017). Some authors have also
ish Ministry for Ecological Transition and Demographic        pointed to the dependence of the stand biomass-volume
Challenge is developing a data base of the national con-      relationship on age or stand development stage (Jalkanen
tribution to the European Monitoring and Evaluation           et al. 2005; Peichl and Arain 2007; Tobin and Nieuwen-
Program (EMEP) emission inventory, which includes             huis 2007; Teobaldelli et al. 2009; Jagodziński et al.
Land Use, Land-Use Change and Forestry (LULUCF)               2017). When age data are not available, as is the case in
sector, with the aim of estimating carbon emissions and       several NFIs, other variables expressing the development
removals in each land-use category. Furthermore, annu-        stage can be used as a surrogate of age, such as tree size
ally updated greenhouse gas emission data must be pro-        (Soares and Tomé 2004; Kassa et al. 2017; Jagodziński
vided for the UNFCCC (United Nations Framework                et al. 2020). In addition, site conditions can influence the
Convention on Climate Change) Greenhouse Gas Inven-           relationship between stand biomass and stand volume
tory Data.                                                    (Soares and Tomé 2004). These conditions can be
  Soil and biomass are the most important forest carbon       assessed by means of indicators such as site index or
sinks. The carbon present in soils is physically and          dominant height (Houghton et al. 2009; Schepaschenko
chemically protected (Davidson and Janssens 2006), al-        et al. 2018) or directly through certain environmental
though it is more or less stable depending on the type of     variables (Briggs and Knapp 1995; Stegen et al. 2011).
disturbances suffered and the environmental conditions          Most of the information on forests at national level
(Ruiz-Peinado et al. 2013; Achat et al. 2015; Bravo-          currently comes from the National Forest Inventories
Oviedo et al. 2015; James and Harrison 2016). There-          (NFIs). Consequently, many countries have adapted their
fore, the carbon that could be returned to the atmos-         NFIs to fulfil international requirements (Tomppo et al.
phere from the ecosystem after a disturbance is               2010; Alberdi et al. 2017). As regards carbon stock, NFIs
mainly contained in the aboveground biomass, which            are widely recognized as being appropriate sources of
accounts for 70%–90% of total forest biomass (Cairns          data for estimating these stocks (Brown 2002; Goodale
et al. 1997). Carbon stocks and carbon sequestration          et al. 2002; Mäkipää et al. 2008), especially at large scales
in tree vegetation are usually estimated thorough bio-        (Fang et al. 1998; Guo et al. 2010). Although most NFIs
mass evaluation as the amount of carbon in woody              are carried out periodically, the frequency does not coin-
species is about 50% of their dry weight biomass              cide with the international requirements for data on ac-
(Kollmann 1959; Houghton et al. 1996). Although               cumulated carbon and biomass stocks (which may be
species-specific values can be found in the literature,       annual). In the case of the Spanish National Forest In-
this percentage is recommended by the Intergovern-            ventory (SNFI), the time between two consecutive sur-
mental Panel on Climate Change (IPCC) if no specific          veys is longer than that stated in the international
data is available (Eggleston et al. 2006).                    requirements for forest statistics reporting. Hence, the
  There are two main approaches to estimating forest          forest indicators from SNFI data should be updated an-
carbon: i) using biogeochemical-mechanisms and ii) the        nually in order to fulfill the international requirements.
Aguirre et al. Forest Ecosystems   (2021) 8:29                                                                Page 3 of 16

Moreover, the time between two consecutive SNFI is ap-       decreases with the stand development stage. Therefore,
proximately 10 years, although it is carried out a prov-     the specific objectives were to study the dependence of
ince at a time, so not all the Spanish forest area is        the models on these factors and to assess the biomass
measured in the same year. Whereas other countries           expansion factors when varying these variables for the
measure a percentage of their NFI plots each year, dis-      main pine species studied. The biomass models devel-
tributed systematically throughout the country (allowing     oped will allow carbon estimates to be updated for a
annual national estimates to be made, albeit with greater    given year when no field data from SNFI surveys are
uncertainly), the approach used in Spain is to measure       available.
all the plots within a given province, which does not
allow for annual data (or indicators) to be extrapolated
at national level. As a consequence, indicators must be      Methods
updated in the same year for all provinces in order to es-   Data
timate carbon at national level in a given year. A pos-      The data used were from two consecutive completed
sible approach to updating carbon stocks indicators          surveys of the SNFI in the Iberian Peninsula, the Second
from SNFI data would be to estimate the stand biomass        and Third SNFI (SNFI-2 and SNFI-3), which were car-
through tree allometric biomass functions (Neumann           ried out from 1986 to 1996, and from 1997 to 2007 re-
et al. 2016), although this method would require com-        spectively, except for the provinces of Navarra, Asturias
plex individual tree models to update stand information      and Cantabria, where the SNFI-2 surveys were carried
at tree level (tree growth, tree mortality and ingrowth).    out using a different methodology. Data from the SNFI-
Given the strong relationship between stand volume and       3 and SNFI-4 were used for these provinces, covering
biomass (Fang et al. 1998; Lehtonen et al. 2004), estima-    the periods from 1998 to 2000 and from 2008 to 2010,
tions of biomass could be also made by updating volume       respectively. The initial and final surveys are referred to
stocks from the SNFI and using BEFs. This option has         regardless of the provinces considered. The time elapsed
the advantage that stand volume can often be easily up-      between surveys ranges from 7 to 13 years depending on
dated through growth models (Shortt and Burkhart             the province. Data from the final SNFI surveys were
1996) or even by remote sensing (McRoberts and               used to develop dry weight biomass estimates, while data
Tomppo 2007).                                                from the initial surveys, together with volume growth
  According to Montero and Serrada (2013), the main          models by Aguirre et al. (2019), were used to evaluate
pine species (Pinus sylvestris L., Pinus pinea L., Pinus     model assessment capability.
halepensis Mill., Pinus nigra Arn. and Pinus pinaster          The SNFI consists of permanent plots located system-
Ait.) occupy around of 30% of the Spanish forest area as     atically at the intersections of a 1-km squared grid in
dominant species, which is more than 5 million ha,           forest areas. The plots are composed of four concentric
along with almost half a million ha of pine-pine mix-        circular subplots, in which all trees with breast-height
tures. Their distribution across the Iberian Peninsula       diameter of at least 7.5, 12.5, 22.5 and 42.5 cm are mea-
covers a wide range of climatic conditions (Alía et al.      sured in the subplots with radii of 5, 10, 15 and 25 m, re-
2009), with arid conditions being particularly prominent.    spectively. Using the appropriate expansion factor for
Thus, aridity was found to influence the maximum stand       each subplot, stand variables were calculated per species
density and productivity of these pinewoods (Aguirre         and for the total plot. For further details of the SNFI, see
et al. 2018, 2019). Furthermore, pine species were those     Alberdi et al. (2010).
most used in reforestation programs, so these species          The target species were five native pine species in the
play a fundamental role in carbon sequestration. Ac-         Spanish Iberian Peninsula: Pinus sylvestris (Ps), Pinus
cording to the Second and Third National Forest In-          pinea (Pp), Pinus halepensis (Ph), Pinus nigra (Pn) and
ventories, the five abovementioned species alone             Pinus pinaster (Pt). Plots located in the peninsular pine
account for a carbon stock of around 250 × 106 Mg C          forests were used; the criterion for selection being that
(del Río et al. 2017), of which more than half corre-        the density of non-target species should not exceed 5%
sponds to two of these forest species (P. sylvestris and     of the maximum capacity (Aguirre et al. 2018). The plots
P. pinaster).                                                used for each species were those in which the proportion
  The main objective of this study was to develop dry        of the species by area was greater than 0.1. Additionally,
weight biomass models for pine forests (monospecific         to allow the application of the results to stands where
and mixed stands) according to stand volume, exploring       the volume was updated through growth models, only
whether basic BEFs can be improved by including site         those plots in which silvicultural fellings affected less
conditions and stand development stage. We hypothe-          than 5% of the total basal area were considered, as this
sized that for a given stand volume the stand dry weight     was the criterion used for developing the existing vol-
biomass increases as site aridity decreases and that it      ume growth models (Aguirre et al. 2019).
Aguirre et al. Forest Ecosystems              (2021) 8:29                                                                                                       Page 4 of 16

  Stem volume was calculated for every tree in the plot                                   Martonne aridity index (De Martonne 1926), M, calculated
according to SNFI volume equations developed for each                                     as M = P/(Tm + 10), in mm·°C− 1. M was chosen as an aridity
province, species and stem form (Villanueva 2005). The                                    indicator because of its simplicity and recognized influence
Martin (1982) criteria were used to obtain volume                                         on volume growth (Vicente-Serrano et al. 2006; Führer et al.
growth. Dry weight biomass for different tree components                                  2011; Aguirre et al. 2019) and maximum stand density
was calculated at tree level using equations taken from                                   (Aguirre et al. 2018). Hence, M was expected to have a posi-
Ruiz-Peinado et al. (2011), who developed biomass models                                  tive influence on dry weight biomass.
for all the studied species, using diameter at breast height                                 Due to the lack of age information for SNFI plots, the
and total tree height as independent variables. Total tree                                development stage had to be estimated through specific
aboveground dry weight biomass was calculated by adding                                   indicators. Tree-size related variables are commonly
the weight of stem (stem fraction), thick branches (diam-                                 used as surrogates for stand development stage, one
eter larger than 7 cm), medium branches (diameter be-                                     such variable being the mean tree volume (vm), which
tween 2 and 7 cm) and thin branches with needles                                          could be used to correct the lack of age information.
(diameter smaller than 2 cm). Based on tree data and                                      The vm was calculated as in Eq. 1, where V is the vol-
using the appropriate expansion factors for each SNFI                                     ume of the stand in m3·ha− 1, and N is the number of the
subplot, the stand level volume and dry weight biomass                                    trees per hectare, both referred to the target species (sp).
were obtained per species and total plot.
  To estimate the aridity conditions for each plot used, the                                               V sp
                                                                                                vmsp ¼                                                                     ð1Þ
annual precipitation (P, in mm) and the mean annual                                                        N sp
temperature (Tm, in °C) were obtained from raster maps
with a one-kilometer resolution developed by Gonzalo Jimé-                                  A summary of the data used to develop the models is
nez (2010). These variables were used to obtain the                                       shown in Table 1 (note that when a target species was

Table 1 Summary of data used to develop dry weight biomass models. Note that plots where a target species, sp, is studied, other
pine species could be present
sp                          Initial SNFI survey                                                    Final SNFI survey
                            Nsp_I       NI          Vsp_I       VI          Wsp_I       fsp_I      Nsp_F       NF          Vsp_F       VF          Wsp_F        fsp_F      M
Ps              Mean        753         846         109.7       121.9       109.7       0.51       794         909         159.2       178.3       147.3        0.50       51
(# 1854)
                sd          544         560         91.6        90.8        69.1        0.07       570         588         108.5       104.1       80.6         0.06       14
                Min         14          46          3.0         17.1        5.1         0.35       14          56          5.8         26.3        8.0          0.37       23
                Max         3692        4106        747.4       747.4       520.3       1.11       4297        4311        826.8       843.2       574.5        0.93       118
Pp              Mean        337         386         51.5        59.4        66.8        0.51       348         405         76.1        88.3        92.7         0.48       24
(# 537)
                sd          357         376         38.6        39.1        40.2        0.14       369         387         49.8        50.1        50.6         0.1        5
                Min         5           20          1.7         11.8        3.6         0.18       5           31          2.0         17.1        3.8          0.23       12
                Max         3102        3197        350.4       350.4       335.4       1.65       3233        3233        406.0       406.0       392.3        1.24       45
Ph              Mean        491         516         37.3        39.5        37.4        0.52       546         579         56.9        60.3        57.6         0.48       21
(# 2039)
                sd          348         352         24.5        25.3        23.0        0.14       377         381         35.5        36.8        33.5         0.09       6
                Min         5           25          2.8         4.8         2.6         0.29       5           25          3.3         7.5         3.2          0.21       7
                Max         2465        3006        238.2       241.4       194.6       1.84       2451        2798        283.0       287.6       242.9        1.18       52
Pn              Mean        703         837         75.8        90.6        83.8        0.54       749         909         111.1       133.5       117.2        0.53       38
(# 1414)
                sd          586         604         61.8        62.5        59.6        0.09       615         629         78.9        77.2        74.1         0.07       10
                Min         10          41          1.4         17.8        2.7         0.35       10          41          2.3         22.5        4.0          0.29       20
                Max         4994        4994        522.8       522.8       451.7       1.22       4623        4623        577.4       577.4       552.4        1.65       105
Pt              Mean        532         604         94.8        103.5       71.3        0.51       550         640         149.5       163.1       108.6        0.49       33
(# 1358)
                sd          443         466         64.8        66.5        44.1        0.07       443         472         88.8        87.8        57.7         0.06       12
                Min         10          51          1.4         19.3        1.2         0.33       10          40          6.2         30.8        5.5          0.35       17
                Max         3310        3310        515.6       562.5       332.8       0.89       2886        2886        652.4       652.4       475.3        0.91       87
N, is the total number of trees per hectare while Nsp represents the number of trees of the main species; V, is the total volume and Vsp main species volume, both
in m3·ha− 1; Wsp is the main species dry weight of biomass in Mg·ha− 1; fsp, is the species stand form factor, calculated as in Eq. 5; and M is the Martonne aridity
index in mm·°C− 1. The subscript “I” refers to initial survey and “F” to final survey. Ps Pinus sylvestris, Pp P. pinea, Ph P. halepensis, Pn P. nigra, and Pt P. pinaster. The
number of plots used to develop models is shown under the name of the target species (#)
Aguirre et al. Forest Ecosystems (2021) 8:29 Page 5 of 16
studied, other pine species could be included within plots belonging to the same province, as the measure-
stands). Figure 1 summarizes the methodology that is ments in the different provinces were carried out in dif-
described in the following sections. ferent years and by different teams. b and m are other
coefficients to be estimated: if coefficient m was not sig-
Biomass estimation models by species nificant for a given species or its inclusion did not im-
Basic biomass models were developed for each species prove the Basic Model, M was no longer included in the
from SNFIF data in accordance with the structure used species model.
by Lehtonen et al. (2004) (Eq. 2) to estimate dry weight To determine how the stand development stage influ-
biomass (W) from stand volume (V) for the target spe- ences the relationships between volume and dry weight
cies. The Basic Model was modified by including the ef- biomass for each species, the mean tree volume (vm) was
fect of aridity, thus, the Martonne aridity index (M) was included in the models. This variable also multiplies the
added to the Basic Model to obtain the so-called Basic coefficient ‘ (a + ak) ’ (Eq. 4), so that if it was not signifi-
M Model (Eq. 3). As regards the model structure, fol- cant, the final model will be equivalent to the basic one.
lowing a preliminary study (not shown) it was decided
to include the logarithm of this variable to adapt the
Basic Model (Eq. 2), modifying the ‘a’ coefficient accord- vm Model : W jk ¼ ða þ ak Þ V bjk
ing to Eq. 3. ð1 þ m logðM ÞÞ
p
Basic Model : W jk ¼ ða þ ak Þ V bjk þ εjk ð2Þ 1 þ c1 vmjk1 þ εjk ð4Þ
Basic M Model : W jk ¼ ða þ ak Þ V bjk where, a, ak, b, c1, p1 and m were the coefficients to be
1 þ m log Mjk estimated and vm is the mean tree volume, all variables
þ εjk ð3Þ referring to the target species.
When fitting the biomass models some bias linked to
where, for plot j in province k, W is the dry weight the stem form was detected. Hence, the next step was to
biomass of the target species in Mg·ha− 1, V is the vol- test whether it was possible to correct the model bias by
ume of the target species in m3·ha− 1, M is the Martonne adding the shape of the trees by means of the stand form
aridity index, in mm·°C− 1; and Ɛ is the model error. The factor (f) (Eq. 5). This variable was also added to multi-
coefficient a is the fixed effect, while ak is the province ply the coefficient ‘ (a + ak) ’, thus obtaining the Total
random effect to avoid possible correlation between Model (Eq. 6).
Fig. 1 Schematic explanation about how to apply the developed model for future projections. SNFIF is the last Spanish National Forest Inventory
available, ΔT is the time elapsed between SNFIF and the projection time T, M is the Martonne aridity index, Origin is the naturalness of the stand
(plantation or natural stand), dg is the quadratic mean diameter (cm), Ho is the dominant height (m), RD is the relative stand density, p is the
proportion of basal area of the species in the stand, VGE is the volume growth efficiency, IV is the volume increment (m3·ha− 1·year− 1), N is the
number of trees per hectare, V is the volume of the stand (m3·ha− 1), vm is the mean tree volume, f is the stand form factor, W is the dry weight
biomass, and C is the weight of carbon. The subscript “F” refers to the final SNFI, the last available, while “T” refers at projection time T. The
variables with the subscript “sp” refer to the target species, variables without the subscript refer to the standAguirre et al. Forest Ecosystems (2021) 8:29 Page 6 of 16
Mean percentage error : MPE X
V ¼ 100 ep j =n ð10Þ
f ¼ ð5Þ
GH
Mean absolute percentage error : MAPE
where f is the stand form factor; V is the stand volume X
(m3·ha− 1); G is the basal area (m2·ha− 1); and H is the ¼ 100 ep j =n ð11Þ
mean height of the plot (m), all variables referring to the
target species. Root mean square percentage error : RMSPE
qffiffiffiffiffiffiffiffiffiffiffiffiffiffiffiffiffiffiffiffiffi
X
¼ 100 ep j 2 =n ð12Þ
Total Model : W jk ¼ ða þ ak Þ V bjk
ð1 þ m logðM cj and ep j ¼ ðW j −W
where e j ¼ W j −W cj Þ=W j ; W
cj is
ÞÞ
p1 the estimated values of dry weight biomass for each plot
1 þ c1 vmjk
j, Wj the corresponding observed values for each plot j,
p
1 þ c2 f jk2 þ εjk: ð6Þ both referring to the target species; and n is the number
of plots where the species was present.
where a, ak, b, c1, c2, p1, p2 and m were the coefficients
to be estimated, f is the form factor of the stand and vm Carbon predictions at national level
is the mean tree volume, all variables referring to the The models developed (Eqs. 4 to 6 and Eq. 8) provide
target species. estimates of dry weight biomass per species, both in
The model structure was analysed in a preliminary monospecific and mixed stands, which could be trans-
study where each coefficient in the allometric basic formed to carbon stock, considering the specific data of
model was parametrized in function of M, vm and f, carbon content in wood given by Ibáñez et al. (2002) for
considering linear and non-linear expansions. The final the five studied pine species (Table 2).
model structure (Eq. 6) was selected because its better To evaluate the prediction capacity of the fitted
goodness of fit in terms of AIC, showing also the lowest models at time T when no field data is available, a simu-
residuals. lation from the initial SNFI survey (SNFII) was per-
All models (Eqs. 2 to 4 and Eq. 6) were fitted using formed at a national scale, assuming that this was the
non-linear models with the nlme package (Pinheiro et al. last available survey.
2017) from the R software (Team RC 2014). The coeffi- The first step was to obtain the predicted biomass at
cients were only included if they were statistically signifi- time T, where all variables are supposed to be unknown
cant (p-value < 0.05) and their inclusion improved the for each species, from the four biomass models devel-
model in terms of Akaike Information Criterion (AIC) oped (Eqs. 2 to 4 and Eq. 6). To apply these models, it
(Akaike 1974). Furthermore, conditional and marginal was necessary to obtain the values of all independent
R2 (Cox and Snell 1989; Magee 1990; Nagelkerke 1991) variables, updated to year T. This procedure was done as
were calculated as a goodness-of-fit statistic using follow:
MuMIn library (Barton 2020). Once selected the model
with the lowest AIC, and highest marginal and condi- – Using the annual growth volume models by Aguirre
tional R2, and to check that the improvement achieved is et al. (2019), the volume V^ T was estimated from the
significant, anova tests were made. SNFII volume. These authors developed a volume
growth efficiency (VGE) model for the five pine
Evaluation of biomass estimation models species considered in this study. Volume growth
In order to evaluate the goodness of fit, an analysis of efficiency is a measure of stand volume growth
the four developed models (Eqs. 2 to 4 and Eq. 6) was taking into account the species proportions by area
performed. The mean errors (Eqs. 7 to 9), estimated in
Mg·ha− 1, as well as mean percentage errors (Eqs. 10 to Table 2 Carbon content of wood for the studied species
12) in % were calculated for each model of each species. (Ibáñez et al. 2002)
Species Carbon content (%)
X Pinus sylvestris 50.9
Mean error : ME ¼ e j =n ð7Þ
Pinus pinea 50.8
X
Mean absolute error : MAE ¼ e j =n ð8Þ Pinus halepensis 49.9
qffiffiffiffiffiffiffiffiffiffiffiffiffiffiffiffiffiffi
X ffi Pinus nigra 50.9
Root mean square error RMSE ¼ e j 2 =n ð9Þ Pinus pinaster 51.1Aguirre et al. Forest Ecosystems (2021) 8:29 Page 7 of 16
(p), which is necessary when studying mixed stands – Origin, makes reference to the naturalness of the
(Condés et al. 2013), as VGE = IV/p. In monospecific stand. It was a dummy variable, with value 1 when
stands VGE = IV. So, with these estimations (IV) and the stand was a plantation and 0 when the stand
the number of years elapsed since initial SNFI (ΔT), comes from natural regeneration.
the volume at time T was estimated as V ^T ¼ VI – dgsp, is the quadratic mean diameter of the target
þIV ΔT . species.
– The mean tree volume vm c T was estimated assuming – Ho, is the dominant height of the stand.
that there are no extractions or high mortality in – RD, is the relative stand density (Aguirre et al. 2018,
plots during ΔT, that is, assuming the number of Eq. S1), and RDsp is only considering the target
trees per hectare remains constant (N ^ T ¼ N I ), so species.
c ^ ^
that, vmT ¼ V T =N T . – psp, is the proportion of the species.
– Furthermore, it was assumed that the stand form – M, is the Martonne aridity index.
factor does not vary significantly in the time elapsed
between inventories, so this variable was estimated With these variables it is possible to estimate VGEsp
for each pine species considered, and using its propor-
as ^f T ¼ f I .
tion, also volume growth of each species (IVsp) can be
estimated. Note that in monospecific stands IVsp is equal
As the predictions were made for the same plots used to
to IV total.
develop the growth models by Aguirre et al. (2019), bio-
Having the IVsp, the time elapsed since T and SNFIF
mass models can be applied directly, without the need to
and the volume of the target species at SNFIF (VspF) the
perform calibrations, since the fixed and random effects ^ sp T ).
volume at T time is estimated (V
are known. Hence, by applying the different models (Eqs.
Obtained V ^ sp T , the biomass models can be applied by
2 to 4 and Eq. 6) and using the independent variables de-
c T and ^f T ), we obtain the biomass esti-
^ T ; vm
scribed ( V using some assumptions:
mated at time T (W ^ T ), which is assumed to be unknown.
– The number of trees per hectare remains constant
Secondly, using the carbon percentages contained in ^ sp T ¼ N spF ).
at equal to the observed in SNFIF (N
the biomass weight shown in Table 2, the carbon weight
^ T sp – So, the mean tree volume at time T can be
estimated for each species was obtained at time T (C
c sp T ¼ V
estimated as: vm ^ sp T =N
^ sp T .
). Considering all species present in each plot, the total – The stand form factor also is considered constant at
P
carbon weight was estimated at time T (C ^T ¼ C ^ T sp ). equal to the observed in SNFIF ðbf sp T ¼ f spF Þ.
Finally, in order to evaluate the predictions, time T
was set to be the same as the final SNFI (SNFIF), there- Using these estimated variables, biomass models can
fore the observed values were already known and could be used to obtain the estimation of dry weight biomass
be compared with the predictions obtained. Thus, the ^ sp T ). The appropriate
of the target species at time T ( W
predicted carbon ( C^ T ) was compared with the observed percentage of the carbon content per species (Ibáñez
carbon weight for the final SNFI (CF), obtained by multi- et al. 2002) allows to transform that value in the esti-
plying the observed dry weight biomass (as explained in mated carbon of the target species at time T (C ^ sp T ). For
the data section) and the carbon content (Table 2) in the mixed stands, the estimated carbon of the stand ( C ^ ) is
final survey (SNFIF). The mean errors were then calcu- ^
the sum of the different C sp T .
lated from Eqs. 9 to 14.
Results
How to estimate carbon stocks at national level when no Biomass estimation models for each species
data is available Table 3 shows the coefficient estimates together with
In this section, it is explained how to apply the devel- the standard errors and goodness of fit for the four
oped models for predicting the carbon stock at time T models developed for dry weight biomass of the five spe-
required, when no data is available. For this, it is neces- cies studied (Eqs. 2 to 4 and Eq. 6). When the Basic
sary to use some variables of the last Spanish National Model (Eq.2) was compared with the Basic M Model
Forest Inventory available (SNFIF), ΔT years before T. (Eq. 3) it was observed that aridity (M) was significant in
The first step is to estimate the volume growth effi- three of the five species and in all three cases it resulted
ciency of the target species (VGEsp), which can be esti- in an improvement in the Basic Model, both in terms of
mated using Aguirre et al. (2019) models. These models AIC and marginal and conditional R2. The species for
estimate VGE as function on: which M was not significant in the models were Pt andTable 3 Coefficients estimated (a, b, m, c1, p1, c2, p2) and standard error (in brackets) for models from Eqs. 2 to 4 and Eq. 6, together the standard deviation of the random
variable (StdRnd), Akaike Information Criterion (AIC) and marginal and conditional R2 (M.R2 and C.R2)
Aguirre et al. Forest Ecosystems
sp Model a b m c1 p1 c2 p2 StdRnd AIC M.R2 C.R2
Ps Basic 2.7422 (0.0645) 0.7953 (0.0040) 0.1441 15,309 0.9609 0.9654
Basic M 2.1193 (0.1109) 0.7887 (0.0041) 0.0868 (0.0178) 0.1179 15,285 0.9617 0.9659
vm 1.0769 (0.0612) 0.8482 (0.0038) 0.1738 (0.0225) 0.0384 (0.0060) −0.8141 (0.0471) 0.0446 14,414 0.9758 0.9787
(2021) 8:29
Total 0.4692 (0.0302) 0.8460 (0.0038) 0.1980 (0.0253) 0.0536 (0.0087) −0.7265 (0.0467) −0.1884 (0.0341) 0.0192 14,396 0.9761 0.9789
Pp Basic 2.4602 (0.1064) 0.8430 (0.0086) 0.1564 4184 0.9348 0.9454
Basic M 2.4602 (0.1064) 0.8430 (0.0086) 0.1564 4184 0.9348 0.9454
vm 1.0857 (0.0514) 0.8575 (0.0087) −0.0868 (0.0130) 0.0808 4155 0.9358 0.9484
Total 0.2988 (0.0122) 0.8762 (0.0061) −0.1967 (0.0087) −1.0004 (0.0330) 0.0156 3769 0.9648 0.9750
Ph Basic 1.2790 (0.0299) 0.9466 (0.0042) 0.0900 13,158 0.9495 0.9671
Basic M 0.9246 (0.0472) 0.9365 (0.0043) 0.1429 (0.0233) 0.0685 13,104 0.9495 0.9680
vm 1.0488 (0.0427) 0.9258 (0.0038) 0.0591 (0.0141) 0.4144 (0.0236) 0.5947 (0.0613) 0.0843 12,554 0.9604 0.9756
Total 1.6377 (0.0570) 0.9132 (0.0032) 0.0547 (0.0117) 0.1571 (0.0149) 0.8163 (0.1005) −0.5534 (0.0143) 0.0852 11,887 0.9784 0.9824
Pn Basic 1.8320 (0.0415) 0.8905 (0.0039) 0.0970 10,751 0.9762 0.9787
Basic M 2.0679 (0.0787) 0.8914 (0.0039) −0.0326 (0.0079) 0.1078 10,735 0.9764 0.9790
vm 1.0489 (0.0330) 0.9422 (0.0024) 0.0275 (0.0072) 0.0766 (0.0094) −0.5930 (0.0312) 0.0487 9133 0.9903 0.9932
Total 0.4478 (0.0162) 0.9363 (0.0024) 0.0395 (0.0076) 0.1282 (0.0173) −0.4745 (0.0301) −0.2534 (0.0214) 0.0178 9027 0.9911 0.9937
Pt Basic 1.2275 (0.0257) 0.8997 (0.0037) 0.0541 9360 0.9793 0.9828
Basic M 1.2275 (0.0257) 0.8997 (0.0037) 0.0541 9360 0.9793 0.9828
vm 1.2275 (0.0257) 0.8997 (0.0037) 0.0541 9360 0.9793 0.9828
Total 0.5757 (0.0180) 0.9009 (0.0040) 0.0162 (0.0066) 0.1445 (0.0415) 0.0255 9354 0.9800 0.9829
sp, are the species analyzed: Ps Pinus sylvestris, Pp Pinus pinea, Ph Pinus halepensis, Pn Pinus nigra, and Pt Pinus pinaster. Names of models Basic, Basic M, vm and Total correspond to Eqs. 2, 3, 4 and 6 respectively
Page 8 of 16Aguirre et al. Forest Ecosystems (2021) 8:29 Page 9 of 16 Pp. Among the species for which M was significant, Ps although for Ph and Pp all the fitted models overesti- and Ph showed the greatest increase in conditional and mated the biomass, except the Total Model for Pp. In marginal R2, while a slightly negative effect was only de- addition, Pn and Pp were the species for which the tected in the case of Pn (Table 3). greatest reduction in RMSE was observed, comparing The estimates obtained for the coefficients c1 and p1 the Total Model and Basic Model (greater than 4.5%), in the models that include vm indicate the high import- while this reduction was the lowest for Pt (around ance of this variable for estimating biomass weight. 0.06%). Nevertheless, its influence was less in the case of Pt, as Having selected the Total Model as the best model to reflected by its low p1 value (Fig. 2c, Table 3). The coef- estimate the dry weight biomass for all species, the influ- ficients can be significant either as exponents or by ence of each independent variable was analyzed. In Fig. 2, multiplying the variables, or in both ways. the variation of dry weight biomass with each variable was The bias observed when fitting the models was cor- presented, assuming the rest of the variables not repre- rected by including the stand form factor f. When the sented on the axis remain constant. Figure 2a shows a Total Model and vm Model were compared, the bias clear positive relationship between dry weight biomass correction was more clearly observed in the Ph model, and stand volume, with Pp being the species producing while for Ps and Pt the inclusion of f only had a slight ef- the highest stand biomass for a given volume, although it fect (Table 3). was very similar to Ph and Pn. If stand volume (V) is con- When the estimation errors were analyzed using the sidered constant, it is possible to analyze the variation in different models (Table 4) it was observed that the bias W with aridity (Fig. 2b), observing that for all species was always less than 0.2 Mg·ha− 1, which in relative terms where M was included in the model (Ps, Ph and Pn) the is equivalent to less than 3%. In general, the models relationship was positive, that is, the higher the M value overestimated the biomass weight (negative ME), (less aridity), the higher the W value for a given V. Fig. 2 The selected model (Total Model), showing the dry weight biomass estimations for the target species (W, in Mg·ha− 1) according to: a volume of the stand for the target species (V, in m3·ha− 1); b Martonne aridity index (M, in mm·°C− 1); c mean tree volume (vm, in m3 per tree); and d stand form factor (f). The variable represented in each figure on the x axis, ranges from 1% to 99% of its distribution in the data used, while the rest of the variables remain constant and equal to: V = 150 m3·ha− 1; M = 30 mm·°C− 1; f = 0.5; and vm = 0.5 m3 per tree. Species as in Table 3
Aguirre et al. Forest Ecosystems          (2021) 8:29                                                                            Page 10 of 16

Table 4 Model errors calculated through Eqs. 7 to 12                              decisive for Ps and Pn, while it was especially important
sp    Model       ME         MAE       RMSE       MPE       MAPE       RMSPE      for Pp and Ph.
Ps    Basic       −0.026     11.280    14.592     −2.903    10.641     15.843
      Basic M     −0.010     11.183    14.477     −2.847    10.583     15.774
                                                                                  Biomass expansion factors
                                                                                  According to the fitted models, the BEF, i.e. stand bio-
      vm          −0.039     8.711     11.444     −1.930    7.935      11.626
                                                                                  mass weight/stand volume, is not constant but rather
      Total       −0.046     8.679     11.384     −1.955    7.930      11.631     decreases as the stand volume increases. Figure 3 repre-
Pp    Basic       0.198      7.950     11.198     −2.173    10.916     15.593     sents the species BEF variation within the inter-
      Basic M     0.198      7.950     11.198     −2.173    10.916     15.593     percentile 5%–95% range of the species stand volume in
      vm          0.199      7.468     10.794     −1.894    10.135     14.625     monospecific stands for the mean and the extreme
      Total       −0.013     5.629     7.520      −1.919    7.695      11.066
                                                                                  values of each of the independent variables in the Total
                                                                                  Model. For all species, the estimated BEF values gener-
Ph    Basic       0.064      3.899     5.922      −0.640    7.244      10.206
                                                                                  ally varied between 0.5 and 1.5 Mg·m− 3, and the lowest
      Basic M     0.077      3.845     5.836      −0.517    7.208      10.118     estimations were found for Pt, for which the BEF values
      vm          0.095      3.609     5.082      −0.383    7.182      9.865      were almost constant and around to 0.75 Mg·m− 3. In
      Total       0.059      3.246     4.327      −0.374    6.456      8.388      contrast, the species for which the highest BEF was ob-
Pn    Basic       −0.166     7.564     10.430     −2.108    7.964      10.803     tained was Pp, when f or vm had lower values. BEF esti-
      Basic M     −0.173     7.511     10.364     −2.108    7.892      10.670
                                                                                  mations for this species could reach values of more than
                                                                                  1.5 Mg·m− 3 for low stand volume.
      vm          −0.037     3.956     5.820      −0.783    4.249      6.254
                                                                                    Figure 3 shows that the BEF of Pt was always lower
      Total       −0.078     3.867     5.615      −0.949    4.224      6.110      than 0.9 and was not influenced by M and hardly af-
Pt    Basic       −0.018     4.993     7.240      −1.002    5.244      7.278      fected by vm or f. The BEF values presented little vari-
      Basic M     −0.018     4.993     7.240      −1.002    5.244      7.278      ation in the M range distribution for any of the pine
      vm          −0.018     4.993     7.240      −1.002    5.244      7.278      species studied, despite being a statistically significant
      Total       −0.012     4.988     7.210      −0.965    5.224      7.219
                                                                                  variable. However, it can be seen in Fig. 3 that Ps was
                                                                                  the species most affected by aridity. In contrast, the BEF
sp, species as in Table 3. Model, names of models, Basic, Basic M, vm and Total
correspond to Eqs. 4, 5, 6 and 8 respectively. ME mean error (Mg·ha− 1), MAE      variation for different vm values was evident (Fig. 3), be-
mean absolute error (Mg·ha− 1), RMSE Root mean square error (Mg·ha− 1), MPE       ing the variable that produced the most change in BEFs
mean percentage error (%), MAPE mean absolute percentage error (%), RMSE
Root mean square percentage error (%)                                             for Ps and Pn, although it also affected Pp. Highly vari-
                                                                                  able BEFs values can be observed for Pp and Ph within
Furthermore, the effect of aridity on this biomass-volume                         the f range distribution of the species, while for Ps and
relationship varied according to the species, with Ps being                       Pt this relationship was practically insignificant. If the
the species for which this influence was the greatest (Fig.                       different species are compared, Pn shows more constant
2b, Table 3). Analyzing the dry weight biomass variation                          BEF values than the other species, regardless of stand
according to vm (Fig. 2c), it was observed that the ten-                          volume.
dency of the relationship between W and vm was similar
for Pp, Pn and Ps, that is, the higher the mean tree vol-                         Carbon predictions at national level
ume, the lower the W estimated for a given V. An increase                         The results confirmed that the Total Model was also
in vm, for a constant V, indicates that the stand is com-                         that which gave the lowest bias when carbon predictions
posed of a smaller number of larger trees whereas a de-                           were update to time T in the pine stands across peninsu-
crease in vm indicates that the same stand volume                                 lar Spain (Fig. 4). This model allowed carbon estimates
comprising a greater number of smaller trees. Figure 2c                           with lower errors, both in absolute and relative terms,
shows that the vm effect is more evident when trees are                           than the rest of the models, despite all the assumptions
smaller, while the relationship tends to be more constant                         described, that is, constant values for both the number
as the size of trees increases. Note that for Pt and Ph, the                      of trees per hectare and stand form factor in the elapsed
vm effect was opposite to that for the other studied spe-                         interval considered.
cies, that is, positive. Figure 2c shows this effect clearly for                    In Fig. 4, it can be seen that all models produced over-
Ph, despite being the species with the lowest range of vm                         estimations of carbon stocks, except the Total Model,
variation, while for Pt, the influence of vm was only slight,                     which produced the lowest bias, although it slightly
despite being one of the species with the highest range of                        underestimated carbon stock. Figure 4 also shows that
variation of this variable. As regards the stand form factor                      the inclusion of the f variable scarcely modified the er-
(f), in general, W decreased as f approached the unit value                       rors (MAE, RMSE, MAPE and RMSPE), although the
(Fig. 2d), although in the case of Pt there is a very slight                      bias decreased significantly. When the Total Model was
positive effect of f. The influence of f on W was not                             used, the RMSE obtained when making carbon stock
Aguirre et al. Forest Ecosystems (2021) 8:29 Page 11 of 16 Fig. 3 Variation of biomass expansion factor (BEF), defined as dry weight biomass (W, in Mg·ha− 1) estimated from the Total Model, divided by stand volume (V, in m3·ha− 1), for different values of: Martonne aridity index (M, in mm·°C− 1); stand form factor (f); and mean tree volume (vm, in m3 per tree). The lines are drawn within the inter-percentile 5%–95% range of stand volume distribution. Solid lines represent the mean value of the variable for each species and dashed and dotted lines represent the 5% percentiles, the mean 95% of the variable distribution for each species
Aguirre et al. Forest Ecosystems     (2021) 8:29                                                                                     Page 12 of 16

 Fig. 4 Mean errors for carbon estimates at plot level for the studied pine species throughout peninsular Spain according the four studied models.
 ME, mean error (in Mg·ha− 1 of C); MAE, mean absolute error (in Mg·ha− 1 of C); RMSE, Root mean square error (in Mg·ha− 1 of C); MPE, mean
 percentage error (in %); MAPE, mean absolute percentage error (in %); RMSE, Root mean square percentage error (in %)

predictions for the studied pine species in the Iberian                    Basic Model yields good fit statistics. This suggests that,
Peninsula was less than 20%, which is slightly higher                      to a certain extent, the stand volume should absorb the
than 9 Mg·ha− 1 of C. This Total Model resulted in an                      effects of other variables, such as the stand age or stand
important reduction in the bias, reaching around 2%.                       density, as well as environmental conditions (Fang et al.
                                                                           2001; Guo et al. 2010; Tang et al. 2016). Therefore, in the
Discussion                                                                 development of the different models, the structure of the
The use of BEFs to estimate biomass at stand level pro-                    Basic Model was maintained, expanding its coefficients so
vides an interesting alternative for predicting biomass                    that if the specific coefficients corresponding to the effects of
and carbon stocks in forest systems since stand volume                     M, vm and f were not significant, the Basic Model is
(V) is the only variable required. However, the use of                     returned. However, the models improved for all species with
traditional BEFs, mainly as constant values and generally                  the inclusion of the other variables (Tables 3 and 4), reflect-
obtained for stands under specific conditions, can result                  ing the fact that stands with the same volume can have dif-
in biased biomass estimates if they are applied under dif-                 ferent structures leading to different biomass. This is
ferent conditions (Di Cosmo et al. 2016). These biases                     observed in the improvement achieved with the Total
can have a significant impact on estimated carbon in the                   Model, both with regard to the goodness of fit of the model
tree layer when large-scale estimates are made, as is the                  and the errors (Tables 3 and 4), indicating less biased and
case of national-scale predictions (Zhou et al. 2016). In                  more accurate estimates when the stand characteristics and
this study, stand biomass models have been developed                       the aridity conditions (M) are included.
that include other easily obtained variables as independ-                    The positive relationship found between the aridity
ent variables, in addition to the stand volume. The fitted                 index M and the dry biomass W for a given stand vol-
models allow us to update the carbon stocks in pine for-                   ume supports the findings presented by Aguirre et al.
ests across mainland Spain for the five species studied                    (2019), who reported higher productions in less arid
using SNFI data. The strong relationship between stand                     conditions. This positive relationship between M and W
biomass and stand volume (Fang et al. 1998) implies that                   suggests greater crown development and higher crown
the Basic Model can provide a good first estimate of bio-                  biomass for the same volume in less arid conditions.
mass. This is confirmed by the results obtained as the                     However, it is important to highlight that the individual
Aguirre et al. Forest Ecosystems (2021) 8:29 Page 13 of 16 tree biomass equations used did not consider this type The results indicate an improvement in the models of within-tree variation in the distribution of biomass with the inclusion of the stand form factor, although the with site conditions (Ruiz-Peinado et al. 2011). Hence, magnitude of the effect caused by this variable, as well the observed effect of M must be associated with as the improvement in the models, were greater for Pp changes in the stand structure. For example, the variation and Ph than for the rest of the species (Fig. 2d, Table 3). in vm according to the aridity conditions, that is, the stand To estimate the stand volume, diameter at breast height, V is distributed over more trees of smaller size or fewer total height of the tree and its shape are used, according larger trees according to the aridity of the site, since the to species and province available models (Villanueva proportion of crown biomass with respect to total biomass 2005). However, to estimate stand biomass, the equa- varies with tree size (Wirth et al. 2004; Menéndez-Migué- tions applied for the different tree components only de- lez et al. 2021). This would entail an interaction between pend on the species, the diameter at breast height and the effect of M and the effect of vm in the models, as the total height of the tree, without considering the reflected in the case of Pn, which varies from negative in shape of the tree (Ruiz-Peinado et al. 2011). This differ- the basic model with M to positive for the vm Model and ence explains the advisability of considering the stand Total Model. However, in general, M is not the most im- form factor to avoid biases in the estimates, although it portant variable to explain the variation in W (Fig. 2b), as also highlights the need to study the dependence of the can also be observed in the small BEF variation for the biomass equations on the different components of the studied species in relation with M (Fig. 3). tree according to their shape. In turn, this shape depends The variable vm, as surrogate of the stand develop- on genetic factors, environmental conditions, and stand ment stage, has a different influence on the models for structure (Cameron and Watson 1999; Brüchert and Ph and Pt than for the rest of the species (Fig. 2c). The Gardiner 2006; Lines et al. 2012). observed pattern for Ps, Pp and Pn indicates that the re- The models obtained underline the importance of con- lationship between W and V, or the BEF, decreases with sidering the environmental conditions and the stand vm, i.e. as the stage of stand development increases, as structure (size and shape of trees) when expanding the has been observed previously in other studies (Lehtonen volume of the stand to biomass. If constant BEF values et al. 2004; Teobaldelli et al. 2009). This behavior may are used for all kinds of conditions, biomass may be be caused by differences in the relationship between the underestimated in younger and less productive stands, components of the trees. For example, Schepaschenko while for more mature and/or productive stands it may et al. (2018) observed an important decreasing effect of be overestimated (Fang et al. 1998; Goodale et al. 2002; age on the branch and foliar biomass factors. Similarly, Yu et al. 2014). These authors also highlight the need to Menéndez-Miguélez et al. (2021) analyzed the patterns further our understanding of the influence of these fac- of crown biomass proportion with respect to total tors on the individual tree biomass equations. In this re- aboveground biomass of the tree as its size develops for gard, Forrester et al. (2017) found that the intraspecific the main forest tree species in Spain. These authors variation in tree biomass depends on the climatic condi- found that in the cases of Ps and Pp, this pattern was de- tions and on the age and characteristics of the stand, creasing; while for Pn and Pt it was constant (the study such as basal area or density. The components that did not include Ph). These within-tree biomass distribu- mostly depended on these variables were leaf and branch tions would validate the patterns found in the Ps, Pp and Pt biomass, which suggests that it would be advantageous models, but not the Pn model. However, Ph presents a to- to have more precise equations for these tree compo- tally different BEF behavior with the variation in vm. Analyz- nents, which would therefore modify the stand biomass ing the modular values of the different biomass fractions for estimates. However, the inclusion of other variables in this species presented in Montero et al. (2005), it can be ob- the tree biomass models in order to improve the accur- served that the proportion of crown biomass in this species acy would require a large number of destructive samples increases slightly with the size of the tree, which could ex- from trees under different conditions (site conditions, plain the opposite pattern observed in this species. However, stand characteristics, age...), which would be difficult to this difference could also be due to the equations used to cal- obtain in most cases. culate the biomass (Ruiz-Peinado et al. 2011), since the max- The suitability of SNFI data to develop models has imum normal diameter of the biomass sample used in that been questioned by several authors (Álvarez-González study was 44 cm, whereas for the Iberian Peninsula as a et al. 2014; McCullagh et al. 2017). One of the main dis- whole it was as much as 97 cm (Villanueva 2005). Sche- advantages is the lack of control about environmental paschenko et al. (2018) also reported that the number of conditions, stand age or history of the stand (Vilà et al. branches in low productive, sparse forest is greater than in 2013; Condés et al. 2018; Pretzsch et al. 2019). Another high productive, dense forests, which may be a cause for the shortcoming is the lack of differentiation of pine subspe- increasing tendency of W in Ph in relation to vm. cies in the SNFI, like the two subspecies of Pn, salzmanii
Aguirre et al. Forest Ecosystems   (2021) 8:29                                                                                      Page 14 of 16

and nigra, or those of Pt, atlantica and mesogeensis,
which could lead to confusing results such as those ob-
                                                               Abbreviations
tained for Pt, which was the only species for which the        NFI: National Forest Inventory; SNFI: Spanish National Forest Inventory;
Basic Model improved with the inclusion of both vari-          BEFs: Biomass expansion factors; Ps: Pinus sylvestris; Pp: Pinus pinea; Ph: Pinus
ables together, vm and f. This could suggest that the re-      halepensis; Pn: Pinus nigra; Pt: Pinus pinaster; M: Martonne aridity index;
                                                               vm: Mean tree volume; W: Dry weight biomass; f: Stand form factor;
lationship between volume and shape of trees differs           C: Carbon weight
according to the subspecies considered.
  Through the models developed (Fig. 4), it is possible        In the subscripts
to provide more precise responses to the international         sp: Referred to the target species; T: Any time when no field data is available;
                                                               I: Initial NFI survey; F: Final NFI survey
requirements in terms of biomass and carbon stocks.
Since the most recent SNFI, it has become possible to          Authors’ contributions
update the information at a required time. For this pur-       Condés, del Río, and Ruiz-Peinado developed the idea, Aguirre and Condés
                                                               developed the models, Aguirre programmed the models, and all authors
pose, the least favourable situation was assumed, that is,
                                                               wrote the document. All authors critically participated in internal review
that the only information available was that obtained          rounds, read the final manuscript, and approved it.
from the most recent SNFI. However, the main limita-
tion of the models developed is that they are only valid       Funding
                                                               This research received no specific grant from any funding agency in the
for a short time period, when the assumptions made can         public, commercial, or not-for-profit sectors.
be assumed and when both climatic conditions and
stand management do not vary (Peng 2000; Condés and            Availability of data and materials
McRoberts 2017). If the elapsed time would be too long         The raw datasets used and/or analyzed during the current study are
                                                               available from Ministerio para la Transición Ecológica y el Reto Demográfico
for assuming that there is not mortality and that the          of the Government of Spain (https://www.mapa.gob.es/es/desarrollo-rural/
stand form factor does not vary, the basic model could         temas/politica-forestal/inventario-cartografia/inventario-forestal-nacional/
be applied. Furthermore, to achieve more precise up-           default.aspx).

dates, natural deaths and silvicultural fellings must be       Declarations
considered using scenario analysis or by estimating of
past fellings (Tomter et al. 2016). Besides, a proper valid-   Ethics approval and consent to participate
                                                               Not applicable.
ation with independent data was not possible due to lack
of such data. When the SNFI-4 is finished for all Spanish      Consent for publication
provinces, it would be interesting to validate the models      Not applicable.
developed.
                                                               Competing interests
                                                               The authors declare that they have no competing interests.
Conclusions
The results reveal the importance of considering both,         Author details
                                                               1
                                                                Department of Natural Systems and Resources, School of Forest Engineering
site conditions and stand development stage when devel-        and Natural Resources, Universidad Politécnica de Madrid, Madrid, Spain.
oping stand biomass models. The inclusion of site condi-       2
                                                                INIA, Forest Research Center, Department of Forest Dynamics and
tions in the models for Ps, Ph and Pn, indicate that           Management, Madrid, Spain. 3iuFOR, Sustainable Forest Management
                                                               Research Institute, University of Valladolid and INIA, Valladolid, Spain.
aridity conditions modulate the relationship between the
dry weight biomass of a stand (W) and its volume (V),          Received: 16 December 2020 Accepted: 20 April 2021
while for Pp and Pt this relationship was not influenced.
As hypothesized, it was observed that for a lower aridity,
                                                               References
the biomass weight and therefore that of carbon are            Achat DL, Fortin M, Landmann G, Ringeval B, Augusto L (2015) Forest soil carbon
higher for the same stand volume.                                  is threatened by intensive biomass harvesting. Sci Rep 5(1):15991. https://doi.
   Besides, the results reveal the importance of consid-           org/10.1038/srep15991
                                                               Aguirre A, del Río M, Condés S (2018) Intra- and inter-specific variation of the
ering both size and form of trees for estimating dry               maximum size-density relationship along an aridity gradient in Iberian
weight biomass, and therefore to estimate carbon                   pinewoods. Forest Ecol Manag 411:90–100. https://doi.org/10.1016/j.foreco.2
stock. As expected, the relationship between dry                   018.01.017
                                                               Aguirre A, del Río M, Condés S (2019) Productivity estimations for monospecific
weight biomass of the stand and its volume decreases               and mixed pine forests along the Iberian Peninsula aridity gradient. Forests
when the stand development stage (vm) increases, ex-               10(5):430. https://doi.org/10.3390/f10050430
cept for Ph whose behavior is the opposite, and Pt             Akaike H (1974) A new look at the statistical model identification. In: Parzen E,
                                                                   Tanabe K, Kitagawa G (eds) Selected papers of Hirotugu Akaike. Springer
which is hardly affected by vm. However, the inclu-                series in statistics (perspectives in statistics). Springer, New York, pp 215–222.
sion of this variable reduces the ME, MAE and RMSE                 https://doi.org/10.1007/978-1-4612-1694-0_16
for all the studied species, which indicates the im-           Alberdi I (2015) Metodología para la estimación de indicadores armonizados a
                                                                   partir de los inventarios forestales nacionales europeos con especial énfasis
portance of its consideration in the dry weight bio-               en la biodiversidad forestal. (Tesis Doctoral, Universidad Politécnica de
mass estimation.                                                   Madrid). Madrid, España
You can also read