Fusarium Consortium Populations Associated with Asparagus Crop in Spain and Their Role on Field Decline Syndrome - MDPI
←
→
Page content transcription
If your browser does not render page correctly, please read the page content below
Journal of
           Fungi
Article
Fusarium Consortium Populations Associated with
Asparagus Crop in Spain and Their Role on Field
Decline Syndrome
Alexandri María Brizuela 1 , Eduardo De la Lastra 2 , José Ignacio Marín-Guirao 3 ,
Laura Gálvez 1 , Miguel de Cara-García 3 , Nieves Capote 2, * and Daniel Palmero 1, *
 1    Department of Agricultural Production, Escuela Técnica Superior de Ingeniería Agronómica,
      Alimentaria y de Biosistemas, Universidad Politécnica de Madrid, 28040 Madrid, Spain;
      alexandri.brizuela@alumnos.upm.es (A.M.B.); laura.galvez@upm.es (L.G.)
 2    Institute for Research and Training in Agriculture and Fisheries, IFAPA Las Torres. Ctra. Sevilla,
      Cazalla, Km. 12,2, Alcalá del Río, 41200 Sevilla, Spain; eduardo.lastra@juntadeandalucia.es
 3    Institute for Research and Training in Agriculture and Fisheries, IFAPA La Mojonera, Camino San Nicolás, 1.
      La Mojonera, 04745 Almería, Spain; josei.marin@juntadeandalucia.es (J.I.M.-G.);
      franciscom.cara@juntadeandalucia.es (M.d.C.-G.)
 *    Correspondence: marian.capote@juntadeandalucia.es (N.C.); daniel.palmero@upm.es (D.P.)

 Academic Editors: José Díaz and Javier Veloso

 Received: 14 October 2020; Accepted: 29 November 2020; Published: 4 December 2020

 Abstract: Asparagus Decline Syndrome (ADS) is one of the main phytosanitary problems of asparagus
 crop worldwide. Diseased plants and soil samples from 41 fields from three main production areas of
 Spain were surveyed. Eight Fusarium species belonging to seven species complexes were identified in
 soils: F. oxysporum, F. proliferatum, F. redolens, F. solani sensu stricto, F. equiseti, F. culmorum, F. compactum
 and F. acuminatum. Fusarium oxysporum was the most prevalent species. Statistical correlation
 (R2 = 88%) was established between F. oxysporum inoculum density and the average temperature
 of the warmest month. A relationship was also established between three crop factors (average
 temperature, crop age and F. oxysporum inoculum density) and field disease indices. Significant
 differences were observed between the distribution of F. oxysporum propagules in white and green
 asparagus fields. Thirteen Fusarium species belonging to seven species complexes were identified
 from roots of diseased plants, being F. oxysporum the most prevalent. F. proliferatum, F. oxysporum
 and F. redolens showed pathogenicity to asparagus and were the main species associated to ADS.
 Fusarium oxysporum was the species with the highest genetic diversity displaying 14 sequence-based
 haplotypes with no geographic differentiation. This work contributes to understanding the Fusarium
 complex associated to ADS for developing accurate integrated disease management strategies.

 Keywords: Asparagus Decline Syndrome (ADS); F. oxysporum f. sp. asparagi; F. proliferatum; F. redolens;
 field disease index; pathogenicity; genetic diversity

1. Introduction
     Asparagus (Asparagus officinalis L.) is one of the most widely distributed open field horticultural
crops in the European Union. With more than 14,688 ha dedicated to the crop and production of
68,403 t, Spain is the fifth largest producer in the world and the second largest in Europe after Germany,
both among the five biggest world producers [1]. Exports are around 24,701 t with a total value of
70.4 million euros [2]. However, the crop has experienced a substantial yield decrease over the last few
seasons due to fungal diseases.
     Asparagus Decline Syndrome (ADS) is one of the main phytosanitary problems of asparagus
crop worldwide [3]. It is characterized by a gradual loss of vigor which can even lead to the death of

J. Fungi 2020, 6, 336; doi:10.3390/jof6040336                                            www.mdpi.com/journal/jof
J. Fungi 2020, 6, 336                                                                                2 of 23

affected plants. The symptoms associated with the disease are variable and can be observed in the
different phases of the crop, from the seedlings and small crowns used in the plantation to the adult
plants in full production. In seedling stage, the main symptomatology is root rot that, in severe cases,
can cause the death of seedlings [4]. In young crowns, reddish coloration and rots in the secondary
root system are observed that begin from the tips and end with the complete disappearance of the
secondary root [5]. Storage roots take longer to express symptoms, and brown spots appear on them,
which in their early stages do not progress in depth. Later, the roots collapse and empty, leaving only
the hollow epidermal cover. In adult plants, the pathogen progresses through the vascular tissues until
it reaches the crown, where a cross section of the claw allows the observation of a dark brown rot. It is
in older crops where symptoms are most clearly seen. After the productive period, when the plants
are left to vegetate in order to store the necessary reserves for the following year, the affected plants
begin to show a premature yellowing that could be confused with that caused by root asphyxia due to
waterlogging. The most affected stems become completely dry and finally the whole plant wilts.
      This is a complex syndrome in whose causality both abiotic, such as water stress or allelopathic
compounds, and biotic factors could be involved [6,7], but in which the Fusarium complex plays a
predominant role [8–10]. The syndrome is expressed by shortening the productive period of the crop
and limiting the replanting of asparagus on soils previously cultivated with asparagus by leading to
the phenomenon known as “soil fatigue” [11]. This phenomenon appears in the second and third year
after replanting, which does not depend on the rest period between plantations, and is characterized
by a marked decrease in the vigor of the plants combined with a smaller size of harvested sprouts.
The decrease in the yield is so drastic that on many occasions it makes the crop unprofitable.
      The disease was first described more than a century ago, but its biotic causal agent was not
identified until 1941, when Cohen and Heald [12] described it as F. oxysporum f. sp. asparagi. Since then,
different researchers have addressed the study of the disease by extending its etiology to a complex of
Fusarium species that have been associated with the syndrome, including F. proliferatum, F. redolens,
F. solani or F. ershadii, among others [9,13–19].
      Among all of them, F. oxysporum f. sp. asparagi and F. proliferatum are the species that seem to
prevail as the most pathogenic within the specific complex associated to the disease, although the
composition of the fungal consortium is highly variable depending on the geographical region under
study. ADS was first reported in Spain in the 1980s [20]. Several of the Fusarium species previously
described in other areas of the world were also isolated in our country, particularly the most abundant
species, F. oxysporum and F. proliferatum (sensu Messiaen and Cassini [21]), whose pathogenicity
was demonstrated.
      This disease is difficult to control due to the multiannual character of the asparagus crop,
easy dissemination with the propagation material and the persistence of asparagus root residues and
inoculum of the Fusaria consortium over time, recovering asparagus root residues with high contents of
fusaric microbiota after 25 years without cultivation [9,17]. On the other hand, the available asparagus
cultivars have low resistance [22–24]. Although there is a source of resistance to Fusarium in Asparagus
densiflorus [25], it is difficult to obtain resistant cultivars under various agro-environmental conditions
due to the high genetic and pathogenic diversity of the Fusaria consortium, whose species composition
and preponderance varies with the climatic conditions. An accurate identification of the species
associated to ADS is crucial for management. A multilocus sequence typing database, Fusarium MLST
(http://www.westerdijkinstitute.nl/fusarium) with partial sequences from phylogenetically informative
loci was developed to facilitate accurate identification of single phylogenetic Fusarium species.
Several gene fragments can be amplified by PCR and sequenced using primers that are conserved
across the phylogenetic breadth of Fusarium. The phylogenetic concept of species, based on DNA
sequence homology and phylogenetic analysis, has allowed the description of multiple Fusarium species
(originally associated to a single morphological species) belonging to different species complexes.
In addition, estimating the genetic diversity and the population structure of Fusarium consortium
associated to ADS in the three asparagus production areas can increase our understanding of the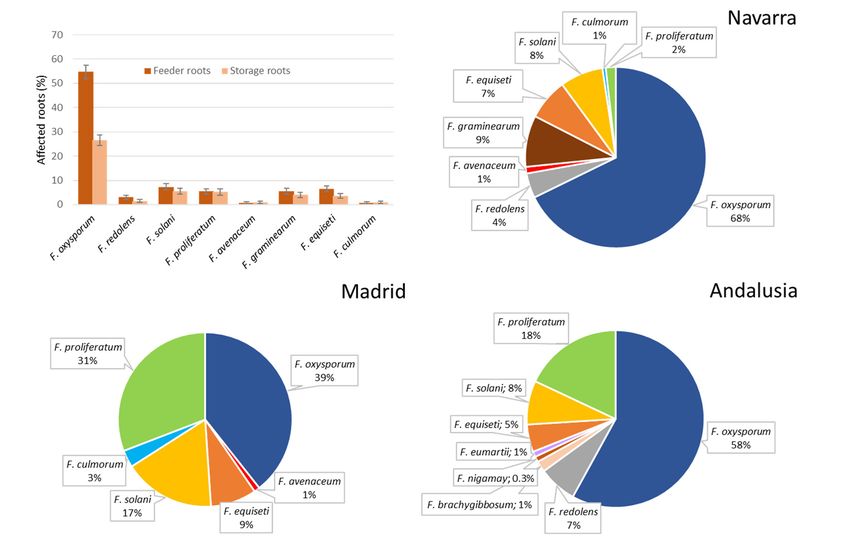
J. Fungi 2020, 6, 336                                                                                 3 of 23

disease and improve the management. In this work, a multilocus sequence dataset was constructed
consisting of concatenated partial sequences of genes for the translation elongation factor 1-alpha
(EF-1α) and the DNA-directed RNA polymerase II largest (RPB1) and second largest subunit (RPB2)
to accurately identify and to assess the genetic diversity of the Fusarium consortium associated to
asparagus in Spain.
     The present study aimed to describe the role of Fusarium consortium on ADS by analyzing
asparagus fields in the main Spanish production areas. To achieve this, Fusarium isolates were obtained
from diseased asparagus plants and soils from the north, center and south of Spain, corresponding to
Navarra, Madrid and Andalusia regions. Fusarium isolates were morphologically and molecularly
identified via multilocus sequence typing, and the relative abundance of each species in the three
production areas and their pathogenicity to asparagus were determined. In addition, the potential
correlation between the climatic conditions of the cultivation area and the occurrence of Fusarium
oxysporum soil inoculum density and the relationship between three crop parameters (average climate
temperature, crop age and F. oxysporum soil inoculum density) and field disease index (FDI) values
were estimated. Finally, the phylogenetic relationships among isolates and the genetic diversity of the
pathogenic Fusarium species detected in the Spanish production areas were calculated.

2. Materials and Methods

2.1. Asparagus Fields Sampling
     Asparagus is a broad distributed crop in Spain. Sampling was designed to cover not only different
cultivated varieties and growing methods but also different climatic regions. In total, 41 fields from
three provinces covering seven different municipalities were sampled for soil and plants. Soils from
plots with different crop ages (0–22 years) were sampled and analyzed. In total, 16 fields were collected
in the north of the country (Navarra) (1–16), 6 in the center (Madrid) (17–22) and 20 in the south
(Andalusia) (23–41). Sampling dates, climate and location of the sampled fields are summarized in
Table 1 and Figure 1.
     Sampling dates were October 2017 for fields from the north and center of the country and June and
July 2018 for fields from the south. Samples from north and center were obtained during vegetative
development after the harvest period. Disease Severity Index was determined in the field by two
independent observers as percentage of prematurely yellowed plants. All percentage values for field
disease index were arcsine square root transformed before statistical analysis. Samples from the south
were collected during harvest period (Table 1). For each municipality, climatic data were collected
from the regional basic climatological network.
     All plant samples were manually collected and consisted in 4–6 well-developed plants per field
(including the root system). Prematurely yellowed, dried and dead plants were selected for Fusarium
spp. isolation. Within the plants, pieces of feeder and storage roots showing brown or necrotic
spots, loss of feeder roots, root collapse and/or root rot were taken. Soil samples (3 L) were collected
surrounding the roots at a depth of 5–30 cm from the root zone, using a disinfected drill. After collecting,
samples were taken to the laboratory for analysis within 24–48 h.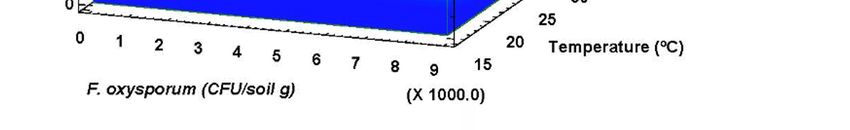
J. Fungi 2020, 6, 336 4 of 23
Table 1. Samples codes, origin, climate, varieties, cultivation type and sowing date.
Köppen–Geiger
Cultivation
Sample Region Municipality Variety Climate Classification Sowing Date
Type
System [26]
1 Navarra Ancín Grolim White asparagus Oceanic (Cfb) 2012
2 Navarra Ancín Grolim White asparagus Oceanic (Cfb) 2017
3 Navarra Ancín Grolim White asparagus Oceanic (Cfb) 2009
4 Navarra Ancín Grolim White asparagus Oceanic (Cfb) 2012
5 Navarra Ancín Grolim White asparagus Oceanic (Cfb) 2017
6 Navarra Ancín Fortens White asparagus Oceanic (Cfb) 2016
7 Navarra Ancín Grolim White asparagus Oceanic (Cfb) 2014
8 Navarra Ancín Grolim White asparagus Oceanic (Cfb) 2016
9 Navarra Ancín Cygnus White asparagus Oceanic (Cfb) 2016
10 Navarra Larraga Grolim White asparagus Oceanic (Cfb) 2009
11 Navarra Berbinzana Grolim White asparagus Oceanic (Cfb) 2009
12 Navarra Berbinzana Grolim White asparagus Oceanic (Cfb) 2009
Miranda
13 Navarra Grolim White asparagus Oceanic (Cfb) 2010
de Arga
Miranda
14 Navarra Grolim White asparagus Oceanic (Cfb) 2012
de Arga
Warm-summer
15 Navarra Tudela Grolim White asparagus 2006
Mediterranean (Csb)
Warm-summer
16 Navarra Tudela Grolim White asparagus 2014
Mediterranean (Csb)
17 Madrid Aranjuez Grande Green asparagus Cold semi-arid (BSk) 2011
18 Madrid Aranjuez Grande Green asparagus Cold semi-arid (BSk) 2017
19 Madrid Aranjuez Grande Green asparagus Cold semi-arid (BSk) 2012
20 Madrid Aranjuez Grande Green asparagus Cold semi-arid (BSk) 2011
21 Madrid Aranjuez Grande Green asparagus Cold semi-arid (BSk) 2014
22 Madrid Aranjuez Grande Green asparagus Cold semi-arid (BSk) 2010
Hot-summer
23 Andalusia Huétor-Tájar Grande Green asparagus 2010
Mediterranean (Csa)
Hot-summer
24 Andalusia Huétor-Tájar Grande Green asparagus 2012
Mediterranean (Csa)
Hot-summer
25 Andalusia Huétor-Tájar Grande Green asparagus 2012
Mediterranean (Csa)
Hot-summer
26 Andalusia Huétor-Tájar Grande Green asparagus 1995
Mediterranean (Csa)
Hot-summer
27 Andalusia Huétor-Tájar Grande Green asparagus 2016
Mediterranean (Csa)
Hot-summer
28 Andalusia Huétor-Tájar Grande Green asparagus 2015
Mediterranean (Csa)
Hot-summer
29 Andalusia Loja Grande Green asparagus 2013
Mediterranean (Csa)
Hot-summer
30 Andalusia Loja Grande Green asparagus 2014
Mediterranean (Csa)
Hot-summer
31 Andalusia Loja Grande Green asparagus 2011
Mediterranean (Csa)
Hot-summer
32 Andalusia Loja Atlas Green asparagus 2016
Mediterranean (Csa)
Hot-summer
33 Andalusia Loja Grande Green asparagus 2012
Mediterranean (Csa)
Hot-summer
34 Andalusia Loja Grande Green asparagus 2005
Mediterranean (Csa)
Hot-summer
35 Andalusia Loja Grande Green asparagus 2010
Mediterranean (Csa)
Hot-summer
36 Andalusia Loja Grande Green asparagus 2013
Mediterranean (Csa)
Hot-summer
37 Andalusia Loja Placosesp Green asparagus 2012
Mediterranean (Csa)
Hot-summer
38 Andalusia Loja Placosesp Green asparagus 2008
Mediterranean (Csa)
Hot-summer
39 Andalusia El Jau Grande Green asparagus 2010
Mediterranean (Csa)
Hot-summer
40 Andalusia El Jau Grande Green asparagus 2010
Mediterranean (Csa)
Hot-summer
41 Andalusia El Jau Grande Green asparagus 2010
Mediterranean (Csa)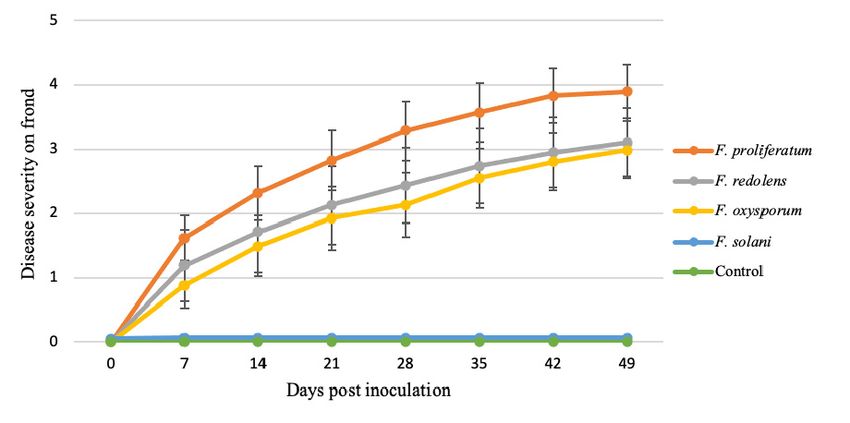
J. Fungi 2020, 6, 336                                                                                          5 of 23
J. Fungi 2020, 6, x FOR PEER REVIEW                                                                            4 of 24

                                                                                −2   −1
     Figure 1. Surface
     Figure 1. Surface Incoming
                       Incoming Radiation
                                    Radiationmap
                                               map--AEMET
                                                      AEMET(1983–2005)
                                                              (1983–2005)(kwh
                                                                          (kwhmm−2day
                                                                                   day−1)) (Climate-Satellite
                                                                                           (Climate-Satellite
     Application
     Application Facilities),
                 Facilities), location
                              location and
                                       and altitude
                                            altitude of
                                                     of sampled
                                                        sampled municipalities.
                                                                municipalities.
2.2. Analysis of Plant Samples
      Sampling dates were October 2017 for fields from the north and center of the country and June
and July 2018offor
      Analysis    the plant
                      fieldssamples
                              from theconsisted
                                          south. in  the superficial
                                                   Samples            disinfection
                                                              from north            of secondary
                                                                             and center            and storing
                                                                                            were obtained       roots
                                                                                                             during
with  1.5% sodium
vegetative           hypochlorite
             development    after thesolution
                                       harvestfor   1 min,Disease
                                                 period.    followed   by twoIndex
                                                                    Severity     successive  washings with
                                                                                      was determined     in thesterile
                                                                                                                 field
distilled water.  After drying,  1 cm  pieces  were   sown   in plates with  potato   dextrose
by two independent observers as percentage of prematurely yellowed plants. All percentage valuesagar  (PDA)  culture
medium     supplemented
for field disease          witharcsine
                   index were     0.5 g/Lsquare
                                           of streptomycin     sulphate
                                                  root transformed        (Sigma-Aldrich,
                                                                       before                 St. Louis,
                                                                                statistical analysis.    MO, USA)
                                                                                                      Samples   from
(PDAS)
the south and incubated
            were          forduring
                  collected    5–7 days  at laboratory
                                      harvest             temperature
                                                period (Table             (25 ◦ C)
                                                                 1). For each      under continuous
                                                                                municipality,   climaticfluorescent
                                                                                                          data were
light. Fungal
collected  fromsingle-spore
                 the regionalcultures   were obtained
                                basic climatological      from the different Fusarium colonies recovered.
                                                        network.

2.3. Analysis Table
              of Soil1.Samples
                        Samples codes, origin, climate, varieties, cultivation type and sowing date.
       Analysis consisted of drying the soil under aseptic conditions        at room temperature         (20–25 ◦ C),
                                                                           Köppen–Geiger    Climate         Sowing
 Sample    Region      Municipality     Variety     Cultivation Type
crushing and sifting the samples through a 200 µm sieve and adding                  0.02 System
                                                                          Classification g of the
                                                                                                [26]sifted soil to a
                                                                                                             Date
     1     Navarra        Ancín          Grolim     White  asparagus            Oceanic  (Cfb)
Fusarium-selective medium as described by Komada [27] modified by Tello et al. [28] (this modification       2012
     2     Navarra        Ancín          Grolim     White asparagus             Oceanic (Cfb)                2017
contains, per L, 10 g galactose, 10 g agar, 1.25 g Pentachloronitrobenzene (PCNB) and 0.5 g streptomycine
     3     Navarra        Ancín          Grolim     White asparagus             Oceanic (Cfb)                2009
sulfate).
     4     Sixteen
           Navarra petri dishes
                          Ancín per sample
                                         Grolim were    used
                                                    White      and divided into
                                                           asparagus                 four(Cfb)
                                                                                Oceanic    blocks of four dishes.
                                                                                                             2012
Plates
     5 wereNavarra          25 ◦ C underGrolim
             incubated atAncín            continuousWhitefluorescent
                                                           asparagus light for 10    days.
                                                                                Oceanic     The mean number
                                                                                         (Cfb)               2017 of
     6 forming
colony     Navarraunits (CFU)
                          Ancínper petriFortens
                                         dish andWhite     asparagus deviation of
                                                     the standard               Oceanic  (Cfb) were calculated
                                                                                   the mean                  2016for
     7     Navarra        Ancín          Grolim     White asparagus             Oceanic (Cfb)                2014
all Fusarium species and used as the basis for comparisons.
   8       Navarra         Ancín          Grolim     White asparagus              Oceanic (Cfb)               2016
   9       Navarra         Ancín          Cygnus     White asparagus              Oceanic (Cfb)               2016
   10      Navarra        Larraga         Grolim     White asparagus              Oceanic (Cfb)               2009
   11      Navarra      Berbinzana        Grolim     White asparagus              Oceanic (Cfb)               2009
   12      Navarra      Berbinzana        Grolim     White asparagus              Oceanic (Cfb)               2009
   13      Navarra    Miranda de Arga     Grolim     White asparagus              Oceanic (Cfb)               2010
J. Fungi 2020, 6, 336 6 of 23
2.4. Morphological Characterization of Fungal Isolates
Morphological approach was used to assign isolates to the Fusarium spp. level. Procedures and
taxonomic criteria of Nelson et al. [29] and Leslie and Summerell [30] were followed.
2.5. Molecular Characterization of Fungal Isolates
Molecular identification of representative single-spore soil and plant isolates was confirmed by
sequencing of a portion of the EF-1α gene using primers ef1 and ef2 [31]. A multilocus sequence
typing was carried out for 70 selected plant isolates: 31 F. oxysporum, 23 F. proliferatum and 16 F. redolens
(Table 2). To do that, DNA was extracted from single-spore Fusarium isolates using the Isolate II Plant
DNA Kit (Bioline, Toronto, Canada) following the manufacturer’s instructions. The DNA concentration
was determined on an ND-1000 NanoDrop spectrophotometer (Nano-Drop Products, Wilmington,
DE, USA). PCR reactions were performed to amplify and partially sequence EF-1α RPB1 and RPB2
genes from each selected isolate. PCR reactions contained 10× PCR Buffer (Intron Biotechnology, Inc.,
Seongnam, Gyeonggi, Korea), 2 mM MgCl2, 0.25 mM each dNTP, 0.4 µM each primer (Table S1), 1 U of
i-Pfu DNA polymerase (Intron Biotechnology, Inc., Seongnam, Gyeonggi, Korea) and 20–100 ng of
genomic DNA. Amplifications were carried out at 95 ◦ C for 3 min followed by 35 cycles of 30 s at 95 ◦ C,
20 s at 59 (for EF-1α), 57 (for RPB1) or 55 ◦ C (for RPB2) and 60 s at 72 ◦ C. The size of the amplicons
was resolved in 1.5% agarose gels in 0.5× TAE (Tris-acetate-EDTA) buffer; then, they were stained
with RedSafe nucleic acid staining solution (Intron Biotechnology, Inc., Seongnam, Gyeonggi, Korea)
and visualized over an ultraviolet transilluminator. Amplicons were purified using the FavorPrep
Gel/PCR purification kit (Favorgen, Ping-Tung, Taiwan) following the manufacturer’s instructions
and sequenced by STAB VIDA DNA Sequencing Service. Sequences were deposited in GenBank and
compared with available sequences in GenBank and Fusarium-MLST databases by BLAST analysis.
The whole fungal collection was maintained on potato dextrose agar and Komada’s media and stored at
4 ◦ C in the fungus collection of the IFAPA and in the Polytechnic University of Madrid. Representative
isolates were maintained in 20% (v/v) glycerol at −80 ◦ C.
Table 2. The Fusarium plant isolates used in this study for phylogenetic analysis and GeneBank accessions.
Genbank Accession No.
Origin Species Code Isolate Source Location
EF-1α RPB1 RPB2
This Study F. oxysporum GR_FOAc Asparagus Plant Loja MT305183 MT305069 MT305125
This study F. oxysporum GR_FOA5 Asparagus plant Loja MT305184 MT305070 MT305126
This study F. oxysporum GR_FOA8 Asparagus plant Loja MT305185 MT305071 MT305127
This study F. oxysporum GR_FOA13 Asparagus plant Loja MT305186 MT305072 MT305128
This study F. oxysporum GR_FOA14 Asparagus plant Loja MT305187 MT305073 MT305129
This study F. oxysporum GR_FOA21 Asparagus plant Loja MT305188 MT305074 MT305130
This study F. oxysporum GR_FOA125 Asparagus plant Loja MT305189 MT305075 MT305131
This study F. oxysporum GR_FOA128 Asparagus plant Loja MT305190 MT305076 MT305132
This study F. oxysporum GR_FOA141 Asparagus plant Loja MT305191 MT305077 MT305133
This study F. oxysporum GR_FOA164 Asparagus plant Loja MT305192 MT305078 MT305134
This study F. oxysporum GR_FOA168 Asparagus plant Loja MT305193 MT305079 MT305135
This study F. oxysporum GR_FOA179 Asparagus plant Loja MT305194 MT305080 MT305136
This study F. oxysporum GR_FOA230 Asparagus plant El Jau MT305195 MT305081 MT305137
This study F. oxysporum GR_FOA247 Asparagus plant El Jau MT305196 MT305082 MT305138
This study F. oxysporum GR_FOA249 Asparagus plant El Jau MT305197 MT305083 MT305139
This study F. oxysporum NA_FOA01 Asparagus plant Ancín MT568933 MT568949 MT568965
This study F. oxysporum NA_FOA04 Asparagus plant Ancín MT568934 MT568950 MT568966
This study F. oxysporum NA_FOA08 Asparagus plant Ancín MT568935 MT568951 MT568967
This study F. oxysporum NA_FOA10 Asparagus plant Ancín MT568936 MT568952 MT568968
This study F. oxysporum NA_FOA12 Asparagus plant Berbinzana MT568937 MT568953 MT568969
This study F. oxysporum NA_FOA13 Asparagus plant Berbinzana MT568938 MT568954 MT568970
This study F. oxysporum NA_FOA14 Asparagus plant Berbinzana MT568939 MT568955 MT568971
This study F. oxysporum NA_FOA15 Asparagus plant Tudela MT568940 MT568956 MT568972
This study F. oxysporum MA_FOA16 Asparagus plant Aranjuez MT568941 MT568957 MT568973
This study F. oxysporum MA_FOA17 Asparagus plant Aranjuez MT568942 MT568958 MT568974J. Fungi 2020, 6, 336 7 of 23
Table 2. Cont.
Genbank Accession No.
Origin Species Code Isolate Source Location
EF-1α RPB1 RPB2
This study F. oxysporum MA_FOA19 Asparagus plant Aranjuez MT568943 MT568959 MT568975
This study F. oxysporum MA_FOA20 Asparagus plant Aranjuez MT568944 MT568960 MT568976
This study F. oxysporum MA_FOA23 Asparagus plant Aranjuez MT568945 MT568961 MT568977
This study F. oxysporum MA_FOA24 Asparagus plant Aranjuez MT568946 MT568962 MT568978
This study F. oxysporum MA_FOA25 Asparagus plant Aranjuez MT568947 MT568963 MT568979
This study F. oxysporum MA_FOA27 Asparagus plant Aranjuez MT568948 MT568964 MT568980
This study F. proliferatum GR_FPb Asparagus plant Loja MT305198 MT305084 MT305140
This study F. proliferatum GR_FP3 Asparagus plant Loja MT305199 MT305085 MT305141
This study F. proliferatum GR_FP17 Asparagus plant Loja MT305201 MT305086 MT305143
This study F. proliferatum GR_FP24 Asparagus plant Loja MT305202 MT305087 MT305144
This study F. proliferatum GR_FP86 Asparagus plant Loja MT305203 MT305088 MT305145
This study F. proliferatum GR_FP87 Asparagus plant Loja MT305204 MT305089 MT305146
This study F. proliferatum GR_FP100 Asparagus plant Loja MT305205 MT305090 MT305147
This study F. proliferatum GR_FP120 Asparagus plant Loja MT305206 MT305091 MT305148
This study F. proliferatum GR_FP130 Asparagus plant Loja MT305207 MT305092 MT305149
This study F. proliferatum GR_FP172 Asparagus plant Loja MT305208 MT305093 MT305150
This study F. proliferatum GR_FP182 Asparagus plant Loja MT305210 MT305094 MT305152
This study F. proliferatum GR_FP234 Asparagus plant El Jau MT305211 MT305095 MT305153
This study F. proliferatum GR_FP248 Asparagus plant El Jau MT305212 MT305096 MT305154
This study F. proliferatum NA_FPA01 Asparagus plant Larraga MW091265 MW091281 MW091299
This study F. proliferatum NA_FPA02 Asparagus plant Ancín MW091266 MW091282 MW091300
This study F. proliferatum MA_FPA04 Asparagus plant Aranjuez MW091267 MW091284 MW091302
This study F. proliferatum MA_FPA06 Asparagus plant Aranjuez MW091268 MW091286 MW091304
This study F. proliferatum MA_FPA08 Asparagus plant Aranjuez MW091269 MW091288 MW091306
This study F. proliferatum MA_FPA10 Asparagus plant Aranjuez MW091270 MW091290 MW091308
This study F. proliferatum MA_FPA11 Asparagus plant Aranjuez MW091271 MW091291 MW091309
This study F. proliferatum MA_FPA12 Asparagus plant Aranjuez MW091272 MW091292 MW091310
This study F. proliferatum MA_FPA15 Asparagus plant Aranjuez MW091275 MW091293 MW091313
This study F. proliferatum MA_FPA16 Asparagus plant Aranjuez MW091276 MW091294 MW091314
This study F. redolens GR_FRa Asparagus plant Loja MT305213 MT305097 MT305155
This study F. redolens GR_FR4 Asparagus plant Loja MT305214 MT305098 MT305156
This study F. redolens GR_FR7 Asparagus plant Loja MT305215 MT305099 MT305157
This study F. redolens GR_FR18 Asparagus plant Loja MT305216 MT305100 MT305158
This study F. redolens GR_FR20 Asparagus plant Loja MT305217 MT305101 MT305159
This study F. redolens GR_FR23 Asparagus plant Loja MT305218 MT305102 MT305160
This study F. redolens GR_FR29 Asparagus plant Loja MT305219 MT305103 MT305161
This study F. redolens GR_FR58 Asparagus plant Loja MT305220 MT305104 MT305162
This study F. redolens GR_FR104 Asparagus plant Loja MT305221 MT305105 MT305163
This study F. redolens GR_FR157 Asparagus plant Loja MT305224 MT305107 MT305165
This study F. redolens GR_FR186 Asparagus plant Loja MT305225 MT305108 MT305166
This study F. redolens GR_FR215 Asparagus plant El Jau MT305226 MT305109 MT305167
This study F. redolens NA_FRA01 Asparagus plant Ancín MW091277 MW091295 MW091315
This study F. redolens NA_FRA02 Asparagus plant Ancín MW091278 MW091296 MW091316
This study F. redolens NA_FRA03 Asparagus plant Ancín MW091279 MW091297 MW091317
This study F. redolens NA_FRA04 Asparagus plant Berbinzana MW091280 MW091298 MW091318
GenBank F. oxysporum RBG5769 Soil Australia KJ397041 KJ397185 KJ397221
GenBank F. oxysporum RBG5796 Soil Australia KJ397061 KJ397205 KJ397241
GenBank F. oxysporum RBG5801 Soil Australia KJ397062 KJ397206 KJ397242
GenBank F. oxysporum RBG5807 Soil Australia KJ397066 KJ397210 KJ397246
GenBank F. oxysporum RBG5765 Soil Australia KJ397075 KJ397219 KJ397255
GenBank F. oxysporum RBG5771 Soil Australia KJ397042 KJ397186 KJ397222
GenBank F. oxysporum RBG5782 Soil Australia KJ397051 KJ397195 KJ397231
GenBank F. oxysporum RBG5818 Soil Australia KJ397072 KJ397216 KJ397252
GenBank F. oxysporum RBG5768 Soil Australia KJ397040 KJ397184 KJ397220
GenBank F. oxysporum RBG5779 Soil Australia KJ397048 KJ397192 KJ397228
GenBank F. oxysporum RBG5781 Soil Australia KJ397050 KJ397194 KJ397230
GenBank F. oxysporum RBG5784 Soil Australia KJ397053 KJ397197 KJ397233
GenBank F. oxysporum RBG5697 Soil Australia KJ397064 KJ397208 KJ397244
GenBank F. oxysporum RBG5783 Soil Australia KJ397052 KJ397196 KJ397232
GenBank F. oxysporum RBG5794 Soil Australia KJ397060 KJ397204 KJ397240
GenBank F. oxysporum RBG5817 Soil Australia KJ397071 KJ397215 KJ397251J. Fungi 2020, 6, 336 8 of 23
Table 2. Cont.
Genbank Accession No.
Origin Species Code Isolate Source Location
EF-1α RPB1 RPB2
NRRL Dianthus
GenBank F. commune Netherlands HM057338 JX171525 JX171638
28387 caryophyllus
NRRL
GenBank F. proliferatum Zea mays USA MN193865 MN193921 MN193893
62905
NRRL
GenBank F. proliferatum Human USA HM347124 HM347185 EF470206
43617
NRRL Saccharum
GenBank F. fujikuroi Taiwan MN193860 MN193916 MN193888
5538 officinarum
NRRL
GenBank F. concentricum Musa sapientum Costa Rica MT010992 MT010942 MT010981
25181
NRRL
GenBank F. sacchari Lab cross USA MN193868 MN193924 MN193896
66326
NRRL
GenBank F. bulbicola Nerine bowdenii Germany KF466415 KF466394 KF466404
13618
NRRL
GenBank F. subglutinans Zea mays USA HM057336 JX171486 JX171599
22016
NRRL
GenBank F. begoniae Begonia elatior Germany MN193858 MN193914 MN193886
25300
NRRL
GenBank F. verticillioides Zea mays USA MN193873 MN193929 MN193901
20956
NRRL
GenBank F. nygamai Human Egypt HM347121 HM347147 EF470127
26421
NRRL Pennisetum South
GenBank F, napiforme MN193863 MN193919 MN193891
25196 typhoides Africa
NRRL
GenBank F. oxysporum Human USA HM347120 HM347146 EF470126
26360
NRRL
GenBank F. redolens Feline USA KC808221 KC808300 KC808363
54967
NRRL Pseudotsuga
GenBank F. redolens Canada MT409452 MT409432 JX171616
22901 menziesii
NRRL Macrochloa
GenBank F. spartum Tunisia MT409457 MT409437 MT409447
66894 tenacissima
NRRL
GenBank F. hostae Hosta sp. USA MT409455 MT409435 MT409445
29888
2.6. Pathogenicity Tests of Plant and Soil Isolates
In total, 37 Fusarium monoconidial isolates (F. oxysporum (n = 10), F. redolens (n = 8), F. proliferatum
(n = 11) and Fusarium solani species complex (FSSC) (n = 8)) from diseased plants were tested for
pathogenicity. For this purpose, asparagus seeds of cultivar “Grande F1” were surface disinfested by
immersion with 3.5% sodium hypochlorite for 20 min and subsequently rinsed with tap water and
incubated in sterile wet paper at 28 ◦ C in the dark. Fungal isolates were cultured in Czapek–Dox broth
on a rotary shaker (150 rpm) at 25 ◦ C for 10 days. Once plants reached an appropriate size, they were
inoculated by immersion of the roots in a suspension of 106 –107 CFU/mL for 30 min. Non-inoculated
control plants were root-dipped in sterile Czapek–Dox broth. The inoculated plants were transplanted
into pots with 1.6 L of sterile vermiculite. Three plants were sown per pot and 12 plants for each
Fusarium isolate. Plants were maintained in a growth chamber set at 25/18 ◦ C (light/dark) with a 14 h
photoperiod (14,000 lux) for 60 days. These experiments were carried out twice for each Fusarium
species tested.
On the other hand, 258 Fusarium isolates (F. oxysporum (sensu Leslie & Summerel, 2006) (n = 87),
FSSC (n = 68), F. equiseti (n = 41), F. acuminatum (n = 32), F. compactum (n = 16) and F. proliferatum
(n = 14)) from soil samples were tested for pathogenicity in a first set of pot experiments screening.
This set of tests consisted of four sequential experiments. All isolates were inoculated by drenching
the potting substrate (twice autoclaved vermiculite, 1 h at 120 ◦ C each) contained in 200-mL plastic
pots with 80 mL inoculum. The inocula consisted of 104 –105 CFU/mL suspensions of each isolate in
sterile water. The inoculum was prepared by grinding colonies fully covering the entire surface of PDAJ. Fungi 2020, 6, 336 9 of 23
(F. oxysporum, FSSC and F. proliferatum isolates) or KCL-agar (F. equiseti, F. compactum and F. acuminatum)
plates. Isolates grew at 25 ◦ C for 10–12 days in darkness for PDA plates and for 14–15 days under
UV light for KCl plates. Non-inoculated control plants were watered with an aqueous homogenize of
non-colonized PDA. Seeds were disinfected as described above. Inoculations occurred when asparagus
plants cv. Grande F1 had emerged on the substrate. Three plants were sown per pot and six plants
were inoculated per isolate. Pots were randomly distributed and maintained for 30 days in a growth
chamber under the same conditions explained above. The incidence of plants showing symptoms of
infection of the roots was assessed at the end of the experiment to determine which isolates expressed
pathogenicity (infection of the roots clearly higher than the control plants) for a further evaluation
through a second set of inoculations.
The next set of experiments was conducted sequentially to evaluate 61 soil isolates, previously
demonstrated pathogenic: F. oxysporum (n = 49) and F. proliferatum (12). Experiments were performed as
described above for the tests of plant isolates but using 1-L plastic pots with three replicates containing
seven plants each.
Plants were evaluated weekly for disease severity based on a 1–5 scale, where 1 = 1–20%,
2 = 21–40%, 3 = 41–60%, 4 = 61–80% and 5 = 81–100% of the fronds showing chlorosis, necrosis or wilt.
Area under disease progress curves (AUDPC) was calculated for each species by clustering recorded
data from all plant isolates [32]. At the end of each experiment, the plants were removed from the pots,
the roots rinsed in tap water, and the severity of the lesions on the root system was assessed on the
same scale as fronds, related to necrosis in the root system. The fronds and root wet weights were
also measured. Mean ± standard error of root rot severity and fronds severity ratings and weight loss
with respect to the control, over 12 replicate plants inoculated with each isolate, were determined.
The proportion of plants that were dead was also assessed at the end of the experiments. All the dead
plants and several randomly assigned symptomatic plants per isolate were analyzed for re-isolation
on PDA.
2.7. Phylogenetic Analysis
Phylogenetic analyses of the 70 plant isolates of F. oxysporum, F. proliferatum and F. redolens
species were carried out by the analysis of three phylogenetically informative loci: the translation
elongation factor-1α (EF-1α) and the DNA-directed RNA polymerase II largest (RPB1) and second
largest subunits (RPB2). These loci were chosen due to be the most informative for species-level
identifications and to be well represented in the database [33–36]. These sequence fragments were
manually concatenated (2 598 nucleotides). In addition, sequences from Fusarium oxysporum species
complex (FOSC), Fusarium fujikuroi species complex (FFSC) and Fusarium redolens species complex
(FRSC) retrieved from GenBank were included in the analyses. For the analysis of FOSC, some GenBank
isolates were used belonging to Clades 1–4 defined by O’Donnell et al. [37] and later grouped into
PS1 and PS2 phylogenetic species according to Laureance et al. [38]. Multiple sequence alignments
were performed in MEGA7 software using the CLUSTALW algorithm refined with MUSCLE and
edited manually. Phylogenetic analyses were conducted using MEGA7 through maximum likelihood
(ML) analysis using the kimura-2 parameter model for the analysis of FOSC, FFSC and FRSC isolates
independently, all of them with a rate of variation across sites [39]. Support for internal branches was
assessed by 1000 ML bootstrapped pseudo replicates of data. Nodes with bootstrap support ≥ 70%
were indicated in the final trees.
2.8. Genetic Diversity
Haplotype distribution of the asparagus isolates belonging to FOSC, FFSC and FRSC was
performed using DNA sequence information from concatenated loci by DnaSP v5 software [40].
Number of haplotypes (h), haplotype (gene) diversity (H) and nucleotide diversity (π) of the species
complexes were calculated by DnaSP v5. Fusarium oxysporum plant isolates were artificially grouped
into three populations corresponding to the three prospected production areas to discern potentialJ. Fungi 2020, 6, 336 10 of 23
differences among populations. Chi square statistic [41] was used to calculate genetic differentiation
among populations.
2.9. Statistical Analysis of Data
Analysis of variance on the Fusarium isolates from soil at different crop ages (0–22 years),
average temperature of the warmest month, altitude (meters over the sea level) and type of consumption
(white asparagus vs. green asparagus), as well as for Fusarium spp. isolated from feeder and storage
roots and those used for pathogenicity test evaluation (fronds and root weights), were performed
using Fisher’s least significant difference (LSD) tests at 99.9% confidence were carried out using
STATGRAPHICS Centurion XVIII statistical package software (StatPoint, Inc., Herndon, VA, USA).
Additional non-parametric Kolmogorov–Smirnov, Mann–Whitney–Wilcoxon and Kruskal–Wallis tests
were performed when the assumption of the normality of the distributions for the two samples studied
was not sustainable (disease severity on fronds). Differences among pathogenicity trials were not found
(p ≥ 0.05), thus data were clustered for consistency of analysis. Arcsine square root transformation was
applied to weight loss percentages.
To determine direct correlation between the density of inoculum of any of the Fusarium species
and the Field Disease Index (after arcsine square root transformation), simple regression analysis was
adjusted to the non-linear Y-square model as it showed the highest R2 value. The same statistical
package software was used for the generalized linear model (Yi = β0 + β1 X1,i + β2 X2,i + β3 X3,i + . . . +
βk Xk,i + εi ), where “Y” is the response variable (Field Disease Index) “ß1 Xk,i ” the predictor variables
and “i” the error. To determine when a pair of variables was effectively correlated, the p-value of its
correlation coefficient was calculated (correlation coefficient test). If the p-value is less than or equal to
0.05, the linear correlation of the two variables is statistically significant at 5% confidence level.
3. Results
3.1. Characterization of Fusarium Soil Communities and Correlation with Climatic Features
Eight species belonging to seven species complexes of the genus Fusarium were identified from the
analyzed soil samples: F. oxysporum from FOSC (F. oxysporum species complex), F. proliferatum from FFSC
(F. fujikuroi species complex), F. redolens from FRSC (F. redolens species complex), F. solani sensu stricto
from FSSC (F. solani species complex), F. equiseti from FIESC (F. incarnatum-equiseti species complex),
F. culmorum and F. compactum from FSAMSC (F. sambicinum species complex) and F. acuminatum from
FTSC (F. tricinctum species complex). All three provinces analyzed showed differences in the relative
frequencies of isolation of each species, although the two areas with the longest history of cultivation,
Navarra and Andalusia, showed similar patterns of distribution of the main species isolated (Figure 2).
The predominant species in the fields of both provinces was F. oxysporum, belonging to FOSC.
This species presents the highest percentages of colonies per gram of soil analyzed (Figure 2),
with average values of 2893 ± 1935 CFU/g in Navarra and 1126 ± 933 CFU/g in Andalusia. The second
specific group in importance in both provinces is FIESC, followed by the isolates belonging to FSSC.
The distribution in the region of Madrid varies considerably. The isolates belonging to the FIESC
appear in a greater number in the soil samples of Madrid than in the other two regions, with mean
values of 3240 ± 1343 CFU/g, much higher than the inoculum density of FSSC isolates and almost ten
times higher than the values of the FOSC isolates.
F. proliferatum was isolated in similar amounts in the three sampled regions. F. redolens was isolated
from soil samples of Navarra with an average of 287 ± 364 CFU/g of soil and from soils of Andalusia
(with a density of inoculum not determined). F. acuminatum and F. compactum were isolated only from
Andalusia. F. culmorum was isolated from the northern and central zones.J. Fungi 2020, 6, 336 11 of 23
Figure 2. Average values of CFU/g of soil for the different Fusarium spp. and relative frequencies of
isolation of Fusarium soil communities in the three analyzed production regions.
The age of the crop had no statistically significant effects on the total density of Fusarium inoculum
(UFC/g of soil) (p = 0.090). No direct correlation was detected between the density of inoculum of any
of the species and the Field Disease Index (FDI) values observed during the initial sampling in Madrid
and Navarra fields except for F. oxysporum. The simple regression analysis showed p-value = 0.034
for F. oxysporum, so the linear correlation with FDI is statistically significant at 5% confidence level.
F. oxysporum colonies showed the highest correlation with R2 value of 10.25% (Table 3).
Table 3. Equations and correlation coefficients between Field Disease Index (FDI) and Colony Forming
Units (CFU) per gram of soil analyzed, evaluated for every Fusarium species.
Correlation
Adjustment n Adjusted Equation p-Value R2
Coefficient
FDI = sqrt (256.328 − 0.184087·CFU
Y2 equation 44 0.320118 0.0341 10.25%
F. oxysporum/g soil)
FDI = sqrt (858.517 − 0.211922·CFU
Y2 equation 44 −0.131103 0.3963 1.72%
F. solani/g soil)
FDI = sqrt(639.741 + 0.0475964·CFU
Y2 equation 44 0.0334676 0.8292 0.11%
F. proliferatum/g soil)
FDI = sqrt (709.614 − 0.29721·CFU
Y2 equation 44 −0.0913385 0.5554 0.83%
F. redolens/g soil)
FDI = sqrt (411.435 + 0.121763·CFU
Y2 equation 44 0.170733 0.2678 2.91%
F. incarnatum/g soil)
FDI = sqrt (571.778 + 0.19812·CFU
Y2 equation 44 0.192981 0.2094 3.72%
F. culmorum/g soil
1Y2 equation 44 FDI = sqrt (256.328 − 0.184087·CFU F. oxysporum/g soil) 0.320118 0.0341 10.25%
Y2 equation 44 FDI = sqrt (858.517 − 0.211922·CFU F. solani/g soil) −0.131103 0.3963 1.72%
Y2 equation 44 FDI = sqrt(639.741 + 0.0475964·CFU F. proliferatum/g soil) 0.0334676 0.8292 0.11%
Y2 equation 44 FDI = sqrt (709.614 − 0.29721·CFU F. redolens/g soil) −0.0913385 0.5554 0.83%
Y2 equation 44 FDI = sqrt (411.435 + 0.121763·CFU F. incarnatum/g soil) 0.170733 0.2678 2.91%
J. Fungi 2020, 6, 336 12 of 23
Y2 equation 44 FDI = sqrt (571.778 + 0.19812·CFU F. culmorum/g soil 0.192981 0.2094 3.72%
A high correlation (R2 = 88%) was detected between F. oxysporum inoculum density and the
the =
A high correlation 2 F. oxysporum
average temperature of (R 88%) was
warmest detected
month of thebetween
year (Figure inoculum
3). The results density
indicate thatandthethe
F.
average temperature of the warmest month of the year (Figure 3). The results indicate
oxysporum inoculum increases significantly as temperature does, coinciding with recent works where that the
F.
theoxysporum inoculum
abundance increases significantly
of soil pathogens was directlyas linked
temperature does, coinciding
to temperature with recent works where
[42] (Delgado-Baquerizo et al.,
the abundance
2020). of soil pathogens was directly linked to temperature [42] (Delgado-Baquerizo et al., 2020).
Figure 3. Fusarium oxysporum soil inoculum density isolated from sampled fields depending on the
average3.temperature
Figure of the warmest
Fusarium oxysporum month. density isolated from sampled fields depending on the
soil inoculum
average temperature of the warmest month.
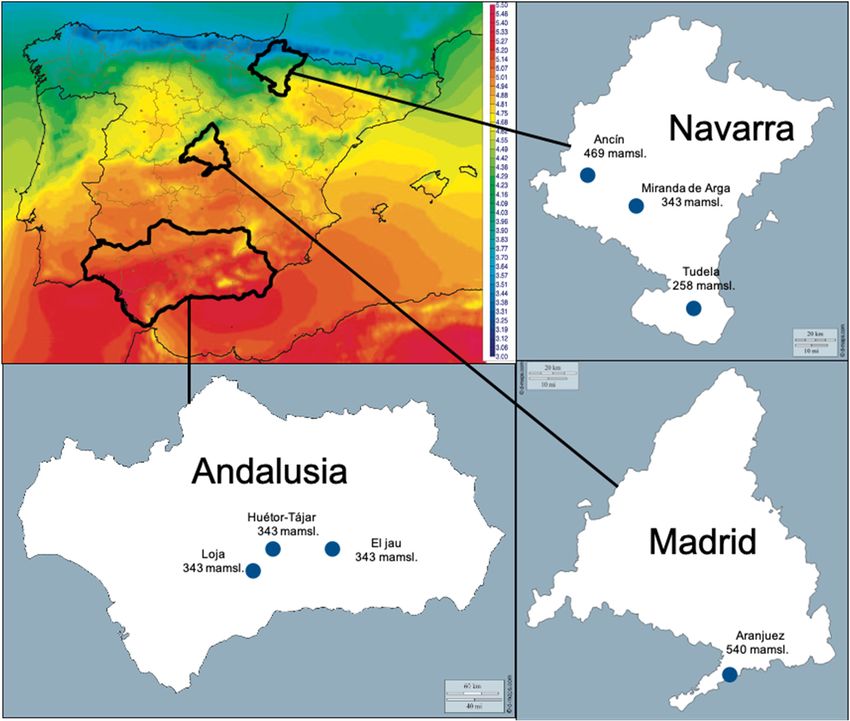
The GLM method allowed estimating the repeatability and reproducibility of the FDI measurement
R-Squared = 59.27% (Adjusted R-Squared = 53.10%). After the stepwise variable selection, five effects
The GLM method allowed estimating the repeatability and reproducibility of the FDI
were selected in the model, including year of cultivation, inoculum density (or CFU/g of soil) and
measurement R-Squared = 59.27% (Adjusted R-Squared = 53.10%). After there)stepwise variable
second-order interactions (Field Disease Index = −4,6-(0.077917 · CFU) + (0.585313 · T + (1.52425 · Years)
selection, five effects were selected in the model, including year of cultivation, inoculum density (or
+ (0.00245418 · CFU · Tre) + (0.00130563 · CFU · Years).
CFU/g of soil) and second-order interactions (Field Disease Index = −4,6-(0.077917 · CFU) + (0.585313
The fact that this is a multiannual crop has made it possible to include the age of the crop in the
· Tre) + (1.52425 ·Years) + (0.00245418 · CFU · Tre) + (0.00130563 · CFU · Years).
model. The difficulty of modeling a disease caused by a soil fungus is evident, but contour plots have
The fact that this is a multiannual crop has made it possible to include the age of the crop in the
proved useful for establishing the response values. The 3D surface contour plot shown in Figure 4
model. The difficulty of modeling a disease caused by a soil fungus is evident, but contour plots have
allows understanding the relationship between the three main factors (average temperature, crop age
proved useful for establishing the response values. The 3D surface contour plot shown in Figure 4
and inoculum density) and the FDI response values. All three variables affect FDI values of affected
allows understanding the relationship between the three main factors (average temperature, crop age
fields. The dark blue region identifies the lowest percent FDI, and it decreases as the amount of
inoculum in the soil increases. Temperature has an effect, but a smaller one: FDI increased rapidly
within the temperature, although with moderate or low inoculum levels this effect does not translate
into field damage. The contour levels reveal a peak of affected plants (%) in fields with more than
eight years and 6000 CFU/g of soil of F. oxysporum. FDI scores in this peak region are greater than 90%.
At that soil inoculum levels, intermediate FDI values can be observed at all temperature regimes in
fields between three and seven years age (Figure 4).fields. The dark blue region identifies the lowest percent FDI, and it decreases as the amount of
inoculum in the soil increases. Temperature has an effect, but a smaller one: FDI increased rapidly
within the temperature, although with moderate or low inoculum levels this effect does not translate
into field damage. The contour levels reveal a peak of affected plants (%) in fields with more than
eight years and 6000 CFU/g of soil of F. oxysporum. FDI scores in this peak region are greater than
J. Fungi 2020, 6, 336 13 of 23
90%. At that soil inoculum levels, intermediate FDI values can be observed at all temperature regimes
in fields between three and seven years age (Figure 4).
Figure 4. Disease Severity Index response surface contour plot at varying Fusarium oxysporum
soil inoculum density,Severity
Figure 4. Disease average temperature
Index of thecontour
response surface warmest
plot month and
at varying number
Fusarium of years
oxysporum soilafter
inoculum
asparagus density, average temperature of the warmest month and number of years after asparagus
plantation.
plantation.
The number of F. oxysporum colonies per gram of soil isolated from fields dedicated to white
and greenThe number of
asparagus F. oxysporum
was coloniesThe
also analyzed. per gram of soil isolated
comparative studyfrom fields dedicated
allowed to white
determining and
statistically
green asparagus was also analyzed. The comparative study allowed determining statistically
significant differences (p = 2.57 × 10 )−8between both asparagus types. The distributions of the CFU/g
−8
significant differences (p = 2.57 × 10 ) between both asparagus types. The distributions of the CFU/g
of soil of F. oxysporum/g are displayed in the boxplots below (Figure 5). The number of CFU/g soil
of soil of F. oxysporum/g are displayed in the boxplots below (Figure 5). The number of CFU/g soil
isolated from
J.isolated
Fungi green
2020, 6, x FOR
from asparagus
PEER
green fields
REVIEW
asparagus varies
fields much
varies muchless
lessthan
than that of white
that of whiteones.
ones. 13 of 24
The average values of soil were 2860 ± 1649 CFU/g for white asparagus fields and 1105 ± 1082
CFU/g for green asparagus ones. The 25% (Q3) highest CFU/g of soil in white asparagus fields were
all higher than the maximum level for green asparagus fields.
Figure 5. Boxplots showing mean CFU/g of soil depending on the cultivation type. Right of the box
is theFigure 5. Boxplots showing
75th percentile, the left mean
is theCFU/g
25th of soil depending
percentile on the
and the cultivation
whiskers type. Right
represent theofmaximum
the box is and
the 75th percentile, the left is the 25th percentile and the whiskers represent the maximum and
minimum values.
minimum values.
The maximum distance obtained in the Kolmogorov–Smirnov test, denoted by DN, is equal to
0.622 for the CFU/g of soil data. The p-value is less than 0.05 (p = 2.57 × 10⁻⁸), so there is a significant
difference between the CFU distributions of F. oxysporum in white and green asparagus fields at 5%
significance level.
3.2. Characterization of Fusarium Plant Communities
In total, 430 Fusarium isolates were obtained from 215 affected plants analyzed. Thirteen speciesJ. Fungi 2020, 6, 336 14 of 23
The average values of soil were 2860 ± 1649 CFU/g for white asparagus fields and 1105 ± 1082 CFU/g
for green asparagus ones. The 25% (Q3) highest CFU/g of soil in white asparagus fields were all higher
than the maximum level for green asparagus fields.
The maximum distance obtained in the Kolmogorov–Smirnov test, denoted by DN, is equal to
0.622 for the CFU/g of soil data. The p-value is less than 0.05 (p = 2.57 × 10⁻⁸ ), so there is a significant
difference between the CFU distributions of F. oxysporum in white and green asparagus fields at 5%
significance level.
3.2. Characterization of Fusarium Plant Communities
In total, 430 Fusarium isolates were obtained from 215 affected plants analyzed. Thirteen species
were identified from the root system of the affected plants belonging to seven species complexes:
F. oxysporum (FOSC); F. proliferatum and F. nygamai (FFSC); F. redolens (FRSC), F. solani sensu stricto,
F. falciforme, F. tonkinense and F. eumartii (FSSC); F. culmorum, F. brachygibossum and F. graminearum
(FSAMSC); F. avenaceum (FTSC); and F. equiseti (FIESC). F. oxysporum was the most prevalent species
isolated from diseased plants roots, and the rest of Fusarium species detected showed low percentages
of isolation (Figure 6). The isolation percentages of the different species vary according to the type of
root (feeder or storage root), although only the isolation percentages of F. oxysporum showed statistically
significant differences (p = 0.000) between the type of root analyzed. Isolation rate of F. oxysporum from
J. Fungi 2020, 6, x FOR PEER REVIEW 14 of 24
feeder roots was 54.74%, and 26.60% from storage roots.
Figure6.6.Average
Figure Averagevalues
valuesofofisolation
isolationfrom
fromasparagus
asparagusplants
plantsfor
forthe differentFusarium
thedifferent Fusariumspp.
spp.depending
depending
on root type and relative frequencies of isolation of Fusarium
on the root type and relative frequencies of isolation of Fusarium communities in the threeanalyzed
the communities in the three analyzed
production regions.
production regions.
3.3. Pathogenicity of Fusarium Species Associated to Asparagus
3.3. Pathogenicity of Fusarium Species Associated to Asparagus
The pathogenicity tests revealed that 90% of F. oxysporum, 87.5% of F. redolens and 90.9% of F.
The pathogenicity tests revealed that 90% of F. oxysporum, 87.5% of F. redolens and 90.9% of F.
proliferatum plant isolates were pathogenic to asparagus, while a first screening revealed that 64.4% of
proliferatum plant isolates were pathogenic to asparagus, while a first screening revealed that 64.4%
the F. oxysporum and 92.9% of the F. proliferatum soil isolates were pathogenic to asparagus. None of
of the F. oxysporum and 92.9% of the F. proliferatum soil isolates were pathogenic to asparagus. None
the FSSC, F. equiseti, F. compactum and F. acuminatum isolates expressed any symptom on asparagus
of the FSSC, F. equiseti, F. compactum and F. acuminatum isolates expressed any symptom on asparagus
seedlings (Table 4). The isolates inoculated were re-isolated from inoculated plant tissues.
seedlings (Table 4). The isolates inoculated were re-isolated from inoculated plant tissues.
Table 4. Fusarium spp. monoconidial isolates from symptomatic asparagus plants and soils of
asparagus monoculture fields, tested for pathogenicity in pot experiments under growth-chamber
conditions.
Fusarium SpeciesJ. Fungi 2020, 6, 336 15 of 23
Table 4. Fusarium spp. monoconidial isolates from symptomatic asparagus plants and soils of asparagus
monoculture fields, tested for pathogenicity in pot experiments under growth-chamber conditions.
Fusarium Species
Fusarium sp.
F. oxysporum F. proliferatum F. redolens FSSC
Plant Isolates
Number of isolates 10 11 8 8
Number of pathogenic 9 10 7 0
Percent pathogenic 90 90.9 87.5 0
Fusarium sp.
F. oxysporum F. proliferatum F. equiseti FSSC F. compactum F. acuminatum
soil isolates
Number of isolates 87 14 41 68 16 32
Number of pathogenic 56 13 0 0 0 0
Percent pathogenic 64.4 92.9 0 0 0 0
In general, F. proliferatum isolates produced the most severe symptoms, followed by F. oxysporum
and F. redolens (Table 5). However, aggressiveness was not uniform among isolates belonging to the
same species. The distribution of isolates by their aggressiveness based on plant mortality showed that
F. proliferatum was the most aggressive species.
Table 5. Mean severity on roots and percentage of frond and root weight loss of “Grande F1” asparagus
plants inoculated with Fusarium spp. isolates grown under growth-chamber conditions.
Fusarium sp.
Severity on Roots Frond Weight Loss (%) Root Weight Loss (%)
Plant Isolates
F. proliferatum (n = 11) 3.0 ± 0.2 A 59.0 ± 3.9 A 82.7 ± 1.7 A
F. oxysporum (n = 10) 2.2 ± 0.2 B 57.6 ± 4.0 A 70.1 ± 3.5 B
F. redolens (n = 8) 2.4 ± 0.2 B 47.7 ± 4.1 B 65.8 ± 4.3 B
FSSC (n = 8) 0.0 ± 0.0 C 10.1 ± 4.9 C 0.0 ± 0.0 x C
Control (n = 5) 0.0 ± 0.0 C 0.0 ± 0.0 C 0.0 ± 0.0 C
p-value *** *** ***
Fusarium sp.
Severity on Roots Frond Weight Loss (%) Root Weight Loss (%)
Soil Isolates
F. proliferatum (n = 12) 3.5 ± 0.8 A 49.3 ± 14.0 A 71.0 ± 13.0 A
F. oxysporum (n = 49) 2.3 ± 1.1 B 20.9 ± 14.9 B 47.9 ± 20.3 B
Control (n = 4) 0.0 ± 0.0 C 0.0 ± 0.0 C 0.0 ± 0.0 C
p-value *** *** ***
Mean ± standard error of final scores are averaged over the number of isolates for each species. Significance through
ANOVA test for weight loss (*** significance level at p < 0.001), all-pairwise comparisons were performed trough
LSD (less significant difference) at 99.9% confidence. Significance through Kruskal–Wallis test for disease severity
(*** significance level at p < 0.001), comparisons of mean ranks were performed at 99.9% confidence. x FSSC root
weight loss was evaluated as 0, because the original value was negative, although there was not significance.
In the case of plant isolates, for 54.5% of F. proliferatum isolates, more than 75% of inoculated plants
died at the end of the experiment, while this high mortality was induced by only 20% of F. oxysporum
isolates and 25% of F. redolens isolates (Figure 7A). In addition, all F. proliferatum, F. oxysporum and
F. redolens isolates produced damages on the asparagus root system. Over 50% of F. proliferatum isolates
produced more than 60% of rot roots, while only 30% of F. oxysporum and 25% of F. redolens isolates were
so aggressive (Figure 7B). In the case of soil isolates, 16.7% of F. proliferatum isolates killed more than
50% of inoculated plants, while none of the F. oxysporum isolates induced mortality to more than 50%
of plants, and 46.9% of F. oxysporum isolates did not kill any plants at the end of the tests (Figure 7C).
However, all the isolates produced damages on the asparagus root system. For this symptom, 14.2% of
F. oxysporum and 50% of F. proliferatum isolates were highly pathogenic, rotting more than 80% of the
root system. The distribution of isolates by their aggressiveness based on root impact was different
for both species; all F. proliferatum isolates were moderate to highly pathogenic, while F. oxysporum
isolates ranged across all degrees of damages in a normal distribution (Figure 7D). This fact reveals the
diversity of F. oxysporum found in soils concerning pathogenicity, a reflection of the versatility and
biological heterogeneity for this species [43] (Gordon and Martyn, 1997). F. proliferatum was pathogenic
for all cases, even though the studied isolates came from soils, not from plant tissues.You can also read