Skull shape variation in extant pangolins (Pholidota: Manidae): allometric patterns and systematic implications - horizon ird
←
→
Page content transcription
If your browser does not render page correctly, please read the page content below
Zoological Journal of the Linnean Society, 2020, 188, 255–275. With 8 figures.

Skull shape variation in extant pangolins (Pholidota:
Manidae): allometric patterns and systematic
implications
SÉRGIO FERREIRA-CARDOSO1, , GUILLAUME BILLET2, , PHILIPPE GAUBERT3,4,
FRÉDÉRIC DELSUC1 and LIONEL HAUTIER1,5
1
  ISEM, Université de Montpellier, CNRS, IRD, EPHE, Montpellier, France
2
  Centre de Recherche en Paléontologie Paris (CR2P), UMR CNRS 7207, MNHN, CNRS, SU, Muséum
National d’Histoire Naturelle, Paris, France
3
  Laboratoire Evolution et Diversité Biologique (EDB), Université Paul Sabatier, Toulouse, France
4
  CIIMAR/CIMAR, Centro Interdisciplinar de Investigação Marinha e Ambiental, Universidade do Porto,
Porto, Portugal
5
  Mammal Section, Life Sciences, Vertebrate Division, The Natural History Museum, London, UK

Received 22 February 2019; revised 17 July 2019; accepted for publication 13 August 2019

Pangolins are among the most endangered groups of mammals, comprising eight extant species delineated into three
genera. Despite several studies dedicated to their skeletal anatomy, the potential taxonomic insight from cranial
morphological variation in extant Pholidota is yet to be assessed with modern geometric morphometric methods. We
present the first comprehensive study on the cranial morphology of extant pangolins and discuss its implications
for the taxonomy and evolution of the group. We performed landmark-based morphometric analyses on 241 museum
specimens to describe the variation in skull shape in seven of the eight extant species. Our analyses revealed genus-
and species-level morphological discrimination, with Asian species (Manis spp.) being grouped together, whereas
African pangolins present distinct skull shapes between small (Phataginus spp.) and large (Smutsia spp.) species.
Analyses of allometry also identified a set of traits whose allometric trajectories distinguish Asian from African
specimens. Finally, we uncovered intraspecific variation in skull shape in white-bellied pangolins (Phataginus
tricuspis) that partly corroborates recent DNA-based differentiation among biogeographically distinct populations.
Overall, our results shed light on the morphological diversity of the skull of these enigmatic myrmecophagous
mammals and confirm the genus-level classification and cryptic diversity within the white-bellied pangolin revealed
by molecular phylogenetics.

ADDITIONAL KEYWORDS: allometry – conservation – cryptic lineages – ontogeny – systematic.

                    INTRODUCTION                                   and more effective conservation management units
                                                                   (von Helversen et al., 2001; Hebert et al., 2004; Bickford
Extant pangolins [Pholidota (Weber, 1904) Manidae
                                                                   et al., 2007; Moraes-Barros et al., 2007; Galatius
(Gray, 1821)] are currently the most heavily poached
                                                                   et al., 2012; Hautier et al., 2014; Sveegaard et al.,
mammals in the world (Challender et al., 2014; Zhou
                                                                   2015; Gaubert et al., 2016). The eight extant pangolin
et al., 2014). The increasing demand for pangolin
                                                                   species are restricted to tropical and intertropical
scales in Chinese traditional medicine is driving this
                                                                   regions of sub-Saharan Africa and Southeast Asia
entire group to the brink of extinction. In that context,
                                                                   (Gaubert, 2011; Gaudin et al., 2019). They are
detailed morphological and genetic studies constitute
                                                                   classified in a single family (Manidae) within the order
a prerequisite to trace the geographical origin of seized
                                                                   Pholidota, which is most closely related to carnivores
specimens and may prove fruitful to delimitate new
                                                                   within placental mammals (Murphy et al., 2001a, b).
                                                                   Pangolins have evolved a set of highly distinctive
*Corresponding author. E-mail: sergio.ferreira-cardoso@            morphological traits, such as toothless jaws and an
umontpellier.fr

© 2019 The Linnean Society of London, Zoological Journal of the Linnean Society, 2020, 188, 255–275                            255
This is an Open Access article distributed under the terms of the Creative Commons Attribution Non-Commercial License
(http://creativecommons.org/licenses/by-nc/4.0/), which permits non-commercial re-use, distribution, and reproduction in any
medium, provided the original work is properly cited. For commercial re-use, please contact journals.permissions@oup.com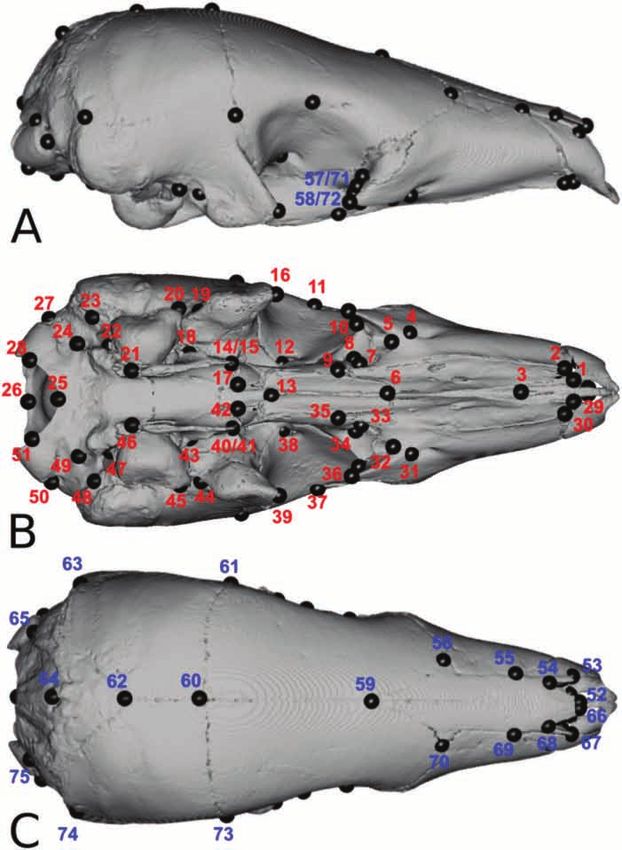
256 S. FERREIRA-CARDOSO ET AL.
elongated rostrum, linked to their highly specialized Here, we applied geometric morphometric methods
diet of ants and termites (Ferreira-Cardoso et al., 2019; to study the variation in shape of the skull within and
Gaudin et al., 2019). Despite this unique evolutionary among the eight extant pangolin species, with the aim
history and their current protection status, pangolins of assessing their current taxonomy and the recently
are among the least studied placental mammals, with identified molecular lineages. First, we examined the
some aspects of their phenotypic variation (i.e. cranial patterns of ontogenetic allometry in extant Pholidota
shape) still being completely unexplored (Gaubert using regression and trajectory analyses. Second, we
et al., 2018). explored the variation in cranial morphological among
The taxonomy of extant pangolins has been and within the three extant genera by performing
relatively unstable, varying from a single genus regression, ordination and discriminant analyses.
(Manis Linnaeus, 1758; Jentink, 1882; Emry, Finally, we investigated the variation in the shape of
1970) to six genera (Pocock, 1924). Based on both the skull in two wide-ranging species (P. tricuspis and
morphological and molecular phylogenetic studies, the M. javanica) in order to assess whether molecular-
four African species have been split into two genera based cryptic lineages (Gaubert et al., 2018; Nash
(Phataginus Rafinesque, 1821 and Smutsia Gray, et al., 2018) differ in skull shape.
1865), whereas the four Asian species remained in
a single genus (Manis) (Gaudin et al., 2009; Gaubert
et al., 2018). A recent molecular phylogeographical
MATERIAL AND METHODS
study also identified six cryptic lineages within the
widely distributed white-belied pangolin (Phataginus Biological sampling and data collection
tricuspis Rafinesque, 1821), showing an unexpected The material used in this study belongs to the collections
intraspecific molecular divergence (Gaubert et al., of the Natural History Museum (BMNH) in London
2016). Likewise, several genetic clusters have (UK), the Museum für Naturkunde (MfN) in Berlin
been identified in the range of the Sunda pangolin (Germany), the Muséum National d’Histoire Naturelle
(Manis javanica Desmarest, 1822), although their (MNHN) in Paris (France), the Royal Museum for
geographical delineation remains unclear (Zhang Central Africa (KMMA/RMAC) in Tervuren (Belgium),
et al., 2015; Nash et al., 2018). Many aspects of inter- the American Museum of Natural History (AMNH)
and intraspecific diversity of pangolins are still in New York (NY, USA) and the National Museum of
unexplored, and this newly described cryptic diversity Natural History (USNM) in Washington (DC, USA).
has great potential to influence regional conservation Our dataset is the result of the landmarking
policies and to identify the geographical origin of of 243 specimens from the eight extant species of
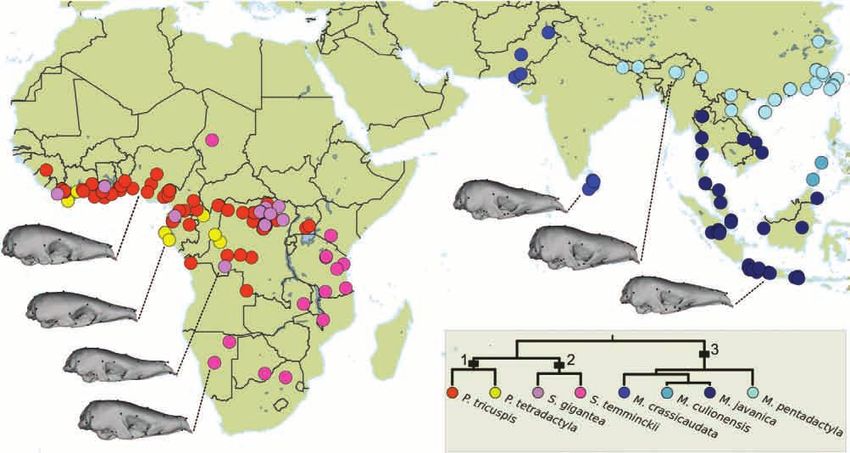
illegally trafficked specimens. pangolins (Fig. 1): P. tricuspis (Fig. 2; white-bellied
Geometric morphometrics has proved to be an pangolin, N = 97), Phataginus tetradactyla (Linnaeus,
efficient way to define the patterns of shape variation 1766) (black-bellied pangolin, N = 23), Smutsia gigantea
associated with species delimitation (interspecific (Illinger, 1815) (giant ground pangolin, N = 16), Smutsia
taxonomy; e.g. Cardini & O’Higgins, 2004; Villemant temminckii (Smuts, 1832) (Cape pangolin, N = 21),
et al., 2007) and to unveil hidden morphological Manis crassicaudata Geoffroy, 1803 (Indian pangolin,
variation (intraspecific taxonomy; e.g. Hautier et al., N = 10), M. javanica (Sunda pangolin, N = 38), Manis
2014, 2017; Miranda et al., 2018). Such methods pentadactyla Linnaeus, 1758 (Chinese pangolin, N = 36)
also enable us to understand the role of interactions and Manis culionensis (de Elera, 1915) (Palawan
between size and shape, with the variation in shape pangolin, N = 2; Supporting Information, Appendix
correlated with size (allometry) being one of the main S1). The skull shape of the Palawan pangolin could
factors contributing to the integrated evolution of not be assessed quantitatively owing to the low
cranial shape (Cardini & Polly, 2013; Klingenberg, number of specimens available and the relatively large
2013; Cardini, 2019). In mammals, ontogenetic and number of missing landmarks [a principal components
evolutionary allometry is mainly associated with analysis (PCA) including this species is provided in the
elongation of the rostrum (Cardini & Polly, 2013; Supporting Information, Fig. S1]. Taxa were identified
Cardini et al., 2015). However, the variation in based on a list of morphological criteria identified in
shape and size of the pangolin skull has never been the present study and in previously published works
described in detail or quantified formally, although the (Supporting Information, Appendix S2; Hatt et al.,
elongated, toothless snout constitutes one of the main 1934; Gaudin et al., 2009, 2019). Different sizes of skulls
characteristics of their skull. A precise characterization were included to account for the change in shape during
of the changes in shape associated with growth in ontogeny. Given the absence of teeth in pangolins, the
pangolins should enable us to understand the extent determination of age is not straightforward. For each
to which allometry has contributed to the evolution of species, juveniles were defined arbitrarily as those for
the skull. which size (estimated by the centroid size; see below) fell
2019 The Linnean Society of London, Zoological Journal of the Linnean Society, 2020, 188, 255–275
CRANIAL SHAPE VARIATION IN PANGOLINS                     257

Figure 1. Geographical distribution of the sampled specimens (N = 243) belonging to eight species of pangolins. Mean
shapes are illustrated for each species, except for Manis culionensis. The phylogenetic relationships used the branch lengths
from Gaubert et al. (2018). 1, Phatagininae; 2, Smutsiinae; 3, Maninae.

below the first quartile value (25% smallest specimens)          on a subset of our data for which sex determination
for each species.                                                was available (N = 120), in order to assess sexual
  We placed 75 three-dimensional landmarks on                    dimorphism in skull shape.
pangolin skulls using a Revware MicroScribe M 3D
digitizer (Fig. 3; Supporting Information, Table S1).
Our selection of landmarks was based on previous                            Allometry in extant pangolins
works focused on mammalian taxa (e.g. Goswami,                   The study of allometry can focus on three different levels
2006; Hautier et al., 2017). In a significant number             (Cheverud, 1982; Klingenberg, 2016). Morphological
of specimens, the premaxillae were absent, loosely               changes can be associated with phylogenetic differences
attached or broken and could not be landmarked. In               in size (evolutionary allometry), variation in size
pangolins, the jugal bone is often absent. However,              within a single ontogenetic stage (static allometry)
some M. pentadactyla specimens presented a complete              or variation in size attributable to individual growth
zygomatic arch (see also Emry, 2004). In such cases, the         within a single species (ontogenetic allometry; e.g.
landmarks 58/72 (zygomatic process of the maxillae)              Foth et al., 2016; Esquerré et al., 2017; Gray et al.,
were hard to define accurately. They were therefore              2019). Here, we quantified evolutionary allometry
considered as missing and estimated a posteriori.                and considered three traits of ontogenetic allometric
  Thin plate spline interpolations (Gunz et al., 2009)           trajectories: direction (slope), magnitude (length) and
were computed to estimate missing landmarks for each             intercept. These aspects were controlled/investigated
group (e.g. species, cryptic lineages). This approach            with three different analyses.
was implemented in the software package ‘geomorph’                  First, a phylogenetic multivariate regression
v.3.5.0 (Adams et al., 2017) in R (R Development                 of the mean shape of adult specimens (N = 173)
Core Team, 2013). A generalized Procrustes analysis              against log-centroid size was performed to assess
(Rohlf & Slice, 1999) was performed on all sets of               evolutionary allometry. This analysis was performed
landmarks. All specimens were scaled to centroid size,           with procD.pgls from ‘geomorph’ using a consensus
optimally translated and rotated using a least-squares           phylogeny from Gaubert et al., (2018). Then, we
criterion. The coordinates retrieved by the generalized          focused on ontogenetic allometry using interspecific
Procrustes analysis represented the shape of the                 (N = 241) and intraspecific datasets. The cryptic
skull of each specimen. An ANOVA was performed                   lineages dataset including P. tricuspis included only

2019 The Linnean Society of London, Zoological Journal of the Linnean Society, 2020, 188, 255–275
258     S. FERREIRA-CARDOSO ET AL.

Figure 2. Map of Africa, with the locations of the sampled Phataginus tricuspis (N = 96) coloured according to the cryptic
lineage (Gaubert et al., 2016) to which they were attributed (right). The tree topology of the intraspecific affinities is based
on Gaubert et al. (2018).

96 specimens (Fig. 2; KMMA 30808 was discarded                    graphical representations of allometric trajectories
owing to imprecise information on location). Details              and skull shape deformations (Adams & Nistri,
about the analysis of the M. javanica dataset can be              2010; Esquerré et al., 2017). We plotted the first
found in the Supporting Information (Appendix S3).                principal component (PC1) of the predicted values of
First, a multivariate regression was performed to                 multivariate regression of shape on log-centroid size
assess covariation patterns between the logarithm of              vs. log-centroid size regressions for each species. We
the centroid size and Procrustes-aligned coordinates              then assessed the significance of differences between
(raw shapes) using procD.lm from ‘geomorph’. The                  the intercepts using a Tukey means comparison,
hypothesis of parallel group slopes was assessed with             to test for changes in shape explained by species
a homogeneity of slopes (HOS) test. This test consists            differences in the resulting morphospace. Thin plate
of an analysis of covariance (ANCOVA) to assess the               splines were generated using the function tps3D
influence of size, groups and the interaction of size and         from the R package ‘Morpho’ v.2.5.1 (Schlager, 2017)
groups on skull shape. The HOS test includes pairwise             in order to characterize differences in shape between
comparisons between groups (species/cryptic lineages)             the smallest and the largest specimens for each
to assess significant differences of both the direction           species (ontogenetic allometry). We then visualized
(angles) and magnitude (amount of change in shape                 landmark displacement during ontogeny using the
with size) of allometric trajectories. Significance was           function deformGrid3d from the same package.
assessed with a residual randomization permutation                A phenotypic trajectory analysis (PTA) was also
procedure with 10 000 iterations. The HOS tests were              performed as a complementary analysis to the HOS
performed with advanced.procD.lm from the package                 test (see Supporting Information, Appendix S3; Adams
‘geomorph’. The HOS tests were complemented by                    & Collyer, 2009; Collyer & Adams, 2013).

                              2019 The Linnean Society of London, Zoological Journal of the Linnean Society, 2020, 188, 255–275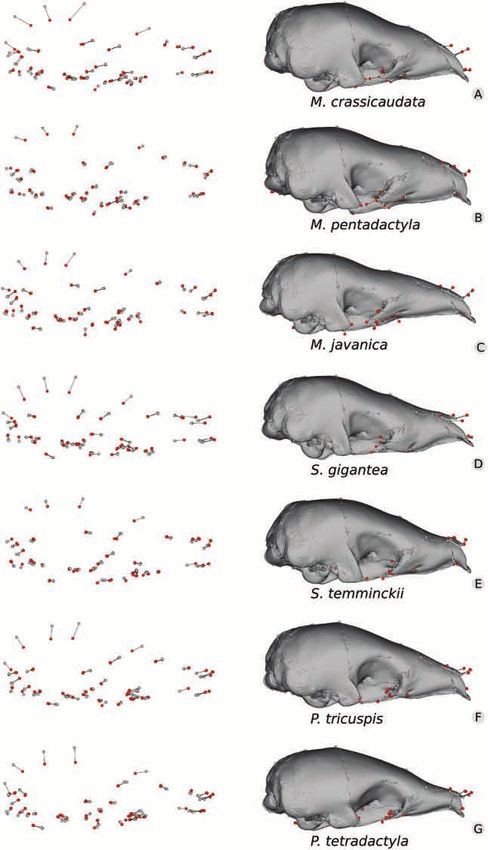
CRANIAL SHAPE VARIATION IN PANGOLINS                  259

Figure 3. Landmarks digitized on the skull of Phataginus tricuspis (BMNH 34.6.2.92) in lateral (A), ventral (B) and dorsal
(C) views. Red and blue numbers represent landmarks placed ventrally and dorsally, respectively.

  Second, when the HOS test revealed parallel                    (x = 0). The overlap test was performed only on the
trajectories, we performed an additional analysis                interspecific dataset.
(overlap test) on multivariate shape data to test                  Finally, if slopes were overlapping between
for overlap in ontogenetic allometric trajectories               species, a third analysis was performed to identify
by comparing their differences with a set of 10 000              peramorphosis/paedomorphosis. This ‘heterochrony
permutations (Piras et al., 2011; Esquerré et al., 2017).        test’ enables the characterization of differences in
Intercepts were tested at x = 5.125, because we lacked           skull shape at maximum size (Piras et al., 2011;
fetuses and neonates of small size (close to x = 0), which       Esquerré et al., 2017). Significance was assessed
could result in an incorrect estimate of minimum size            by comparing these differences with a set of 10 000

2019 The Linnean Society of London, Zoological Journal of the Linnean Society, 2020, 188, 255–275
260 S. FERREIRA-CARDOSO ET AL.
permutations. This test was performed only on the describe the intraspecific variation in skull shape
interspecific dataset. (N = 71). We used the cryptic genetic lineages defined
by Gaubert et al. (2016) to test the variation in skull
shape linked to geographical distribution within
Visualization of shape variation and P. tricuspis. Specimens were sorted according to six
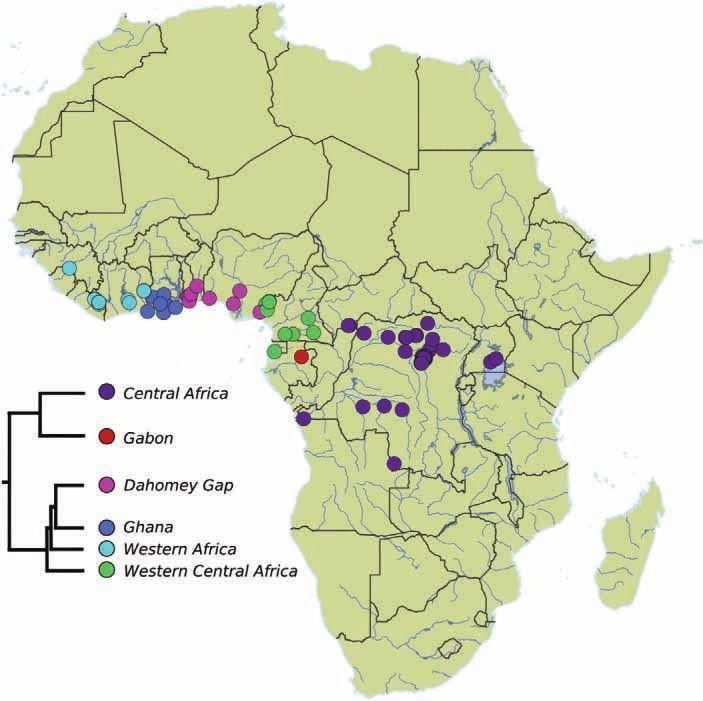
statistical analysis regions (Fig. 2): Western Africa (WAF), Ghana (GHA),
The variation of skull shapes was visualized using a Dahomey Gap (DHG), Western Central Africa (WCA),
PCA (Dryden & Mardia, 1993). Data were analysed Central Africa (CAF) and Gabon (GAB). Skull shape
without allometric correction in order to allow for difference tests and cross-validated LDA described in
a comparison of the results with morphological the previous paragraph were repeated on this dataset.
discrete characters used in phylogenetic analyses. If a posteriori attribution errors were consistently
Analyses with the allometry-corrected shapes for the detected between two regions, these were merged,
interspecific and P. tricuspis datasets can be found in and the protocol was repeated with the new specimen
the Supporting Information (Appendix S3). Allometry- sorting in order to test for its potential in assigning
corrected shapes were obtained as the residuals of specimens with unknown geographical origin.
pooled within-group regressions. This method is used An equivalent protocol was applied to assess
to obtain a common estimate for the allometry when intraspecific variation in the skull of M. javanica. The
comparing several groups (Sidlauskas et al., 2011; geographical delimitation of cryptic lineages within
Benítez et al., 2013; Klingenberg, 2016). Pooled within- this species is still uncertain (Zhang et al., 2015; Nash
group regressions were performed in MorphoJ v1.06d et al., 2018). These preliminary analyses can be found
(Klingenberg, 2011). For simplicity, when PCAs were in the Supporting Information (Appendix S3).
performed on allometry-corrected shapes, axes were The original landmark coordinates used in this
designated as PCres. study are provided in the Supporting Information
(Appendix S1).
Interspecific variation in extant pangolins
A PCA was performed excluding specimens considered
as juveniles (N = 173). A second PCA was performed RESULTS
on a dataset including juveniles and two specimens of Allometry in extant pangolins
M. culionensis (N = 243). We used a .ply surface of a A multivariate regression (Table 1) performed on raw
micro-computed tomography-scanned P. tricuspis skull shape variables revealed significant effects of log-
(BMNH 34.6.2.92), the species most closely resembling transformed centroid size (F1,227 = 103.59, P < 0.001,
the mean shape. The surface was then deformed to the R2 = 0.16), species grouping (F6,227 = 49.63, P < 0.001)
mean skull shape of Pholidota and used to visualize the and of an interaction between centroid size and species
variation in skull shape along the first three principal grouping (F 6,227 = 1.35, P < 0.001) on shape. When
components (PCs). Triangular mesh warping via thin we accounted for phylogeny, the effect of size was
plate spline was performed with the package ‘Morpho’. marginally non-significant (P = 0.09), with evolutionary
A multivariate ANOVA was performed to assess allometry explaining roughly one-third of skull shape
whether skull shape differed between taxonomic variance (R2 = 0.27; Supporting Information, Table S2).
groups. Pairwise comparisons between least- The non-significant P-value was probably attributable
squares means were performed using advanced. to the low number of species (N = 7). The HOS test
procD.lm. If taxonomy had a significant effect on
skull shape, a leave-one-out cross-validated linear
discriminant analysis (LDA) was performed on a set Table 1. ANOVA of shape (Procrustes coordinates) ~
of PCs explaining 90% of variance. The leave-one- log(centroid size)*species
out procedure allows evaluation of the accuracy with
which unknown specimens can be identified (e.g. Evin d.f. R2 F P-value
et al., 2013). Linear discriminant analyses and post
hoc classification methods were performed with the Log(centroid size) 1 0.16 103.59 < 0.001*
‘MASS’ package (Venables & Ripley, 2002) in R. Species 6 0.47 49.63 < 0.001*
Log(centroid size):species 6 0.01 1.35 < 0.001*
Residuals 227 0.37 – –
Intraspecific variation in P. tricuspis and Total 240 – – –
M. javanica
The randomized residual permutation procedure used 10 000
A second subset including only adult P. tricuspis permutations.
specimens was analysed separately in order to *Significant P-value.
2019 The Linnean Society of London, Zoological Journal of the Linnean Society, 2020, 188, 255–275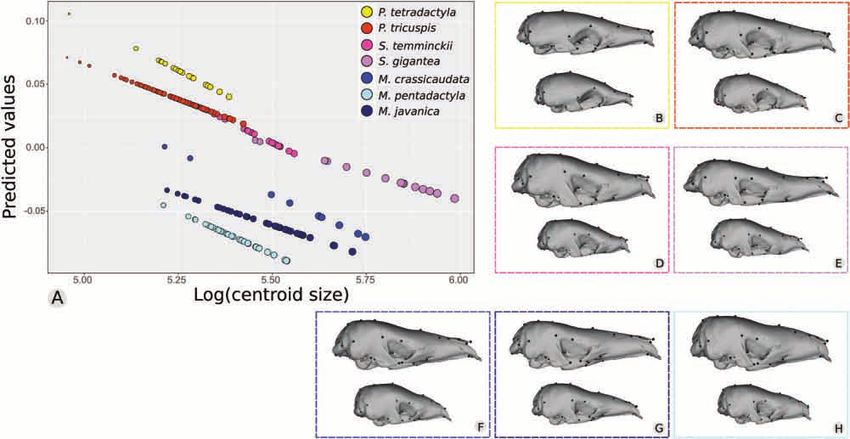
CRANIAL SHAPE VARIATION IN PANGOLINS                   261

pairwise comparisons of ontogenetic allometric                   Information, Table S9). Considering the predicted
trajectories revealed small, significant differences             shapes for minimum and maximum size resulting
(low z-values) between the slopes of S. gigantea                 from the multivariate regression, the main size-related
compared with both M. javanica and M. pentadactyla               intraspecific morphological change was the increase in
(Supporting Information, Table S3). The remaining                length of the rostrum (Figs 4, 5). Landmarks in the
species did not present significantly different slope            anterior part of the nasal and maxilla tended to be more
angles, which implied that allometric trajectories were          anterodorsally positioned, and the nasal projected
parallel within each genus. The results for the PTA are          more posteriorly (e.g. Fig. 4, 5). The braincase was
presented in the Supporting Information (Appendix                relatively lower in the adult, across all species, with
S3; Fig. S2; Tables S4 and S5).                                  the dorsal landmarks on the midline of the skull being
   The ontogenetic allometric trajectories overlapped            more ventral when compared with their position in the
in most species presenting parallel slopes except for            juveniles (Fig. 5). Additionally, the landmarks placed
P. tricuspis (Supporting Information, Table S6). The             on the zygomatic process of the maxilla and associated
trajectory for P. tetradactyla overlapped with all the           structures (Fig. 3; landmarks 10, 57 and 58) showed
others except those of M. javanica and P. tricuspis.             a tendency to project more posteriorly in larger
When comparison of the intercepts was performed                  specimens (Fig. 5A–D). In contrast, S. temminckii
considering shape predictions for x = 0, the ontogenetic         showed no allometric growth of the posterior projection
allometric trajectories overlapped in all species                of the zygomatic processes (Fig. 5E). In contrast, this
(Supporting Information, Table S7). The heterochrony             species presented the most significant change in the
test showed that all species with overlapping                    anterior projection of the zygomatic process of the
trajectories presented heterochronic shifts with                 squamosal, with this structure being noticeably less
respect to each other (Supporting Information, Table             projected in smaller specimens (Fig. 5E).
S8).
   The intercepts of the regressions of predicted
                                                                   Interspecific variation of the skull shape in
values of shape against size (Fig. 4) were relatively
                                                                                     extant pangolins
distinct within Phataginus and Manis, whereas both
Smutsia species presented overlapping trajectories,              A Procrustes ANOVA revealed that both sex
as revealed by the Tukey comparisons (Supporting                 (F1,105 = 1.80, P = 0.085; F1,106 = 2.03, P = 0.057) and

Figure 4. Allometric trajectories among seven pangolin species (N = 241). A, the x-axis values are the log-transformed
centroid sizes for each specimen; the y-axis values are the principal component 1 of the predicted values of a multivariate
regression of shape on size. B–H, deformed meshes for the maximum (top) and minimum (bottom) shapes predicted from a
multivariate Procrustes regression for each species are presented.

2019 The Linnean Society of London, Zoological Journal of the Linnean Society, 2020, 188, 255–275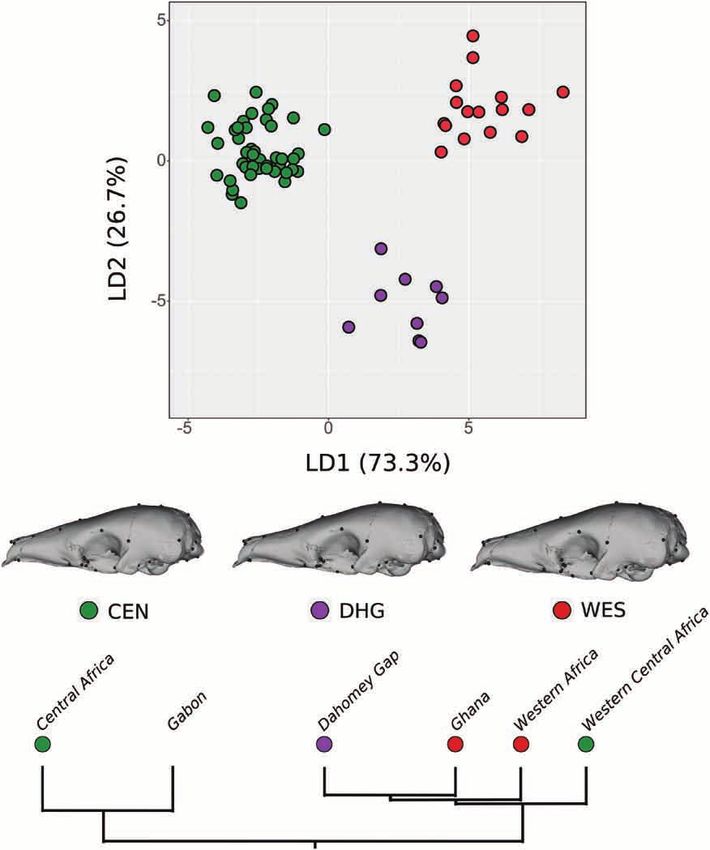
262    S. FERREIRA-CARDOSO ET AL.

Figure 5. Mapping of ontogenetic variation in shape in seven pangolin species. A, Manis crassicaudata. B, Manis
pentadactyla. C, Manis javanica. D, Smutsia gigantea. E, Smutsia temminckii. F, Phataginus tricuspis. G, Phataginus
tetradactyla. Grey dots represent relative Procrustes coordinates positions in the juvenile (minimum-sized specimen), and
red dots represent coordinates for the adult (maximum-sized specimen). Deformed meshes corresponding to juveniles were
superimposed with the three-dimensional Procrustes coordinates.

                            2019 The Linnean Society of London, Zoological Journal of the Linnean Society, 2020, 188, 255–275
CRANIAL SHAPE VARIATION IN PANGOLINS 263 the interaction between sex and species grouping negative scores). Juvenile specimens of Asian species (F6,105 = 0.89, P = 0.656; F6,106 = 1.07, P = 0.332) did were characterized by less positive PC1 values, plotting not significantly influence shape, with and without closer to African pangolins (see ‘Results: allometry considering size as a covariate in the model, respectively within extant pangolins’; Supporting Information, Fig. (N = 120; Supporting Information, Table S10). The S1). Procrustes ANOVA performed with the adult dataset Principal component 2 was positively correlated revealed a significant effect of species on skull shape with a long rostrum, a long posterior projection of the (F6,166 = 45.02, P < 0.001; Table 2). Pairwise comparisons premaxilla on the midline, an anterolaterally projecting showed that all species presented significantly zygomatic process of the squamosal and a braincase different skull shapes (Supporting Information, Table with a pseudorectangular shape in dorsal view (Fig. 6). S11). The variation in skull shape was visualized using Principal component 2 separated the three species of a PCA performed on the raw shape variables of the Manis and the two Smutsia. Smutsia temminckii and seven pangolin species (Fig. 6). The results of a PCA M. pentadactyla scored the lowest PC2 average values, including juveniles and M. culionensis (Supporting whereas M. javanica scored the highest. Phataginus Information, Fig. S1) and a full analysis of allometry- spp., S. gigantea and M. crassicaudata presented PC2 corrected skull shape are presented in the Supporting scores ranging in between the two groups. Information (Appendix S3; Fig. S3; Tables S12, Principal component 3 scores were positively S13). Despite the non-parallel slopes, the variance correlated with the anterior projection of the anterior explained by the interaction between size and species flanges of the frontal, a wide and long palatine, a long was relatively low (Table 1), allowing us to use the infraorbital canal, an anteroposteriorly elongated residuals of a multivariate regression of shape on size dorsal edge of the zygomatic processes of the squamosal as allometry-corrected shapes. and posteriorly projected pterygoid hamuli (Fig. 6B). Linear regressions performed on the first 30 PCs This axis separated species within Phataginus and (90%) showed that size was significantly correlated Smutsia. Phataginus tetradactyla scored extremely with PCs 1–4 and PC7 (Supporting Information, positive PC3 values, whereas S. gigantea scored the Table S14). Size-related morphological changes most negative PC3. The three Manis species and captured by PC1 appeared to be associated mainly S. temminckii presented values slightly above zero, with evolutionary allometry, whereas change in shape on average, and P. tricuspis showed mostly negative along PC2 recovered differences related to ontogenetic values, but not as negative as S. gigantea (Fig. 6B). allometry. The first two PCs explained 49.59% of the An LDA was performed to take 90% of the variance total variance (33.95 and 15.64%, respectively). into account (first 30 PCs). Linear discriminant analysis Principal component 1 was positively correlated group a posteriori probabilities retrieved 100% accuracy with a high and wide rostrum, a nasofrontal inflation for species attribution (Supplemental Information, associated with an orbital constriction, posteriorly Appendix S4). Specimens were grouped by species and projected zygomatic processes of the maxillary and were well discriminated on linear discriminants 1 and a high and wide braincase, with dorsal squamosal- 2 (LD1, 54.0%; LD2, 15.6%; Fig. 6C, D). Asian pangolin parietal-frontal junctions. African specimens tended to skulls presented negative LD1 values, whereas display mostly negative PC1 scores, whereas the Asian African pangolins scored both negative (Smutsia) and clade exhibited positive PC1 scores (Fig. 6A, B). The sole extremely positive values (Phataginus; Fig. 6C, D). exception was the African S. gigantea, which presented The three species of Maninae Gray, 1821 resembled positive PC1 values and grouped with Asian specimens each other the most, being discriminated only by LD2. (Fig. 6). Principal component 1 also separated the Within the African clade, LD2 discriminated the two two African genera (Phataginus presented the most Phataginus species (P. tetradactyla showed the highest Table 2. ANOVA of shape ~ taxa/geographical groups of adult specimens of the interspecific and Phataginus tricuspis datasets Datasets N taxa/geo N d.f. R2 F P-value Interspecific 7 173 166 0.62 45.02 < 0.001* P. tricuspis (Gaubert et al., 2016) 6 70 65 0.16 3.12 < 0.001* P. tricuspis (geographical groups) 3 70 67 0.11 4.23 < 0.001* The randomized residual permutation procedure used 10 000 permutations. Significant P-values indicate differences between skull shapes of taxa/ geographical groups. Abbreviation: N taxa/geo, number of taxa or geographical groups used as factors. *Significant P-value. 2019 The Linnean Society of London, Zoological Journal of the Linnean Society, 2020, 188, 255–275
264    S. FERREIRA-CARDOSO ET AL.

Figure 6. Principal components (A, PC1 vs. PC2; B, PC1 vs. PC3) and linear discriminant analyses (C, LD1 vs. LD2; D, LD1
vs. LD3) with associated variation in shape for crania of seven pangolin species (N = 173).

LD2 values). Smutsia temminckii and S. gigantea were           P < 0.001) had a highly significant effect on the cranial
well discriminated by LD1. Smutsia spp. showed the             shape (Table 3). It also retrieved a significant effect
highest LD3 values.                                            of the interaction between size and geographical
  The analyses on the allometry-corrected shapes               distribution (F 4,84 = 1.11, P = 0.001). However, the
revealed some differences that are discussed in detail         pairwise matrix effect sizes were relatively small, and
in the Supporting information (Fig. S3; Tables S12             corresponding P-values were not significant. Therefore,
and S13).                                                      all cryptic lineages presented parallel allometric
                                                               trajectories (Supporting Information, Fig. S4; Table
 Intraspecific variation of the skull shape in                 S15). A Procrustes ANOVA revealed that cryptic
                  extant pangolins
                                                               lineages presented different skull shapes (F4,65 = 3,12,
                                                               P < 0.001; Table 2). Pairwise comparisons showed
Intraspecific variation in P. tricuspis                        that all tested cryptic lineages presented significantly
A multivariate regression revealed that log-                   different skull shapes except for Ghana and Western
transformed centroid size (F1,84 = 11.56, P < 0.001) and       Africa (Supporting Information, Table S16) Gabon was
geographical distribution (cryptic lineages; F4,84 = 3.71,     not tested owing to lack of replicates.

                            2019 The Linnean Society of London, Zoological Journal of the Linnean Society, 2020, 188, 255–275
CRANIAL SHAPE VARIATION IN PANGOLINS 265
Table 3. ANOVA of shape (Procrustes coordinates) ~ (see Supporting Information, Appendix S4). The vast
log(centroid size)*Phataginus tricuspis cryptic lineages majority of incorrect attributions were found in the
(N = 96) major divisions WAF–GHA and CAF–WCA. Based
on this result, we performed an additional LDA with
d.f. R2 F P-value a priori attributions of WAF–GHA specimens to a
western group (WES) and CAF–WCA specimens
Log(centroid size) 1 0.10 11.56 < 0.001*
to an eastern group (CEN), while keeping DHG
Cryptic lineages 5 0.15 3.71 < 0.001*
as a separate group (Fig. 8). Group a posteriori
Log(centroid size):cryptic 4 0.04 1.11 0.001*
probabilities of the LDA of the three groups shows
lineages
an attribution accuracy of 95.7% (see Supporting
Residuals 85 0.71 – –
Information, Appendix S4).
Total 95 – – –
The additional LDA discriminated CEN from WES
and DHG groups along LD1 (73.3%). LD2 (26.7%)
The randomized residual permutation procedure used 10 000
permutations. discriminated CEN and WES from DHG groups. We
*Significant P-value. tested the statistical significance of the intraspecific
variation in the three groups identified above.
Principal component 1 explained 12.8% of the A Procrustes ANOVA revealed a significant effect of
variance of cranial shape within P. tricuspis and was the division of P. tricuspis into three morphological
positively correlated with a larger skull height and groups, WES, DHG and CEN (F2,67 = 4.23, P < 0.001;
width, an anteroposteriorly short orbit, large tympanic Table 2). Pairwise comparisons showed that all
bullae and a relatively round occipital region. groups presented significantly different skull shapes
Specimens from Central Africa mostly scored negative (Supporting Information, Table S17). We calculated
PC1 values (Fig. 7A, B). On average, specimens from the mean shapes for each group (Supporting
WAF and GHA presented the most positive PC1 scores. Information, Fig. S5). The WES skulls presented the
The Western Central African cluster also presented shortest and widest rostrum, a relatively elongated
mostly positive PC1 scores, whereas specimens from infraorbital canal and the longest zygomatic process
the Dahomey Gap presented a wide range of PC1 of the maxillary. The DHG skulls presented the widest
scores, varying from negative to positive values. The nasals posteriorly, the most posterior projections of
only specimen from Gabon scored negative PC1 values, the maxilla into the palatine and the most posterior
plotting near the CAF morphospace. ventral margin of the foramen magnum. Skulls from
Principal component 2 explained 9.7% of the the CEN region were characterized by the narrowest
variance and was positively correlated with a shorter rostra, the smallest tympanic bullae and the most
palate with short maxillary projections, anteriorly anterior petrosal–squamosal–exoccipital intersection.
projecting squamosal roots and shorter tympanic The analyses on the allometry-corrected shapes
bullae well separated from the postglenoid foramina. revealed similar results (Supporting Information,
Although specimens from CAF had a wide distribution Appendix S3; Fig. S6; Tables S12, S18, and S19).
along PC2, WCA, WAF and GHA presented a much
narrower range of PC2 scores in the middle of the
distribution. On average, DHG presented the most Intraspecific variation in M. javanica
negative PC2 values. The analyses on the M. javanica dataset showed
Principal component 3 explained 6.4% of the that differences in shape were solely explained by
variance (Fig. 7B) and did not segregate specimens differences in size (Supporting Information, Figs S7,
according to geographical origin. S8; Tables S12 and S20).
The LDA performed on the first 34 PCs (90%
variance) discriminated WAF–GHA, DHG and
CAF–WCA cryptic lineages, along LD1 (59.1%) (Fig. DISCUSSION
7C). Western Africa–Ghana presented the most
positive LD1 values, whereas CAF–WCA specimens Size influences skull shape in extant pangolins
presented mostly negative LD1 values (Fig. 7C, Size explained a significant part of the total
D). Specimens from DHG presented intermediate variation in skull shape among species within the
positive LD1 values. LD2 (23.7%) discriminated DHG Pholidota (evolutionary allometry; Table 1; Fig. 4;
skulls (negative values) from all other cryptic lineage Supporting Information, Fig. S2; Table S2). The
specimens (Fig. 7C). LD3 (13.0%) discriminated the HOS and PTA tests showed that the directions
WCA specimens (most positive values) from the of ontogenetic trajectories were conserved among
remaining lineages (Fig. 7D). Group a posteriori pangolins, with only M. javanica and M. pentadactyla
probabilities retrieved a 75.4% attribution accuracy differing significantly from S. gigantea (HOS) and
2019 The Linnean Society of London, Zoological Journal of the Linnean Society, 2020, 188, 255–275266 S. FERREIRA-CARDOSO ET AL.
Figure 7. Principal components (A, PC1 vs. PC2; B, PC1 vs. PC3) and linear discriminant analyses (C, LD1 vs. LD2; D,
LD1 vs. LD3) with associated variation in shape for crania of six cryptic lineages of Phataginus tricuspis (N = 71; Gaubert
et al., 2016).
P. tricuspis (PTA; Supporting Information, Tables S4 suggests that cranial morphology is similar in early
and S5). Ontogenetic trajectory angles did not differ developmental stages. The heterochrony test showed
within clades, which is consistent with observations that more than half of the pairwise comparisons
that intraspecific (ontogenetic and/or static) allometric performed (12 out of 19) revealed heterochronic
trajectories tend to differ as species divergence time changes. In fact, when the overlap test was performed
increases (Voje et al., 2014; Esquerré et al., 2017). taking size = 0 as reference, heterochrony was detected
Significant differences between the intercepts of for all 19 comparisons (Supporting Information,
multivariate regressions (overlap test) were found Tables S6 and S7). This could suggest a major
only between P. tricuspis and all other species and pattern of heterochrony driving the differentiation
between P. tetradactyla and M. javanica. With the between the Asian and African clades, the first being
exception of the difference in intercept between the putatively peramorphic by presenting longer rostra
two Phataginus species, significant P-values were and longer zygomatic processes of the maxilla (traits
relatively close to 0.05 (i.e. same order of magnitude). associated with the PC1 of the predicted values; Figs
This indicates that allometric trajectories are 4, 5). However, given the absence of fetuses in our
still relatively preserved across the Pholidota and analyses, predictions of shape at minimum size (x = 0)
2019 The Linnean Society of London, Zoological Journal of the Linnean Society, 2020, 188, 255–275CRANIAL SHAPE VARIATION IN PANGOLINS 267 Figure 8. Linear discriminant analysis of the Phataginus tricuspis sample (N = 70) divided into three management units. Consensus shapes (mean shapes) of the proposed management units in lateral view. A, Central African region (CEN). B, Dahomey Gap region (DHG). C, western African region. Black dots are landmark positions. should be considered with caution. Additionally, the in the intercepts, despite the non-significance yielded heterogeneity of sampling between species might have (Amrhein et al., 2019). influenced the significance of the overlap test, given Moreover, African and Asian clades clearly presented that the largest differences between intercepts were non-overlapping ontogenetic allometric trajectories for not necessarily significant (Supporting Information, traits correlated with PC1 of the predicted values of Table S6). The generally low P-values from the overlap multivariate regression of shape on size (Fig. 4), with test (P < 0.23) might reflect substantial differences African species sharing a higher intercept relative 2019 The Linnean Society of London, Zoological Journal of the Linnean Society, 2020, 188, 255–275
268    S. FERREIRA-CARDOSO ET AL.

to Asian ones. We interpret this size–shape space as          towards the Maninae (Asian pangolins) morphospace
a good representation of the evolutionary allometry.          is attributable, in part, to the elongation of the skull
Considering that parameters of modelled growth                associated with size (Fig. 5). Larger species with
trajectories can be used efficiently as continuous            more elongated rostra (Smutsia gigantea and Manis)
characters in phylogenies (Bardin et al., 2017),              additionally present deep nasal notches (Supporting
these different intercept values could theoretically          Information, Fig. S9).
constitute a valuable character to distinguish                   Evolutionary patterns of ontogenetic allometry
members of the Asian and African clades. In fact, they        should therefore be taken into account in morphology-
corroborate previous morphology- and DNA-based                based studies. For instance, when looking at cranial
results (Gaubert et al., 2018) that described a split of      character states in the morphology-based phylogeny
the extant Manidae into two continental clades. The           from Gaudin et al. (2009), the depth of the nasal
differences in the ontogenetic allometric patterns            notch (character 306; Gaudin et al., 2009) appears to
between the two size–shape spaces (multivariate vs.           be associated with size. The small-sized Phataginus
PC1 of the predicted values) might also suggest strong        species are the only ones presenting shallow nasal
cranial modularity (i.e. rostrum module; Goswami,             notches (Supporting Information, Fig. S9). The
2006). Cranial modules evolve semi-independently,             relative length of the parietal–squamosal suture
and allometric patterns detected for highly integrated        (character 385; Gaudin et al., 2009) also appears to
modules might differ from the overall pattern (Gerber         be influenced by allometry (Figs 4, 5). The parietal–
& Hopkins, 2011). Further analyses are needed to              squamosal suture is relatively longer in skulls with
confirm this hypothesis but would be beyond the scope         shorter snouts, which is the case in Phataginus species
of the present study.                                         (the smallest pangolins) that show a relatively long
   Heterochronic changes are better illustrated by the        parietal–squamosal suture. This is to be expected,
ontogenetic allometric trajectories of the two Smutsia        because skull length is influenced mostly by elongation
species (Fig. 4; Supporting Information, Tables S6–           of the rostrum in larger species (Figs 4, 5). According
S8), as they overlap in both size–shape and shape             to Gaudin et al. (2009), S. temminckii is the only
spaces (Supporting Information, Fig. S1; Mitteroecker         species presenting a multistate for this character
et al., 2005; Esquerré et al., 2017). Both PC1 of the         [< 25% greatest skull length (0) or > 25% (1)], which
predicted values and multivariate regressions suggest         is congruent with its short snout and intermediate
that S. temminckii is paedomorphic, because it tends          average size between that of Phataginus spp. and that
to resemble juvenile S. gigantea (peramorphic).               of Manis spp. and S. gigantea (Fig. 4). These results
Nevertheless, heterochrony is not always associated           therefore call for a revision of some characters included
with close phylogenetic affinities. Differing ontogenetic     in morphological matrices used to reconstruct extant
allometric trajectories between closely related species       and extinct pangolin phylogenetic relationships.
were reported previously in hominids (Mitteroecker
et al., 2004). Despite being sister taxa, humans
and chimpanzees differ in skull shape from early               Patterns of skull shape variation support the
                                                                 classification of extant pangolins in three
ontogenetic stages. The allometric trajectories of the
                                                                                   distinct genera
two Phataginus species exhibit a similar pattern (Fig.
4; Supporting Information, Table S6). Both species            Based on morphological features, pangolins have
show rather distinct intercepts (distinct shapes from         been classified from a single genus (Manis) to a
early stages).                                                maximum of six different genera. In 1882, Jentink
   Overall, our results suggest that complex allometric       published a monograph on the comparative anatomy
changes played an important role in the morphological         of extant pangolins, except for M. culionensis,
evolution of the pangolin skull. All pangolins follow         in which he briefly referred to the remarkable
a similar ontogenetic trend characterized by the              differences between the skulls of the seven
elongation of the rostrum and a posterior projection          recognized species (Jentink, 1882). Nevertheless,
of the zygomatic process of the maxilla (Figs 4, 5). As       he ascribed all pangolin species to the same genus,
a consequence, the braincase is relatively smaller in         postponing a thorough investigation of skull
larger species. These ontogenetic patterns are in line        morphology. A division of pangolins into six different
with described patterns of evolutionary allometry             genera was later proposed by Pocock (1924), with
in which large-sized mammals evolve longer rostra             the African Smutsia (S. temminckii and S. gigantea),
(Cardini & Polly, 2013; Cardini et al., 2015; Cardini,        P. tricuspis, Uromanis longicaudata (Linnaeus, 1766)
2019). Our allometric and phenotypic trajectories             (P. tetradactyla) and the Asian M. pentadactyla,
(Fig. 4; Supporting Information, Fig. S2), associated         Paramanis javanica and Phatages crassicaudata.
with the thin plate spline deformations, enable us            This classification was based on external/soft tissue
to suggest that the ontogenetic drift of S. gigantea          characters only, but neglected cranial osteology.

                           2019 The Linnean Society of London, Zoological Journal of the Linnean Society, 2020, 188, 255–275
CRANIAL SHAPE VARIATION IN PANGOLINS 269 Although the African–Asian split has been widely of the differences in skull shape between S. gigantea accepted, and the Asian genera have generally been and S. temminckii. Although the shape of the skull of merged into the single genus Manis, genus-level S. gigantea is more similar to that of Asian pangolins, classifications have varied within the African clade. S. temminckii is closer to Phataginus (Fig. 6). In The four species have been ascribed either to a single addition to these substantial differences in skull shape genus, Phataginus (Patterson, 1978; Corbet & Hill, within Smutsia, previous molecular analyses reported 1991), or kept separate in three distinct genera, as a relatively large mitogenomic distance within the proposed by Pocock (1924; McKenna & Bell, 1997). genus (11.9%; Gaubert et al., 2018), although lower Recent phylogenies based on morphological traits than those reported within Phataginus (see below). (Gaudin et al., 2009) and molecular data (Gaubert The two Phataginus species present the largest et al., 2018) have supported the view of an Asian– intrageneric mitogenomic distance (14.3%; Gaubert African split, with the Asian genus, Manis (Maninae), et al., 2017). This distance is patent in PC3 and LD2 as the sister clade to the African pangolins composed scores, which clearly separate P. tetradactyla from of the two genera Phataginus (Phatagininae Gaubert, P. tricuspis (Fig. 6B, C). However, the cranial shape 2018) and Smutsia (Smutsiinae Gray, 1873). is more similar between the two Phataginus species Our results support the distinction of three than between the two Smutsia species (Supporting extant pangolin genera, as recognized in previous Information, Table S11). Phataginus tetradactyla was works (Gaudin & Wible, 1999; Koenigswald, 1999; previously ascribed to the genus Uromanis (Pocock, Gaudin et al., 2009; Gaubert et al., 2018). The PCAs 1924), but recent cladistic analyses based on osteological and LDAs (Fig. 6A, B) largely reflect the division of characters yielded a strong support for placement in extant Pholidota in Maninae (Asian; mostly positive the genus Phataginus, the best supported among all PC1 values) and Smutsiinae + Phatagininae. The genera (Gaudin et al., 2009). Of the seven unambiguous African clade was weakly supported in the most synapomorphies corresponding to cranial traits, the recent phylogeny based on anatomical characters orientation and size of the zygomatic process of the (Gaudin et al., 2009). In all analyses excluding fossil squamosal (character 355; Gaudin et al., 2009) is coded taxa, Smutsia spp. are recovered as a sister group as ventrally directed and short dorsoventrally for both to Maninae (Gaudin et al., 2009). This might be species of tree pangolin. We confirmed this character explained, in part, by the detected allometric effect state (Fig. 6A; PC1), but additionally found that (see ‘Discussion: Size influences skull shape in extant the shape of this process in the horizontal direction pangolins’; Fig. 4; Supporting Information, Fig. S2). constitutes one of the main differences between the Nevertheless, both the PCA (Fig. 6B) and LDA (Fig. two species, with P. tetradactyla presenting the longest 6C, D) reveal the grouping of all Manis species to the among all pholidotans (Fig. 6B; PC3). exclusion of Smutsia and Phataginus. These analyses Although three genera have been proposed in also show a clear separation between Smutsia and Maninae, recent studies have suggested that the Phataginus, with the small pangolins showing lower three species should be grouped into the single genus, values of PC1 and higher values of LD1. Manis (Gaudin et al., 2009; Gaubert et al., 2018). We also show some degree of variation in skull On average, Manis is the genus with the lowest shape at the intrageneric level that confirms species- (but still high) mitogenomic distance among species level delineation of extant pholidotans (Fig. 6). Despite (mean = 9.3%), with M. javanica–M. culionensis the split between S. gigantea and S. temminckii being showing the lowest value (3.1%) and slightly more recent than in other genera (5.6–13.2 M. pentadactyla–M. javanica/M. culionensis/ Mya for Smutsia, 10.3–15.6 Mya for Manis and 9.3– M. crassicaudata showing the highest (12.2%; Gaubert 16.5 Mya for Phataginus; Gaubert et al., 2018), their et al., 2017). The three species of Maninae show some skulls appear comparatively more distinct. Some of overlap in morphospace, but are well segregated by the differences between S. temminckii and S. gigantea PC2 (Fig. 6A). In contrast, M. culionensis overlaps are related to size (see above; Fig. 4). The most with M. javanica in morphospace (Supporting extensive morphological phylogenetic work performed Information, Fig. S1), which is congruent with the low to date found that Smutsia was the least-supported mitogenomic distance and the recent divergence time modern genus, with only three unique unambiguous estimated between these two species (0.4–2.5 Mya). synapomorphies, none of which involve the cranium However, our data are clearly insufficient to assess the (Gaudin et al., 2009). Our results on variation in skull morphological discrimination between M. javanica shape are congruent with the low support for the and M. culionensis (Supporting Information, Fig. S1). Smutsia node. As discussed above, elongation of the Despite the strength of the Maninae node, rostrum largely influences this intrageneric difference infrageneric relationships have been greatly debated. in shape. This allometric pattern is present at both Molecular-based analyses show a well-supported ontogenetic and evolutionary levels and explains some node (Bayesian posterior probability = 1), including 2019 The Linnean Society of London, Zoological Journal of the Linnean Society, 2020, 188, 255–275
270    S. FERREIRA-CARDOSO ET AL.

M. javanica/M. culionensis and M. crassicaudata, with          Africa (CA). Although the grouping of WAF–GHA is
M. pentadactyla as the sister taxon (Gaubert et al., 2018).    congruent with the molecular phylogeny, the Dahomey
The M. crassicaudata–M. javanica/M. culionensis clade          Gap group is morphologically divergent in this clade.
remains moderately supported in the Bayesian inference         In addition, the similarity between Central Africa and
excluding mitogenomes (nuclear DNA only). In contrast,         Western Central Africa groups could suggest that they
a moderately supported sister-group relationship               both retained a plesiomorphic cranial shape. However,
between M. pentadactyla and M. crassicaudata is                testing the congruence between molecular and
retrieved by morphology-based phylogenetic analyses            morphological data would require further scrutiny.
(bootstrap value = 76; Gaudin et al., 2009). The list             In contrast, we posit that different environmental
of synapomorphies from Gaudin et al. (2009) for the            conditions might also explain some parts of the cranial
node gathering M. crassicaudata and M. pentadactyla            variation among pangolin lineages. The Dahomey Gap
featured only three cranial traits. Among these, only          corresponds to a savannah-like corridor that divides
the position of the foramen ovale at the level of the          western and central lowland rain forests (Dupont &
anterior edge of the ectotympanic is an unambiguous            Weinelt, 1996), with a longitudinal gradient ranging from
synapomorphy [character 379(1)]. Landmarks 18/43               dry (Dahomey Gap) to more humid rainforest conditions
and 20/45 describe this synapomorphy and contribute            (western and central rainforest). The adaptation to a
to segregate M. crassicaudata and M. pentadactyla              drier climate resulting from tropical forest fragmentation
from M. javanica along with other traits correlated            (Salzmann & Hoelzmann, 2005) could explain the
with PC2 (Fig. 6A). Further anatomical investigation           differentiation of a Dahomey Gap lineage. Concurrently,
(i.e. internal characters) remains necessary to explore        genetic drift resulting from an isolation-induced
the morphological support for both hypotheses more             reduction of gene flow (Renaud & Millien, 2001) might
thoroughly.                                                    also have played a role in the Dahomey Gap skull shape
                                                               differentiation, following a vanishing refuge model of
                                                               diversification (Vanzolini & Williams, 1981; Damasceno
  Skull shape variation corroborates cryptic                   et al., 2014; Gaubert et al., 2016). At least three other
   phylogeographical lineages in P. tricuspis                  endemic mammal species/subspecies have recently been
Cranial osteological data are extremely useful to              described or confirmed on a genetic basis in the Dahomey
unveil patterns of cryptic speciation (Sukumaran               Gap (Colyn et al., 2010; Nicolas et al., 2010; Houngbédji
& Knowles, 2017). Our results confirm, at least in             et al., 2012). Further analyses are needed to assess the
part, the existence of several geographical groupings          potential interaction between variation in skull shape
within P. tricuspis (Gaubert et al., 2016, 2018; Figs 2,       and environmental conditions in pangolins.
7; Supporting Information, Fig. S5). The PCA showed
some degree of overlap between the different lineages
in morphospace (Fig. 7A, B), although we were able to                 Intraspecific variation in M. javanica
find significant differences among the skulls of four          In contrast to P. tricuspis, we did not find solid evidence
lineages or lineage groups (Western Africa + Ghana,            of skull shape discrimination between molecularly
Dahomey Gap, Western Central Africa and Central                identified lineages within M. javanica, because
Africa). Homogeneity in skull shape might be explained         differences in shape appear to be associated solely
by recent divergence times between these lineages              with size (Supporting Information, Appendix S3; Figs
(0.8–4.6 Mya for the most recent common ancestor of            S7, S8). The lack of differences in skull shape might
Western and Central African lineages; Gaubert et al.,          be explained by introgressions between lineages or by
2016, 2018). Nevertheless, we showed that two lineages         more recent divergence times (Nash et al., 2018) than
(WAF and GHA) from a molecularly identified western            among P. tricuspis lineages. Additionally, the cryptic
lineage (DHG–GHA–WAF; Gaubert et al., 2016)                    lineages within M. javanica might currently lack a
present a distinct cranial morphology (Figs 7C, D, 8).         well-defined geographical delimitation, attributable,
Furthermore, the Dahomey Gap lineage presents a                in part, to the lack of precise geographical information
distinct skull shape. Although the identification of group     for the wild specimens sampled (Nash et al., 2018).
membership was not particularly high among cryptic             Human-induced specimen translocation by the
lineages (75.4%), we showed that WAF–GHA, DHG and              introduction of pangolin seizures of unknown origin
CAF–WCA form three morphologically distinct groups             might also have resulted in the mixing of different
separated along a longitudinal gradient, with a high           lineages (Pantel & Chin, 2009).
rate of a posteriori attributions (95.7%; Fig. 8).
   Our results recover only partial evidence of the
three nuclear groups found by Gaubert et al. (2016)                                    Conclusion
that delineated Western Africa (WAF, GHA and                   Our results are congruent with the currently accepted
DHG), Western Central Africa (WCA) and Central                 genus- and species-level classification of extant

                            2019 The Linnean Society of London, Zoological Journal of the Linnean Society, 2020, 188, 255–275
You can also read