BIRD-AREA WATER-BODIES DATASET (BAWD) AND PREDICTIVE AI MODEL FOR AVIAN BOTULISM OUTBREAK (AVI-BOT)
←
→
Page content transcription
If your browser does not render page correctly, please read the page content below
A version of this manuscript is under review and consideration for publication in a journal
                      First version of this manuscript was submitted in January 2021 for review

                                               Bird-Area Water-Bodies Dataset (BAWD) and Predictive AI
                                                     Model for Avian Botulism Outbreak (AVI-BoT)
                                                    Narayani Bhatia, Devang Mahesh, Jashandeep Singh, and Manan Suri*

                                               Department of Electrical Engineering, Indian Institute of Technology Delhi, India.
                                                    *Corresponding author: Manan Suri (e-mail: manansuri@ee.iitd.ac.in).
arXiv:2105.00924v1 [q-bio.QM] 3 May 2021

                                                                                              Abstract
                                                    Avian botulism caused by a bacterium, Clostridium botulinum, causes a paralytic disease in
                                                birds often leading to high fatality, and is usually diagnosed using molecular techniques. Diagnostic
                                                techniques for confirming the outbreak of Avian botulism include: Mouse Bioassay, ELISA, PCR
                                                (based on post-mortem), all of which are time-consuming, laborious and require invasive sample
                                                collection from affected sites or dead birds. All these in-vitro techniques are non-preventive and their
                                                processing time may further contribute to the bacterial growth in the affected regions. In this study,
                                                we build a first-ever multi-spectral, remote-sensing imagery based global Bird-Area Water-bodies
                                                Dataset (BAWD) (i.e. fused satellite images of warm-water lakes/marshy-lands or similar water-
                                                body sites that are important for avian fauna) backed by on-ground reporting evidence of outbreaks.
                                                In the current version, BAWD consists of multi-spectral satellite images, covering a total ground
                                                area of 904 sq.km from two open source satellite projects (Sentinel and Landsat). BAWD consists of
                                                17 topographically diverse global sites spanning across 4 continents, where locations were monitored
                                                over a time-span of 3 years (2016-2020). Using BAWD and state-of-the-art deep-learning techniques
                                                we propose a first-ever Artificial Intelligence based (AI) model to predict potential outbreak of
                                                Avian botulism called AVI-BoT (Aerosol Visible, Infra-red (NIR/SWIR) and Bands of Thermal).
                                                AVI-BoT uses fused multi-spectral satellite images of water-bodies (10-bands) as input to generate
                                                a spatial prediction map depicting probability of potential Avian botulism outbreaks. We also
                                                train and investigate a simpler (5-band) Causative-Factor model (based on prominent physiological
                                                factors reported in literature as conducive for outbreak) to predict Avian botulism. Using AVI-
                                                BoT, we achieve a training accuracy of 0.94 and validation accuracy of 0.96 on BAWD, far superior
                                                in comparison to our model based on causative factors. For detailed feature-space analysis and
                                                explain-ability of the proposed 10-band AVI-BoT model, we further train four additional spectral
                                                models on BAWD using: (i) Aerosol, (ii) Visible (3-bands), (iii) IR (3-bands), and (iv) Thermal (3-
                                                bands). Further, we analyze using AVI-BoT, two recent and highly complex outbreak case-studies: (i)
                                                Sambhar Lake (India, November 2019), and (ii) Klamath National Wildlife Refuge (U.S.A., October
                                                2020). The model is found to closely converge with ground-reporting observations at both these
                                                sites with a fine-grain spatio-temporal prediction capability. The proposed technique presents a
                                                scale-able, low-cost, non-invasive methodology for continuous monitoring of bird-habitats against
                                                botulism outbreaks with the potential of saving valuable fauna lives.

                                           1    Introduction
                                           Avian botulism is a paralytic disease that fatally affects birds. It is caused by a bacterium, Clostridium
                                           botulinum, which produces a Botulinum neurotoxin, ingestion of which often leads to death in birds (Fig.
                                           1). Botulism spores (resting stage of the bacteria) can persist in the soil and aquatic sediments of water
                                           bodies for decades before it enters the food webs of birds. Organisms like- algae, plants and invertebrates
                                           act as biotic reservoir for the disease and further fishes are known carriers of botulism spores 1 . Once
                                           the spores enter the food webs of birds, avian botulism spreads in a self-perpetuating manner via the
                                           maggot cycle. Maggots which feed on the dead birds, acquire the bacteria and are likely to be eaten
                                           by carnivorous birds. The carnivorous birds that die because of the bacteria present in maggots are
                                           then fed by other maggots and this way, the cycle continues. Avian botulism is prevalent all over the
                                           world, with higher prevalence over North American wetlands. In the previous century the disease has
                                           caused an estimated average death of about 644,000 birds per reported outbreak year in U.S.A. and
                                           Canada 2 alone. Some physiological conditions for the bacterium to develop are: low-oxygen, eutrophic

                                                                                                   1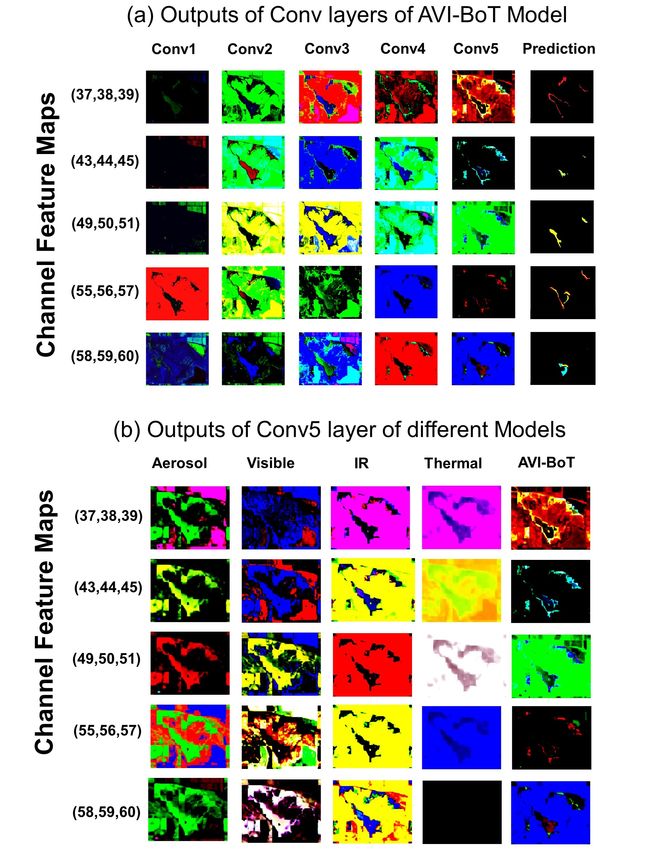
zones, higher water temperatures, shallow stagnant water 3 . Such non-exhaustive list of causative factors
leading to Avian botulism outbreak is one of the key areas of current research 4 . Some of the recent
outbreaks in England (2018), Wales (2018) 3 , Klamath National Wildlife Refuge (2020) 5 resulted in bird
casualty as high as 40,000.
     Some of the widely known techniques to confirm the outbreak of Avian botulism are culture tech-
niques 6 , assay test for presence of toxin 7 , PCR test 8 (See Table 1). Most of these techniques rely on
actual ground level sample collection which is challenging due to the requirement of physical access.
Further, all the aforementioned techniques are usually used as post-mortem tests 9 , that is, used for
detection of conditions only after clinical symptoms or deaths start getting reported from the location.
Moreover, in some cases, post-mortem tests may be inconclusive and need to be backed by further lab-
oratory confirmation which adds to the delay 9 . This often leads governments and conservationists with
little time for quick relief operations to save precious and endangered fauna.
     In order to overcome some limitations of the aforementioned clinical diagnostic methods, we present in
this study a first-ever Bird-Area Water-Bodies Dataset (BAWD) (i.e. fused satellite images of warm-water
lakes/marshy-land etc or similar water-body sites that are important for avian fauna) built from publicly
available open-source satellite imagery. Our hand-annotated dataset consists of multi-spectral satellite
images, covering a total ground area of 904 sq. km, from two open source satellite projects (Sentinel and
Landsat), covering 17 topographically diverse global bird-area water bodies from 4 continents, where
locations are monitored over a time-span of 3 years (2016-2020). BAWD includes complete mapping
between location scenes and ground-truth labels, backed by reporting of outbreaks. Further, we propose
a multi-spectral remote sensing AI detection model called AVI-BoT (Aerosol Visible Infra-red (both
NIR and SWIR) - Bands of Thermal) to predict potential outbreak of Avian botulism. AVI-BoT
takes fused multi-spectral satellite images as an input and generates a spatial prediction map depicting
probability of an outbreak to occur. Satellite images in BAWD are composed of 10 remote sensing bands
which capture the physio-chemical botulinum-promoting parameters such as pH, salinity, temperature
among many others. We also train and investigate a simpler (5-band) Causative-Factor model (based
on prominent physiological factors reported in literature as conducive for outbreak) to predict Avian
botulism outbreak. Notably, AVI-BoT trained as a deep convolution neural network over BAWD, achieves
far superior performance with a validation accuracy of 0.96. Further, two recent and highly complex
Avian botulism outbreaks namely at Sambhar Lake (India, November 2019) 12 and Klamath National
Wildlife Refuge (U.S.A., October 2020) 5 are investigated using AVI-BoT. At both the locations, AVI-
BoT provides excellent forecasting of both severity and spatial distribution of the outbreak, validated
using field reporting. We then use the model on satellite data collected from these locations over a
time-span of 3 years and 1 year respectively to investigate the formation of Avian botulism conducive
conditions which exacerbated and resulted in mass die-offs. To take a closer look at the evolution of
the feature representations learnt by AVI-BoT, we additionally train four direct spectral models: ((i)
Aerosol, (ii) Visible (3-bands), (iii) IR (3-bands), and (iv) Thermal (3-bands)).
     The proposed work combines recent advances in the domains of deep learning and multi-spectral re-
mote sensing. It provides a fast, scalable, non-invasive, first-of-a-kind monitoring and predictive method-
ology for avian life conservation. The model is made sufficiently generic by covering 17 locations across
4 continents, as well as covering a range of physical, chemical, biological factors responsible for the
outbreak to occur.

Figure 1: (a) Bacterium - Clostridium botulinum 10 , (b) Healthy bird 11 , (c) Affected bird suffering from
paralysis of neck muscles due to Avian botulism 2 .

                                                    2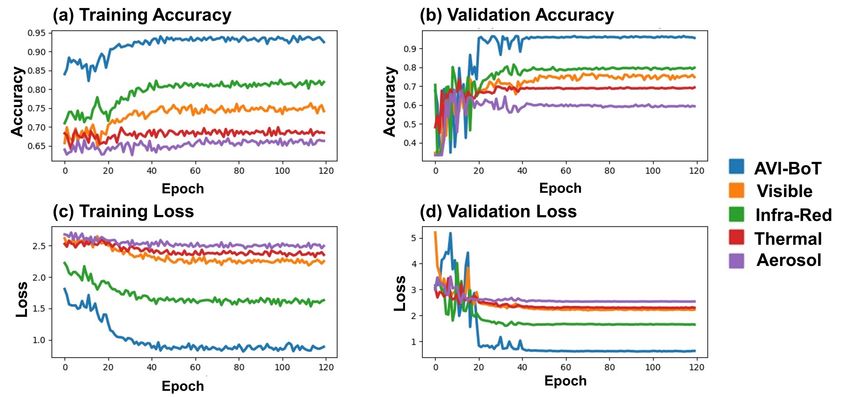
Table 1: State of the Art techniques for detection of Avian botulism.
    Paper       Objective of Locations          Underlying Methodology       Key Contribution
                Study           Covered
                Detection       2 locations     Mouse BioAssay (Clinical, Identification      of   the
    13
                                                Bio-chemical)                neurotoxin produced by
                                                                             Clostridium    botulinum
                                                                             using mouse bioassay
                                                                             technique
                Detection       -               ELISA (Clinical, Bio- Identification          of   the
    7;14
                                                chemical)                    neurotoxin produced by
                                                                             Clostridium    botulinum
                                                                             using microplates
                Detection       -               PCR     (Clinical,    Bio- Reviews PCR-based assay
    8
                                                chemical)                    along with primers, sensi-
                                                                             tivity
                Detection       -               Pre-PCR (Clinical, Bio- Optimized pre-PCR pro-
    15
                                                chemical)                    cessing by proposing the
                                                                             use of liver
    This        Detection,                      Salinity, Temperature, Proposed use of AVI-
    work        Prediction      17 locations pH, Organic Matter BoT                    Model     using
                of potential 4 continents (Remote sensing AI- temporal                     multispec-
                outbreaks                       based Computational- tral remote sensing
                                                Deep Learning Net- data of 10-100m reso-
                                                work)                        lution from Sentinel 2
                                                                             and Landsat 8

2        Results
2.1        AI Model Bench-marking
Fig. 2 shows the accuracy and loss plots for training and validation for the two proposed models: (i)
Causative Factors based model (5-bands) and (ii) AVI-BoT model (10-bands). (For all details on model
training, pipeline and methodology refer to (Methods) Section 5.) The Causative factors model based
on factors inspired from literature shows inferior training and validation accuracy compared to AVI-BoT
model, thereby necessitating the inclusion of multiple diverse spectral features (detailed in Table 5). The
10-band AVI-BoT model (which is a combination of aerosol, visible-spectra, NIR-SWIR, and thermal
bands) capably combines all hypothesized factors in the feature representation and achieves a training
accuracy of 0.94 and a validation accuracy of 0.96.

2.2        Outbreak Case-Studies
To test the capability of the proposed AVI-BoT model, we analyzed two locations with recently reported
complex cases of Avian botulism outbreak. The complexity of these two locations arise from the dynamic
and evolving on-ground situation, unexpectedly worsening within a matter of days, affecting a large
number of birds before authorities could take action. It is noteworthy that in both these cases, none of
the on-ground apparatus had reported even an inclination towards an impending outbreak. These test
case-studies include:
     • Sambhar Lake, Rajasthan, India in November 2019 12 .
     • Klamath National Wildlife Refuge, California, USA in October 2020 5 .

2.2.1      Case Study 1: Sambhar Lake
Sambhar Lake (India) had witnessed an outbreak in November 2019 12 . In Fig. 3 (g) Causative factors
based model shows the result as ‘no outbreak’, which is a wrong prediction w.r.t reported ground-truth.
Whereas in Fig. 3 (h), the AVI-BoT model gives an accurate picture by capturing the severity as well as
the spatial extent of the outbreak. Delving deeper into the AVI-BoT prediction, we perform a comparison

                                                    3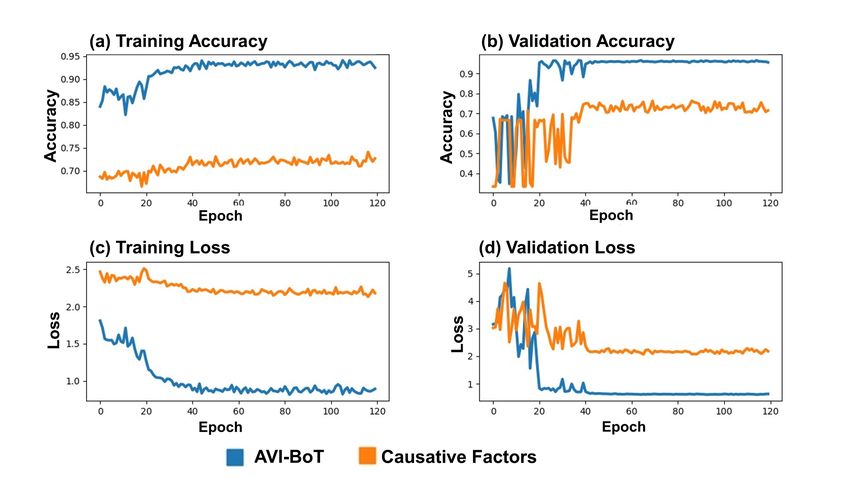
Figure 2: Epoch-wise scores for proposed Causative Factors and AVI-BoT models: (a) Training Accuracy,
(b) Validation Accuracy, (c) Training Loss, and (d) Validation Loss.

with the actual on-ground reporting of the outbreak 16 . Fig. 4 (a) shows the prediction by AVI-BoT
model on the sample dated 19th November 2019, which shows a red prediction (probability of outbreak >
0.9) on two locations - top left which corresponds to Nagaur district, and left shoreline which corresponds
to Jaipur district. Fig. 4 (b) shows the district-wise map of Sambhar Lake along with reported carcass
count for the two affected districts - Nagaur and Jaipur, for an overlapping 9 day period. Clearly from
Fig. 4, AVI-BoT model is able to predict two locations of the outbreak and the severity, accurately. For
further analysis, we present a temporal prediction map for the susceptible months during a three year
span of 2017-2019, analyzing the trends of outbreak probabilities (Table 2). Key observations are:
  1. September 2017 (Table 2 (a)) is marked by a strong deficiency in rainfall which exacerbate condi-
     tions near the neck of the river. However, the decrease in water level is so high that the left part
     of the lake almost disappears (Table 2 (b)), hence moderate conditions appear near the top of the
     right part of the lake.
  2. Higher prediction observed at the edges of the lake, instead of the center, which are also the
     preferred habitat of the migratory birds. The neck of the lake (corresponding to an on-ground
     distance of 2 km) is the main dead-point where conditions are most strong. (Table 2 (e))
  3. The year 2018 shows the build-up of conditions steadily over time. Further, increased evaporation
     has led to sharp recession of water-levels, thereby exposing the ground below. Higher evaporation
     can be interpreted as warmer water temperatures, which is one of the breeding grounds for the
     bacterium. (Table 2 (c)-(g))
  4. 2019 again shows a steady progression over time and spread from the lower right end of the lake
     towards the left edge. (Table 2 (h)-(n))
  5. The analysis shows that for the same month, situation might change drastically from year to
     year. Example, September month of 2017, 2018 and 2019, show different results. The analysis
     shows strong intra-month transitions - both for increase and decrease, successfully captured by the
     proposed AVI-BoT technique.
  6. It is noteworthy that AVI-BoT prediction for 9th November 2019 (Table 2 (l), moderate to high
     probability) for left bank of the neck of the lake, is just 6 days before the first actual ground
     reporting of the outbreak dated 16th November 2019 12 . Further, upper left bank (which can be

                                                    4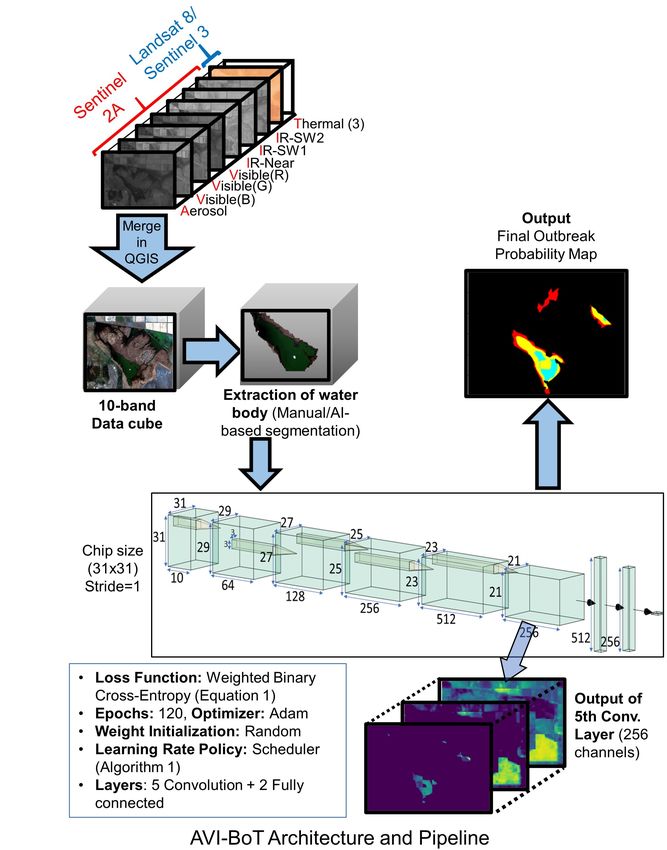
Figure 3: Prediction results on Sambhar Lake, India for 19th November 2019 ((a)-(h)) and Klamath
National Wildlife Refuge, U.S.A. for 9th October 2020 ((i)-(p)).

        considered Nagaur area) shows moderate outbreak probability, which is in consonance with bird
        carcasses being reported from that area from 15th November onwards (Fig. 4).

2.2.2     Case Study 2: Klamath National Park
Klamath National Wildlife Refuge (U.S.A.) witnessed an outbreak in October 2020 5 . Causative Factors
based model is unable to predict an outbreak (Fig. 3 (o)), while AVI-BoT model predicts the outbreak
with fine-scale granularity (Fig. 3 (p)). Another important point to note in Fig. 3 is that the AVI-BoT
model always predicts higher possibility of outbreak at the shoreline than at the center of the water
body. This is in conformity with 17 stating that Avian botulism is a water’s edge disease, meaning that
rarely are sick avi-fauna found away from the vegetation at the edge of the water or the original water’s
edge. For further analysis, we generated all year-round prediction maps using the proposed AVI-BoT
model for 2019 shown in Table 3. To our surprise, the AVI-BoT generated prediction maps were in
strong alignment not only with the expected theoretical factors behind the outbreak but also on-ground
reporting of sudden outbreak increases. Some key observations from this case study are:
  1. The winter months (December-February) are marked by low prevalence of Avian botulism out-
     breaks. (Table 3-(a), (b), (l))

  2. As temperature begins to increase, the conditions turn conducive for the bacteria to develop, as
     evident from the increase in area with (probability > 0.9) between March-May 2019. (Table 3 (c),

                                                   5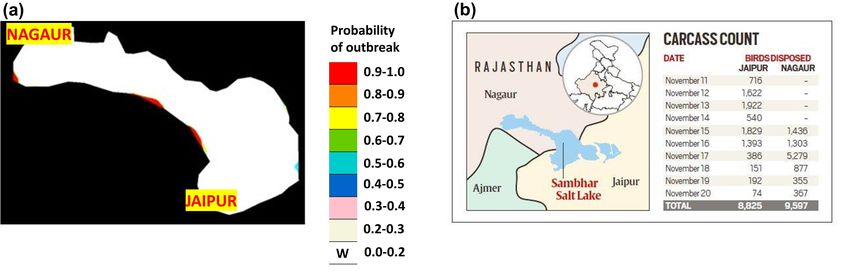
Table 2: Temporal prediction maps for Sambhar Lake, India for 2017-19 using the proposed AVI-BoT
    model.
AVI-BoT gener- (a) 20 Sep 2017 (b) 10 Oct 2017? (c) 27 Sep 2018 (d) 10 Oct 2018 (e) 25 Oct 2018
ated Prediction
Map

AVI-BoT     Pre-      Moderate-High      Moderate            Low                 Moderate            Moderate-High
dicted Outbreak
Probability
Possible hypoth-      Deficient rain     Moderate con-       Higher than nor-    Conditions be-      Water       level
esis, qualitative     may have lead      ditions owing to    mal rain yields     gin to build        reduces,     high
analysis              to     increased   disappearance       no evidence for                         probability near
                      conditions         of lake             existence of con-                       neck of lake
                                                             ditions

AVI-BoT gener-        (f) 9 Nov 2018     (g) 29 Nov 2018     (h) 31 Aug 2019     (i) 10 Sep 2019     (j) 5 Oct 2019
ated Prediction
Map

AVI-BoT     Pre-      Moderate-High      Low-Moderate        Low                 Low                 Low
dicted Outbreak
Probability
Possible hypoth-      Water recedes      Water reduces       No evidence for     Onset of very       Slight      con-
esis, qualitative     considerably,      further,    how-    conditions exist-   slight   condi-     ditions     over
analysis              possibly due to    ever     becomes    ing                 tions at lower      upper left bank
                      high temp.         less severe                             right bank end      shoreline

AVI-BoT gener-        (k) 25 Oct 2019    (l) 9 Nov 2019      (m) 19 Nov 2019     (n) 4 Dec 2019
ated Prediction
Map

Magnified view
of affected area
AVI-BoT       Pre-    Low-Moderate       Moderate            Moderate-High       Moderate
dicted Outbreak
Probability
Possible hypoth-      Moderate con-      Moderate-High       Severe     condi-   Severity on de-
esis, qualitative     ditions begin to   conditions    at    tions    develop    cline
analysis              develop at left    left bank of        over left bank
                      and right bank     neck.       Low-    entire shore-line
                      of neck and on     Moderate      on
                      top-left of lake   upper left bank
    ?
      Due to low water level in the left part, only right part of the lake is shown.
    †
      Since outbreak at Sambhar Lake occurred in November 2019, we investigated the month of November for 2017
    and 2018 for studying inter year behavior. Sept and Oct were considered as 2 immediately preceding months to
    study condition buildup effect. For 2019, we analyzed buildup for preceding five months.

                                                         6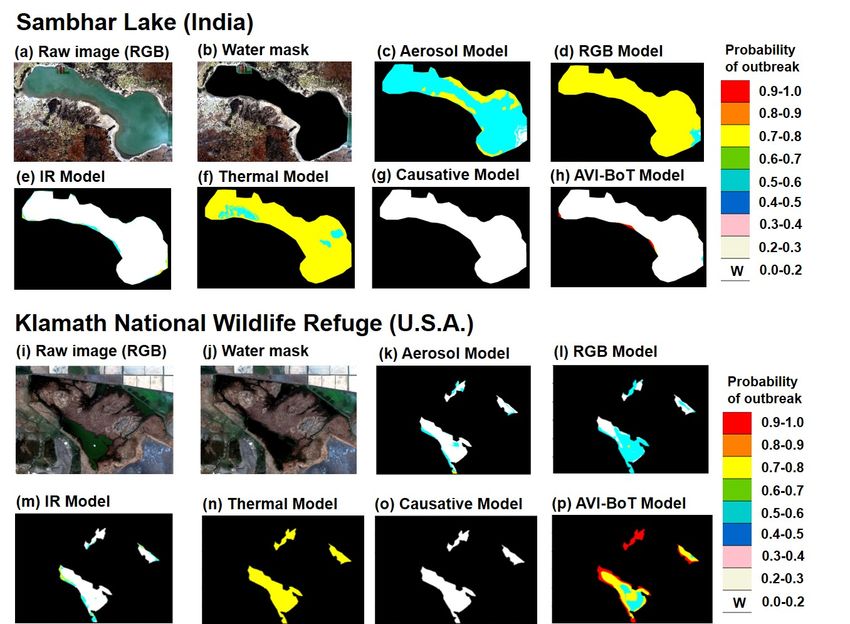
Figure 4: Confirmation of the AVI-BoT Model predictions for Sambhar Lake (India) based on comparison
of: (a) Probability map generated by AVI-BoT for remote-sensing data from 19th November 2019 and
(b) 9-day (i.e. Nov 11-20, 2019) ground-truth reporting for the site (Info graphic used from 16 ).

      (e))
    3. During fall migration of birds (September-November), a higher probability is predicted, which is
       also consistent with news reporting 18 (Table 3 (i)-(k)).

    4. Despite reporting of water release to Lower Klamath region in beginning of September 2019 19 , an
       increase in probability of outbreak is noted from 16th August 2019 to 12th September 2019, which
       coincides with a reporting of sudden increase of outbreak cases 18 . (Table 3 (h)-(i))
    Exhaustive temporal-analysis as shown in Sections 2.2.1 and 2.2.2 can help monitor contributory
factors round-the-year and timely issue a pre-emptive warning, thereby helping authorities to act and
save migratory birds in large numbers.

3     Discussion
The proposed AVI-BoT model outperforms the proposed literature-inspired Causative Factors model
with a significantly higher accuracy. It uses Aerosol band to capture the constituents of shallow water,
Visible band is the abstraction of salinity and organic matter, Infra-Red bands capture other crucial
factors like pH, and Thermal bands are a direct input for temperature. Thereby, covering all relevant
physical, chemical and biological parameters/features through learning fused multi-spectral satellite data.
    To better understand AVI-BoT’s learning of feature-space representations, we examine the progression
of features learnt by AVI-BoT through successive convolution layers. These visualizations (see Fig. 5 (a))
have been generated using Klamath National Wildlife Refuge (U.S.A.) as sample inference data point
for 9th October 2020. Analysis shown in Fig. 5 (a) helps us to understand the gradual progression of
learning the feature space through Conv1 to Conv5 layers, and also how different feature maps contribute
towards generation of the final output probability. Notably, the 15 convolution layer channels shown
exhibit useful features over the entire surface of the lake. Conv1 layer output shows the network learning
basic background (eg. fields) based on extracted water input shown to it. Conv2 layer shows a learning
buildup over conv1 layer, that is, the network begins to learn foreground (the water body) as a whole.
Conv3 layer begins to learn differentiation within lake such as edges or gradation within lake. Conv4
layer specializes in gradation and picks out specific features. The Conv5 layer shows the final composite
feature which predominantly activates the network. The output prediction map column indicates the
overlap area between the predominant conv5 features and the final AVI-BoT prediction map (shown in
Fig. 3 (p)).
    Channels (37,38,39) get activated at the edges of the lake corresponding to the high probability red
zone. In channels (43,44,45), the Conv5 output shows blue over right part of lake, getting activated at
moderate outbreak probability. Channels (49,50,51) correspond to the upper part of lake near the neck
showing a light green haze. Thus, there exists a differentiation over water area marked by yellow in final
output prediction map. Channels (55,56,57) cover lower bank and edges, however these are markedly
different than the edges picked by (37,38,39). Channels (58,59,60) get activated at the right bank, marked
by cyan in final output prediction map.

                                                    7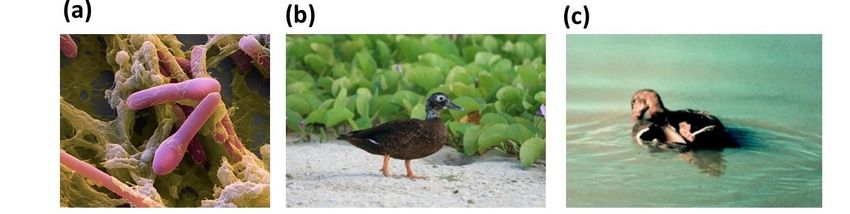
Table 3: Prediction maps for Klamath National Wildlife Refuge, U.S.A. for 2019 using proposed AVI-BoT
        model.
AVI-BoT   gener- (a) 13 Jan (b) 19 Feb (c) 14 Mar (d) 18 Apr (e) 10 May (f) 12 Jun
ated  Prediction
Map

AVI-BoT      Pre-      Low            Low             Moderate        Moderate-      High            High
dicted   Outbreak                                                     High
Probability
                       [5.9,-4.3]       [1.0,-8.1]      [7.6,-4.9]     [12.5,-0.1]    [16.8,2.1]      [22.6,4.4]
Temp[Max,Min](C)
                          92.7            168.4            55.4           95.0           57.4            7.4
Rainfall(mm) 20
Possible hypoth- Low temp.            Low temp.       Temp. be-       Temp.          High temp.      Conditions
esis,    qualitative and      high    and     high    gins to rise,   further        with mod-       improve
analysis             rain      pos-   rain    pos-    with     less   increases      erate rain;     compared to
                     sibly            sibly           inflow     of                  No     cases    May
                     means un-        means un-       fresh water,                   reported
                     favourable       favourable      conditions
                     conditions       conditions      may become
                                                      favourable

AVI-BoT   gener-       (g) 19 Jul     (h) 16 Aug      (i) 12 Sep      (j) 22 Oct     (k) 11 Nov      (l) 24 Dec
ated  Prediction
Map

AVI-BoT      Pre-      Moderate       Low-            Moderate-       Moderate-      Moderate        Low
dicted   Outbreak                     Moderate        High            High
Probability
                       [26.1,7.0]      [27.3,8.2]      [19.2,3.4]      [13.0,-2.8]    [11.1,-2.6]      [3.8,-4.5]
Temp[Max,Min](C)
                           1.0            18.5            64.5            22.9           26.9             82.8
Rainfall(mm) 20
Possible hypoth- Area with            Increased       Temp. still     Easing         Similar         Low temp.
esis,    qualitative yellow pre-      rain     may    in      high    temp. eases    temp. and       and     suffi-
analysis             diction          have eased      range. High     conditions,    rain    data    cient fresh
                     (high proba-     conditions      number          however        compared to     inflow of wa-
                     bility pixels    by      fresh   of     cases    high prob-     Oct.     pos-   ter possibly
                     decrease)        water inflow    reported 18     ability   on   sibly leads     eased     the
                                                                      edges          to a similar    situation
                                                                                     prediction-
                                                                                     map

                                                               8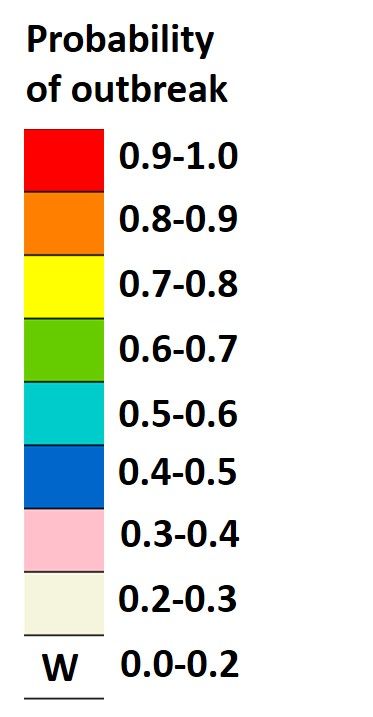
Figure 5: Illustration of progress of the feature-space learning through the convolutional layers, by
proposed AI models, on Klamath National Wildlife Refuge (U.S.A.) sample input data (i.e. 10-band
fused image dated 9th October 2020). Since convolutional layers have multiple channels, three successive
channels are stacked in each row (viewed in false RGB) as a visual aid for human interpretation. (a)
Conv. layers 1-5 using AVI-BoT model. (b) Conv. layer 5 using five different AI models.

    To further examine the learnt feature space, we delve into a deeper feature analysis and additionally
train four direct spectral models ((i) Aerosol, (ii) Visible (3-bands), (iii) IR (3-bands), (iv) Thermal
(3-bands)). We compare the features learnt by each of the direct spectral models and try to inter-
pret/hypothesize their contribution in the learnt feature space of AVI-BoT. The following observations
can be drawn from Fig. 5 (b):

  1. The activation observed at the shore of the lake is dependent on both aerosol and IR (37,38,39).
  2. (43,44,45) shows a slight variation in both Aerosol and IR features, possibly contributing to the
     features learnt by AVI-BoT.
  3. Temperature seems to be have dominant role in the shallow region like upper region of the bigger
     water body (49,50,51).
  4. (58,59,60) shows no activation by thermal input, whereas Aerosol and Visible maps show blanket
     activation. The differentiation learnt by AVI-BoT is possibly learnt from IR bands.

                                                   9
5. The activation in the interior of the lake is possibly governed by interpolation of Thermal, Aerosol
     and IR band.
  6. The almost uniform prediction of Aerosol can be a reason of its poor performance when compared
     to other models despite capturing water constituents well.

  7. Visible band does not seem to learn any specific feature, however performs moderately as compared
     to other models. Since Avian botulism is a shore line disease 17 , the centre of the lake is expected
     to yield a negative prediction and this may be the reason behind this model’s lower loss.
  8. IR band is seen to learn distinguishing features in it’s feature map which helps the model classify
     it as a ‘no outbreak’ - (43,44,45) and (58,59,60).
  9. The thermal feature map shows a sweeping output for the lake, owing to near similar temperatures
     taken over the surface of the lake, possibly owing to its low spatial resolution (100 m/1000 m) as
     well as actual temperature conditions.
    Fig. 6 shows the accuracy and loss plots for training and validation for the four direct models. All
models far lag behind the AVI-BoT model, with IR model being the second best in performance. This is
also validated by the IR column in Fig. 5 (b) contributing the highest influence in activating the network
to yield a prediction.

Figure 6: Epoch-wise scores for various spectral feature input representations: (a) Training Accuracy,
(b) Validation Accuracy, (c) Training Loss, and (d) Validation Loss.

    In Fig. 3, 3 (c) Aerosol model and 3 (d) RGB Model predict moderate conditions over the entire
surface of the lake, however that is expected as it can be the result of a biased prediction relying solely
on the water texture (aerosol) or optical features (visible). Similar results by 3 (f) thermal bands show
their high susceptibility to slight variations, and that it is just one of the factors leading to Avian
botulism, thus a model solely reliant on temperature will not be the optimal solution. 3 (e) IR model
yields moderate results over the shoreline, which even though a correct prediction, does not fully capture
the severity of the situation. AVI-BoT gives an accurate picture by capturing the severity as well as
the spatial extent. Model outputs in Fig. 3 show that each of 3 (k) - 3 (n) predictions captures some
probability of existence of conditions. However, in a scenario as grave as Klamath National Wildlife
Refuge for the said dates 5 , with massive number of bird deaths, a model prediction like that shown in 3
(p) truly indicates the extent and severity of the issue at hand.

                                                    10
4 Conclusions
This interdisciplinary study presents the intersection of - wildlife conservation, satellite based remote-
sensing technology and advanced computational techniques driven by deep learning. We build a Bird-Area
Water Bodies Dataset (BAWD) of multi-spectral satellite images of bird-habitats covering 17 topograph-
ically diverse global locations over the period 2016-2020, with ground-truth labels backed by on-ground
reportings confirming the outbreak occurrence. We further present AVI-BoT, an intelligent AI model with
training accuracy of 0.94 and validation accuracy of 0.96, to forecast Avian botulism outbreaks, using
open-source remote sensing data. We also validate our technique on recently reported complex Avian
botulism outbreaks in Sambhar Lake (India, November 2019) and Klamath National Wildlife Refuge
(U.S.A., October 2020) and confirm a highly probable prediction by our model for an outbreak. Further,
temporal analysis for the two said locations using the proposed model leads to fine grain spatio-temporal
decision output that is closely aligned with actual on-ground clinical diagnosis based reports. We also
train five additional models (Causative Factors based and four direct spectral models) to compare and
examine the evolution of the multi-spectral feature space. Proposed predictive methodology provides an
efficient and scalable first-of-its-kind monitoring technique which can be used to pre-emptively protect
the migratory fauna and interdependent food webs, thus contributing towards the United Nations’ SDGs
(Sustainable Development Goals) 13 and 14 21 .
5 Methods
5.1 Bird-Area Water-Bodies Dataset (BAWD)
A multi-spectral spatio-temporal dataset spanning across 17 topographically diverse global locations (15
training and 2 test) comprising a total of 659 satellite images (632 training and 27 test images) of water
bodies (rivers, lakes, ponds and wetlands) which are bird habitats, was built and manually annotated
for this study (see Fig. 7). Fig. 7 (c) shows the spatial variability of the dataset. The images have
been generated from Sentinel EO browser 22 . Among the 10 bands, 7 bands are raw spectral bands taken
from Sentinel 2A after L2A processing. L2A processing takes as input L1C processed image which is
radio-metrically and geometrically corrected (including orthorectification and spatial registration) and
performs atmospheric corrections 23 . The remaining 3 bands are thermal bands which have been taken
from Landsat 8 or Sentinel 3. Sentinel-3 data was used wherever Landsat-8 data was cloudy or not
available for dates of interest. About ∼ 21% of the total data (135 images) came from Sentinel-3.
Landsat 8 is preferred for thermal maps owing to its superior spatial resolution over Sentinel 3.
For building a robust model capable of predicting Avian botulism outbreak near/in water-bodies
across seasonal variability, we collected positive and negative data spanning over a time-period of ∼
3 years. Positive-labels denote conditions for Avian botulism exist while negative-labels denote non-
existent botulism conditions. Positive labels were created on the basis of confirmed ground reports for
the outbreak at any of the sites ([25]-[34]). The temporal spread of each positive label was adjusted over
a span of two months (one month before and after) with respect to the ground reporting date of the
outbreak since the conditions do not change overnight.
For samples labelled as negative, the locations are predominantly chosen from the list of Important
Bird Areas (IBA) designated by BirdLife International 24 . In some cases, confirmed news reportings
stating a corrective action taken by the local authorities are also used for negative samples. Corrective
actions include draining or flooding the wetland to change the environmental conditions sufficiently to
stop the production of toxin by Clostridium botulinum. Four complex locations which have transitioned
between ’outbreak’ and ’no outbreak’ have also been factored in the BAWD dataset to account for
complex cases. Table 4 details the locations and the dates for which the samples are collected along with
ground reporting evidence for labelling the sample-type (i.e. positive or negative).
5.2 Using AI to build a Predictive Model
Deep learning has recently emerged as a very powerful and flexible technique across multiple use-cases,
including but not limited to object detection, intelligent feature extraction, data fusion. It is based on
learning several levels of representations, where more abstract representations are computed in terms of
less abstract ones. This in turn helps to make sense of data such as images, sound, and text 45 .
Deep learning for image analysis is almost synonymous with applying convolutional neural networks
(CNNs) 45;46 . The convolution operation, which forms the backbone of CNNs, learns patterns from the
11Table 4: Description of Positive and Negative Samples in Bird-Area Water Bodies (BAWD) Training
Dataset (15 out of 17 locations).
Positive Data
Location Period of data collection Number of Reported
images positive in:
Bromley Oxidation Pond Dec’17 - Mar’18 10
25
(New Zealand)
Firth of Thames (New Dec’19 - Feb’20 111
26
Zealand)
Kaitaia (New Zealand) Jan’19 - Mar’19 8
27
Western Springs (New Jan’18 - Feb’18 2
28
Zealand)
Kapiti Coast (New Dec’17 - Mar’18 7
29
Zealand)
Lake Buloke (Australia) Jan’17 - Mar’17 6
30
Sleeping Bear Dunes Sept’19 - Nov’19 35
31
(U.S.A.)
North Canterbury (New Jan’18 - Apr’18 18
32
Zealand)
Pertobe Lake (Australia) Jan’19 - Apr’19 15
33
Radipole Lake (United Aug’19 - Sept’19 33
34
Kingdom)
Negative Data
Location Period of data collection Number of Reported
images negative in:
Firth of Thames (New June’17 ; June’18 - Aug’18 ; June’19 - Aug’19 83
35
Zealand)
Aug’18 - Sept’18 ; Dec’18 - Feb’19 ;
Lake Balaton (Hungary) 84
July’19 - Sept’19 1;36
Lange Lacke (Austria) Dec’16 - Feb’17 ; July’17-Sept’17 27
1;37
Mar’18 ; Jan’19-Feb’19 ;
Sleeping Bear Dunes 46
Dec’19 ; Feb’20 38
(U.S.A.)
Smith and Bybee (U.S.A.) Feb’18 -Apr’18 ;Jan’19 - Apr’19 54
39
San Carlos Reservoir Jan’19 - Dec’19 17
40
(U.S.A.)
Radipole Lake (United Jan’18 - May’18; July’18 - Dec’18 12
41
Kingdom)
Jan’17-Feb’17; May’17; July’17-Aug’17;
North Canterbury (New 10
Oct’17-Dec’17 42
Zealand)
Apr’18-Aug’18; Oct’18-Nov’18;
Lake Pakowki (Canada) 54
Apr’19-Aug’19 43;44
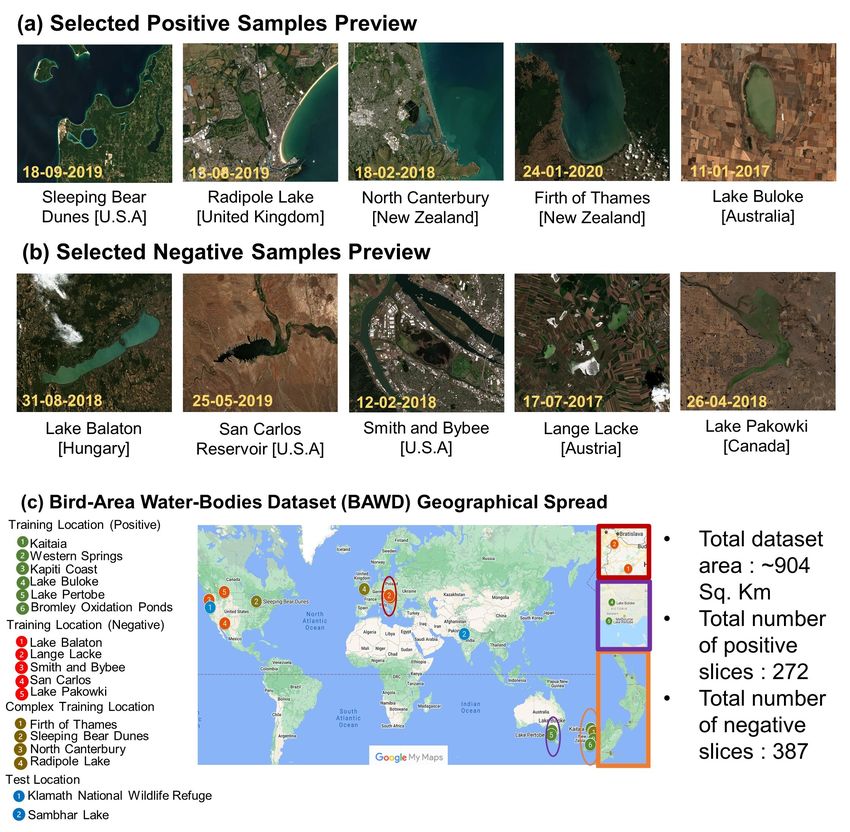
12Figure 7: Bird-Area Water-Bodies Dataset (BAWD) details: RGB preview of few (a) Positive and (b)
Negative samples (Raw data source: Modified Copernicus Sentinel data 2016-2020 /Sentinel Hub), (c)
Distribution map of 17 global locations chosen for the study.
input image while preserving the spatial characteristics present in the original image, making them highly
suitable for processing structured 2D data.
CNNs can learn to extract features directly from images significantly decreasing the need for manual
feature extraction. In general, a CNN is composed of tens or even hundreds of convolution layers. With
every convolution layer, the complexity of the learned image feature increases. The capability of CNNs
to extract features in a complex hyper-space which is difficult for humans to visualize along with the
ability to handle geographically variant multi-spectral data from multiple sensors, makes deep learning
models extremely useful for remote sensing applications.
5.2.1 CNN Training Methodology
Each of the 10 bands (Table 5) is merged using QGIS 53 , and water area is extracted for each wetland
manually. The merge operation is carried out such that, the lowest resolution among the constituent
bands is assigned to the output merged file. As shown in Table 5, Aerosol band (B01) has lowest resolution
that is 60 m and is assigned to the artificially synthesised data point. Further, water extraction can also
be carried out by an automated deep-learning based segmentation network like UNet 54 . Selective bands
from this artificial data point serve as the input to the CNN.
13Table 5: Details of spectral-bands chosen and the represented parameters to generate proposed Bird-Area
Water Bodies dataset.
Sensor Band Description Wavelength Resolution Parameters Dependence
(µm) (m)
S2 1 Coastal/Aerosol 0.443 60 pH level, Redox potential, Pres-
47;48
ence of microbes & Water con-
stituents
S2 2 Blue 0.490 10 Chlorophyll concentration level,
48;49;50
DOM, Salinity level
S2 3 Green 0.560 10 pH level, Chlorophyll concentra-
47;48;49;50
tion level, DOM, Salinity level
S2 4 Red 0.665 10 pH level, Chlorophyll concentra-
47;48;51
tion level, Redox potential
Vegetation
S2 8a 0.865 20 pH level, Vegetation & Organic
Red Edge 51
Matter
S2 11 SWIR 1.610 20 Dissolved Oxygen level, Vegeta-
48;47
tion & Organic Matter
S2 12 SWIR 2.190 20 Vegetation & Organic Matter
L8/S3 R Temperature? - 100/1k Surface temperature
52
?
L8/S3 G Temperature - 100/1k Surface temperature
52
?
L8/S3 B Temperature - 100/1k Surface temperature
52
?
Causative Factors based model consists of 5 bands- algebraically calcu-
lated: (i) Salinity (ii) DOM and raw spectral bands (iii)-(v) Thermal bands
All models trained in this study use a binary classification deep CNN with AlexNet 55 as the base
architecture. It comprises of 5 convolutional layers followed by 2 fully connected layers. For the purpose
of training, each image in the dataset is divided into 31x31 chips. We get 1127 chips from positive images
and 2982 chips from negative images in the dataset. To account for the mismatch in number of positive
and negative samples, higher weight is given to false-negatives than false-positives in the loss function
(shown in Eq.1).
W.B.C.E = −[w1 ∗ ytrue .log(ypred )+
(1)
w2 ∗ (1 − ytrue ) ∗ log(1 − ypred )]
Where:
W.B.C.E: Weighted Binary Cross Entropy per pixel
ytrue : True label for a pixel
ypred : Predicted label for a pixel
w1 : Weight assigned to positive training data
w2 : Weight assigned to negative training data
Since the proportion of chips labelled as positive:negative is 1127 : 2982 =∼ 3 : 7, thus the mismatch is
accounted for by assigning w1 = 7 and w2 = 3. Further, the chips obtained are divided into ∼ 11:2 train
: validation sets. The training parameters chosen are shown in Fig. 8.
Algorithm 1 Learning rate scheduler algorithm inspired by combination of techniques in 56 .
Require: Current Epoch ei ,Max Epoch Emax , Base Learning Rate LRbase , Greatest Integer Function
[x]
Ensure: New Learning Rate LRnew
if ei < Emax
6 then
LRnew = LRbase
else ei
−[ Emax ]
LRnew = LRbase × 10 6
end if
14The output of the network is a probability value that indicates the likelihood for occurrence of Avian
botulism outbreak (ranging from 0 to 1). The output probability value for a chip is assigned to the
center pixel of the chip. At the time of prediction, we divide an entire image of test location into 31x31
chips with stride size 1. Thus, the entire image is scanned and each pixel is assigned a probability.
5.2.2 Causative Factors based Model
In this model, we combine the most crucial causative factors responsible for the outbreak in literature 57
i.e. salinity, temperature and dissolved organic matter (DOM). Equivalent band representations for the
same are calculated as shown below:
1. Salinity 50 = 100.037X+1.494
where X = (Band2 − Band3)/(Band2 + Band3)
2. DOM 49 = 0.9819X + 5.6831
X = Band2/Band3
3. Temperature = taken from thermal heat maps
Where Band2 and Band3 refer to Sentinel Bands as defined in Table 5.
Figure 8: Proposed dataflow and deep-learning backbone used for training and inference for different
networks in this study. All 10 bands are used in AVI-BoT.
155.2.3 AVI-BoT Model
Post exploration of the causative factors based model, we fuse multi-spectral bands from two different
satellites to capture the impact of multiple relevant physio-chemical parameters listed in Table 5. While
maintaining the tradeoff between the model size and useful features, the 10 constituent bands are care-
fully chosen to represent each of the wavelength bands (A,V,I,T) to remove redundancy while keeping
the model size bounded. The bands - Aerosol (B01), Visible (B02-B04), NIR (B08a)-SWIR (B11,B12),
Thermal (Heat maps) - capture physical, chemical and biological parameters where each of these respec-
tive ‘causative factors’ would contribute towards the decision of a potential ‘outbreak’ or ‘no-outbreak’.
Fig. 8 depicts the methodology to synthesise the fused input for AVI-BoT Model and to generate a
prediction on any test location.
References
[1] Espelund, M. & Klaveness, D. Botulism outbreaks in natural environments – an update. Frontiers
in microbiology 5, 287 (2014).
[2] Friend, M. & Franson, J. Field manual of wildlife diseases: General field procedures and diseases of
birds. U.S. Geological Survey (1999). URL https://pubs.er.usgs.gov/publication/itr19990001.
[3] Avian botulism – a recurring paralytic disease of wild uk waterbirds. Veterinary Record
185, 261–262 (2019). URL https://veterinaryrecord.bmj.com/content/185/9/261. https:
//veterinaryrecord.bmj.com/content/185/9/261.full.pdf.
[4] Anza, I. et al. Eutrophication and bacterial pathogens as risk factors for avian botulism outbreaks
in wetlands receiving effluents from urban wastewater treatment plants. Applied and Environmental
Microbiology 80, 4251–4259 (2014).
[5] Hertel, M. Avian botulism kills 40,000 birds at national wildlife refuge. The Revelator (2020). URL
https://therevelator.org/avian-botulism-klamath/.
[6] Le Gratiet, T. et al. Development of an innovative and quick method for the isolation of clostridium
botulinum strains involved in avian botulism outbreaks. Toxins 12, 42 (2020).
[7] Rocke, T. E., Smith, S. R. & Nashold, S. W. Preliminary evaluation of a simple in vitro test for the
diagnosis of type c botulism in wild birds. Journal of wildlife diseases 34, 744–751 (1998).
[8] Chellapandi, P. & Prisilla, A. Pcr-based molecular diagnosis of botulism (types c and d) outbreaks
in aquatic birds. Annals of Microbiology 68, 835–849 (2018).
[9] Anniballi, F. et al. Management of animal botulism outbreaks: from clinical suspicion to practi-
cal countermeasures to prevent or minimize outbreaks. Biosecurity and bioterrorism: biodefense
strategy, practice, and science 11, S191–S199 (2013).
[10] Woudstra, C. Clostridium botulinum, from toxin and flagellin genotyping to Whole Genome Se-
quencing: An insight into the genetic diversity of human and animal botulism associated Clostridia.
Ph.D. thesis (2016).
[11] Survey, U. G. Avian botulism. https://www.usgs.gov/centers/nwhc/science/avian-botulism. Ac-
cessed: 2021-01-03.
[12] Singh, S. D. . A. Sambhar bird death: Mortality pattern indicates avian botulism, says report.
Times of India (2019). URL https://timesofindia.indiatimes.com/city/jaipur/sambhar-
bird-death-mortality-pattern-indicates-avian-botulism-says-report/articleshow/
72080003.cms.
[13] Hedeland, M. et al. Confirmation of botulism in birds and cattle by the mouse bioassay and
endopep-ms. Journal of medical microbiology 60, 1299–1305 (2011).
[14] Thomas, R. Detection of clostridium botulinum types c and d toxin by elisa. Australian Veterinary
Journal 68, 111–113 (1991).
16[15] Le Maréchal, C. et al. Development and validation of a new reliable method for the diagnosis of
avian botulism. Plos one 12, e0169640 (2017).
[16] Khan, H. Management, hydrology, salt pans — what’s behind rajasthan’s bird crisis? Indian Ex-
press (2019). URL https://indianexpress.com/article/explained/sambhar-lake-rajasthan-
bird-deaths-in-india-6129271/.
[17] Locke, L. N. & Friend, M. N. 13.2. 4. avian botulism: Geographic expansion of a historic disease.
Waterfowl management handbook 3 (1989).
[18] Current avian botulism outbreak in lower klamath basin. https://birdallyx.net/current-avian-
botulism-outbreak-in-lower-klamath-basin-heats-up/. Accessed: 2021-01-03.
[19] Release, K. W. U. A. P. Lower klamath lake nwr to begin receiving water from klamath project. Kla-
math Falls News (2019). URL https://www.klamathfallsnews.org/news/lower-klamath-lake-
nwr-to-begin-receiving-water-from-klamath-project.
[20] NOAA National Centers for Environmental information . Climate at a Glance: County Time Series
(2020). URL https://www.ncdc.noaa.gov/cag/. Published November 2020, Retrieved on December
8, 2020.
[21] Assembly, U. N. G. Transforming our world : the 2030 agenda for sustainable development,
a/res/70/1. 21 October 2015. Available at: https://www.refworld.org/docid/57b6e3e44.html [Ac-
cessed: 2021-01-03] (2015).
[22] Sentinel-hub. https://apps.sentinel-hub.com/eo-browser/. Sinergise Ltd.
[23] Gascon, F. et al. Copernicus sentinel-2a calibration and products validation status. Remote Sensing
9, 584 (2017).
[24] DONALD, P. F. et al. Important bird and biodiversity areas (ibas): the development and char-
acteristics of a global inventory of key sites for biodiversity. Bird Conservation International 29,
177–198 (2019).
[25] Birds die in suspected avian botulism outbreak. Newsline, Christchurch City Council (2018).
URL https://newsline.ccc.govt.nz/news/story/birds-die-in-suspected-avian-botulism-
outbreak.
[26] Tantau, K. Avian botulism outbreak killing hundreds of birds around firth of thames. Stuff
(2020). URL https://www.stuff.co.nz/environment/119389949/avian-botulism-outbreak-
killing-hundreds-of-birds-around-firth-of-thames.
[27] Avian botulism from sewage pond kills 600 birds. Radio New Zealand (2019). URL https://
www.rnz.co.nz/news/national/382315/avian-botulism-from-sewage-pond-kills-600-birds.
[28] Owen, C. Botulism outbreak in auckland parks killing hundreds of ducks. stuff
(2018). URL https://www.stuff.co.nz/environment/101002041/botulism-outbreak-in-
auckland-parks-killing-hundreds-of-ducks.
[29] Fallon, V. Mass bird deaths at kapiti coast lake blamed on avian botulism. Stuff (2018).
URL https://www.stuff.co.nz/environment/101619817/mass-bird-deaths-at-kpiti-coast-
lagoon-blamed-on-avian-botulism.
[30] Segal, Y. Cases of avian botulism found in victoria. Agriculture Victoria (2017).
URL https://agriculture.vic.gov.au/support-and-resources/newsletters/vetwatch-
newsletter/vetwatch-october-2017/cases-of-avian-botulism-found-in-victoria.
[31] Travis, J. Botulism suspect behind loon deaths. Record-Eagle (2019). URL https:
//www.record-eagle.com/botulism-suspect-behind-loon-deaths/article a9e0d01e-f1db-
11e9-aa52-936af29b7971.html.
[32] Harris, D. Outbreak kills 1000 water birds at canterbury wastewater plants. Stuff (2018).
URL https://www.stuff.co.nz/environment/101747128/outbreak-kills-1000-water-birds-
at-canterbury-wastewater-plants.
17[33] Creed, A. Duck mystery solved (letters to the editor). The Standard (2019). URL
https://www.standard.net.au/story/6394350/letters-ducks-have-gone-and-the-coots-
are-not-responsible/.
[34] Cutler, A. Gulls across weymouth and portland found dead from disease. Dorset
Echo (2019). URL https://www.dorsetecho.co.uk/news/17871936.gulls-across-weymouth-
portland-found-dead-disease/.
[35] Birdlife international (2020) important bird areas factsheet: Firth of thames. downloaded from
http://www.birdlife.org on 04/12/2020. BirdLife International .
[36] Birdlife international (2020) important bird areas factsheet: Lake balaton. downloaded from
http://www.birdlife.org on 04/12/2020. BirdLife International .
[37] Birdlife international (2020) important bird areas factsheet: Southern seewinkel and zitzmannsdorfer
wiesen. downloaded from http://www.birdlife.org on 04/12/2020. BirdLife International .
[38] Birdlife international (2020) important bird areas factsheet: Sleeping bear dunes national lakeshore
mainland (including donner point to dimmick’s point and glen arbor twp beaches). downloaded from
http://www.birdlife.org on 04/12/2020. BirdLife International .
[39] Notice of a type ix decision on a proposal in your neighborhood, case file number: Lu 17-162183
cn. City of Portland, Bureau of Development Services, Oregon Land Use Services URL https:
//www.portlandoregon.gov/bds/article/651613.
[40] San carlos apache tribe vs usa order. District Court, Arizona (2003). URL https://www.narf.org/
nill/bulletins/federal/documents/san carlos.html.
[41] Birdlife international (2020) important bird areas factsheet: Weymouth wetlands. downloaded from
http://www.birdlife.org on 04/12/2020. BirdLife International .
[42] Birdlife international (2020) important bird areas factsheet: Canterbury (offshore). downloaded
from http://www.birdlife.org on 04/12/2020. BirdLife International .
[43] Resource, A. S. & Development. Avian botulism in alberta factsheet. Alberta Avian
Botulism Factsheet (2004). URL https://open.alberta.ca/dataset/4c943b95-806f-
472d-a1a0-a81195e25ab3/resource/7c20e7f3-a2d6-4f76-9cc3-abbc77c74391/download/
avianbotulism-factsheet-mar2004.pdf.
[44] Birdlife international (2020) important bird areas factsheet: Pakowki lake. downloaded from
http://www.birdlife.org on 04/12/2020. BirdLife International .
[45] LeCun, Y., Bengio, Y. & Hinton, G. Deep learning. nature 521, 436–444 (2015).
[46] LeCun, Y. et al. Handwritten digit recognition with a back-propagation network. In Advances in
neural information processing systems, 396–404 (1990).
[47] Karaoui, I. et al. Evaluating the potential of sentinel-2 satellite images for water quality charac-
terization of artificial reservoirs: The bin el ouidane reservoir case study (morocco). Meteorology
Hydrology and Water Management. Research and Operational Applications 7, 31–39 (2019).
[48] Pizani, F. M., Maillard, P., Ferreira, A. F. & de Amorim, C. C. Estimation of water quality in a
reservoir from sentinel-2 msi and landsat-8 oli sensors. ISPRS Annals of Photogrammetry, Remote
Sensing & Spatial Information Sciences 5 (2020).
[49] Kutser, T. et al. Using satellite remote sensing to estimate the colored dissolved organic matter
absorption coefficient in lakes. Ecosystems 8, 709–720 (2005).
[50] Sun, D. et al. Remote sensing estimation of sea surface salinity from goci measurements in the
southern yellow sea. Remote Sensing 11, 775 (2019).
[51] Torres-Bejarano, F., Arteaga-Hernández, F., Rodrı́guez-Ibarra, D., Mejı́a-Ávila, D. & González-
Márquez, L. Water quality assessment in a wetland complex using sentinel 2 satellite images.
International Journal of Environmental Science and Technology 1–12 (2020).
18[52] Lafrancois, B., Riley, S., Blehert, D. & Ballmann, A. Links between type e botulism outbreaks,
lake levels, and surface water temperatures in lake michigan, 1963–2008. Journal of Great Lakes
Research 37, 86–91 (2011).
[53] QGIS Development Team. QGIS Geographic Information System. Open Source Geospatial Foun-
dation (2009). URL http://qgis.osgeo.org.
[54] Ronneberger, O., Fischer, P. & Brox, T. U-net: Convolutional networks for biomedical image
segmentation. In International Conference on Medical image computing and computer-assisted in-
tervention, 234–241 (Springer, 2015).
[55] Krizhevsky, A., Sutskever, I. & Hinton, G. E. Imagenet classification with deep convolutional neural
networks. Communications of the ACM 60, 84–90 (2017).
[56] Konar, J., Khandelwal, P. & Tripathi, R. Comparison of various learning rate scheduling techniques
on convolutional neural network. In 2020 IEEE International Students’ Conference on Electrical,
Electronics and Computer Science (SCEECS), 1–5 (IEEE, 2020).
[57] Rocke, T. E. & Samuel, M. D. Water and sediment characteristics associated with avian botulism
outbreaks in wetlands. The Journal of Wildlife Management 1249–1260 (1999).
Data and Code availability
Authors can share entire BAWD dataset and code used in this study upon reasonable request.
Acknowledgements
Authors would like to acknowledge CYRAN AI Solutions for providing computing resources to perform
this study. We thank Sentinel and Copernicus programs for hosting useful remote-sensing data freely in
public domain.
Competing Interests
Authors would like to declare no competing interests.
Author Contributions
N.B designed the AVI-BoT and custom models. All authors worked on AI model refinement and opti-
mization. D.M and J.S contributed to building the BAWD dataset. All authors contributed to analysis
and result interpretation. N.B and M.S wrote and edited the manuscript. All authors contributed to
reviews. M.S. designed the study.
19You can also read