Supporting Better Decision-Making: A Combined Grey Model and Data Envelopment Analysis for Efficiency Evaluation in E-Commerce Marketplaces - MDPI
←
→
Page content transcription
If your browser does not render page correctly, please read the page content below
sustainability

Article
Supporting Better Decision-Making: A Combined
Grey Model and Data Envelopment Analysis for
Efficiency Evaluation in E-Commerce Marketplaces
Chia-Nan Wang 1, *, Thanh-Tuan Dang 1,2, * , Ngoc-Ai-Thy Nguyen 1               and Thi-Thu-Hong Le 3,4
 1    Department of Industrial Engineering and Management, National Kaohsiung University of Science
      and Technology, Kaohsiung 80778, Taiwan; thy.logistics@gmail.com
 2    Department of Logistics and Supply Chain Management, Hong Bang International University,
      Ho Chi Minh 723000, Vietnam
 3    School of Accounting, University of Economics Ho Chi Minh City, Ho Chi Minh City, Vietnam;
      hongle2011@gmail.com
 4    Faculty of Accounting, Banking and Finance, Ho Chi Minh City Industry and Trade College,
      Ho Chi Minh City 715939, Vietnam
 *    Correspondence: niceray4731@gmail.com (C.-N.W.); tuandang.scm@gmail.com (T.-T.D.)

 Received: 31 October 2020; Accepted: 10 December 2020; Published: 11 December 2020

 Abstract: E-commerce has become an integral part of businesses for decades in the modern world,
 and this has been exceptionally speeded up during the coronavirus era. To help businesses understand
 their current and future performance, which can help them survive and thrive in the world of
 e-commerce, this paper proposes a hybrid approach that conducts performance prediction and
 evaluation of the e-commerce industry by combining the Grey model, i.e., GM (1, 1) and data
 envelopment analysis, i.e., the Malmquist-I-C model. For each e-commerce company, GM (1, 1) is
 applied to predict future values for the period 2020–2022 and Malmquist-I-C is applied to calculate
 the efficiency score based on output variables such as revenue and gross profit and input variables
 such as assets, liabilities, and equity. The top 10 e-commerce companies in the US market are
 used to demonstrate model effectiveness. For the entire research period of 2016–2022, the most
 productive e-commerce marketplace on average was eBay, followed by Best Buy and Lowe’s;
 meanwhile, Groupon was the worst-performing e-commerce business during the studied period.
 Moreover, as most e-commerce companies have progressed in technological development, the results
 show that the determinants for productivity growth are the technical efficiency change indexes.
 That means, although focusing on technology development is the key to e-commerce success,
 companies should make better efforts to maximize their resources such as labor, material and
 equipment supplies, and capital. This paper offers decision-makers significant material for evaluating
 and improving their business performance.

 Keywords: e-commerce; Malmquist-I-C; GM (1, 1); performance; efficiency; prediction; evaluation;
 decision making

1. Introduction
     Electronic commerce (e-commerce) is thriving in every corner of the world nowadays as purchasing
goods and services online has become a common practice among many people because of its convenience.
In 2019, an astounding 1.92 billion people shopped online [1]. Amid the Covid-19 online sales boom,
the e-commerce industry has accelerated to the forefront of the global retail framework. Increasing
from 16.07 billion visits worldwide (January 2020), with exceptionally high demand for everyday
goods such as groceries, clothes, and retail tech products, global retail e-commerce traffic reached a

Sustainability 2020, 12, 10385; doi:10.3390/su122410385                     www.mdpi.com/journal/sustainability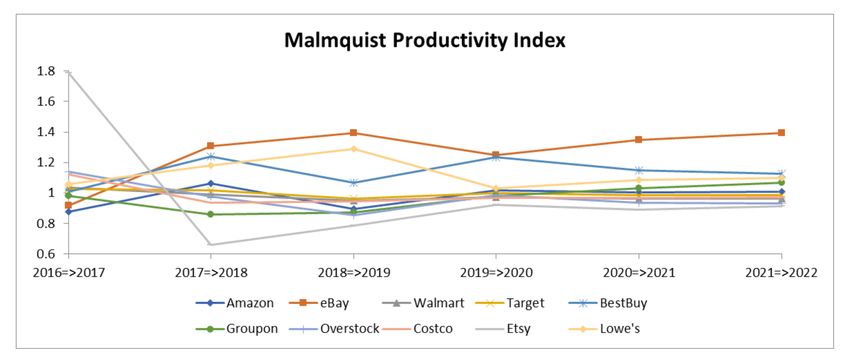
Sustainability 2020, 12, 10385                                                                         2 of 24

record 22 billion visits in June 2020 [2]. In 2021, the number of digital buyers will be continuously
growing, with over 2.14 billion people worldwide expected to shop online [3].
     More and more companies around the world have expanded in e-commerce. Many e-commerce
businesses are using customized technologies to give customers a personalized experience. Considering the
widespread success of many e-commerce brands, it is undisputed that the United States (US) is a notable
leader in the global e-commerce sector. The US is presently the second largest e-commerce market in
the world after having dominated the world of e-commerce for more than a decade, with annual
online sales of 340 billion US dollars [4], placing it ahead of the United Kingdom and behind China.
Driven by e-commerce giants such as Amazon and eBay, the US is seeing this market flourish in all
sectors and has become the innovation house of new e-commerce trends for the most part. Remarkably,
Amazon’s net sales skyrocketed, increasing 40% to 88.91 billion US dollars in the second quarter of 2020,
compared with 63.4 billion in the 2nd quarter in 2019 [5]. While the mass furloughs and layoffs began
across many countries in the Covid-19 era, Amazon announced they were to hire 100,000 workers
to meet surging demand. The company is built on a previously successful model, leveraging its
already best-in-class online delivery system to offer a next-day nationwide delivery feature (Prime) [6].
Walmart has outstripped eBay in e-commerce sales for the first time as a result of leveraging digitally
native brands, advanced website and app experience, successful click-and-collect operations, and more
dynamic delivery times. First-rate merchandising, expedited online delivery, and curbside pickup
capability have led Target to join the ranks of the leading e-commerce retail companies in 2020 [7],
reporting a total sale of 42.07 billion US dollars for the first six months of the fiscal year [8]. By the end
of 2020, with a forecast market share of 39%, Amazon is the biggest e-commerce player by leaps and
bounds. Next in line is Walmart, with a 5.3% market share, followed by eBay (4.7%), Best Buy (1.3%),
and Costco (1.2%), to name just a few [9].
     Technological advances have had an enormous impact on the world of e-commerce, transforming
the way digital customers interact with brands and helping them to shop more cost-effectively. These
transformations open new opportunities for online businesses and speed up the pace of industry
growth. Over the past few years, some of the most emerging and notable technological innovations
that have shaped the future of the online shopping experience and driven forward e-commerce success
are as follows: big data analytics, machine learning, and artificial intelligence (AI) [10], AI-powered
chatbots and voice assistant applications [11], electronic wallets [12], blockchain technology [13],
and cognitive supply chain management [14], to name a few. These innovations have led to a vigorous
race for technology between all giants in the e-commerce industry. Moreover, effective technical
performance and some key factors in e-commerce success, such as regulation of product pricing,
maintenance of high-quality products, security, fast and affordable shipping options, to name a few,
should be persistently determined.
     Many notable studies have looked into e-commerce recently and have provided significant material
for businesses in terms of both technical and technological e-commerce advancements. Ijaz et al. [15]
emphasized the important role of virtual stores of retail businesses. A virtual store is an online
store that offers a checklist of merchandisers and an order form. The paper aimed at selecting a
distinct layout that can be used in digital signage. The results indicated that enhancement in the
quality and utility of virtual store layouts help boost the revenue of businesses as the customer’s
relationship with the retailer will become stronger. Information systems and consumer behavior
are found to be the most influencing factors for online shopping [16,17]. Many studies’ findings are
useful guidelines for retailers and e-businesses to enhance their service quality and customers’ online
shopping experiences. For example, a unified information system–consumer behavior model was
developed in [18] to measure some highly influencing factors to online shopping processes. To extract
and utilize information from customer behavior, Alfian et al. [19] utilized real-time data processing
and the association rule for digital-signage-based online stores. Wagner et al. [20] identified and
classified the multiplicity of devices and the diversity of e-channel touchpoints now used for online
purchases. Atmosphere cues, such as colors and music, are found to have significant impacts on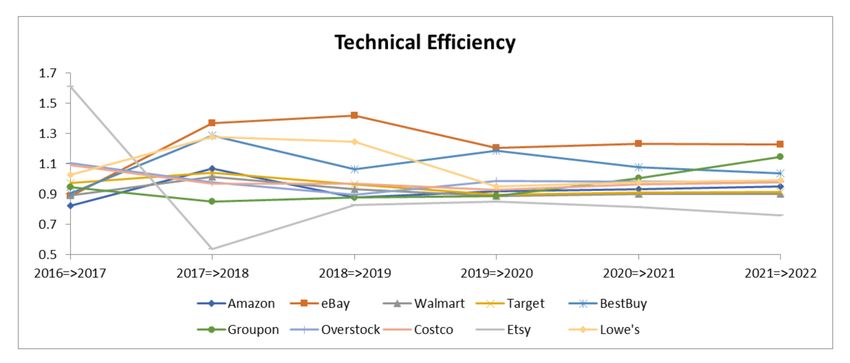
Sustainability 2020, 12, 10385                                                                     3 of 24

emotional responses and behavioral intention, as presented in an experimental study of online stores
in [21], which proposed an efficient online store environment that results in more time spent in-store,
repurchasing, and revisiting. During the pandemic, more consumers are turning to electronic shopping,
which indicates that the accumulation of demand for niche products could be ever-increasing. As an
example of the shift to online food shopping services, the investigation of mechanisms in the study of
Chang and Meyerhoefer [22] found that sales were highly receptive to Covid-19 in terms of media
coverage and online content. The authors presented an empirical study that focused on measuring how
online shopping relates to the number of Covid-19 cases in an individual’s local area. With reference to
the severe impacts of the Covid-19 pandemic on business activities, Tran [23] presented a systematic
approach to investigate the effect of the perceived effectiveness of e-commerce platforms on consumers’
perceived economic benefits in forecasting sustainable consumption.
     This paper proposes an integrated model combining GM (1, 1) and Malmquist-I-C models in a data
envelopment analysis (DEA) in order to measure and predict, from 2016 to 2022, the technical efficiency
and frontier-shift (technological change) of the 10 largest e-commerce marketplaces in the US that
have had, and continue to have, an enormous influence on global online selling. The Grey prediction
model is used to produce potential metrics, which are considered key performance measurements that
describe how a company is successfully achieving its goals; they are necessary data for businesses to
make strategic production plans and be prepared for numerous difficult circumstances. Malmquist-I-C
is applied to calculate technical efficiency and technological change and the overall productivity growth
of the companies for the period 2016–2022. This paper aims to provide comprehensive insights into
e-commerce companies to evaluate their historical, current, and future overall performance compared
with other rivals, especially in the Covid-19 era, since it has been found that the pandemic has given
a major boost to this industry. To the best of our knowledge, there has not been a combination
of these forecasting models, i.e., GM (1, 1) and DEA, to evaluate and predict the performance of
e-commerce companies. The managerial implications of this paper can help businesses improve
their decision-making processes and find out key success factors in order to harness and enhance
e-commerce for sustainable development.
     This paper is structured as follows. A review of relevant studies is shown in Part 2. Part 3 gives a
short discussion of the Grey model and data envelopment analysis. Part 4 discusses the analysis of the
results. Discussion, conclusion, and limitations of the paper are shown in Part 5.

2. Literature Review

2.1. Grey Model
      First introduced in 1982 by Deng [24], the Grey model has become a very popular method for
solving uncertain problems with rare and incomplete data; as an advantage over traditional statistical
models, it can address problems with a small number of data to predict the behavior of an unknown
system [25]. In most studies, the Grey model is presented as GM (m, n), where m is the order, and n
is the number of variables in the modeling equation. GM (1, 1) is the simplest model and most
widely proposed as a useful forecasting model in many areas, such as day trading stock price [26],
the optic–electronics industry [27], and the high-tech industry [28]. To increase the accuracy of Grey
prediction models, an improved data modeling approach is discussed in [29], in which Grey models
are advanced to determine the interaction between an input–output process, ambiguous internal
relationships, unknown processes, and inadequate information. In fuzzy GM (1, 1), which considers
fuzzy inputs as developed data [30], the relationship between GM (1, 1) and the fuzzy dataset is built
such that when the system is unpredictable and vague, the fuzzy GM (1, 1) can be applied to predict
the likely future trend. The relationship between the fuzzy method and the Grey model from the study
had a fundamental link to robust methods of short-term forecasting to solve the forecasting problem.
Sustainability 2020, 12, 10385                                                                       4 of 24

2.2. Data Envelopment Analysis (DEA)
      This research employs the DEA Malmquist productivity index to measure the productivity changes
over time and to get insight into the sources of its transformation, i.e., developed by Fare et al. [31,32].
DEA is linear programming (LP)-based technique that is used for the performance evaluation of
decision-making units (DMUs). This method has successfully been used in many applications such as
education, banking, aviation, and energy sustainability, to name just a few. For example, Briec et al.
analyzed productivity growth and the nature of technical change for a case study of Portuguese
hydroelectric-generating plants [33]. The authors used the Malmquist productivity index for a
comparative purpose. There seems to have been a global transformation from the implementation of
the decomposition of technological change to the frontier of best practice; this is the overall catalyst
of technical change. Romano and Guerrini applied DEA to measure and compare water utility
companies’ performance, concluding varying degrees of importance that had significant effects on
water use [34]. Merkert and Hensher [35] proposed a two-stage DEA methodology to evaluate key
system measurements of passenger airlines and find out some key factors that have major impacts
on all three phases of airline efficiency: technological, allocative, and, eventually, cost-effectiveness.
For the hi-tech industry, Qazi and Yulin used the Malmquist productivity index to identify the sources
of its growth [36]. Not only applying DEA to one single industry, Lee et al. measured capabilities
among many industries in South Korea in terms of patent applications and suggested some strategies
to make it possible for weak industries to become stronger, emphasizing that the importance of patents
as a way of defending and improving technology and competitiveness has been increased by global
competition [37].

2.3. Methodology Motivation
      Some of the widely used methodologies to assess e-businesses’ performance or related firms are
summarized in Table 1. Typical key system measurements that are ranked or evaluated are financial
performance [38], supply chain integration [39], website performance [40–43], cost efficiency [44,45],
productivity effects [46–48], technical and technological efficiency [49–55], security [56], and success
factors [57], to name just a few. In terms of methodologies, the potential and strengths of DEA in
e-commerce performance evaluation are highlighted in many studies. CCR (Charnes–Cooper–Rhodes)
and BCC (Banker–Charnes–Cooper) are basic models of DEA. The CCR model identifies the overall
inefficiency, while the BCC model differentiates between technical efficiency and scale efficiency,
as discussed in [48,51,52,58–60]. In order to discriminate the performance among efficient DMUs,
a super slack-based measure (super SBM), based on the traditional DEA model, was applied in [38,54,55].
Developed by Tone [61], the super SBM model can not only obtain a complete ranking of effective
DMUs but also eliminates the slack problem, further optimizes the shortcomings, and shows a more
accurate metric. The DEA Malmquist model is an extension of the original DEA model that divides total
productivity change into technical efficiency change and technological efficiency change, as proposed
in [46,50,53]. Some other methodologies that are widely used for the evaluation of e-commerce
impact on business efficiency include the model of cost efficiency [45,47,62,63], the regression
model [39,44,48,49,51,52], the analytical hierarchy process (AHP), and the technique for order of
preference by similarity to ideal solution (TOPSIS) and/or under fuzzy conditions [41–43]. From our
literature review, a hybrid approach that combines the forecasting model GM (1, 1) and DEA Malmquist
to predict and evaluate the performance of e-commerce companies has never been reported. This lack
attracted our attention. Therefore, this paper aims to provide an evaluation method for businesses to
find out key factors, drawbacks, and opportunities that affect their success in the e-commerce industry.
Sustainability 2020, 12, 10385 5 of 24
Table 1. A summary list of widely methodologies for relevant problems.
Regression Model
DEA Super SBM
DEA Malmquist
(Fuzzy) TOPSIS
Cost Efficiency
(Fuzzy) AHP
DEA CCR
DEA BCC
No. Authors Year
1 Donthu and Yoo [48] 1998 x x
2 Ashton et al. [45] 2001 x
3 Ratchford [47] 2003 x
4 Chen et al. [38] 2004 x
5 Kong et al. [57] 2005 x
6 Barros [51] 2006 x x
7 Perrigot and Barros [52] 2008 x x x
8 Baršauskas et al. [62] 2008 x
9 Ho et al. [63] 2009 x
10 Iyer et al. [39] 2009 x
11 Yu and Ramanathan [50] 2009 x
12 Ho [58] 2011 x
13 Yu et al. [41] 2011 x x
14 Zhang et al. [56] 2012 x
15 Yang et al. [59] 2014 x x
16 Zhou et al. [49] 2014 x
17 Yang et al. [60] 2016 x x
18 Grüschow et al. [44] 2016 x
19 Shao and Lin [53] 2016 x
20 Kang et al. [42] 2016 x
21 Yang et al. [46] 2017 x
Aggarwal and Aakash
22 2018 x x
[43]
23 Hongping et al. [55] 2018 x
24 Rouyendegh et al. [40] 2019 x
25 Shan et al. [54] 2019 x
Notes: DEA: data envelopment analysis; CCR: Charnes–Cooper–Rhodes; BBC: Banker–Charnes–Cooper;
SBM: slack-based measure; AHP: analytical hierarchy process; TOPSIS: technique for order of preference by
similarity to ideal solution.
3. Materials and Methods
3.1. Research Framework
This research proposes an integrated model of GM (1, 1) and Malmquist-I-C for operational
efficiency prediction and evaluation in the e-commerce industry for the period from 2016 to 2022.
The research framework includes three main parts that are presented in Figure 1.Sustainability 2020, 12, 10385 6 of 24
Figure 1. Research framework.
In the first part, the research problem is defined. This paper considers the top 10 e-commerce
companies in the US market, which are considered DMUs. Additionally, the inputs and outputs are
considered based on their influence on the model approach. Input variables include assets, liabilities,
and equity. Revenue and gross profit are considered output variables. The second part describes the
integrated model. Firstly, based on historical data (2016–2019), GM (1, 1), and mean absolute percentage
error (MAPE) tests are used to predict future values (2020–2022). Then, the Malmquist-I-C model and
the Pearson correlation test are used to assess the operational efficiency of 10 DMUs. The last part
provides model results, discussions, and recommendations for future studies.
3.2. GM (1, 1) Model
Grey forecasting, GM (1, 1), is very useful in cases where there is a lack of historical data (however,
the model requires at least four periods of time of historical data). The process of calculation is
presented in Figure 2 below [25,64,65].
Figure 2. The Grey model (GM (1, 1)) process.Sustainability 2020, 12, 10385 7 of 24
The original time-series data X(0) , is shown in Equation (1):
h i
X (0) = X (0) ( 1 ) ; X (0) ( 2 ) ; . . . ; X (0) ( n ) , n ≥ 4 (1)
where n denotes the total historical time period.
We generat e X(1) by using the accumulating generation operation (AGO) to eliminate the
uncertainties of the original data. Equation (2) shows the equation of AGO:
h i
X (1) = X (1) ( 1 ) ; X (1) ( 2 ) ; . . . ; X (1) ( n ) , n ≥ 4 (2)
X (1) ( 1 ) = X (0) ( 1 )
(
where , k = 1, 2, . . . , n.
X(1) (k) = ki=1 X(0) (i)
P
We generate the partial data series Z(0) in Equation (3):
h i
Z(1) = Z(1) ( 2 ) ; Z(1) ( 3 ) ; . . . ; Z(1) ( n ) , n ≥ 4 (3)
where Z(1) (k) is the value of the mean sequence, as described in Equation (4).
1 h i
Z(1) ( k ) = × X(1) (k) + X(1) (k − 1) , k = 2, 3, . . . , n (4)
2
From X(1) in Equation (2), the first-order differential equation X(1) (k) of GM (1, 1) is built as
Equation (5):
dX(1) (k)
+ uX1 (k) = v (5)
dk
where u denotes the developing coefficient and v denotes the input of GM (1, 1), respectively.
Practically, the value of parameters u and v cannot be computed directly from Equation (5).
Therefore, these parameter values can be computed by using the least-square method in Equation (6):
ˆ (1)
v −uk
v
X ( k + 1 ) = X (0) ( 1 ) − e + (6)
u u
ˆ (1)
where X (k + 1) represents the value of the forecast of X at stage k + 1. The value of coefficients
[u, v]T can be attained using the ordinary least square (OLS) method, as defined by Equations (7)–(9).
" #
u −1
= HT H HT K (7)
v
X (0) ( 2 )
X (0) ( 3 )
.........
K = (8)
.........
X (0) ( n )
−Z(1) (2)
1
−Z(1) (3)
1
H = ......... ...
(9)
......... ...
−Z(1) (n) 1
where [u, v]T is the parameter series, K is the data series, and H is the data matrix.Sustainability 2020, 12, 10385 8 of 24
ˆ (1) ˆ (0)
From the values of X (k + 1) in Equation (6), set X becomes the forecasted series in Equation (10):
ˆ (0)
(0)
ˆ (0) ˆ (0)
ˆ
= X (1); X (2); . . . ; X (n)
X (10)
ˆ (0)
where X (1) = X(0) (1).
Applying the inverse-accumulated generation operation, Equation (11) is attained as follows:
ˆ (0)
v −uk
X ( k + 1 ) = X (0) ( 1 ) − e (1 − eu ) (11)
u
The values of predictive accuracy can be measured using the mean absolute percentage error
(MAPE), which is named α [65]. The formula is presented as follows:
ˆ (0)
(0)
1 X
X
( )
k − X ( )
k
α= × 100% (12)
n
X (0) ( k )
α ≤ 10% : High Accuracy, 10% < α ≤ 20% : Good
(
where .
20% 50% : Inaccurate
3.3. Malmquist-I-C Model
The Pearson coefficient (i.e., the isotropic condition) must be tested before using the Malmquist-I-C
model [66]. This Pearson coefficient shows the correlation of two factors, where their values range from
(−1; 0; +1), presenting the relationship in negative, none, and positive linear relationships, respectively.
The DEA model needs data in a positive relationship. The formula of Pearson (rpq ) is presented as
Equation (13) below. Pn Pn
i = 1 pi i = 1 q i
Pn
p
i=1 i iq − n
rpq = s (13)
2 2
Pn ! Pn !
Pn 2 ( i = 1 pi ) P n 2 ( i=1 qi )
i=1 pi − n i = 1 qi − n
where n denotes sample size; pi , qi denote the locations of individual sample i.
In this research, the Malmquist productivity index (MPI) is used for evaluating the operational
efficiency of the top e-commerce company in the US for the period 2016–2019. The operational
efficiency of the DMUs is measured from period t to period t+1, consisting of technical efficiency
(i.e., catch-up index, CIt→t+1 ), technological efficiency (i.e., frontier-shift index, FItt+1 ), and MPI
(i.e., MPItt+1 ), are shown in Equations (14)–(16) [32,67].
OZtt+
+1
1
OZt+1 TSEt+1
CIt→t+1 = = (14)
OZtt TSEt
OZt
1/2
OZt+1
OZtt #1/2
OZt × OZtt+1 TSEt IEIt+1→t
"
FItt+1 = t
= × (15)
OZt+1 +1
OZtt+
1 TSEt+1 IEIt→t+1
OZt
× OZt+1
t+1
i1/2
TSEt IEIt+1→t
h
MPItt+1 = CIt→t+1 × FItt+1 = TSE
TSEt × TSEt+1
× IEIt→t+1
h t+1 i1/2 (16)
t+1 TSE IEIt+1→t
MPIt = TSEt × IEIt→t+1Sustainability 2020, 12, 10385 9 of 24
Malmtt+1 < 1 : decrease in operational e f f iciency
Malmtt+1 = 1 : no change in operational e f f iciency .
where
Malmt+1 > 1 : increase in operational e f f iciecny
t
4. Empirical Results
4.1. Data Analysis
The selection of inputs and outputs significantly affects the Malmquist model’s results [68].
Based on the importance of financial indexes and the list of the used inputs and outputs in previous
studies (Table 2), this paper considers three inputs (assets, liabilities, equity) and two outputs (revenue,
gross profit), which are used in the proposed model. These index systems for operational efficiency
evaluation and prediction in the e-commerce industry are described as follows and can be found in
Figure 3.
• (I1) Assets: tangible and intangible assets owned by an e-commerce firm, i.e., properties, equipment.
• (I2) Liabilities: outstanding checks, compensation, current portion of debt, accounts payable.
• (I3) Equity: total tangible and intangible assets minus liabilities.
• (O1) Revenue: income of e-commerce enterprise when they operate the business, i.e., the value of
goods and services of their business.
• (O2) Gross profit: profits appear as revenue minus the cost of goods sold. Note that gross profit is
not deducted from other fixed and variable expenses, i.e., rent, utilities, payroll.
Table 2. List of the used inputs and outputs in previous studies.
Research
No. Authors Year Inputs Outputs
Scope
Sales
Web technology Capital
E-commerce
1 Wen et al. [69] 2003 Operating cost Capacity
12 DMUs
Staffs Utilization
Site quality
Deposit
Online
Operation cost Revenue
2 Ho and Wu [63] 2009 banking
Employees Daily reach rate
45 DMUs
Equipment
Equity
Net sales
Liability
Net income E-retailing
3 Lu and Hung [70] 2011 Employees
Market value 30 DMUs
Operating
Intangible value
expense
Assets
Revenue
Equity
Profit Internet
4 Ho [58] 2011 Operating
ROA 69 DMUs
expense
ROE
Employees
Equipment
Revenue E-banking
5 Tao et al. [71] 2013 Operating cost
Web metrics 32 DMUs
Employees
Costs
Revenue E-commerce
6 Yang et al. [59] 2014 Assets
Profit 25 DMUs
Labors
Employees
Operating Revenue E-commerce
7 Yang et al. [60] 2016
expenses Market share 35 DMUs
Total assets
Notes: DMU: decision-making units; ROA: return on assets; ROE: return on equity.Sustainability 2020, 12, 10385 10 of 24
Figure 3. Inputs and outputs selection.
Table 3 presents the list of top 10 e-commerce companies in the US, i.e., 10 DMUs of the paper’s
model [72,73], consisting of Amazon, eBay, Walmart, Target, BestBuy, Groupon, Overstock, Costco,
Etsy, and Lowe’s. The revenues in 2019 of these DMUs are included. The authors collected historical
data of inputs and outputs of these DMUs for the period from 2016–2019 from annual financial
statements [74]. The statistics description on input and output variables (e.g., maximum, minimum,
average, standard deviation) are presented in Table 4.
Table 3. The list of 10 e-commerce companies in the US.
Revenue in 2019
Number DMUs Company Code
(Million USD)
1 ECOM01 Amazon AMZN 280,522
2 ECOM02 eBay EBAY 10,800
3 ECOM03 Walmart WMT 514,405
4 ECOM04 Target TGT 75,356
5 ECOM05 BestBuy BBY 42,879
6 ECOM06 Groupon GRPN 2219
7 ECOM07 Overstock OSTK 1459
8 ECOM08 Costco COST 152,703
9 ECOM09 Etsy ETSY 818
10 ECOM10 Lowe’s LOW 71,309
Table 4. Statistics on input and output data (2016–2019).
2016 Assets Liabilities Equity Revenue Gross profit
Max 199,581 115,970 83,611 482,130 121,146
Min 485.08 236.44 172.96 364.97 241.64
Average 42,786.76 27,632.89 15,153.88 92,351.03 22,751.79
SD 57,388.93 34,531.64 23,612.10 137,963.47 34,189.54
2017 Assets Liabilities Equity Revenue Gross profit
Max 198,825 118,290 80,535 485,873 124,617
Min 433.82 208.69 172.12 441.23 290.25
Average 48,087.49 33,057.20 15,030.29 98,127.59 24,427.97
SD 61,988.78 40,406.52 23,164.90 140,988.77 35,476.91
2018 Assets Liabilities Equity Revenue Gross profit
Max 204,522 123,700 80,822 500,343 126,947
Min 461.22 250.51 210.71 603.69 353.91
Average 52,116.32 35,522.00 16,594.32 107,326.30 27,086.84
SD 68,007.85 44,284.93 24,639.66 148,731.93 37,264.74
2019 Assets Liabilities Equity Revenue Gross profit
Max 225,248 163,188 79,634 514,405 129,104
Min 417.73 239.87 177.86 818.38 293.09
Average 60,036.28 42,098.83 17,937.45 115,247.07 28,891.96
SD 82,608.74 56,109.37 27,163.90 157,013.03 39,347.58
Unit: million USD.Sustainability 2020, 12, 10385 11 of 24
4.2. Results of GM (1, 1)
In this paper, the Grey forecasting model, GM (1, 1), is used to predict the future value of DMUs
(2020–2022) based on historical data (2016–2019). Table 5 shows the data collection of input and output
variables for the period from 2016 to 2019 of ECOM01-Amazon. The following procedures present an
example of the calculation of ECOM01-Amazon, e.g., (I) Assets; other variables are calculated using
the same methodology.
Table 5. ECOM01 (Amazon) data collection of input and output variables (2016–2019).
ECOM01 Assets Liabilities Equity Revenue Gross Profit
2016 83,402 64,117 19,285 135,987 30,103
2017 131,310 103,601 27,709 177,866 40,683
2018 162,648 119,099 43,549 232,887 59,704
2019 225,248 163,188 62,060 280,522 74,754
Unit: million USD.
Step 1: Input original time-series data X(0) , Equation (1).
X(0) = (X(0) (1); X(0) (2); X(0) (3); X(0) (4)) = (83, 402; 131, 310; 162, 648; 225, 248)
Step 2: Generate time-series data X(1) from X(0) , Equation (2).
X(1) = (X(1) (1); X(1) (2); X(1) (3); X(1) (4)) = (83, 402; 214, 712; 377, 360; 602, 608)
where
X(1) (1) = X(0) (1) = 83, 402
X (1) ( 2 )
= X(0) (1) + X(0) (2) = 214, 712
X(1) (3) = X(0) (1) + X(0) (2) + X(0) (3) = 377, 360
X (4) = X(0) (1) + X(0) (2) + X(0) (3) + X(0) (4) = 602, 608
( 1 )
Step 3: Generate partial series data Z(1) from X(1) , Equations (3) and (4).
X(1) (1) = X(0) (1) = 83, 402
= 12 (83, 402 + 214, 712) = 149, 057
Z(1) ( 2 )
Z (3) = 12 (214, 712 + 377, 360) = 296, 036
( 1 )
Z(1) (4) = 12 (377, 360 + 602, 608) = 489, 984
Hence, Z(1) = Z(1) (2); Z(1) (3); Z(1) (4) = (149, 057; 296, 036; 489, 984)
Step 4: Calculate coefficient u and Grey input v, Equations (5)–(9).
(0)
X (2) 131, 310
(0)
K = X (3) = 162, 648
(0)
X (4) 225, 248
−Z(1) (2) 1 −149, 057
1
H = −Z(1) (3) 1 = −296, 036
1
−Z(1) (4) 1
−489, 984 1
" # " #
u
T
−1
T −0.28
= H H H K=
v 86421.56
Step 5: Construct GM (1, 1) prediction equation, Equations (10) and (11). The predicted results
are shown in Table 6 as follows.Sustainability 2020, 12, 10385 12 of 24
Table 6. Value of prediction of ECOM01 (Amazon) assets (2016–2022).
ˆ (1) ˆ (0)
k (Year) X (k) Value X (k) Value
ˆ (1) ˆ (0)
k = 0, (2016) X (0) 83,402 X (0) 83,402
ˆ (1) ˆ (0)
k = 1, (2017) X (1) 209,758.64 X (1) 126,356.64
ˆ (1) ˆ (0)
k = 2, (2018) X (2) 376,609.03 X (2) 166,850.40
ˆ (1) ˆ (0)
k = 3, (2019) X (3) 596,930.30 X (3) 220,321.27
ˆ (1) ˆ (0)
k = 4, (2020) X (4) 887,858.36 X (4) 290,928.06
ˆ (1) ˆ (0)
k = 5, (2021) X (5) 1,272,020.71 X (5) 384,162.35
ˆ (1) ˆ (0)
k = 6, (2022) X (6) 1,779,296.32 X (6) 507,275.61
Note: calculated by the authors.
Other variables are calculated using the same methodology. All forecast values of input and
output variables for the period from 2020 to 2022 are shown in Table A1 (Appendix A).
Step 6: Evaluate the accuracy of the results, Equation (12). The summary of the MAPE of the
DMUs is presented in Table 7. From the results, the range of MAPE values is from 0.20% to 3.43%.
These values are less than 10%; hence, the forecast results have high accuracy.
Table 7. The summary of mean absolute percentage error (MAPE) of the decision-making units (DMUs).
Company Assets Liabilities Equity Revenue Gross profit Average
Amazon 2.14% 3.14% 2.04% 1.28% 2.51% 2.22%
eBay 1.60% 0.05% 9.85% 1.85% 2.31% 3.13%
Walmart 0.70% 1.30% 0.31% 0.03% 0.03% 0.47%
Target 0.27% 1.08% 1.71% 0.23% 1.12% 0.88%
BestBuy 0.81% 0.24% 3.02% 0.84% 0.61% 1.10%
Groupon 0.22% 1.16% 6.53% 1.60% 1.62% 2.22%
Overstock 2.67% 0.01% 6.23% 4.43% 3.79% 3.43%
Costco 0.14% 0.32% 0.23% 0.27% 0.04% 0.20%
Etsy 3.32% 7.68% 0.07% 0.84% 1.30% 2.64%
Lowe’s 0.80% 0.03% 6.60% 0.25% 1.05% 1.75%
Note: calculated by the authors.
4.3. Results of Malmquist-I-C
4.3.1. Pearson Correlation
According to Wang et al. [66], the Pearson coefficient, i.e., the isotropic condition, must be tested
before using the DEA Malmquist model. This Pearson coefficient shows the correlation of two factors,
where their values range from (−1; 0; +1), presenting the relationship in negative, none, and positive
linear relationships, respectively. The DEA model needs data in a positive relationship. Table 8 shows
the Pearson correlation indexes for the whole period, including the historical period from 2016 to 2019
and the future period from 2020 to 2022. Pearson correlation matrices coefficients are accompanied
by p-values, which are significant at the 0.01 level (2-tailed). From the results, all coefficients are
statistically significant, and the range of Pearson values is from 0.894 to 1. The strongest correlations
are between assets and liabilities. Hence, the data is verified for using the Malmquist-I-C model.
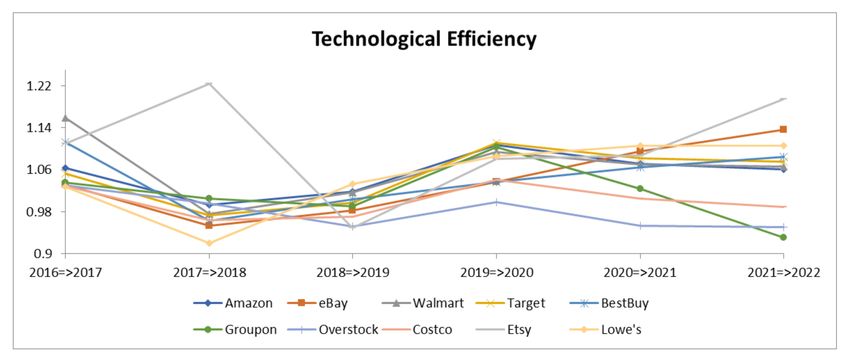
4.3.2. Technical Efficiency Change
Technical efficiency assessment in the e-commerce industry is essential as technical development
increases competitiveness through product diversification and effective services. The catch-up index isSustainability 2020, 12, 10385 13 of 24
used to assess annual technical efficiency changes. Thus, e-commerce companies should pay attention
to technical efficiency improvement by observing these indexes periodically.
Table 8. Pearson correlation (2016–2022).
Inputs Outputs
Assets Liabilities Equity Revenue Gross profit
Pearson correlation 1 0.996 ** 0.988 ** 0.908 ** 0.952 **
Assets p-value 0.000 0.000 0.000 0.000
Sample size 70 70 70 70 70
Pearson correlation 0.996 ** 1 0.972 ** 0.894 ** 0.940 **
Liabilities p-value 0.000 0.000 0.000 0.000
Sample size 70 70 70 70 70
Pearson correlation 0.988 ** 0.972 ** 1 0.909 ** 0.952 **
Equity p-value 0.000 0.000 0.000 0.000
Sample size 70 70 70 70 70
Pearson correlation 0.908 ** 0.894 ** 0.909 ** 1 0.980 **
Revenue p-value 0.000 0.000 0.000 0.000
Sample size 70 70 70 70 70
Pearson correlation 0.952 ** 0.940 ** 0.952 ** 0.980 ** 1
Gross
p-value 0.000 0.000 0.000 0.000
profit
Sample size 70 70 70 70 70
Note: ** denotes correlation is significant at the 0.01 level (2-tailed).
Table A2 (Appendix A) shows the year-over-year catch-up indexes of 10 e-commerce companies
from 2016 to 2019 and the estimated indexes from 2020 to 2022. The catch-up index indicates the
progress (if score >1) or the regress (if score < 1) in the technical efficiency of the DMUs. With the average
year-to-year catch-up indexes of all DMUs at 1.02688 in 2016–2017, 1.04086 in 2017–2018, and 1.00796 in
2018–2019, it can be concluded that most DMUs achieved high technical efficiency during the past four
years (2016–2019). Meanwhile, technical efficiency started to decrease in 2019–2020, being regressive
with a score of 0.97124. From 2020 to 2022, the technical efficiency of the e-commerce industry is
expected to be below 1, having scores of 0.98084 and 0.99023 in 2020–2021 and 2021–2022, respectively.
For the whole research period of 2016–2022, it is remarkable that while only three out of 10 DMUs
achieved average catch-up indexes above 1 (ECOM02-eBay, ECOM05-BestBuy, ECOM10-Lowe’s),
the overall average catch-up index of all DMUs = 1.003 (>1), meaning that there are significant
differences in technical efficiency between the DMUs. While the maximum average index is 1.22383
(ECOM02-eBay), the minimum one is 0.90141 (ECOM09-Etsy), the difference being 0.30242.
During 2016–2017, 4 out of 10 DMUs achieved high technical efficiency, which are
ECOM07-Overstock, ECOM08-Costco, ECOM09-Etsy, and ECOM10-Lowe’s, with scores of 1.10547,
1.09015, 1.60931, and 1.02847, respectively. ECOM01-Amazon had the lowest catch-up index at 0.82308.
Surprisingly, the DMUs that had low technical efficiency in 2016–2017, with scores below 1 (namely,
ECOM01-Amazon, ECOM02-eBay, ECOM03-Walmart, ECOM04-Target, and ECOM05-BestBuy),
had impressive improvements in 2017–2018, with scores greater than 1; ECOM02-eBay became
the most technically efficient e-commerce company during this period, with the score at 1.37101.
In the meantime, highly technically effective companies in 2016–2017 (i.e., ECOM07-Overstock,
ECOM08-Costco, and ECOM09-Etsy) had a sudden decline in their catch-up indexes (below 1) in
2017–2018. Notably, the technical performance of ECOM09-Etsy was tremendously decreased in
2017–2018, having the highest score of 1.60931 in 2016–2017 and declining in 2017–2018 by one
third to only 0.53897, becoming the least-effective company in 2017–2018. The catch-up index of
ECOM10-Lowe’s increased from 1.02847 in 2016–2017 to 1.28029 in 2017–2018. From 2018–2019,
the DMUs began to reduce their technical performance, except for ECOM02-eBay, which saw its
catch-up score increase from 1.37101 in 2017–2018 to 1.41764 in 2018–2019, being the most-effectiveSustainability 2020, 12, 10385 14 of 24
company in this period and maintaining the highest position in later periods. This DMU and
ECOM05-BestBuy were the only two companies that maintained high technical efficiency during the
research period. Meanwhile, ECOM09-Etsy slightly increased their index from 0.53897 in 2017–2018
to 0.82868 in 2018–2019 but remained the most underperforming company during this period and
throughout the later periods. In 2019–2020, as discussed, only ECOM02-eBay and ECOM05-BestBuy
had catch-up indexes higher than 1; ECOM09-Etsy had the lowest score at 0.85223.
For each DMU, there was not much difference between their past and future technical performances.
In the period 2020–2022, ECOM02-eBay and ECOM05-BestBuy are predicted to maintain high technical
efficiency, with expected catch-up indexes higher than 1. Meanwhile, the remaining DMUs are
predicted to have no improvement in their technical efficiency in the 2020–2022 period, except for
ECOM06-Groupon, which scored lower than 1 during 2016–2020 but is expected to increase their index
to more than 1 during 2020–2022.
Figure 4 gives a diagram view of DMUs’ catch-up indexes throughout 2016–2022. It is worth
looking at the chart of ECOM03-Walmart. Overall, while most DMUs had stable technical efficiency
change during the research period, only ECOM03-Walmart had the most fluctuating and lowest
technical performance. It had an outstanding catch-up index in 2016–2017, outstripping the remaining
DMUs in this period, then dropped tremendously to the worst technical efficiency change index in
2017–2018 by far. Afterward, the value of ECOM03-Walmart’s catch-up index increased and remained
stable in later periods, but it is still the lowest among all DMUs.
Figure 4. The technical efficiency change (catch-up) of DMUs (2016–2022).
4.3.3. Technological Change
Table A3 (Appendix A) demonstrates the year-over-year frontier-shift indexes of 10 DMUs in
the past four years (2016–2020) and the future period of 2020–2022. Frontier-shift indexes express the
technological change (efficiency-frontiers) of the DMUs between the two periods. During 2016–2020,
most DMUs showed common trends, severely declining from 2016–2017 to 2017–2018, slightly increasing
from 2017–2018 to 2018–2019, and then seeing rapid growth from 2018–2019 to 2019–2020. It is
remarkable that in 2016–2017, all DMUs obtained frontier-shift indexes higher than 1, indicating that
e-commerce companies made efforts to develop and innovate technology and achieved good results
during this period. ECOM03-Walmart achieved the highest score of 1.15851, while ECOM10-Lowe’s had
the lowest score at 1.02773. The average technological efficiency in this period resulted in a progressive
score of 1.06536. Nevertheless, they could not maintain this status in the next period (2017–2018),
as most of the frontier-shift indexes declined to lower than 1, except for ECOM06-Groupon and
ECOM09-Etsy. That resulted in a regressive score of 0.99688 in this period. After the previous decline,
seven out of 10 DMUs showed noticeable improvement in 2018–2019, in which ECOM01-Amazon,
ECOM03-Walmart, ECOM05-BestBuy, and ECOM10-Lowe’s achieved high technological efficiency,
with scores of 1.01830, 1.01335, 1.00335, and 1.03324, respectively. ECOM09-Etsy suffered a serious
decline in technological efficiency, being the most efficient company in 2017–2018, and then becomingSustainability 2020, 12, 10385 15 of 24
the worst-performing company in 2018–2019, with a score of 0.94924. Although most frontier-shift
indicators increased in 2018–2019, the remaining witnessed dramatic declines; hence, the average score
was 0.99144 in this period. In 2019–2020, the companies continued to improve their technological
efficiency. ECOM07-Overstock increased its frontier-shift index from 0.95196 in the last period to
0.99817 in 2019–2020, while the remaining DMUs obtained progressive scores (higher than 1) in this
period. The most technologically efficient company in this period was ECOM04-Target, with a score of
1.11162; hence, the average score in 2019–2020 increased to 1.06963.
Frontier-shift indexes in 2020–2021 are not likely to change much compared to those of 2019–2020,
as ECOM07-Overstock will remain at a regressive score of 0.95373, while the remaining DMUs
are expected to maintain their good technological efficiency at scores higher than 1 in this period.
ECOM10-Lowe’s is projected to obtain the highest score of 1.10637, and the expected average
score of all DMUs is 1.05600. In 2021–2022, over half of all DMUs are anticipated to slightly
decrease their frontier-shift indexes, in which ECOM06-Groupon and ECOM08-Costco will have
a decline in their scores to lower than 1, at 0.93064 and 0.98965, respectively. ECOM07-Overstock
is predicted to show no improvement in 2021–2022, with a score of 0.95037. ECOM09-Etsy is
predicted to have the highest score at 1.19543, and the average score of all DMUs will slightly
increase to 1.05971 in 2021–2022. Over the whole research period (2016–2022), a vast majority of
DMUs (ECOM01-Amazon, ECOM02-eBay, ECOM03-Walmart, ECOM04-Target, ECOM05-BestBuy,
ECOM06-Groupon, ECOM09-Etsy, and ECOM10-Lowe’s) will achieve high technological efficiency as
the overall average frontier-shift score of all DMUs is 1.03984.
As discussed in the section on technical change, ECOM03-Walmart had the least-stable and
lowest technical efficiency performance in 2017–2018. However, this DMU had an outstanding
frontier-shift index in 2017–2018, outperforming the other DMUs in the technology development in
that year, although it has a fluctuating frontier-shift index throughout 2016–2022, as shown in Figure 5.
The technological change of ECOM03-Walmart suffered a dramatic decline in 2018–2019 but then kept
rising, and it is expected to be the most technologically efficient company in 2021–2022.
Figure 5. The technological change (frontier) of DMUs (2016–2022).
4.3.4. Malmquist Productivity Index (MPI)
MPI is applied to evaluate the performance of global e-commerce companies as it measures the
change in total factor productivity of the DMUs in terms of technical efficiency (through the catch-up
index) and technological change (through the frontier-shift index). Table A4 (Appendix A) shows the
year-over-year MPI of 10 e-commerce companies from 2016 to 2019 and the estimated indexes from
2020 to 2022, while Figure 6 provides a diagram view. It is worth noting that the MPI line charts of the
DMUs in Figure 6 have the same trends as their charts of the catch-up index in Figure 4. An explanationSustainability 2020, 12, 10385 16 of 24
for these patterns will be discussed in the next section. Overall, the MPIs of most DMUs tended
to decrease from 2016–2017 to 2017–2018, continuing to fall from 2017–2018 to 2018–2019, and then
gradually rising in 2019–2020. Not many DMUs are likely to have an improvement in their total
factor productivity in 2020–2021. Moreover, the MPIs are predicted to stay unchanged in 2021–2022
compared to 2020–2021. On average, only ECOM02-eBay, ECOM05-BestBuy, and ECOM10-Lowe’s
have achieved the most stable and best performances in terms of technical and technological efficiency
during the total research period (2016–2022) as their MPIs are recorded as being higher than 1 for
almost all periods. Their average MPI for the whole research period is 1.26852, 1.13751, and 1.12290,
respectively. However, the overall average MPI of all DMUs during 2016–2022 is 1.03940, indicating
that the difference in total factor productivity between DMUs is relatively significant. While the
maximum average MPI is 1.26852 (ECOM02-eBay), the minimum one is 0.96486 (ECOM06-Groupon),
the difference being 0.30366.
Figure 6. The Malmquist productivity index of DMUs (2016–2022).
In 2016–2017, seven out of 10 DMUs, namely, ECOM03-Walmart, ECOM04-Target,
ECOM05-BestBuy, ECOM07-Overstock, ECOM08-Costco, ECOM09-Etsy, and ECOM10-Lowe’s,
achieved progress in total factor productivity. ECOM09-Etsy had an impressive score of 1.78641, while
ECOM01-Amazon only obtained 0.87535 as its productivity score. The average MPI of all DMUs in
this period is 1.09508.
In 2017–2018, ECOM01-Amazon, ECOM02-eBay, ECOM05-BestBuy, and ECOM10-Lowe’s showed
considerable improvement in their productivity while the others started to decline. Notably,
ECOM09-Etsy suffered a steep decline in its MPI, falling sharply from 1.78641 in 2016–2017 to
only 0.65979 in 2017–2018, being the least-efficient company, while the other rivals were above 0.85
in this period. Overall, half of the DMUs achieved progressive MPIs, namely, ECOM01-Amazon,
ECOM02-eBay, ECOM04-Target, ECOM05-BestBuy, and ECOM10-Lowe’s, with scores of 1.06257,
1.30645, 1.01723, 1.23866, and 1.17862, respectively. The average MPI of all DMUs in this period
was 1.02223.
During 2018–2019, most DMUs performed inefficiently, with MPIs less than 1; only three DMUs
(ECOM02-eBay, ECOM05-BestBuy, and ECOM10-Lowe’s) achieved progress in total factor productivity,
with scores of 1.39286, 1.06717, and 1.28749, respectively. ECOM09-Etsy had a slight improvement
in its MPI to 0.78661 but was still the lowest score in this period. The average MPI of all DMUs in
2018–2019 was down to 1.00075.
ECOM02-eBay, ECOM05-BestBuy, and ECOM10-Lowe’s still maintained their progress in
total factor productivity in 2019–2020 with MPIs of 1.25011, 1.23382, and 1.03267, respectively.
ECOM01-Amazon is the only one among the remaining DMUs to have an improvement in totalSustainability 2020, 12, 10385 17 of 24
productivity index, increasing to 1.01916 in this period. ECOM09-Etsy had the lowest MPI of 0.92157.
However, the average MPI of all DMUs saw a slight increase to 1.03626 in this period.
For 2020–2022, ECOM01-Amazon, ECOM02-eBay, ECOM05-BestBuy, and ECOM10-Lowe’s are
likely to maintain their good performance as their expected MPIs are higher than 1. In detail,
ECOM01-Amazon, ECOM02-eBay, ECOM05-BestBuy, and ECOM10-Lowe’s are predicted to score
1.00187, 1.34894, 1.14872, and 1.08416 in 2020–2021 and 1.00890, 1.39524, 1.12752, and 1.09750 in
2021–2022, respectively. After an inefficient period in terms of both technical and technological
efficiency in 2016–2020, ECOM06-Groupon is suddenly expected to achieve progressive MPIs of 1.03121
in 2020–2021 and 1.06823 in 2021–2022. On the other hand, ECOM09-Etsy is not likely to catch up with
the other rivals and is predicted to be the worst-performing e-commerce company with MPIs of 0.88807
in 2020–2021 and 0.91141 in 2021–2022. Frontier-shift indexes in 2020–2021 are not likely to change
much compared to those of 2019–2020, as ECOM07-Overstock will continue to have a regressive score
of 0.95373, while the remaining DMUs are expected to maintain their good technological efficiency
with scores higher than 1 in this period. ECOM10-Lowe’s is projected to obtain the highest score
of 1.10637, and the expected average score of all DMUs is 1.05600. In 2021–2022, over a half of all
DMUs are anticipated to slightly decrease their frontier-shift indexes, in which ECOM06-Groupon
and ECOM08-Costco will have a decline in their scores to lower than 1, at 0.93064 and 0.98965,
respectively. ECOM07-Overstock is predicted to show no improvement in 2021–2022, with a score
of 0.95037. ECOM09-Etsy is predicted to have the highest score at 1.19543, and the average score of
all DMUs will slightly increase to 1.05971 in 2021–2022. Over the whole research period (2016–2022),
a vast majority of DMUs (ECOM01-Amazon, ECOM02-eBay, ECOM03-Walmart, ECOM04-Target,
ECOM05-BestBuy, ECOM06-Groupon, ECOM09-Etsy, and ECOM10-Lowe’s) will have achieved high
technological efficiency as the overall average frontier-shift score of all DMUs is 1.03984.
As discussed in the section on technical change, ECOM03-Walmart had the least-stable and lowest
technical efficiency performance in 2017–2018. However, this DMU had an outstanding frontier-shift
index in 2017–2018, outperformed the other DMUs in technology development in this year, although it
has a fluctuating frontier-shift index throughout 2016–2022, as shown in Figure 5. The technological
change of ECOM03-Walmart suffered a dramatic decline in 2018–2019, but then kept rising, and it is
expected to be the most technologically efficient company in 2021–2022.
4.3.5. The Relationship among Technical, Technological, and MPI Change
Figure 7 demonstrates the relationship between the average technical efficiency and technological
change indexes and MPIs of the DMUs. As most e-commerce companies have progressed in
technological development during the studied period, with 8 out of 10 DMUs achieving average
frontier-shift indexes greater than 1, the chart of technological change indexes between the DMUs
shows a stable line. In the meantime, fluctuating lines are demonstrated in the charts of technical
efficiency and the Malmquist productivity index (MPI). This is because there are significant differences
between the average technical efficiency change indexes of the DMUs. Additionally, since the MPI is
the product of the catch-up index (technical change) and frontier-shift index (technological change),
then the pattern of the MPI chart should be almost the same as the technical change’s line chart, as can
be seen in Figure 7. Hence, the productivity growth of each DMU is nearly decided by its technical
efficiency change. That also explains why trends of MPIs in Figure 6 are the same as those of catch-up
indexes for all DMUs, as in Figure 4. As e-commerce leaders realize how technology innovation has
become the main fuel behind evolution and success in the e-commerce world, they are focusing more
on this area. Hence, e-commerce companies’ technological growth is nearly the same for this period.
However, to win the race of e-commerce, companies should make better efforts to enhance technical
production and efficiency and to maximize their resources, such as labor, material and equipment
supplies, and capital.Sustainability 2020, 12, 10385 18 of 24
Figure 7. Comparison of average efficiency scores of DMUs (2016–2022).
5. Discussions and Conclusions
By conducting performance prediction and evaluation of the e-commerce industry, the integrated
model is proposed to obtain the technical efficiency change, technological change, and total productivity
factor change index for the top 10 e-commerce companies in the US market, which are Amazon, eBay,
Walmart, Target, BestBuy, Groupon, Overstock, Costco, Etsy, and Lowe’s for 2016–2022. In this model,
the inputs are assets, liabilities, and equity, while revenue and gross profit are considered outputs.
The results show that as all companies performed equally well in developing technology as most of
their frontier-shift indexes achieved progressive scores of higher than 1. Meanwhile, their technical
efficiency indexes are significantly different from each other. Therefore, as a product of technical and
technological performance, their MPIs depend mostly on their technical change indexes.
In terms of technical progress, on average, eBay, BestBuy, and Lowe’s are the only three DMUs to
have a high technical performance for 2016–2022, of which eBay and BestBuy are the best-performing
and most stable e-commerce marketplaces, with catch-up indexes higher than 1 for most research
periods. They are followed by Lowe’s, with high technical performance in 2016–2019 that gradually
waned; it is predicted to remain regressive during 2020–2022. The remaining e-commerce companies
(7 out of 10 DMUs) need more improvement in this aspect, especially Etsy, which had the lowest average
catch-up index. It is worth noting that most DMUs performed equally well in technology development,
with 8 out of 10 obtaining high frontier-shift indexes on average. Although performing worst in
the technical aspect, Etsy progressed in technology and innovation, becoming the best-performing
company regarding technological efficiency. In the meantime, Overstock and Costco are the only
two DMUs to have regressed in this aspect. As total factor productivity is the product of technical
and technological efficiency, in order to achieve a progressive outcome, e-commerce companies need
to balance both technical and technological performance. Based on the results, having the highest
technical change indexes, eBay, BestBuy, and Lowe’s once again are the only three DMUs to achieve
MPIs higher than 1 on average. This also implies that these DMUs are the best and most stable
companies in the e-commerce industry for the studied period. Moreover, Walmart, the world’s largest
brick-and-mortar retailer, has been pushing the envelope to become a tech-centric company rather than
a conventional retailer, as it is one of the top ten largest e-commerce retailers in the US in 2020 [75].
It is worth looking at this company’s figures and charts since it has contradictory development in
technical and technological efficiency performance, with the most differentiated figures compared to
those of the remaining companies (shown in Figures 4–6). This company progressed in technology
during the studied period, with outstanding performance in 2017–2018 but also the worst technical
efficiency change in this period by far. This is because it had shifted its focus and strategies to become
a high-tech innovator in e-commerce [76].
The contributions of the paper are three-fold. (1) The paper proposes an evaluation method of
the e-commerce industry that combines the Grey prediction model GM (1, 1) and the Malmquist-I-CSustainability 2020, 12, 10385 19 of 24
model. From our literature review, this hybrid approach is introduced for the first time in our
study to predict and evaluate the past, current, and future performances of e-commerce businesses.
(2) The empirical results of this paper provide comprehensive and practical insights into the top
10 US e-commerce companies’ performance in recent years. As a matter of fact, instead of being a
cause for concern, Covid-19 appears to be a catalyst to exemplify the effectiveness of an e-commerce
marketplace in executing its business activities more sustainably [23] and achieving breakthroughs
in technology innovation for success in this industry. (3) The authors expect that the results will
reflect the current situation of the global e-commerce industry, especially in terms of technological
change, through the performance of some successful e-commerce companies. Therefore, managers,
policymakers, and investors, not only in the US but in any firm around the world, should consider this
paper as a guideline for sustainable development and effective investment decisions in e-commerce.
However, this study has some limitations. First, more companies should have been included
to give a more detailed overall view; this is due to the lack of annual reports. Second, this research
only considers some specific input and output variables; the use of other ones may lead to different
results or enhance the resolution of the empirical results. Moreover, future studies should consider the
problem under uncertainty, i.e., stochastic DEA, in order to provide more robust results.
Author Contributions: Conceptualization, T.-T.D. and C.-N.W.; data curation, T.-T.D. and N.-A.-T.N.; formal
analysis, T.-T.D. and T.-T.-H.L.; funding acquisition, C.-N.W.; investigation, N.-A.-T.N. and T.-T.-H.L.; methodology,
C.-N.W. and T.-T.D.; project administration, C.-N.W.; software, T.-T.D.; validation, C.-N.W. and T.-T.-H.L.;
writing—original draft, T.-T.D. and N.-A.-T.N.; writing—review and editing, C.-N.W. and T.-T.D. All authors have
read and agreed to the published version of the manuscript.
Funding: This research was partly supported by the National Kaohsiung University of Science and Technology,
and MOST 09-2622-E-992-026 from the Ministry of Sciences and Technology in Taiwan.
Acknowledgments: The authors appreciate the support from the National Kaohsiung University of Science and
Technology, Taiwan; Ministry of Sciences and Technology, Taiwan; and University of Economics Ho Chi Minh
City, Vietnam.
Conflicts of Interest: The authors declare no conflict of interest.
Appendix A
Table A1. Forecast value of input and output variables (2020–2022).
Gross
DMUs Company Assets Liabilities Equity Revenue
Profit
Year of 2020
ECOM01 Amazon 290,928 202,011 89,816 350,769 99,956
ECOM02 eBay 15,629 14,130 2307 11,639 8969
ECOM03 Walmart 228,980 150,349 79,436 529,381 131,438
ECOM04 Target 43,263 31,655 11,662 78,309 23,034
ECOM05 BestBuy 12,333 9848 2630 45,040 10,288
ECOM06 Groupon 1547 1072 501 2008 1141
ECOM07 Overstock 422 230 192 1420 286
ECOM08 Costco 50,718 32,440 18,405 166,322 21,293
ECOM09 Etsy 2352 2129 411 1096 739
ECOM10 Lowe’s 34,835 32,422 3169 74,823 23,370
Year of 2021
ECOM01 Amazon 384,162 256,636 132,066 437,374 133,119
ECOM02 eBay 13,153 13,059 1508 12,338 9503
ECOM03 Walmart 240,639 163,707 78,993 544,694 133,782
ECOM04 Target 45,450 33,735 11,837 81,559 23,804
ECOM05 BestBuy 11,894 10,086 2182 46,951 10,564
ECOM06 Groupon 1505 978 610 1781 1078
ECOM07 Overstock 415 220 195 1309 267
ECOM08 Costco 56,655 35,217 21,826 180,845 22,893
ECOM09 Etsy 3797 4680 416 1488 1005
ECOM10 Lowe’s 34,885 34,054 2473 78,340 23,595You can also read