Optimizing nutrient use efficiency, productivity, energetics, and economics of red cabbage following mineral fertilization and biopriming with ...
←
→
Page content transcription
If your browser does not render page correctly, please read the page content below
www.nature.com/scientificreports
OPEN Optimizing nutrient use efficiency,
productivity, energetics,
and economics of red cabbage
following mineral fertilization
and biopriming with compatible
rhizosphere microbes
Deepranjan Sarkar1, Ardith Sankar2, O. Siva Devika1, Sonam Singh1, Shikha3,
Manoj Parihar4, Amitava Rakshit1*, R. Z. Sayyed5, Abdul Gafur6, Mohammad Javed Ansari7,
Subhan Danish8,10*, Shah Fahad9 & Rahul Datta10
Conventional agricultural practices and rising energy crisis create a question about the sustainability
of the present-day food production system. Nutrient exhaustive crops can have a severe impact
on native soil fertility by causing nutrient mining. In this backdrop, we conducted a comprehensive
assessment of bio-priming intervention in red cabbage production considering nutrient uptake, the
annual change in soil fertility, nutrient use efficiency, energy budgeting, and economic benefits for its
sustainable intensification, among resource-poor farmers of Middle Gangetic Plains. The compatible
microbial agents used in the study include Trichoderma harzianum, Pseudomonas fluorescens, and
Bacillus subtilis. Field assays (2016–2017 and 2017–2018) of the present study revealed supplementing
75% of recommended NPK fertilizer with dual inoculation of T. harzianum and P. fluorescens increased
macronutrient uptake (N, P, and K), root length, heading percentage, head diameter, head weight,
and the total weight of red cabbage along with a positive annual change in soil organic carbon.
Maximum positive annual change in available N and available P was recorded under 75% RDF + P.
fluorescens + B. subtilis and 75% RDF + T. harzianum + B. subtilis, respectively. Bio-primed plants
were also higher in terms of growth and nutrient use efficiency (agronomic efficiency, physiological
efficiency, apparent recovery efficiency, partial factor productivity). Energy output (26,370 and
26,630 MJ ha−1), energy balance (13,643 and 13,903 MJ ha−1), maximum gross return (US $ 16,030 and
13,877 ha−1), and net return (US $ 15,966 and 13,813 ha−1) were considerably higher in T. harzianum,
and P. fluorescens treated plants. The results suggest the significance of the bio-priming approach
under existing integrated nutrient management strategies and the role of dual inoculations in
producing synergistic effects on plant growth and maintaining the soil, food, and energy nexus.
1
Department of Soil Science and Agricultural Chemistry, Institute of Agricultural Sciences, Banaras Hindu
University, Uttar Pradesh, Varanasi 221005, India. 2Department of Agronomy, Institute of Agricultural Sciences,
Banaras Hindu University, Uttar Pradesh, Varanasi 221005, India. 3Krishi Vigyan Kendra, Ranichauri, Veer Chandra
Singh Garhwali Uttarakhand University of Horticulture and Forestry, Tehri Garhwal 249199, Uttarakhand,
India. 4Crop Production Division, ICAR-Vivekananda Parvatiya Krishi Anusandhan Sansthan, Almora 263601,
Uttarakhand, India. 5Department of Microbiology, PSGVP Mandal’s, Arts, Science & Commerce College, 425409,
Shahada, Maharashtra, India. 6Sinarmas Forestry Corporate Research and Development, Perawang 28772,
Indonesia. 7Department of Botany, Hindu College Moradabad (Mahatma Jyotiba Phule Rohilkhand Univesity
Bareilly), Moradabad, Uttar Pradesh 244001, India. 8Department of Soil Science, Faculty of Agricultural Sciences
and Technology, Bahauddin Zakariya University, Multan 60800, Pakistan. 9Department of Agronomy, The
University of Haripur, Haripur 22620, Pakistan. 10Department of Geology and Pedology, Faculty of Forestry and
Wood Technology, Mendel University in Brno, Zemedelska1, 61300 Brno, Czech Republic. *email: amitavar@
bhu.ac.in; sd96850@gmail.com
Scientific Reports | (2021) 11:15680 | https://doi.org/10.1038/s41598-021-95092-6 1
Vol.:(0123456789)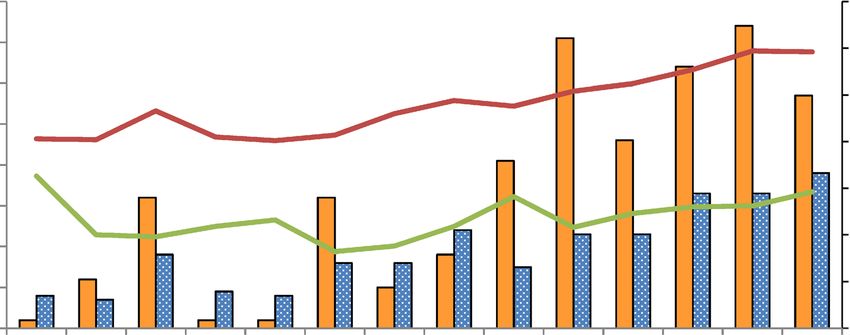
www.nature.com/scientificreports/
India has attained ‘self-sufficiency’ in food grain production, but some factors like declining nutrient use effi-
ciency, low crop response ratio, negative soil nutrient balance, etc., have become major concerns in Indian
agriculture. The accomplishment of the Green Revolution has left some drastic effects on our motherland soil.
As we fulfilled our target of increased food grain production, there are indications of declining partial and total
factor productivity, and the sole cause has been attributed to diminishing native soil fertility 1. Therefore, the
dwindling natural resource base has raised sustainability concerns and integrated resource management in the
present agricultural system. Moreover, climate change has forced us to adopt crop management practices more
scientifically to sustainable land use and land c over2.
Beneficial microorganisms play an important role in achieving agro-environmental sustainability. However,
the abundance and robustness of microbes are dependent upon smart delivery systems3. Bio-priming is one
possible method to apply plant growth-promoting microorganisms in the soil–plant system and improve the
nutrient use efficiency of agroecosystems4,5. Primers’ selection is an essential step in biological seed enhance-
ments as priming agents’ growth-promoting abilities are highly specific to certain species, cultivars, or geno-
types of c rops6. A microbial consortium treatment can also be used for getting better results after checking the
compatibility of the microbes7. This will promote synergistic interactions among the microbial population8.
The literature of current decades reveals that beneficial microorganisms and their interactions with host plants
harbor broad prospects in sustainable agriculture’s persistence. Their influence in the rhizosphere ecosystem
compels researchers to investigate their ecology, diversity, and activity, contributing most to soil health and
plant fitness. The rhizosphere is chosen because it is the hub of a complex web of interactions regulated by the
system’s enormous energy flux, releasing about 20–50% of plant photosynthates from the roots9,10. Thus, strong
documentation is required on how species richness affects the ecological functions of agroecosystems. Under-
standing the microbial mechanisms influencing plant productivity is key to augment plant growth and boost the
processes within the soil system. In general, the direct growth-promoting mechanisms used by them can be listed
as (i) nitrogen (N) fixation; (ii) nutrient solubilization (phosphorus (P), potassium (K), etc.); (iii) production
of phytohormones, e.g., auxins (indole-3-acetic acid, indole-3-butyric acid), cytokinins, gibberellins, abscisic
acid, and ethylene; (iv) iron sequestration by siderophore production; (v) regulation of plant hormones, e.g.,
1-aminocyclopropane-1-carboxylate (ACC) deaminase decreases ethylene levels; and the indirect ones include
(i) induction of systemic resistance against plant pathogens through antagonism with the production of inhibi-
tory compounds or substances; (ii) suppression of phytopathogens with the synthesis of hydrolytic enzymes
(glucanases, chitinases, proteases, and lipases), siderophores, antibiotics, and c yanide11–14.
The application of fertilizers for crop production is increasing rapidly. However, the average N recovery effi-
ciency and P recovery efficiency are less than 50% and 20%, r espectively15. Some recent studies showed improved
nutrient use efficiency due to microbial inoculation of plants. Soils treated with 50% organic and inorganic N
fertilizers and the application of Paraburkholderia sp. augmented the growth of kikuyu grass and N use efficiency
compared to 100% N fertilizer treatment16. Pereira et al.17 reported improved N use efficiency and P use efficiency
of maize plants treated with Cupriavidus necator and Pseudomonas fluorescens. However, these experiments were
performed under pot conditions.
The modern agricultural system depends on energy inputs, viz., fossil fuels, fertilizers, pesticides, electricity,
etc. that affect our ecosystem’s health and increase greenhouse gas emissions18. The extent of energy consump-
tion is evident from the fact that the production of nitrogen (N), phosphorus (P), and potassium (K) fertilizers
require approximately 60.6, 11.1, and 6.7 MJ kg−1 energy, respectively19,20. However, very few studies have evalu-
ated the energetics of crop production involving microbial application, mainly based on controlled conditions.
Mihov and T ringovska21 evaluated the energy use efficiency of greenhouse tomato production. Pal and S ingh22
examined the relationship of energy inputs and crop yield in greenhouse okra production.
With growing agro-environmental challenges, we need to look for new, nutritive, and versatile crops to make
agriculture sustainable and profitable. Red cabbage is an excellent source of minerals, vitamins, antioxidants,
anthocyanin, glucosinolates, and phenolic compounds23,24. Therefore, our diet is often chosen as salads, micro-
greens, leafy vegetables, and health-improving supplements. In addition, supermarkets will provide assured
economic returns to farmers. Hence, the present study’s primary objective was to investigate the effect of bio-
priming and mineral fertilization on red cabbage growth, nutrient uptake, the annual change in soil fertility,
nutrient use efficiency, energy usage, and economic returns under field conditions.
Results and discussion
Macronutrient uptake. Total uptake of N, P, and K by red cabbage was partitioned into head and stalk. The
head’s highest N uptake was registered in plots receiving 75% RDF + T. harzianum + P. fluorescens (T6) during
both the years (Table S1). It showed 29% (1st year) and 24% (2nd year) increments over 100% RDF (T2). Similarly,
a significant increase in total uptake of N was also observed in T6 treatment. The total N uptake varied from
21.53 to 70.21 kg ha−1 in the first year and 19.56–69.96 kg ha−1 in the second year. Compared with single-priming
and consortium treatments, N total uptake increased by 12–35% with the co-application of T. harzianum and P.
fluorescens. The uptake of the other two dual bio-priming treatments, viz., T 7 (75% RDF + P. fluorescens + B. sub‑
tilis) and T8 (75% RDF + T. harzianum + B. subtilis) were at par with T2 (100% RDF). Phosphorus uptake by red
cabbage was also influenced by 75% RDF + T. harzianum + P. fluorescens (T6), but it was at par with 75% RDF + P.
fluorescens + B. subtilis (T7). In the head, P uptake ranged from 1.28 to 7.36 kg ha−1 in the first year and 0.80–
7.52 kg ha−1 in the second year (Table S2). During the second year, the head uptake of plants under 75% RDF + P.
fluorescens (T4) was higher than 75% RDF + T. harzianum + B. subtilis (T8). The application of fertilizers and bio-
priming agents did not significantly affect the P uptake by stalk during the study years. The total P uptake varied
from 3.69 to 10.99 kg ha−1 in the first year and 3.44–11.29 kg ha−1 in the second year. Sole application of T. har‑
zianum and B. subtilis and a triple consortium of T. harzianum, P. fluorescens, and B. subtilis showed statistically
Scientific Reports | (2021) 11:15680 | https://doi.org/10.1038/s41598-021-95092-6 2
Vol:.(1234567890)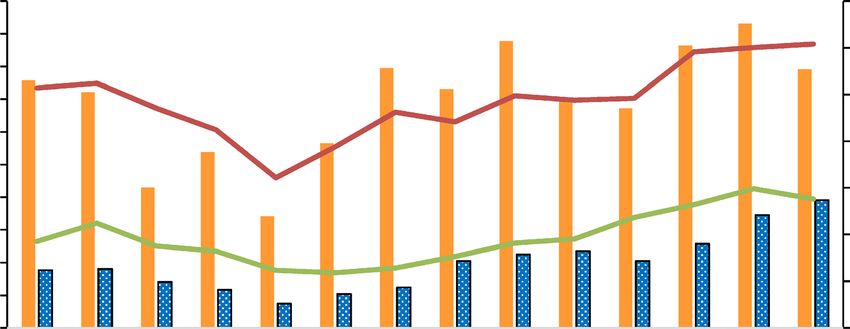
www.nature.com/scientificreports/
Figure 1. Annual change in organic carbon (A), available N (B), available P (C), and available K (D) as affected
by bio-priming and mineral fertilization. Error bars indicate mean ± SE (n = 3). Treatments: T1: Absolute
control N:P2O5:K2O @ 0:0:0 kg ha−1; T2: RDF of N:P2O5:K2O @ 120:60:60 kg ha−1; T3: 75% RDF + Trichoderma
harzianum; T4: 75% RDF + Pseudomonas fluorescens; T5: 75% RDF + Bacillus subtilis; T6: 75% RDF + T.
harzianum + P. fluorescens; T7: 75% RDF + P. fluorescens + B. subtilis; T8: 75% RDF + T. harzianum + B. subtilis; T9:
75% RDF + T. harzianum + P. fluorescens + B. subtilis.
similar P uptake. Except for control, the uptake was found to increase in all the treatments during the second
year over 1st year. In the case of K, a significant increase in uptake (head and total) was recorded in T
6 treatment
(Table S3). The magnitude of the increase due to this treatment over 100% RDF ( T2) was 31% (head) and 21%
(total). However, applying 100% chemical fertilizers and combined use of chemical fertilizers and bio-agents did
not significantly differ in the uptake of macronutrients by the stalk. In general, the K uptake varied from 8.25 to
57.35 kg ha−1 for the head and 16.64–22.15 kg ha−1 for the stalk. Stalk K uptake was highest (22.15 kg ha−1) in the
first year with 75% RDF + B. subtilis (T5). The total K uptake ranged from 29.03 to 78.20 kg ha−1 in the first year
and 26.08–78.51 kg ha−1 in the second year. During the second year, the total K uptake of plants under 100% RDF
was par with single- and triple-priming treatments. Among single- and triple-priming treatments, the highest
total K uptake was observed with the application of 75% RDF + P. fluorescens (T4) during both years. The lowest
N, P, and K uptake were recorded from the control (T1) plots. On average, red cabbage removed macronutrients
in the order of K (64.32 kg ha−1) > N (55.05 kg ha−1) > P (8.91 kg ha−1). The higher nutrient uptake in the inte-
grated application of chemical fertilizers and bio-agents is explained by developing proliferous root systems in
bio-primed plants and increased microbial activity in the soil, which helped mineralize nutrients maintaining
the soil solution greater assimilation in plants. Several workers25–31 reported increased nutrient uptake in crops
due to the combined application of chemical fertilizers (reduced level) and biofertilizers.
Annual change in organic carbon (OC) and available N, P, and K. A positive annual change in OC
(Fig. 1) was noted for all the treatments (T2-T9) except in control plots (T1) which showed a negative change
of − 0.22 g kg−1 year−1. The highest positive change was documented under 75% RDF + T. harzianum + P. fluo‑
rescens (T6, 0.59 g kg−1 year−1) followed by 75% RDF + P. fluorescens + B. subtilis (T7, 0.49 g kg−1 year−1), and the
lowest was recorded under 100% chemical fertilization ( T2) being 0.17 g kg−1 year−1 which was at par with 75%
RDF + T. harzianum + P. fluorescens + B. subtilis (T9, 0.20 g kg−1 year−1). In the case of annual change of available
N, P, and K, similar trends were noticed as OC (Fig. 1). However, the highest and lowest changes varied. Applica-
tion of 75% RDF + P. fluorescens + B. subtilis (T7) and 75% RDF + T. harzianum + B. subtilis (T8) demonstrated
(Fig. 1) higher positive changes in available N (11.06 and 10.06 kg ha−1 year−1, respectively), while 100% RDF
(T2) showed the lowest change (4.47 kg ha−1 year−1). The control plots (T1) showed a significant negative annual
change in available N (− 13.46 kg ha−1 year−1) after crop harvest. The T8 treatment showed the maximum positive
annual change (6.70 kg ha−1 year−1) followed by T 7 (6.27 kg ha−1 year−1) for available P (Fig. 1). However, the
least positive change in available P was evident in T2 (3.10 kg ha−1 year−1), which was at par with the treatment
T9 (3.48 kg ha−1 year−1). A negative change of − 1.27 kg ha−1 year−1 in available P was observed in T1 plots. There
were no significant positive annual changes observed between the treatments for available K (Fig. 1). However,
the T8 treatment presented the highest positive annual change value of 10.04 kg ha−1 year−1, followed by T 7
(8.92 kg ha−1 year−1); the rest of the treatments ( T2, T3, T4, T5, T6, and T
9) documented at par values of the same.
The T1 plots recorded a significant negative annual change in available K (− 11.43 kg h a−1 year−1).
Scientific Reports | (2021) 11:15680 | https://doi.org/10.1038/s41598-021-95092-6 3
Vol.:(0123456789)www.nature.com/scientificreports/
N use efficiency
Agronomic efficiency Physiological efficiency Apparent recovery Partial factor productivity
(kg kg−1) (kg kg−1) efficiency (%) (kg kg−1)
Treatments 2016–2017 2017–2018 2016–20 2017–2018 2016–2017 2017–2018 2016–2017 2017–2018
T1: Absolute con-
trol N:P2O5:K2O @ – – – – – – – –
0:0:0 kg ha−1
T2: RDF of N:P2O5:K2O @
9.48c 11.07c 28.59 33.21 32.73b 33.21d 13.97c 14.05c
120:60:60 kg ha−1
T3: 75% RDF + Tricho‑
12.06bc 15.02abc 32.33 34.57 37.38b 43.39bc 18.06bc 18.99ab
derma harzianum
T4: 75% RDF + Pseu‑
13.09abc 15.80ab 31.98 36.53 41.09b 43.49bc 19.08ab 19.77ab
domonas fluorescens
T5: 75% RDF + Bacillus
11.45bc 14.55bc 33.74 37.49 34.03b 38.83 cd 17.44bc 18.52b
subtilis
T6: 75% RDF + T. harzi‑
17.44a 19.38a 32.02 34.48 54.10a 55.99a 23.44a 23.34a
anum + P. fluorescens
T7: 75% RDF + P. fluores‑
15.44ab 17.52ab 34.06 39.27 40.10b 44.57bc 21.44ab 21.49ab
cens + B. subtilis
T8: 75% RDF + T. harzi‑
13.69abc 16.70ab 30.96 34.75 36.76b 48.01b 19.68ab 20.67ab
anum + B. subtilis
T9: 75% RDF + T. harzi‑
anum + P. fluorescens + B. 10.96bc 13.97bc 32.58 35.89 33.83b 38.33 cd 16.95bc 17.94bc
subtilis
Table 1. Nitrogen use efficiency of red cabbage as influenced by bio-priming and fertilisation. Different letters
indicate significant differences at P ≤ 0.05 among the treatments as per DMRT.
Conclusively, due to no supplement of fertilizer nutrients and/or biofertilizers, the control plots exhibited a
negative annual change in all the studied cases demonstrating the loss/mining of nutrients. However, where both
are supplied, a positive change is noticed, indicating annual enrichment of the respected soil attributes over con-
trol. In this study, T8 and T
7 treatments performed better in enhancing available N, P, and K except in OC where
T6 treatment presented a significant positive result over these two, and the rest of the treatments remained at par
with positive change. Furthermore, Kaur and Reddy32 reported improved soil fertility using mineral fertilizer and
biofertilizer (Pseudomonas plecoglossicida and Pantoea cypripedii). Similarly, the integrated application of NPK
fertilizers and organic amendments (green manure + Pseudomonas putida + Azotobacter chroococcum) recorded
a higher OC value and available N and K over only NPK fertilizer a pplication33.
Nitrogen use efficiency. Optimization of fertilizer for achieving higher input use efficiency without
hindering the economic yield is a crucial issue in agriculture. The extent of crop utilization to applied N was
analyzed through different parameters of N use efficiency. Agronomic efficiency (AEN) varied from 9.48 to
19.38 kg of head kg−1 of N applied (Table 1). During the study period of the field experiment, the mean value
of AEN increased from 12.95 kg of head kg−1 of N applied in 2016–2017 to 15.50 kg of head kg−1 of N applied
in 2017–2018. The application of 75% RDF + T. harzianum + P. fluorescens (T6) increased AEN by 84% and
75% over 100% RDF (T2) during the first and second years. Compared to T 6, the application of 75% RDF + T.
harzianum + P. fluorescens + B. subtilis (T9) significantly reduced the A EN by 59% and 39% in the first and sec-
ond years respectively. Application of triple consortium also recorded low A EN in comparison to single-species
bio-priming and dual microbial consortium treatments. Seedling inoculation with biofertilizers along with 75%
RDF + vermicompost demonstrated similar results in cabbage34.
Physiological efficiency ( PEN) reflects better accumulation and conversion of N from source to sink. The
highest PEN (34.06 and 39.27 kg kg−1) was observed with the application of 75% RDF + P. fluorescens + B. subtilis
(T7) during both the years of study (Table 1). Low P EN of crops was recorded under 75% RDF + T. harzianum + P.
fluorescens (T6). Plants under 75% RDF + B. subtilis (T5) registered 4% higher P EN compared to that under 75%
RDF + T. harzianum + P. fluorescens + B. subtilis (T9). Among the single-species bio-priming agents, B. subtilis
resulted in maximum P EN (33.74 and 37.49 kg kg−1) during both years. Individual application of T. harzianum
and co-application of T. harzianum and P. fluorescens showed an equivalent effect on P E N.
Nitrogen use efficiency in apparent recovery efficiency (AREN) varied from 32.73 to 55.99% (Table 1). The
highest N use efficiency of 54.10% and 55.99% in 2016–2017 and 2017–2018, respectively, was observed under
75% RDF + T. harzianum + P. fluorescens (T6). Among the bio-priming treatments, the lowest A REN was obtained
under triple consortium treatment (T9). In the first year, AREN in P. fluorescens bio-primed plants was greater
than other individual bio-priming agents. However, in the second year, single bio-priming of T. harzianum and
P. fluorescens recorded similar N use efficiency. In addition, improved AREN was reported in lettuce plants treated
with Trichoderma-based biostimulants35.
Regarding partial factor productivity ( PFPN), the results showed similar trends to that of A REN. The response
ranged between 13.97 and 23.44 kg of head k g−1 of N applied (Table 1). Application of 75% RDF + T. harzi‑
anum + P. fluorescens (T6) and 75% RDF + T. harzianum + P. fluorescens + B. subtilis (T9) registered highest and
Scientific Reports | (2021) 11:15680 | https://doi.org/10.1038/s41598-021-95092-6 4
Vol:.(1234567890)www.nature.com/scientificreports/
P use efficiency
Agronomic efficiency Physiological efficiency Apparent recovery Partial factor productivity
(kg kg−1) (kg kg−1) efficiency (%) (kg kg−1)
Treatments 2016–2017 2017–2018 2016–2017 2017–2018 2016–2017 2017–2018 2016–2017 2017–2018
T1: Absolute control
N:P2O5:K2O @ – – – – – – – –
0:0:0 kg ha−1
T2: RDF of N:P2O5:K2O
18.96c 22.15c 227.25 233.68ab 8.18c 9.50c 27.94c 28.10c
@ 120:60:60 kg ha−1
T3: 75% RDF + Tricho‑
24.13bc 30.04abc 231.84 241.04a 10.68bc 12.46bc 36.11bc 37.97ab
derma harzianum
T4: 75% RDF + Pseu‑
26.18abc 31.60ab 206.31 207.53b 12.89ab 15.25ab 38.16ab 39.54ab
domonas fluorescens
T5: 75% RDF + Bacillus
22.91bc 29.10bc 201.95 241.60a 11.30bc 12.22bc 34.89bc 37.04b
subtilis
T6: 75% RDF + T. harzi‑
34.89a 38.75a 213.14 221.02ab 16.18a 17.45a 46.87a 46.69a
anum + P. fluorescens
T7: 75% RDF + P. fluo‑
30.89ab 35.05ab 190.59 208.97b 16.23a 16.95a 42.87ab 42.98ab
rescens + B. subtilis
T8: 75% RDF + T. har‑
27.38abc 33.40ab 205.72 242.77a 13.23ab 13.84ab 39.36ab 41.33ab
zianum + B. subtilis
T9: 75% RDF + T.
harzianum + P. fluores‑ 21.93bc 27.94bc 215.89 242.77a 10.14bc 11.64bc 33.91bc 35.88bc
cens + B. subtilis
Table 2. Phosphorus use efficiency of red cabbage as influenced by bio-priming and fertilisation. Different
letters indicate significant differences at P ≤ 0.05 among the treatments as per DMRT.
lowest N use efficiency, respectively. About 68% increase in PFPN was found in T6 compared to 100% RDF (T2).
The effect of P. fluorescens on PFPN was higher than other single-species bio-priming agents. The results revealed
that dual consortium treatments were more competent in converting the applied N into marketable yield. Our
result was consistent with the observation of Chatterjee et al.34.
Phosphorus use efficiency. Agronomic efficiency (AEP) was maximum under 75% RDF + T. harzi‑
anum + P. fluorescens (T6) which registered an increment in P use efficiency from 34.89 kg of head k g−1 of P
applied in 2016–2017 to 38.75 kg of head kg−1 of P applied in 2017–2018 (Table 2). Application of triple consor-
tium was found to reduce the A EP in a significant manner. Results showed the following trend: 75% RDF + T.
harzianum + P. fluorescens (T6) > 75% RDF + P. fluorescens + B. subtilis (T7) > 75% RDF + T. harzianum + B.
subtilis (T8) > 75% RDF + P. fluorescens (T4) > 75% RDF + T. harzianum (T3) > 75% RDF + B. subtilis (T5) > 75%
RDF + T. harzianum + P. fluorescens + B. subtilis (T9) > 100% RDF (T2). Sole application of P. fluorescens along
with 75% RDF (T6) increased the AEP by 38% and 43% in the first and second year, respectively, compared with
100% RDF (T2).
Phosphorus use efficiency in physiological efficiency ( PEP) varied from 227.25 to 242.77 kg of head k g−1
of P applied (Table 2). In the first year, application of 75% RDF + T. harzianum (T3) registered maximum P EP
(231.84 kg kg−1) while application of 75% RDF + T. harzianum + B. subtilis (T8) and 75% RDF + T. harzianum + P.
fluorescens + B. subtilis (T9) registered maximum P EP (242.77 kg kg−1) during the second year. Similar to P
EN, PEP
lowered down with application of 75% RDF + T. harzianum + P. fluorescens (T6). In the second year, individual
application of P. fluorescens showed lower PEP than B. subtilis and T. harzianum. Yaseen and Malhi36 reported a
similar range of PEP in wheat, and they further claimed that P decreased P use efficiency significantly.
The effect of fertilization and bio-priming on apparent recovery efficiency (AREP) is presented in Table 2. The
AREP was found to be maximum (16.23%) under 75% RDF + P. fluorescens + B. subtilis (T7) during the first year,
but during the second year, maximum (17.45%) A REP was noted under 75% RDF + T. harzianum + P. fluorescens
(T6). Among the three bio-agents, P use efficiency was in P. fluorescens > B. subtilis > T. harzianum. The present
study results revealed that bio-priming with P. fluorescens demonstrated the highest increment (18%) in AREP
compared to the first year. Application of triple consortium and single bio-priming with T. harzianum resulted
in a similar AREP. Increased P use efficiency due to co-inoculation of rhizospheric bacterial (endophytic) agents
was reported by Emami et al.37.
Partial factor productivity (PFPP) ranged from 27.94 to 46.87 kg of head kg−1 of P applied with an average
value of 37.51 kg of head k g−1 of P applied during the first year and 38.69 kg of head k g−1 of P applied during
the second year (Table 2). Among the bio-priming treatments, the application of 75% RDF + T. harzianum + P.
fluorescens (T6) and 75% RDF + T. harzianum + P. fluorescens + B. subtilis (T9) recorded the highest and low-
est PFPP, respectively. Compared with 100% RDF ( T2), T6 increased the P use efficiency by 67%. P. fluorescens
exhibited the highest P use efficiency regarding individual bio-priming agents, followed by T. harzianum and
B. subtilis. However, compared with the first year, bio-priming with B. subtilis showed a 6% increment in PFPP
during the second year. The results of PFPP followed the order: dual-species bio-priming > single-species bio-
priming > triple-species bio-priming.
Scientific Reports | (2021) 11:15680 | https://doi.org/10.1038/s41598-021-95092-6 5
Vol.:(0123456789)www.nature.com/scientificreports/
K use efficiency
Agronomic efficiency (kg Physiological efficiency Apparent recovery Partial factor productivity
kg−1) (kg kg−1) efficiency (%) (kg kg−1)
Treatments 2016–201,717 2017–2018 2016–2017 2017–2018 2016–2017 2017–2018 2016–2017 2017–2018
T1: Absolute control
N:P2O5:K2O @ – – – – – – – –
0:0:0 kg ha−1
T2: RDF of
N:P2O5:K2O @ 18.96c 22.15c 32.08 34.33 59.13d 64.27c 27.94c 28.10c
120:60:60 kg ha−1
T3: 75%
RDF + Trichoderma 24.13bc 30.04abc 32.31 33.93 74.45 cd 88.44abc 36.11bc 37.97ab
harzianum
T4: 75% RDF + Pseu‑
26.18abc 31.60ab 31.25 33.49 84.02abcd 94.83ab 38.16ab 39.54ab
domonas fluorescens
T5: 75%
RDF + Bacillus 22.91bc 29.10bc 29.47 33.29 77.54bcd 87.75abc 34.89bc 37.04b
subtilis
T6: 75% RDF + T.
harzianum + P. 34.89a 38.75a 31.68 33.67 109.26a 116.49a 46.87a 46.69a
fluorescens
T7: 75% RDF + P.
fluorescens + B. 30.89ab 35.05ab 29.18 31.32 105.92ab 112.53ab 42.87ab 42.98ab
subtilis
T8: 75% RDF + T.
harzianum + B. 27.38abc 33.40ab 29.35 32.09 93.83abc 104.45ab 39.36ab 41.33ab
subtilis
T9: 75% RDF + T.
harzianum + P. fluo‑ 21.93bc 27.94bc 30.60 32.69 71.51 cd 84.97bc 33.91bc 35.88bc
rescens + B. subtilis
Table 3. Potassium use efficiency of red cabbage as influenced by bio-priming and fertilisation. Different
letters indicate significant differences at P ≤ 0.05 among the treatments as per DMRT.
Potassium use efficiency. The results of K use efficiency in the form of agronomic efficiency (AEK), and
partial factor productivity ( PFPK) was similar to that of P use efficiency ( AEP and P
FPP) because the amount of
nutrient applied for P and K was the same, i.e., 60 kg as RDF. The maximum and minimum K use efficiency ( AEK
and PFPK) were obtained from 75% RDF + T. harzianum + P. fluorescens (T6) and 100% RDF (T2), respectively
(Table 3). The performance of the triple consortium was lowest among the bio-primed treatments. Application
of P. fluorescens resulted in higher AEK in terms of single-species bio-priming.
Physiological efficiency ( PEK) varied from 29.18 to 34.33 kg of head k g−1 of K applied (Table 3). The highest
PEK of 32.31 kg of head kg−1 of K applied was recorded with 75% RDF + T. harzianum (T3) in 2016–2017, while
application of 100% RDF (T2) registered the highest PEK of 34.33 kg of head kg−1 of K applied in 2017–2018.
Results of PEK further indicated that microbial consortium treatments gave an equivalent effect to that of single-
species bio-priming treatments. Sole application of T. harzianum resulted in higher PEK than other bio-primed
treatments including dual and triple consortiums.
In the present study, apparent recovery efficiency ( AREK) ranged from 59.13 to 116.49%, with a mean value of
89.34% (Table 3). The maximum AREK was achieved under 75% RDF + T. harzianum + P. fluorescens (T6), which
increased from 109.26% in the first year to 116.49% in the second year. Among single bio-priming agents, P.
fluorescens showed the highest AREK. This microbe recorded a 13% increment in AREK as compared to the first
year. Results followed the trend of 75% RDF + dual consortium > 75% RDF + single bio-priming agents > 75%
RDF + triple consortium > 100% RDF. Application of triple consortium reduced the A REK by 45% (average of
two years) compared to that of dual consortium (T. harzianum + P. fluorescens). Enhanced K uses efficiency in
AEK, PEK, and A REK due to bacterial inoculations and reduced chemical fertilizer quantity reported by Khang-
hah et al.38.
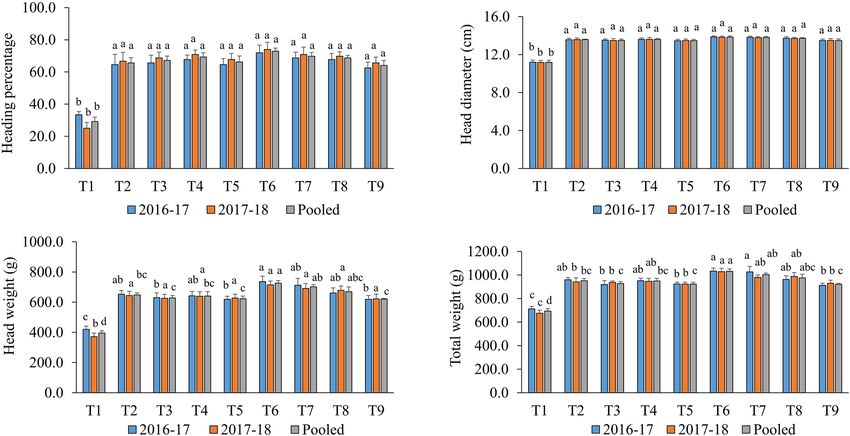
Yield attributes. The observation on heading percentage and head diameter indicated that the sole applica-
tion of mineral fertilizers and integrated application along with bio-agents did not bring any significant variation
among the treated plants (Fig. 2). Heading percentage (72.92), as well as head diameter (13.85), was recorded
to be maximum in 75% RDF + T. harzianum + P. fluorescens (T6). The lowest heading percentage was noticed in
absolute control (29.17) followed by a triple consortium (64.06). The average diameter of marketable heads was
13.35 cm. Head weight varied from 371.63 to 736.29 g (Fig. 2).
On a pooled basis, a significantly higher head weight (725.51 g) was detected with T 6 compared to the rest of
the treatments. It registered 12% and 83% increments over 100% RDF (T2) and absolute control (T1), respectively.
Bio-priming with triple consortium recorded 17% lower head weight than dual consortium (T. harzianum + P.
fluorescens). Results on head weight followed the order of 75% RDF + T. harzianum + P. fluorescens (T6) > 75%
RDF + P. fluorescens + B. subtilis (T7) > 75% RDF + T. harzianum + B. subtilis (T8) > 100% RDF (T2) > 75% RDF + P.
fluorescens (T4) > 75% RDF + T. harzianum (T3) > 75% RDF + B. subtilis (T5) > 75% RDF + T. harzianum + P.
Scientific Reports | (2021) 11:15680 | https://doi.org/10.1038/s41598-021-95092-6 6
Vol:.(1234567890)www.nature.com/scientificreports/
Figure 2. Effect of bio-priming and fertilization on yield attributes of red cabbage. Bars (mean ± SE; n = 3)
followed by different alphabets significantly differ (P ≤ 0.05) among the treatments as per DMRT. Treatments:
T1: Absolute control N:P2O5:K2O @ 0:0:0 kg ha−1; T2: RDF of N:P2O5:K2O @ 120:60:60 kg ha−1; T3: 75%
RDF + Trichoderma harzianum; T4: 75% RDF + Pseudomonas fluorescens; T5: 75% RDF + Bacillus subtilis; T6: 75%
RDF + T. harzianum + P. fluorescens; T7: 75% RDF + P. fluorescens + B. subtilis; T8: 75% RDF + T. harzianum + B.
subtilis; T9: 75% RDF + T. harzianum + P. fluorescens + B. subtilis.
fluorescens + B. subtilis (T9) > absolute control (T1). A perusal of pooled data presented in Fig. 2 revealed that the
total weight varied from 693.33 to 1030.49 g. In total weight, T6 was 8% and 49% higher than T2 and T1, respec-
tively. The total weight of plants under T 7. P. fluorescens combined with 75% RDF resulted in
6 was at par with T
an equivalent total weight to that of 100% RDF. The direct impact of bio-priming on plant growth promotion
was reported in earlier studies5,8. However, these studies were conducted in pot conditions. The current study
focuses on the practical utility of such technology under field conditions. Higher yield attributes in bio-primed
treatments could alter cellular mechanisms in these plants and regulated nutrient supply from the soil. Integrated
application of inorganic fertilizers (75% RDF) and organics (biofertilizer + vermicompost) yielded the highest
marketable head percentage and a head weight of c abbage39. Application of organics (poultry manure) alone
showed greater head weight (17%) and head length (8%) of cabbage over NPK fertilizers40.
Energy budgeting. Efficient use of energy inputs in a production system must lessen our dependence
on non-renewable energy and maintain sustainability. The magnitude of energy input ranged from 6323 to
14,663 MJ ha−1 (Table 4). Bio-priming intervention in red cabbage cultivation saved 1906 to 1965 MJ ha−1 energy
requirement. As expected, the energy consumed under 100% RDF (T2) was ~ 15% higher than bio-priming
treatments. Energy output (26,370 and 26,630 MJ ha−1) and energy balance (13,643 and 13,903 MJ ha−1) were
considerably higher in T 6 treatment (75% RDF + T. harzianum + P. fluorescens) during both the years of study.
Compared to the first year, energy balance declined (2%) in T 2 treatment. Among the treatments with amend-
ments, T6 showed the highest energy use efficiency (2.09). The triple consortium treatment ( T6) recorded the
lowest energy balance (9799 MJ ha−1) and energy use efficiency (1.77) compared to other bio-priming treat-
ments. However, the bio-priming treatments were greater in energy balance and energy use efficiency than sole
use of chemical fertilization. It shows that fertilizer inputs consume the highest energy. In cabbage production,
the consumption of energy by mineral fertilizers may be as high as 77%20. It is of great concern, and the non-
renewable sources of plant nutrients must be substituted with renewable sources. Mihov et al.41 reported that
cabbage’s organic production could save 31.23% energy unit a rea−1 than its conventional production system.
Application of biofertilizers and reduced dose of fertilizers enhance energy balance and energy use efficiency of
a cropping s ystem42–48.
Economic analysis. Farmers will adopt any technology when it is economically feasible. Different eco-
nomic indicators, such as gross return, the net return, and benefit:cost (B:C) ratio showed wide variations among
the treatments (Table 5). Maximum gross return (US $ 16,030 and 15,966 ha−1) and net return (US $ 13,877 and
13,813 ha−1) were recorded with the application of T 6 treatment (75% RDF + T. harzianum + P. fluorescens) dur-
ing both the years of study. The treatment also achieved the highest B:C ratio of 6.45 and 6.42. Lowest returns
and B:C ratio were observed in control. Our results showed that the application of microbial consortium and
75% RDF could be profitable than 100% RDF by providing about US $ 3222.5 higher net return on a hectare
Scientific Reports | (2021) 11:15680 | https://doi.org/10.1038/s41598-021-95092-6 7
Vol.:(0123456789)www.nature.com/scientificreports/
2016–2017 2017–2018
Input energy (MJ Output energy Energy balance Energy use Input energy (MJ Output energy Energy balance Energy use
Treatments ha−1) (MJ ha−1) (MJ ha−1) efficiency ha−1) (MJ ha−1) (MJ ha−1) efficiency
T1: Absolute con-
trol N:P2O5:K2O @ 6323 13553d 7230d 2.14a 6323 12187c 5863d 1.93ab
0:0:0 kg ha−1
T2: RDF of
N:P2O5:K2O @ 14,663 23137abc 8473 cd 1.58e 14,663 22967b 8303 cd 1.57c
120:60:60 kg ha−1
T3: 75%
RDF + Tricho‑ 12,698 22307bc 9609bcd 1.76cde 12,698 23430b 10732bc 1.85ab
derma harzianum
T4: 75%
RDF + Pseu‑
12,698 23477abc 10779abc 1.85bcd 12,698 23947ab 11249abc 1.89ab
domonas fluore‑
scens
T5: 75%
RDF + Bacillus 12,698 22207bc 9509bcd 1.75cde 12,698 22790b 10092bc 1.79bc
subtilis
T6: 75% RDF + T.
harzianum + P. 12,727 26370a 13643a 2.07ab 12,727 26630a 13903a 2.09a
fluorescens
T7: 75% RDF + P.
fluorescens + B. 12,727 25303ab 12576ab 1.99abc 12,727 24867ab 12139ab 1.95ab
subtilis
T8: 75% RDF + T.
harzianum + B. 12,727 23770abc 11043abc 1.87bcd 12,727 24657ab 11929ab 1.94ab
subtilis
T9: 75% RDF + T.
harzianum + P.
12,757 21640c 8883 cd 1.70de 12,757 22557b 9799bc 1.77bc
fluorescens + B.
subtilis
Table 4. Energetics of red cabbage production as influenced by bio-priming and mineral fertilization.
Different letters indicate significant differences at P ≤ 0.05 among the treatments as per DMRT.
2016–2017 2017–2018
Treatments Gross return (US $ h
a−1) Net return (US $ ha−1) B:C ratio Gross return (US $ h
a−1) Net return (US $ ha−1) B:C ratio
T1: Absolute control N:P2O5:K2O @
4098c 2011c 0.96c 2714c 627c 0.30c
0:0:0 kg ha−1
T2: RDF of N:P2O5:K2O @ 120:60:60 kg h
a−1 12743ab 10588ab 4.91ab 12812b 10657b 4.95b
T3: 75% RDF + Trichoderma harzianum 12350b 10200b 4.74b 12987b 10836b 5.04b
T4: 75% RDF + Pseudomonas fluorescens 13050ab 10900ab 5.07ab 13522ab 11372ab 5.29ab
T5: 75% RDF + Bacillus subtilis 11932 b
9782b
4.55b
12667 b
10517 b
4.89b
T6: 75% RDF + T. harzianum + P. fluorescens 16030 a
13877a
6.45a
15966 a
13813 a
6.42a
T7: 75% RDF + P. fluorescens + B. subtilis 14662 ab
12509ab
5.81ab
14700 ab
12547 ab
5.83ab
T8: 75% RDF + T. harzianum + B. subtilis 13462 ab
11308ab
5.25ab
14136 ab
11983 ab
5.57ab
T9: 75% RDF + T. harzianum + P. fluores‑
11596b 9440b 4.38b 12271b 10115b 4.69b
cens + B. subtilis
Table 5. Economics of red cabbage production as influenced by bio-priming and mineral fertilization. 1 US
$ = 66 INR; Produce cost calculated @ 0.76 US $ kg−1; Spencer (Supermarket) cost = 2.42 US $ kg−1. Different
letters indicate significant differences at P ≤ 0.05 among the treatments as per DMRT.
basis. The integrated approach’s performance was better in a dual consortium in most cases, while in single-
species bio-priming, application of P. fluorescence yields a higher B:C ratio than 100% RDF. The high profitability
of a system is related to higher productivity and lowering of production cost. Thakur et al.49 noted the highest net
return and B:C ratio with the conjoint application of 75% NPK and organics (organic manures + biofertilizers) in
cauliflower. Another study by Kamal et al.50 reported a significant effect on B:C ratio of hybrid cabbage produc-
tion due to the combined application of bio-agents and chemical fertilizers.
Conclusion
We have evaluated different performance indicators, each depicting new viewpoints on biotechnological inter-
vention in integrated nutrient management. Our results generated from field experiments indicated bio-priming
in combination with mineral fertilization augmented the productivity, nutrient use efficiency, and profitability
of red cabbage cultivation while minimizing the energy requirements. The strategy was more effective under
Scientific Reports | (2021) 11:15680 | https://doi.org/10.1038/s41598-021-95092-6 8
Vol:.(1234567890)www.nature.com/scientificreports/
8 35
Sunshine (hr) and Evaporation (mm)
7 30
6
25
Temperature (°C)
5
20
4
15
3
10
2
1 5
0 0
49th 50th 51th 52nd 1st 2nd 3rd 4th 5th 6th 7th 8th 9th 10th
STANDARD WEEK
Sunshine (hr) Evaporation (mm) Temperature (°C) MAX. Temperature (°C) MIN.
(a)
10 35
Sunshine (hr) and Evaporation (mm)
9
30
8
25
Temperature (°C)
7
6 20
5
4 15
3 10
2
5
1
0 0
49th 50th 51th 52nd 1st 2nd 3rd 4th 5th 6th 7th 8th 9th 10th
STANDARD WEEK
Sunshine (hr) Evaporation (mm) Temperature (°C) MAX. Temperature (°C) MIN.
(b)
Figure 3. Meteorological observations during growth period of red cabbage (a) 2016–2017 (b) 2017–208.
dual inoculation treatments over control. Bio-priming with T. harzianum and P. fluorescens emerged out to be
the most suitable treatment over control for red cabbage production, followed by bacterial co-inoculations of P.
fluorescens and B. subtilis. Development of low-cost technology with a high B:C ratio has prime importance for
resource-poor farmers. Our investigation also has great relevance to the United Nations Sustainable Develop-
ment Goals’ targets by adopting cleaner and cost-effective crop production practices to ensure food security and
resource use efficiency in developing countries like India.
Materials and methods
Study site. A two-year field experiment was conducted at the Vegetable Research Farm of the Institute of
Agricultural Sciences, Banaras Hindu University, Varanasi, (25o26’N, 82o99’E, and 80.7 m above mean sea level),
Uttar Pradesh, India, during two consecutive winter (rabi) seasons of 2016–17 and 2017–18. The experimental
site falls under Middle Gangetic Plains (agro-ecological region) of Eastern India. Varanasi is characterized by
a semi-arid and sub-humid climate with an annual average rainfall of around 1100 mm. The cold period starts
in November and stays till February, designating January as the coldest month. Meteorological observations
(maximum and minimum temperature, sunshine, and evaporation) during the cropping seasons are graphi-
cally presented in Fig. 3. The mean weekly maximum and minimum temperature of the two crop seasons were
recorded as 30.0 °C and 7.06 °C, respectively. Sunshine duration was higher in the second growing season. The
experimental soil, Gangetic alluvial in nature, is classified in Typic Ustochrept of the order Inceptisol. Salient
initial physical, chemical and biological properties (Table 6) of the soil were determined before starting field
Scientific Reports | (2021) 11:15680 | https://doi.org/10.1038/s41598-021-95092-6 9
Vol.:(0123456789)www.nature.com/scientificreports/
Value
Parameter 2016–2017 2017–2018 Reference
Sand (%) 47.65 47.63
51
Silt (%) 30.06 30.12
Clay (%) 22.29 22.25
Bulk density (Mg m−3) 1.36 ± 0.01 1.37 ± 0.01 52
53
Maximum water holding capacity (%) 42.4 42.1
54
pH (1:2) 7.58 ± 0.02 7.52 ± 0.03
EC (dS m−1) 0.25 ± 0.01 0.26 ± 0.01 55
Exchangeable Ca2+ + Mg2+ [cmol (p +) kg−1] 8.72 ± 0.29 9.16 ± 0.23 56
CEC [cmol (p +) k g−1] 18.74 ± 0.39 19.86 ± 0.53 57
Organic C (g k g−1) 4.04 ± 0.16 4.15 ± 0.20 58
a−1)
Available N (kg h 203.21 ± 9.22 213.25 ± 8.87 59
Available P (kg ha−1) 20.86 ± 0.44 22.35 ± 0.31 60
−1 61
Available K (kg h
a ) 217.73 ± 2.42 226.69 ± 6.40
Table 6. Initial properties of the soil before transplanting of crop. Values are ± standard error of mean.
experiments. The initial analysis revealed that the soil was sandy loam in texture, slightly alkaline in reaction, low
in organic carbon and available N content, and medium in available P and available K content.
Seed and microbial agents. Red cabbage variety F1 Hybrid Red Ruby-2 was used as a test crop in the
present study. The maturity period of the crop lies between 90 and 100 days after transplanting. Truthful label
seeds with 70% germination rate and 98% physical purity were used for sowing in the nursery. The variety is
suitable for growing in the Eastern Zone of India. Microbes, viz., Trichoderma harzianum (BHU P4; GenBank
accession No. MH730446), Pseudomonas fluorescens (OKC; GenBank accession No. JN128891), and Bacillus
subtilis (BHHU100; GenBank accession No. JN099686) were collected from the Department of Mycology and
Plant Pathology of Institute of Agricultural Sciences, Banaras Hindu University, India. These microbial strains
were compatible with each other and showed particular plant growth-promoting (PGP) t raits62.
Bio‑priming. Preparation of inoculum. Bacterial (B. subtilis and P. fluorescens) culture was inoculated in
250 mL flasks containing 100 mL nutrient broth and kept in a shaking incubator (150 rpm; 28 ± 2 °C) for 48 h.
Bacterial pellets were obtained by centrifugation (7000 rpm; 4 °C) for 10 min. Discarding the supernatant, the
cell pellets were soon washed with sterile distilled water. An adjustment of final cell density to 4 × 10⁸ CFU mL−1
was done using optical density (< 1) at 600 n m63. In T. harzianum, spore suspension was prepared from 1 week
of culture grown (28 ± 2 °C) on potato dextrose agar by harvesting the spores in sterilized 0.85% sodium chloride
(NaCl)5. The spore concentration was adjusted to 2 × 10⁷ CFU mL−1 by measuring the optical density in a spec-
trophotometer. Cell suspensions and/or spore suspension were mixed in equal ratios for the dual consortium
(1:1) and triple consortium (1:1:1).
Seedling bio‑priming. Red cabbage seeds were washed with tap water and surface sterilized with 0.1% mercuric
chloride (HgCl2) solution for 2 min. After sterilization, the seeds were immediately washed with autoclaved
distilled water three times. Next, the seeds were soaked in sterile distilled water for 2 h. After the hydration
treatment, the seeds were sown in the nursery. Seedlings were picked when there were 5–6 leaves. Soil attached
with the roots was washed carefully, followed by root dipping in liquid culture containing 2% carboxymethyl
cellulose (CMC) as an adhesive agent. The bio-priming process was followed for 5 h under incubated conditions
(28 ± 2 °C; > 90% relative humidity)5,36,62.
Experimental design and crop management. The field setup was laid out in a randomized block design with
nine treatments and three replications. Red cabbage seeds were sown in raised bed nursery about 1 month
before transplanting. The field was twice ploughed by a tractor and planked 15 days before the implementa-
tion of the experiment. Crop residues, stones, pebbles, or weeds were removed manually from the field. Five
weeks of healthy and uniform-sized red cabbage seedlings were transplanted in 4 × 2 m2 plots with a spacing of
50 cm × 50 cm on 5th December 2016 and 2017. Four rows in a plot accommodated 32 plants. The crop was irri-
gated for 2 weeks with a watering can just after transplanting. After that, it received four irrigations at 7–10 days
intervals as per the requirement. A full dose of diammonium phosphate (DAP) and muriate of potash (MOP)
was applied as basal at the time of final land preparation. The urea dose was given in three splits, including
basal application and top dressing, at 30 and 45 days (head initiation) after transplanting plant seedlings. Other
intercultural operations like gap filling and weeding (3 times) were also carried. In general, the pest and disease
incidence was not observed during both crop seasons. The treatments comprised nine combinations of mineral
fertilizers and bio-agents, including one absolute control outlined in Table 7. The recommended dose of fertilizer
(RDF) was applied @ 120:60:60 kg ha−1 (N:P2O5:K2O) through urea, DAP, and MOP, respectively. The fertilizer
dose was reduced to 25% when the priming agents were used (Table 7).
Scientific Reports | (2021) 11:15680 | https://doi.org/10.1038/s41598-021-95092-6 10
Vol:.(1234567890)www.nature.com/scientificreports/
Mineral fertilization
(kg ha−1)
Treatments Notations used N P2O5 K2O
Absolute control N:P2O5:K2O @ 0:0:0 kg ha−1 T1 0 0 0
a−1
RDF of N:P2O5:K2O @ 120:60:60 kg h T2 120 60 60
75% RDF + Trichoderma harzianum T3 90 45 45
75% RDF + Pseudomonas fluorescens T4 90 45 45
75% RDF + Bacillus subtilis T5 90 45 45
75% RDF + T. harzianum + P. fluorescens T6 90 45 45
75% RDF + P. fluorescens + B. subtilis T7 90 45 45
75% RDF + T. harzianum + B. subtilis T8 90 45 45
75% RDF + T. harzianum + P. fluorescens + B. subtilis T9 90 45 45
Table 7. Details of treatment combinations applied during the study.
Biometric observations. Data related to yield attributing parameters such as heading percentage, head diameter
(cm), head weight (g), and total weight (g) were collected at harvest.
Computation of nutrient uptake and nutrient use efficiency. Nutrient uptake and nutrient use efficiency were
calculated using the following equations.
Nutrient uptake.
Nutrient content (%) × Yield(kg ha−1 )
Nutrient uptake (kg ha−1 ) =
100
Nitrogen content was determined by the micro Kjeldahl method after pre-digestion with concentrated sulphu-
ric acid (H2SO4) followed by catalyst mixture64. Phosphorus content was determined by vanadomolybdophos-
phoric yellow color method after pre-digestion with diacid ( HNO3:HClO4)65. The acid-digest prepared for P was
used to assess potassium (K) in a flame photometer66.
Agronomic efficiency.
Y − Yo
Agronomic efficiency kg/ha =
Quantity kg/ha of nutrients applied 100
where Y = head yield (kg ha−1) with applied nutrient, Y0 = head yield (kg ha−1) with no applied nutrient.
Physiological efficiency.
Y − YO
Physiological efficiency kg kg−1 =
U − UO
where, Y = head yield (kg ha−1) with applied nutrient, Y0 = head yield (kg ha−1) with no applied nutrient, U = total
a−1) with applied nutrient; U0 = total nutrient uptake (kg h
nutrient uptake (kg h a−1) with no applied nutrient.
Apparent recovery efficiency.
U − UO
Apparent recovery efficiency (%) =
× 100
Quantity kg ha−1 of nutrient applied
where, U = total nutrient uptake (kg ha−1) with applied nutrient; U0 = total nutrient uptake (kg ha−1) with no
applied nutrient.
Partial factor productivity.
Head yield kg ha−1
Partial factor productivity kg kg−1 =
Quantity kg ha−1 of nutrient applied
Energy analysis. The energy input–output relationship was determined based on the energy equivalent of
inputs and output (Table 8). Solar energy was not included in the calculation. Energy analysis involved the fol-
lowing equations.
Scientific Reports | (2021) 11:15680 | https://doi.org/10.1038/s41598-021-95092-6 11
Vol.:(0123456789)www.nature.com/scientificreports/
Energy equivalent (MJ unit−1
Particulars Units 20,21,41
) Unit cost (US $ u
nit−1)
Human labor hr 1.96 1.26
Diesel L 56.31 0.98
Farm machinery hr 62.70 7.57
Electricity kWh 11.91
Mineral fertilizer
N kg 60.60 0.227
P2O5 kg 11.10 0.378
K 2O kg 6.70 0.303
Biofertilizer L 2.98 7.57
Irrigation water m3 1.02 0.0076
Seed kg 0.8 454
Produce kg 0.8 0.76
Table 8. Energy equivalents and cost of inputs and outputs in red cabbage production. 1 US $ = 66 INR.
Energy output MJ ha−1
Energy use efficiency =
Energy input MJ ha−1
Head yield kg ha−1
Energy productivity =
Energy input MJ ha−1
Energy balance = Energy output MJ ha−1 − Energy input MJ a−1
Economic analysis. Expenditures were calculated considering the unit cost of variable inputs and output
(produce) based on prevailing market prices (Table 8). The cost of cultivation (total expenditure) was subtracted
from the gross return for obtaining the net return. Benefit: cost (B:C) ratio was worked out using the following
formula.
Net return US $ ha−1
B : Cratio =
Total expenditure US $ ha−1
Statistical analysis. Data collected during the study were subjected to one-way analysis of variance
(ANOVA). Values are presented as mean ± standard error (SE). Significance of difference between treatment
means was performed using Duncan’s multiple range test (DMRT) at P ≤ 0.05 significance level. Statistical Pack-
age for Social Science (SPSS, version 20) software was used for these analyses 67,68.
International, national and/or institutional guidelines. Authors reporting experiments confirmed
that the use of plants in the present study complies with international, national and/or institutional guidelines.
Received: 11 March 2021; Accepted: 15 July 2021
References.
1. Ramakrishna-Parama, V. R. Need for sustained nutrient cycling and management—issues and responses. J. Indian Soc. Soil Sci.
62, S86–S94 (2014).
2. Priyadarshini, P. & Abhilash, P. C. Policy recommendations for enabling transition towards sustainable agriculture in India. Land
Use Policy 96, 104718 (2020).
3. Sarkar, D. & Rakshit, A. Safeguarding the fragile rice–wheat ecosystem of the Indo-Gangetic Plains through bio-priming and
bioaugmentation interventions. FEMS Microbiol. Ecol. 96, fiaa221 (2020).
4. Meena, S. K., Rakshit, A. & Meena, V. S. Effect of seed bio-priming and N doses under varied soil type on nitrogen use efficiency
(NUE) of wheat (Triticum aestivum L.) under greenhouse conditions. Biocatal. Agric. Biotechnol. 6, 68–75 (2016).
5. Singh, V., Upadhyay, R. S., Sarma, B. K. & Singh, H. B. Trichoderma asperellum spore dose depended modulation of plant growth
in vegetable crops. Microbiol. Res. 193, 74–86 (2016).
6. Chatterjee, N. et al. On-farm seed priming interventions in agronomic crops. Acta Agric. Slov. 111, 715–735 (2018).
7. Yadav, S. K. et al. Co-inoculated biopriming with Trichoderma, Pseudomonas and Rhizobium improves crop growth in Cicer
arietinum and Phaseolus vulgaris. Int. J. Agric. Environ. Biotechnol 6, 255–259 (2013).
8. Meena, S. K., Rakshit, A., Singh, H. B. & Meena, V. S. Effect of nitrogen levels and seed bio-priming on root infection, growth and
yield attributes of wheat in varied soil type. Biocatal. Agric. Biotechnol. 12, 172–178 (2017).
Scientific Reports | (2021) 11:15680 | https://doi.org/10.1038/s41598-021-95092-6 12
Vol:.(1234567890)www.nature.com/scientificreports/
9. Bottner, P., Pansu, M. & Sallih, Z. Modelling the effect of active roots on soil organic matter turnover. Plant Soil 216, 15–25 (1999).
10. Buchenauer, H. Biological control of soil-borne diseases by rhizobacteria/Biologische Bekämpfung von bodenbürtigen Krankheiten
durch Rhizobakterien. Zeitschrift für Pflanzenkrankheiten und Pflanzenschutz/Journal Plant Dis. Prot. 105, 329–348 (1998).
11. Glick, B. R. Plant growth-promoting bacteria: mechanisms and applications. Scientifica (Cairo). 2012, 963401 (2012).
12. Ahemad, M. & Kibret, M. Mechanisms and applications of plant growth promoting rhizobacteria: current perspective. J. King
Saud Univ. Sci. 26, 1–20 (2014).
13. de Souza, R., Ambrosini, A. & Passaglia, L. M. P. Plant growth-promoting bacteria as inoculants in agricultural soils. Genet. Mol.
Biol. 38, 401–419 (2015).
14. Sarkar, D., Pal, S., Singh, H. B., Yadav, R. S. & Rakshit, A. Harnessing Bio-priming for Integrated Resource Management under
Changing Climate. In Advances in PGPR Research vol 349 (eds Singh, H. B. et al.) (CABI International, 2017).
15. Rakshit, A. Impact assessment of bio priming mediated nutrient use efficiency for climate resilient agriculture. In Climate Change
and Agriculture in India: Impact and Adaptation 57–68 (Springer, 2019).
16. Paungfoo-Lonhienne, C., Redding, M., Pratt, C. & Wang, W. Plant growth promoting rhizobacteria increase the efficiency of
fertilisers while reducing nitrogen loss. J. Environ. Manag. 233, 337–341 (2019).
17. Pereira, S. I. A., Abreu, D., Moreira, H., Vega, A. & Castro, P. M. L. Plant growth-promoting rhizobacteria (PGPR) improve the
growth and nutrient use efficiency in maize (Zea mays L.) under water deficit conditions. Heliyon 6, e05106 (2020).
18. Yadav, G. S. et al. Energy budgeting for designing sustainable and environmentally clean/safer cropping systems for rainfed rice
fallow lands in India. J. Clean. Prod. 158, 29–37 (2017).
19. Singh, K. P., Prakash, V., Srinivas, K. & Srivastva, A. K. Effect of tillage management on energy-use efficiency and economics of
soybean (Glycine max) based cropping systems under the rainfed conditions in North-West Himalayan Region. Soil Tillage Res.
100, 78–82 (2008).
20. Tuti, M. D. et al. Energy budgeting of colocasia-based cropping systems in the Indian sub-Himalayas. Energy 45, 986–993 (2012).
21. Mihov, M. & Tringovska, I. Energy efficiency improvement of greenhouse tomato production by applying new biofertilizers. Bulg.
J. Agric. Sci. 16, 454–458 (2010).
22. Pal, S. & Singh, H. B. Energy inputs and yield relationship in greenhouse okra production by bio-priming. Int. J. Agric. Environ.
Biotechnol. 11, 741–746 (2018).
23. Mizgier, P. et al. Characterization of phenolic compounds and antioxidant and anti-inflammatory properties of red cabbage and
purple carrot extracts. J. Funct. Foods 21, 133–146 (2016).
24. Sarkar, D. & Rakshit, A. Red cabbage as potential functional food in the present perspective. Int. J. Bioresour. Sci. 4, 7 (2017).
25. Narayanamma, M., Chiranjeevi, C. H., Reddy, I. P. & Ahmed, S. R. Integrated nutrient management in cauliflower (Brassica oleracea
var botrytis L.). Veg Sci 32, 62–64 (2005).
26. Chatterjee, R., Choudhuri, P. & Thirumdasu, R. K. Uptake and availability of major nutrients in cabbage crop amended with organic
and inorganic nutrient sources under Eastern Himalayan Region. J. Basic Appl. Res. Int. 2, 100–105 (2016).
27. Bhardwaj, S., Kaushal, R., Kaushal, M. & Bhardwaj, K. K. Integrated nutrient management for improved cauliflower yield and soil
health. Int. J. Veg. Sci. 24, 29–42 (2018).
28. Danish, S., Zafar-Ul-Hye, M., Hussain, S., Riaz, M. & Qayyum, M. F. Mitigation of drought stress in maize through inoculation
with drought tolerant ACC deaminase containing PGPR under axenic conditions. Pakistan J. Bot. 52, 49–60 (2020).
29. Danish, S., Zafar-ul-Hye, M., Mohsin, F. & Hussain, M. ACC-deaminase producing plant growth promoting rhizobacteria and
biochar mitigate adverse effects of drought stress on maize growth. PLoS ONE 15, e0230615 (2020).
30. Zafar-ul-Hye, M., Danish, S., Abbas, M., Ahmad, M. & Munir, T. M. ACC deaminase producing PGPR Bacillus amyloliquefaciens
and Agrobacterium fabrum along with biochar improve wheat productivity under drought stress. Agron. 9, 343 (2019).
31. Danish, S. et al. Drought stress alleviation by ACC deaminase producing Achromobacter xylosoxidans and Enterobacter cloacae,
with and without timber waste biochar in maize. Sustainability 12, 6286 (2020).
32. Kaur, G. & Reddy, M. S. Role of phosphate-solubilizing bacteria in improving the soil fertility and crop productivity in organic
farming. Arch. Agron. Soil Sci. 60, 549–564 (2014).
33. Basak, N. et al. Impact of long-term application of organics, biological, and inorganic fertilizers on microbial activities in rice-based
cropping system. Commun. Soil Sci. Plant Anal. 48, 2390–2401 (2017).
34. Ranjit, C., Bandhopadhyay, S. & Jana, J. C. Organic amendments influencing growth, head yield and nitrogen use efficiency in
cabbage (Brassica oleracea var Capitata L.) . Am. Int. J. Res. Formal Appl. Nat. Sci. 5, 90–95 (2014).
35. Visconti, D. et al. Can Trichoderma-based biostimulants optimize N Use efficiency and stimulate growth of leafy vegetables in
greenhouse intensive cropping systems? Agronomy 10, 121 (2020).
36. Yaseen, M. & Malhi, S. S. Variation in yield, phosphorus uptake, and physiological efficiency of wheat genotypes at adequate and
stress phosphorus levels in soil. Commun. Soil Sci. Plant Anal. 40, 3104–3120 (2009).
37. Emami, S. et al. Consortium of endophyte and rhizosphere phosphate solubilizing bacteria improves phosphorous use efficiency
in wheat cultivars in phosphorus deficient soils. Rhizosphere 14, e100196 (2020).
38. Khanghahi, M. Y., Pirdashti, H., Rahimian, H., Nematzadeh, G. & Sepanlou, M. G. Potassium solubilising bacteria (KSB) isolated
from rice paddy soil: from isolation, identification to K use efficiency. Symbiosis 76, 13–23 (2018).
39. Chatterjee, R. Physiological attributes of cabbage (Brassica oleracea) as influenced by different sources of nutrients under eastern
Himalayan region. Res. J. Agric. Sci. 1, 318–321 (2010).
40. Moyin-Jesu, E.I. Use of different organic fertilizers on soil fertility improvement, growth and head yield parameters of cabbage
(Brassica oleraceae L). Intnl. J. Recycl. Organic Waste Agri. 4, 291–298.
41. Mihov, M. et al. Energy assessment of conventional and organic production of head cabbage. Bulg. J. Agric. Sci. 18, 320–324 (2012).
42. Munda, S. et al. Inorganic phosphorus along with biofertilizers improves profitability and sustainability in soybean (Glycine
max)–potato (Solanum tuberosum) cropping system. J. Saudi Soc. Agric. Sci. 17, 107–113 (2018).
43. Tahir, F. A., Ahamad, N., Rasheed, M. K. & Danish, S. Effect of various application rate of zinc fertilizer with and without fruit
waste biochar on the growth and Zn uptake in maize. Int. J. Biosci. 13, 159–166 (2018).
44. Ahmed, N. et al. Rhizobacteria and silicon synergy modulates the growth, nutrition and yield of mungbean under saline soil.
Pakistan J. Bot. 52, 9–15 (2020).
45. Adnan, M. et al. Coupling phosphate-solubilizing bacteria with phosphorus supplements improve maize phosphorus acquisition
and growth under lime induced salinity stress. Plants 9, 900 (2020).
46. Rafiullah, et al. Phosphorus nutrient management through synchronization of application methods and rates in wheat and maize
crops. Plants 9, 1389 (2020).
47. Zafar-ul-Hye, M., Hussain, N. M., Danish, S., Aslam, U. & Zahir, Z. A. Multi-Strain bacterial inoculation of Enterobacter cloacae,
Serratia ficaria and Burkholderia phytofirmans with fertilizers for enhancing resistance in wheat against salinity stress. Pakistan J.
Bot. 51, 1839–1846 (2019).
48. Zafar-ul-Hye, M., Zahra, M. B., Danish, S. & Abbas, M. Multi-strain inoculation with PGPR producing ACC deaminase is more
effective than single-strain inoculation to improve wheat (Triticum aestivum) growth and yield. Phyton-Int. J. Exp. Bot. 89, 405–
413 (2020).
49. Thakur, J., Kumar, P. & Mohit. Studies on conjoint application of nutrient sources and PGPR on growth, yield, quality, and econom-
ics of cauliflower (Brassica oleracea var. botrytis L). J. Plant Nutr. 41, 1862–1867 (2018).
Scientific Reports | (2021) 11:15680 | https://doi.org/10.1038/s41598-021-95092-6 13
Vol.:(0123456789)You can also read