Environmental, Social & Governance - October 2021

 
CONTINUE READING
Environmental, Social & Governance - October 2021
Environmental,
Social & Governance
          October 2021
Environmental, Social & Governance - October 2021
This presentation is made as of the date hereof and contains “forward-looking statements” as defined in Rule 3b-6 of the Securities Exchange Act of 1934, Rule 175 of the Securities
Act of 1933, and relevant legal decisions. The forward-looking statements are subject to risks and uncertainties. All forward-looking statements should be considered in the context of
the risk and other factors detailed from time to time in CMS Energy’s and Consumers Energy’s Securities and Exchange Commission filings. Forward-looking statements should be
read in conjunction with “FORWARD-LOOKING STATEMENTS AND INFORMATION” and “RISK FACTORS” sections of CMS Energy’s and Consumers Energy’s most recent Form 10-K and
as updated in reports CMS Energy and Consumers Energy file with the Securities and Exchange Commission. CMS Energy’s and Consumers Energy’s “FORWARDLOOKING
STATEMENTS AND INFORMATION” and “RISK FACTORS” sections are incorporated herein by reference and discuss important factors that could cause CMS Energy’s and Consumers
Energy’s results to differ materially from those anticipated in such statements. CMS Energy and Consumers Energy undertake no obligation to update any of the information
presented herein to reflect facts, events or circumstances after the date hereof.

The presentation also includes non-GAAP measures when describing CMS Energy’s results of operations and financial performance. A reconciliation of each of these measures to
the most directly comparable GAAP measure is included in the appendix and posted on our website at www.cmsenergy.com.

Investors and others should note that CMS Energy routinely posts important information on its website and considers the Investor Relations section, www.cmsenergy.com/investor-
relations, a channel of distribution.

Presentation endnotes are included after the appendix.

                                                         Enter “so what” if necessary – Century Gothic, Bold, Size 18 or smaller                                                          2
                                                                                                                                                                                          2
Environmental, Social & Governance - October 2021
CMS Energy Overview
                Corporate Structurea                                                                                Key Information
                                           CMS Energy                                                                  2020 Financial Statistics
                                           (NYSE: CMS)
                                                                                                                             Based in Jackson, MI
                                                                                                             ~8,200 Employees (41% unionized)b
             Consumers Energy                                     Enterprises
                                                                                                           $6.7 Bn Revenuec
                                                       2020                                              $764 MM Adjusted net incomec
                                  Gas
  >95% pro forma                                  Avg. Rate Base
  regulated utility
                                                     $6.8 Bn                                           7% adj. EPSd Growth for past 18 years
     earnings
                                Electric                                                                   In line Dividend per share growth
                                                         $13.0 Bn                                      w/earnings

                                                            Senior Management Team
                                                                                      Garrick Rochow
                                                                                            CEO

                  Rejji Hayes                                 Shaun Johnson                               Cathy Hendrian                             DV Rao
                     CFO                                      General Counsel                             People & Culture                     Strategy & Planning

                 LeeRoy Wells                                    Brian Rich                                 JF Brossoit                        Brandon Hofmeister
                  Operations                             Customer Experience & Tech                         Engineering                      Gov’t & Regulatory Affairs
                                                                                                                                                                          3
Presentation endnotes are included after the appendix.
Environmental, Social & Governance - October 2021
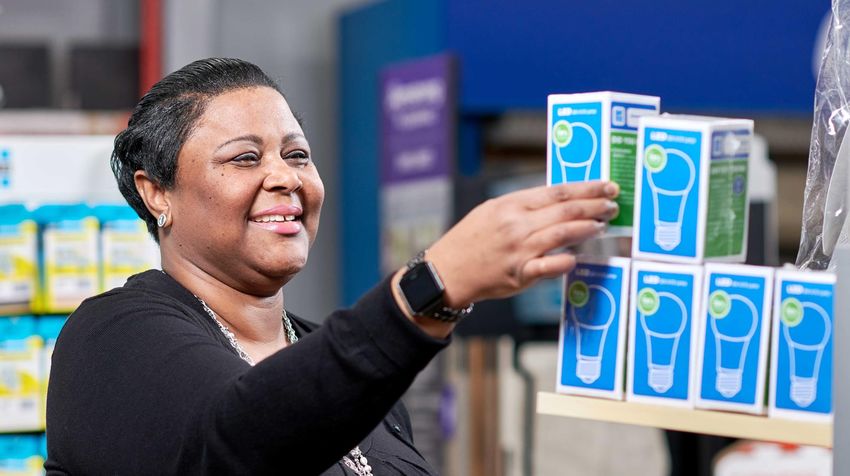
Consumers Energy Positioned Well . . .
                                                            4th Largest Combination Utility
                                                            •   Electric Utility
                                                                 1.9 MM electric customers
                                                                 7,927 MW of capacity
                                                            •   Gas Utility
                                                                 1.8 MM gas customers
                                                                 309 Bcf gas storage (#1 in the U.S.)
     Attracted                                              •   Serving 6.8 MM Michigan residents
  >485 MW
     of new or                                             Consumers Energy Planet Goals
    expanding
    load since                                                   Net zero methane emissions
        2015                                                               by 2030
                                                                              &
                                                                  Net zero carbon emissions
                                                                           by 2040a
Presentation endnotes are included after the appendix.

                                                         . . . for the clean energy transformation.     4
Environmental, Social & Governance - October 2021
CMS Enterprises Continues to Perform . . .
             Renewable Platform                                                DIG & Other
•   Aviator, 525 MWs[Move     to left side]
                         of contracted  wind             •   ~1,000 MWs in MI
     • 51% cash equity ownership (tax equity utilized)
     • Funded with cash on hand, no new equity           •   DIG long-term energy (>95% contracted) & short-term
     • Offers utility-like returns with creditworthy         capacity (100% contracted)
        counterparties
                                                         •   Filer City PPA with the Utility

•   Operating projects:
                                                         •   Upside: tightening supply with future retirements
    • 27 MWs of contracted solar (MI, WI)
                                                              • MISO Zone 7 PY ‘20/’21 auction cleared at CONE
    • 64 MWs of contracted biomass (MI, NC)
                                                              • Michigan Supreme Court Local Clearing
    • 105 MWs of contracted wind (OH)
                                                                 Requirement ruling

                              . . . with an emphasis on clean energy and risk mitigation.                          5
Environmental, Social & Governance - October 2021
Building on Our Past . . .
 Sustainability has been part of our      …And is critical to leading the
 culture over the past 135 years…         clean energy transformation.

                    Founded by the
                    Foote brothers 1886

                                               . . . for a cleaner tomorrow.   6
Environmental, Social & Governance - October 2021
Our Track Record for Sustainability . . .

                   DOUBLE A RATED                                                            TOP QUARTILE FOR GLOBAL UTILITIES
            #1 company in                                             Named a Top U.S. utility                              Named 2020 Gold-Level Veteran
            Michigan and Top 20                                       for economic development by                           Friendly Employer by the Michigan
            Best Employers for Women                                  Business Facilities and                               Veterans Affairs Agency (MVAA)
            2021 by Forbes® Magazine                                  Site Selection magazines

            #1 utility company for                                   Economic Development
                                                                                                                            And Best for Vets 2020, Military
            Best Employers for Diversity                                                         >485 MWa                   Times
            2021 by Forbes® Magazine

                                                                                     Attracted >485 MW of
            Top scored (80/100) in the                                                 new or expanding                     Awarded Diversity-focused
                                                                                    businesses to our service
            Disability Equality Index                                                 territory since 2015
                                                                                                                            Company Award, CORP!
                                                                                                                            Magazine
                                                                     2016   2017   2018   2019    2020    2021

Presentation endnotes are included at the end of the presentation.

                                                                                                                . . . is recognized nationwide.                 7
Environmental, Social & Governance - October 2021
ESG Disclosures . . .
                           •   CMS Energy & Consumers Energy        •   DE&I Website
                               Websites
                                                                    •   SASB Index (Electric Utilities & Power
                           •   SEC Filings (10-K & Proxy)               Generation)

                           •   2020 Carbon Disclosure Project       •   SASB Index (Gas Utilities & Distributors)
                                • Report Scope 1, 2 & 3 Emissions
                                • Water                             •   TCFD Index

                           •   Climate Assessment Report            •   UNSDG Index
                                • Considers TCFD Guidelines
                                                                    •   Civic & Political Engagement

. . . are transparent and aligned with SASB, TCFD and CDP reporting frameworks.                                     8
Environmental, Social & Governance - October 2021
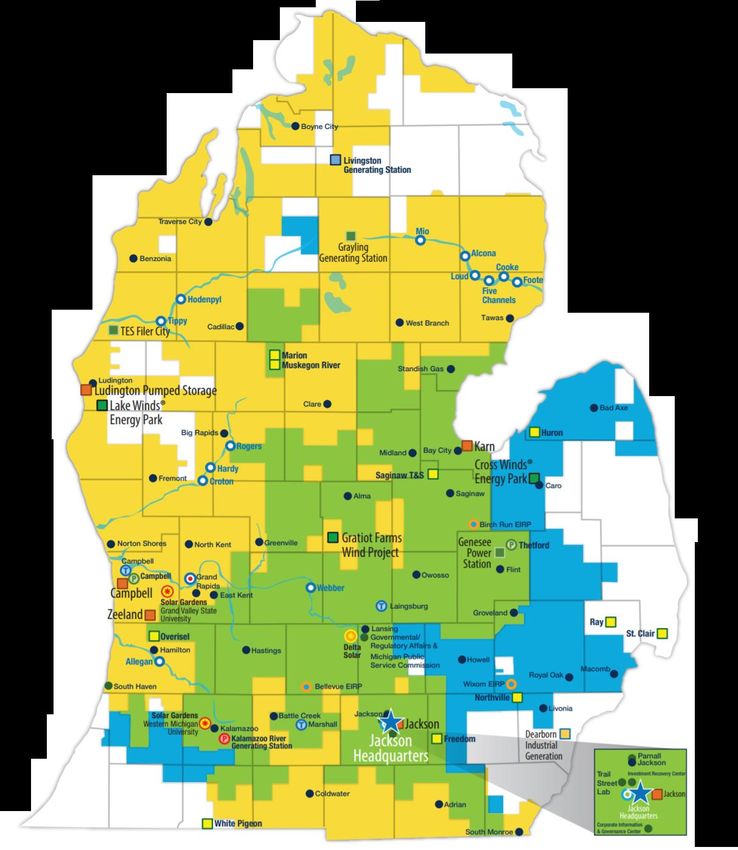
A Simple Investment Thesis . . .

                                                               Industry-leading clean energy commitment
                                                                                                                  a
                                                               Net Zero Carbon (2040) & Net Zero Methane (2030)

                                                                   Excellence through the

                                                                      Top-tier regulatory jurisdictionb

                                                                     Premium total shareholder return
           Nearly two decades of industry-leading
                                                               6% to 8% adjusted EPS growth + ~3% dividend yield
                   financial performance

Presentation endnotes are included after the appendix.

                                                         . . . becoming simpler, cleaner and leaner.                  9
Environmental, Social & Governance - October 2021
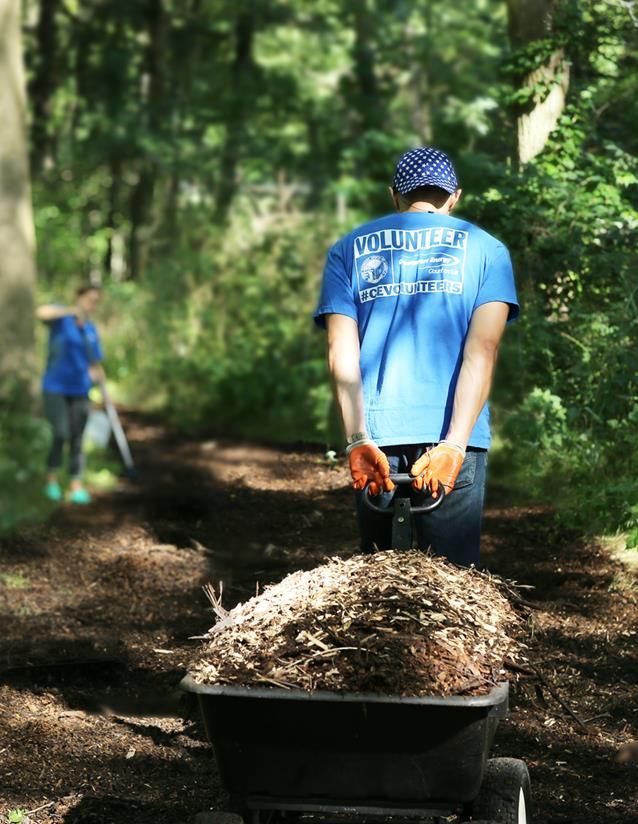
2021 Integrated Resource Plan (IRP) . . .
                        Key Outcomes
                   Retires ALL coal by 2025
                     (depreciated over design life)

   Adds >$1 Bn of rate base over next 5 years
                      (>95% utility earnings by 2025)

               Accelerates decarbonization
            (~60% carbon emissions reduction by 2025 a)

  Increases renewable resource deployment
                         (~8 GW of solar by 2040)

Ensures reliability, resilience and affordability
                   (~$650 MM in customer savingsb)

Presentation endnotes are included after the appendix.

                                                         . . . provides proof points to our investment thesis.   10
Infrastructure Renewal . . .
                       Electric
                     distribution                                             Exiting coal by 2025 and
                      system is                                              adding 8 GW of solar by 2040
                    older than
                         peers

                                                                                          25 years of
                                                                                       main replacement
                                                           Largest electric                  through our
                                                                                   a
                                                         distribution system in U.S.   Enhanced Infrastructure
                                                                                        Replacement Program
Presentation endnotes are included after the appendix.

                                                               . . . requires significant customer investment.   11
Top-Tier Michigan Regulatory Environment . . .
         Legislative                                       Strong                       Top Tier
         Framework                                       Leadership             Regulatory Environmenta
Timely investment recovery                                                                        Michigan
 − Forward-looking test years                                               1           7        2013-present
 − 10-month rate cases

                                                                            2               9

Supportive Incentives
 −    Constructive ROEs                                                     3                             18
 −    10.7% ROE for RPS
 −    EE incentive (~$45 MM/yr)
 −    FCM adder on PPAs                                                     4               10

                                                                            5           7
Appointed Commissioners

Presentation endnotes are included after the appendix.

                                                                . . . aligns incentives for all stakeholders.   12
Our Entire Cost Structure . . .
                     Cost Components                              Estimated Cost Savings
100%
                                                         Year     Event                        Savings

                             Fuel and Power Costs        2022    Palisades retirement          $90 MM

                                                         2023    Karn 1&2 coal unit              $30 MM
   ~70%                                                                                       b
Non-capital                                                      retirements (adj. O&M savings )
  related
                                     O&M Costs           2025    MCV contract change          >$60 MM

                                          Taxes          2025    Campbell coal unit             > $60 MM
                                                                                              b
                                                                 retirements (adj. O&M savings )
                              Capital Investments

                                  Cost of Capital        >$200 MM identified future cost savings
 0%
  CE residential utility bill as % of wallet at ~3%a
    (down 100 bps from 2007 while investing ~$19 Bn)            PLUS             PRODUCTIVITY
Presentation endnotes are included after the appendix.

        . . . offers cost reduction opportunities to maintain customer affordability.                      13
Credit Metrics Maintained . . .
Consumers Energy                 S&P       Moody’s       Fitch           Ratings Drivers
Senior Secured
                                                                     •   Strong financial
                                  A           A1          A+
                                                                         position
Commercial Paper                 A-2          P-2         F-2
                                                                     •   Growing operating
Outlook                         Stable      Stable       Stable          cash flow

CMS Energy                                                           •   Return on regulated
                                                                         investment
Senior Unsecured                 BBB         Baa2         BBB

Junior Subordinated              .
                                 BBB-        Baa3         BB+        •   Supportive
                                                                         regulatory
Outlook                         Stable      Stable       Stable          environment

                 Last Review   Jun. 2021   May. 2021   Dec. 2020

                                                     . . . at solid investment-grade levels. 14
Diverse Service Territory . . .
                                                              Economic Indicatorsa
 “Governor Gretchen Whitmer announces
  leading storage products manufacturer
Speedrack Products creating 164 new jobs
in West Michigan...investment of $64.5 MM”                                    Grand
    – Michigan Economic Development                                           Rapids     MI     U.S.
      Corporation (MEDC), June 2021                      Building Permitsb     211%     190%    184%

 Global auto supplier Hilite International               Population Growth      8.8%     0.8%    6.7%
 expanding in Whitehall – expansion will                 2010→2020
  create 108 jobs, generate $9.6 MM in                   Unemploymentc          4.2%     4.8%    5.4%
  private investment in West Michigan
  – Michigan Economic Development
   Corporation (MEDC), October 2020
                                                                “SK Siltron investing $302 MM in Michigan
   “Gerber Products will be investing                          Semiconductor Wafer Plant – in support of
  $36 MM and creating approximately                            electric vehicle growth, the semiconductor
           50 additional jobs”                                  wafer manufacturing and R&D facility will
   - The Right Place, September 2020                             bring 150 jobs to Monitor Township, MI”
                                                                     – Business Facilities, August 2021

“FedEx distribution to bring more than                              “Graphic Packaging plans
700 jobs to Portage…$25 MM project”                             $600 MM expansion in Kalamazoo”
       - MLive, November 2019                                        - MiBiz, September 2019

Presentation endnotes are included after the appendix.

        . . . supports Michigan’s growth aided by economic development efforts. 15
Sustainability Track Record & Trading Performance . . .
                   Stock Performancea                                                       Total Shareowner Returnb

300%            CMS                                                                  CMS
                UTY                                                                  UTY
250%            S&P                                                                  S&P
                                                                            228%
200%                                                                        199%                                358%

150%

100%                                                                                               95%
                                                                            95%

50%
                                                                                   40%

 0%

-50%
       '10   '11    '12   '13    '14    '15    '16       '17   '18   '19   '20             3-yr          5-yr          10-yr

Presentation endnotes are included after the appendix.

                          . . . make CMS an attractive investment for ESG focused investors.                                   16
ENVIRONMENTAL
Electric and Gas Decarbonization . . .
                                                                        Actionable Clean Energy Targets
                                                         •   Michigan’s largest energy provider – providing critical services while
                                                             delivering on our decarbonization goals:
                                                             •   Net zero carbon emissions by 2040 company-widea
                                                                  • Includes scopes 1, 2 and certain 3 (including purchased power)
                                                                  • Supported by our Integrated Resource Plan (IRP) filed in June 2021
                                                                      • Exit coal by 2025
                                                                      • Add 8 GW of solar, 2 GW of demand-side resources & 475 MW
                                                                        of battery by 2040

                                                             •   Net zero methane emissions by 2030 for our gas distribution system a
                                                                  • Robust Energy Efficiency Programs to reduce usage ~1%/year
                                                                  • Net zero goals driven by main and service replacements
                                                                      • Improves safety, reduces costs and supports future clean fuels
                                                                        (hydrogen, RNG)
                                                                  • Natural gas is a reliable and critical resource to serve residential
                                                                    heating
                                                                  • Partnering with the Low-Carbon Resources Initiative and industry
                                                                    experts

Presentation endnotes are included after the appendix.

                                                                                    . . . is key to our long-term success.                 18
Proposed IRP Objectives . . .
                      Key Objectives                        Current Plan           2021 IRP
                                                                                                  ~(60)% carbon
• Accelerates Decarbonization                                  Exit coal            Exit coal        emissions
                                                               by 2040              by 2025         reduction
                                Retire                                                               by 2025a
                                Karn 3&4 (oil)                    2031                2023
                                Campbell 1&2 / Campbell 3       2031/2039             2025

                                                                No new          Purchase >2 GW
• Ensures Reliability, Resilience
                                                             dispatchable        of existing gas ~$650 MM in
  & Affordability
                                                                 units                units       customer
                                                                                                         b
                                                                                                    savings

• Increases Renewables &                                    ~6 GW of solar       ~8 GW of solar
  Customer Programs                                           1.1 GW EE            1.1 GW EE

                                                                                Regulatory asset
                                                            Securitization of
• Maintains Strong Balance Sheet                                                 treatment for
                                                              retired units
                                                                                  retired units
Presentation endnotes are included after the appendix.

                                  . . . provide near-term action to deliver on our net-zero goals.                19
Net Zero Carbon Emissions by 2040 . . .
                               Coal Retirements                                                       Key Benefits
                 Carbon                                                                • Reduces carbon emissions ~60%a by 2025
                 Emission      ~(33)%      ~(40)%           ~(60)%      (100)%
                 Reductiona
                   2.7           0.9                                                   • Exceeds scientific targets / policy goals
                                                                       Additional
                                                                     decarb efforts:
                                                                                         (1.5° and 2° scenarios)
                                                                                                       10%
                                                                       • CCS
Capacity in GW

                                                                       • H2
                                            0.5                        • Storage       • Enhances commitment to net zero by 2040

                                                             1.3
                                                                                       • Reduces adjusted O&M by >$90 MMb
                                                      Exit Coal
                                                                                       • Improves operational flexibility
                                                                     Net Zero

                 Legacy       Classic 7   Karn 1&2 Campbell           By 2040
                  Coal          2016        2023      1-3
                                                     2025
   Presentation endnotes are included after the appendix.

                 . . . supported by our IRP and the exit of coal 15 years earlier than planned.                                      20
Exiting Coal Completely by 2025 . . .
                 Coal % of Rate Basea                                       Growing Utility Renewables
                                                                                                      b
       20%              2016                                                          (Estimated % EPS )          8 GW of
                      Classic 7                                                                                  investment
                     retirement                                                                                  opportunity
                                                                                                                    PLUS
                                                                                                              Incentives on PPAs
                                              2023                                                              and Demand
Increasing Renewables & Customer Programs . . .
   2018 IRP        2021 IRP               Future IRP                         Key Benefits
✓Capex approved
  50% PPA / 50%
                  Filed for approval
                     of first 3 years
                                        Long-term alignment,
                                        approval in future IRP   •   Modular build-out; riding the cost-
     owned           >50% owned                                      curve down
                                            Opportunity
                                            +1,500 MW            •   Total of ~8 GW of solar by 2040
                    Proposing
     Executing      +1,200 MW
                                                                 •   >50% carbon free energy by 2031
     1,100 MW
                                                                 •   90% clean energy resources by
                                                                     2040
                                                                 •   Growing customer programs
                                                                     − ~1.1 GW EE
                                                                                        Earns incentives
                                                                     − ~750 MW DR           above
                                                                                        authorized ROE
                                                                     − >100 MW CVR
                                                                     − 475 MW battery
    2022 - 2024     2025 - 2027              2028 - 2030

                                   . . . help achieve >50% carbon free energy by 2031.                     22
Our Clean Energy Transformation . . .
                                                                 Capacity Mixa

              12%                                                      15%                     15%               15%
              8%
                                                                       10%                     10%               12%
              8%
              11%                                                                                                10%
                                 • Exits coal by 2025                                          28%
                                                                       40%
                                 • Ensures reliability,
              31%                  resilience and
                                   affordability
                                 • >3x renewable                                                                  63%
                                                                                                                 63%
              11%                  energy capacity                                             47%
                                                                       35%
              19%

            Today                                                      2025                    2030              2040

            Coal          Renewables               Natural Gas     Storage    Peaking Plants     Nuclear   Customer Programs
Presentation endnotes are included after the appendix.

                                                         . . . results in 90% clean energy resources by 2040.                  23
a
Our Energy Supply Will Be Cleaner . . .
                            Current Mix                                              Future Mix (2031)
          Customer                                                    >50%         (Post-MCV PPA Expiration)
          Programs                                                 Carbon free                             Future
             2%
                                                                                                         opportunities
                 Wind,
  Storage       Hydro &
     3%                                                                               Customer
                 other                                                    Wind,       Programs
                  10%                                                    Hydro &         17%
                                                                          other
                                                                           10%
                                                         Natural                                        Natural
                                                          Gas                                            Gas 46%
             Nuclear                                      39%                                            42%
              19%
                                                                         Storage
                                                                            2%

     Net                                                                              Solar
   Market                                                                              25%
  Purchases                          Coal
     4%                              23%                                                                     Net
                                                                                                           Market
                                                                                                          Purchases
                                                                                                             4%
Presentation endnotes are included after the appendix.

                              . . . and more reliable with further opportunities to decarbonize.                         24
Providing a Just Transition . . .
         We Have Done This Before                                                  Proof Points
•   Retired seven coal units in 2016 with Karn 1&2 scheduled   ✓ Hampton Township
    to retire in 2023                                             ✓ Completed environmental abatement,
                                                                    dismantlement and demolition of the former
•   Caring for our co-workers and working to redevelop our          Weadock Plant
    communities                                                   ✓ Created 15 acres of new habitat for bees, butterflies
     • Retention incentive and placement plans for                  and other pollinators at the site
        employees
     • Working with communities to transition local            ✓ Muskegon
        economies                                                ✓ Redeveloped the former Cobb Plant as part of a
                                                                    broader vision to restore the natural habitat and
                                                                    revitalize the local economy

                                                               ✓ Luna Pier
                                                                  ✓ Former Whiting Plant has been prepared for
                                                                     redevelopment and marketed for new uses

                                                               New roles were found for co-workers who wanted to
                                                               stay with the company and local community leaders
                                                                 were aided in pursuit of new economic possibilities

                      . . . as we care for our co-workers, customers and communities.                                       25
Decarbonization of Gas Infrastructure . . .
    Net zero methane by 2030...                 …with additional opportunities.
• ~250 miles/yr main                         • Largest LDC underground storage in U.S.
  replacement                                  (309 Bcf)
                               ~$400 MM/yr       • 15 gas storage fields, 8 compressor
• ~14½K/yr vintage service        in leak
                                reduction
                                                   stations and 167K horsepower
  replacement
                                             • ~13K miles of steel mains → plastic
• ~0.3 Bcf of RNG as offset                    (hydrogen blending/substitution)

• 1% energy efficiency ($61 MM/yr)           • Expand use of RNG and hydrogen
   • Pre-tax incentive ~$14 MM/yr

                       . . . provides near- and long-term investment opportunities.      26
a
Net Zero Methane Emissions by 2030 . . .
    Careful Planning to Reach Goals                                                         Methane Emissionsa
• Accelerating Vintage Service Replacement                                                       (Gas Delivery System)
  and 25-year EIRP for completion by 2030
                                                                                         2018                   2025        2030
• Continued energy efficiency of up to 1%                                              VSR  b
                                                                                                           Continued          Asset
                                                                                       (17)%
                                                                                         EIRP                 b
                                                                                                           VSR & EIRP     retirements

                                                         Methane Emissions Reduction
• Retirement or replacement and                                                                             Damage
                                                                                                                         & enhanced
                                                                                                                              wells
  enhancement of existing wells                                                                            prevention
                                                                                                                         Accelerated
• In discussions with EPRI and utilities across the                                                            ~ (40)%   compressor
                                                                                                                         engine rod
  world to study the expansion of RNG and                                                                                  packing
  hydrogen

• Focus on cleaner gas options vs.
                                                                                       With Potential Offset
  electrification given Michigan’s cold                                                Renewable natural gas
  weather, cost to customers and inefficient                                                (~0.3 Bcf)
  electric heating for temperatures below
  freezing
                                                                                                                         Net Zero
Presentation endnotes are included after the appendix.

       . . . reducing leaks, enhancing energy efficiency and using cleaner fuels.                                                       27
Natural Gas is Critical . . .
              Michigan’s weather and size…                              …make electrification challenging.
                    (Population of 10 Coldest Statesa)                                      CE Electric Peak Capacity
~10 MM
                                                                                            Summer           Winter
                                          Avg. Winter Weathera
                                              (Fahrenheit)
                                           MI           23°                         Today                       3x
                                                                                                             annual
                                           CA           45°                                                   load
                                           TX           49°                  1 Bcf = ~300 GWh
                                           London       37°
 Consumers Energy
 6.7 MM residents

                                                                                    b   ~33,000 GWhb
                                                                         ~225 Bcf

     MI             WI   MN   NH   ME      MT       SD   ND   VT   WY     Natural            Electric         Total
                                                                         Gas Usage          Demand        Electrification
Presentation endnotes are included after the appendix.

                                           . . . for reliable and affordable home heating in Michigan.                      28
Land & Water Usage . . .
    Total Landfill                              Water                                   5-yr
   Space Avoided                               Intensity                            Planet Goals
          (Total Tons)                         (Gal/MWh)                               (2018-2022)
                                                                                            Target        Completed
                         1,518,679    32,102
                                                                      H2O saved (gallons)    1 Bn              >1 Bn

                                                            22,202    Michigan land
                                                                                            5,000             >5,000
                                                                      enhanced (acres)

                                                                      Reduction of Waste
530,338                                                               to Landfills           35%               >50%
                                                                      (percentage)

  >2.5x more landfill saved          (31)% reduction in water usage

                                                                                                     All planet goals
1992 -       2015         2020        2012       2015       2020                                    achieved ahead
 2014                                                                                                     of plan!

                                                            . . . has been dramatically reduced.                        29
Energy Waste Reduction Programs . . .
                     Energy Efficiency Programs                                                    Electric
    ✓ $3.9 Bn saved for customers on their energy bills since 2009                   •   >2% annually

                                                                                     •   Next 5 years:
    ✓ 5,000 GWh of reduced usage since 2009
                                                                   Equivalent to          • Spend ~$191 MM/yr
                                                                 ~1 power plant!
                                                                                 a        • Pre-tax incentive ~$38MM/yr
    ✓ >20K appliances recycled each year
                                                                                                        Gas
    ✓ >80K residential rebates provided each year
                                                                                     •   1% annually

    ✓ ~9K in-home audits and 1K virtual audits completed each                        •   Next 5 years:
      year                                                                                • Spend ~$81 MM/yr
                                                                                          • Pre-tax incentive ~$16 MM/yr
    ✓ >3 MM LEDs sold in stores across the state ever year
                                                $1 of spend is equal to ~$3 customer savings
                                   Received U.S. Environmental Protection Agency 2021 Energy Star®
                                           Partner of the Year Sustained Excellence Award
Presentation endnotes are included after the appendix.

             . . . are the cleanest source of energy and generate customer savings.                                        30
EV Programs . . .
                    PowerMIDrive
•   $10 MM, 3-yr program (began in 2019)
      • Offered ~800 rebates and incentives for home,
         business and public charging stations in the last two
         years
•   Makes EV savings simple by providing time of use rates as                   • 30 fast charging stations
    an incentive to charge off-peak                                               installed, with plans for 7
                                                                                  more by the end of 2021
•   >2,000 chargers at homes and businesses by 2024
                                                                                • Spanning over 250 miles
                    PowerMIFleet                                                •
SOCIAL
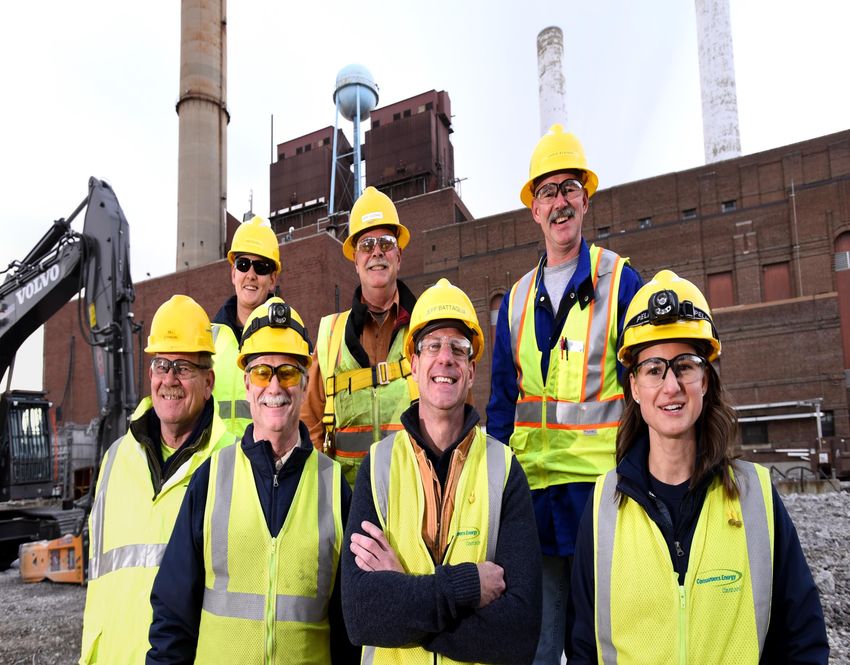
Our Values Drive Our Actions . . .

                             •   Focusing on employee and customer safety
                                  • Physical
                                  • Cyber
                                  • Emotional
                                  • Financial
                             •   Embedding diversity, equity and inclusion (DEI) in
                                 everything we do
                                  • Our culture, the workplace and within our supply chain
                             •   Developing our workforce
                                  • Electric and gas training programs
                                  • Working with grades K-12, local colleges and universities
                                    to build interest in the utility industry
                             •   Providing community and customer support
                                  • Corporate giving
                                  • Economic development
                                  • Customer satisfaction

           . . . for our co-workers, customers and communities we serve.                        33
Focusing on
Employee and
Customer Safety

                  34
Committed to Safety . . .
                                                                  Safety Performance
                                                                    (Recordable Safety
                                                                        Incidents)
                                                                                      Linked to
                                                                     355             employee
                                                                                     incentives

                                                                            Down
                                                                            (72)%

                                                                                    101
• A safety culture established in partnership with our union
• Employee driven safety teams at every office and in the field
• Safety performance included in executive and employee              2008           2020
  compensation

                                          . . . every second of every hour of every day.          35
CMS Employee Wellness Programs . . .
          Program Focus & Approach
Physical
   • Paid leave for 6 months for maternal birth parent
     and 4 months paid leave for paternal or non-birth
     parent
   • Promote annual health visits and group physical
     activities
Emotional
   • Celebration of mental health awareness month
   • Helping lead efforts to add gender identity and
     sexual orientation to the list of protected classes
     under the state’s Elliott-Larsen Civil Rights Act
Financial
                                                                          Employee participation in wellness programs
                                                         a
   • Company contribution of up to 11%                                       incentivized with Amazon gift cards
                                                                b
   • 72% of active 401K participants are saving ≥15%

Presentation endnotes are included after the appendix.

                                                    . . . focus on physical, emotional and financial health.            36
Cyber and Physical Security Program . . .
        Program Focus & Approach
•   Physical and cyber security are integrated
                                                                    Robust corporate governance of security
•   Protect critical infrastructure, customer data and
                                                            •   Board oversight of safety programs
    employee safety
                                                            •   Company-wide phishing tests & department updates
•   Focus more stringent security on most critical assets
                                                            •   2 Board members with security experience
•   Security assessed in all initiatives
                                                                         Myrna Soto
•   Teams focused on detecting and responding to                         20 years of IT
    threats with close coordination with state and                       & security experience
    federal partners
Embedding DE&I in
Everything We Do

                    38
DE&I is Embedded in Our Company Culture . . .
                                                                  Diversity by the Numbers
                                                                                                      PoC
                                                                             Female                   27%
                                                      Board of                 36%
                              Unconscious bias        Directors       Male                    White
                                                                      64%                     73%
                                training for all
                               leaders by 2021
                                 and 100% of
                              workforce by 2022
                                                                                                      PoC
                                                                             Female
                                                                                                      23%
                                                      Executive                33%

Garrick Rochow, President & CEO                       Leadership      Male                    White
                                                                      67%                     77%
“I stand for a diverse workforce where the ideas of
all are heard and valued. Where everyone feels
they belong. Where we practice respect, listen, and
learn. Everyone has a unique background,
                                                      The company and our foundation donated $1.2 MM
perspective, and diverse views, that’s what makes
this team able to deliver on our purpose for the       in 2019 and 2020 to diverse associations impacting
people of Michigan.”                                                 communities of color

          . . . for the betterment of our co-workers, customers and communities.                            39
Our Employee Resource Groups . . .
    Women’s
    Advisory Panel   Supports the retention, development and success of women at our company.
    (WAP)
    Minority
                     Promotes a culture of diversity and inclusion among all racial and ethnic minorities
    Advisory Panel
                     through education, leadership, development and networking.                              20% of employees
    (MAP)
                                                                                                              belong to one or
    Women’s                                                                                                 more of 7 employee
                     Empowers women in Science, Technology, Engineering and Math (STEM) while
    Engineering                                                                                               resource groups
                     building capabilities to support company objectives.
    Network (WEN)
    Veteran’s
                     Provides support to former active military personnel and assists in recruiting and
    Advisory Panel
                     retaining veterans through career development.
    (VAP)
    Pride Alliance   Makes our company a great place to work by promoting an inclusive
    of Consumers     environment that is safe, supportive and respectful for lesbian, gay, bi-sexual &
    Energy (PACE)    transgender persons and allies.

                     Bridges the gap of learning, networking and mentoring across the generations of our
    GEN-ERGY
                     workforce.

                     Removes barriers – opening minds and creating pathways to meaningful work for
    capABLE
                     current and future co-workers of all abilities.

                     . . . enable us to provide a diverse and inclusive workspace.                                               40
Supplier Diversity Initiatives . . .
                                                                      Focus & Approach
                                                         •   Expanding diverse supplier network, validating
                                                             certification of diverse vendors and Enhanced
                                                             Tier II reporting for suppliers of our suppliers

                                                         •   Actively engaging with diverse-supplier
                                                             organizations nationally and in Michigan

                                                         •   Supporting and developing minority-, women-,
                                                             LGBTQ-, disability-, and veteran-owned
                                                             suppliers

                                                         •   Increasing competition, sparks innovation and
                                                             drives economic prosperity

                                                             Supports our plans to double our
                                                             spending with diverse suppliersa
Presentation endnotes are included after the appendix.

. . . foster relationships with diverse suppliers across all areas of our business.                             41
Developing
Our Workforce   42
Building the Next Generation . . .
            STEM & Robotics                     School-to-Work Program (STW)
• Hometown, statewide and national focus              (for electric line workers)
• Middle & high school education levels

• Partnered with Center for Energy Workforce   • Collaboration with community colleges
  Development (CEWD)
   • Energy industry fundamentals              • EMPOWER lineworker Pre-Apprenticeship
      curriculum                                 Program focuses on lineworker careers

                                                 . . . of our company’s co-workers.      43
Flint “Gas City” . . .

•   Training site is located in Flint, MI and provides a
    holistic experience and real world feel

•   Innovative new approach to training and
    career development

•   Educates and prepares gas operations
    co-workers for various scenarios such as
    constructing pipes in slippery or uneven terrain
    and more

•   Ensures our co-workers are better prepared,
    empowered, and confident in their abilities

•   Groundbreaking scheduled for October 2021

                                                 . . . demonstrates our hometown commitment.   44
Working with Our Communities . . .
              Gas Boot Camp                               Training Trust Agreement
• 3-week training including physical assessment                (with Power for America)
  and safety culture course                       • Delivers technical and safety training
• Successful candidates offered full-time         • >25,000 student hours delivered in 2021
  positions
                                                  • Expanding to include renewables training
• 256 veterans hired                                center

           Electric Boot Camp                       Utility Military Assistance Program
• 2-week training including electric lines        • Training programs for veterans and current
  orientation assessment                            National Guard members
• Successful candidates offered positions as      • Delivers trained employees for gas
  lineworker apprentices                            construction and electric distribution
• Piloted in 2021 with 25 veterans hired

                             . . . to strengthen our future electric and gas workforce.          45
Union Relationships at the Utility . . .
 Michigan State Utility Workers Council
                (MSUWC)                                            41%
• ~3,600 employees represent                                     unionized
  electric and gas workforce

• >250 employees represent
  call centers

• Subsidiary of Utility Workers Union of
  America (UWUA)

• Contracts through 2025

    . . . continue to remain strong and collaborative with renewed contracts.   46
Providing Community and
Customer Support
Continued Corporate Giving . . .
                             Charitable Organizationsa                     CE Foundation Donations

                                                                              In 2020, the CE Foundation
$140 MM                                                                     donated ~$9.7 MM to Michigan
                                                              >$130 MM            non-profits statewide
                                                              since 2009
      Cumulative Donations

                                                                           >50% of CE Foundation donations
                                                                             were in support of COVID relief
                                                                             including >$1.8 MM to provide
                                                                             basic needs assistance to low-
                                                                            income residents, senior citizens
                                                                                       and others

                                                                           >$2.4 MM to support female and
  $0 MM
                                                                              minority owned businesses
       2009                                                       2020
 Presentation endnotes are included after the appendix.

                                              . . . supports Michigan’s communities and fosters growth.         48
Signature Grants . . .
 ✓ $500,000 in Planet Awards   $200,000 to Huron Pines Resource Conservation & Development
                               Council in Gaylord, MI                                                                                   Plus
                               The Protect Wild Places Project will restore 5,000 acres of wildlife habitat and recreational
                               land, and 150 miles of waterways and Great Lakes shoreline across 17 counties through                    $500,000
                               online and in-person events and conservation efforts in partnership with community
                               leaders, schools, organizations and residents.                                                          in People
                                                                                                                                        Awards
                               $125,000 to Au Sable Institute in Mancelona, MI
                               The Good Things Grow Here Project will engage local schools and mobilize 3,600 K-12
                               students to complete 30 habitat restoration projects in Northern Michigan by 2024. Each                    AND
                               restoration project will install 1,000 native plants, for a total of 30,000 native plants installed
                               over the next three years in northern Michigan.
                               $100,000 to Southwest Michigan Land Conservancy in Kalamazoo, MI
                               The project will restore rich habitat on the 140-acre Armintrout-Milbocker Nature Preserve               $500,000
                               through invasive species management, creation of a holistic management plan, and                       in Prosperity
                               community access. The project will also lower pollution levels and increase filtration of                 Awards
                               waters that flow into the Kalamazoo River.

                               $75,000 to Bay Area Community Foundation in Bay City, MI                                              to be awarded
                               Funding will support the Lake Huron Forever Initiative’s nature-based solutions and                       in 2021
                               projects, community assessments, and training programs to advance water quality
                               protection and healthy, sustainable communities on Lake Huron.

                                                                                           . . . support the communities we serve.                    49
Our Expanding Community Engagement Team . . .

      21
Community Affairs
   Managers                                         >350
   Active                                       local community
                                               events are attended
in the community                                   each year

                                                    >100
                                                boards served on

                       . . . is uniquely positioned across the state.   50
Supporting Michigan’s Economic Development . . .
                 Recognized as a Leader                     New and Expanding Load

                        2021, 2020 & 2019 Top 20                     2021a      >485 MW
                                                                                              a

                        Utilities in Economic Development                        since 2015

                        - Site Selection Magazine
                                                                     2020

                        2020 Michigan Entrepreneur
                        Resilience Fund                              2019             2020
                        - Michigan Women Forward                                      >$2.7 Bn
                                                                               Michigan investment
                                                                     2018             AND
                                                                                     >4,200 jobs
                       2021, 2020, 2019 & 2018
                       Editor’s Choice Top Utility                   2017
                       - Business Facilities
                                                                     2016

Presentation endnotes are included after the appendix.

                       . . . through proactive targeting of new and expanding businesses.            51
J.D. Power Scores . . .
                     Residential                                   Business

                                                                                           818

                                          773                     780
                     757
                                                   Up                       Up
     Up                        Up                141 pts                  172 pts
   141 pts                   148 pts

                                                 639                          646
    616                       625

   2012          2020        2012         2020   2012         2020            2012         2020

          Electric                  Gas                Electric                      Gas

  . . . reflect our commitment to continuous improvement for our customers.                       52
GOVERNANCE
Exceptional Governance . . .

     11    Members

     91% Independent

       . . . led by an independent Chair and highly skilled, diverse Board.   54
Diverse, Engaged and Experienced Board . . .
                                Diversity                                                        Experience

         61               Average age                                        Senior Leadership

                                                                             Financing Accounting or Fin. Reporting
                                                                                                                                   100%

                                                                                                                                   100%
                                                    Compared to              Regulatory Environment & Governmental Affairs         100%

         36% Female
                                                     26% for the
                                                      S&P 500a               Risk Management                           82%

                                                              Compared to    Customer Experience                       82%
                                                               19% for the
                                                                S&P 500a     Info. Tech. / Safety & Security     73%

         27% People of color                                                 Utility Mgmt        36%

                                                                             Strategic Planning / Governance                       100%

                                                                             Sustainability & Environmental                  91%

         45% Gender, racial &                                                HR & Executive Compensation               82%

                          ethnic diversity                                   Lean                         55%

Presentation endnotes are included after the appendix.

                                                                      . . . enhances the quality of governance.                           55
Committee Membership Makeup . . .
                                                          Political contributions
                                                                >$10K need
 Member               100%
                                                             Board approval
 Chairperson       Independent                                            Governance,
                              Compensation &                              Sustainability, &
Name                Audit     Human Resources Executive   Finance       Public Responsibility
Jon E. Barfield
                                                                                  
Deborah H. Butler
                                                           
Kurt L. Darrow
                                                                                  
William D. Harvey                                
John G. Russell
                                                 
Suzanne F. Shank
                                                           
Myrna M. Soto
                                                                                   
John G. Sznewajs                                          
Ronald J. Tanski                                           
Laura H. Wright
                                                          
                                  . . . is focused on key strengths of Board member.            56
Committee Responsibilities
                              •   Oversees:
Audit                             Integrity of financial statements & information
                                  Compliance with legal & regulatory requirements
                                  Risk management policies, controls & exposures
                              •   Reviews:
                                  Performance of internal audit function

Compensation &                •   Review & Approve:
                                  Executive compensation structure & policies
Human Resources                   Grant stock & other stock-based awards
                                  Financial & business goals
                                  Officer stock ownership policy

Executive                     •   Exercise Power & Authority of the Board:
                                  During the intervals between Board meetings

                                  Review:
Finance                       •
                                  Financing & investment plans & policies
                                  Potential project investments & monitor progress
                              •   Approve:
                                  Short & Long-term financing plans
                                  Financial policies relating to cash flow, capex & dividends

Governance,                   •   Review:
                                  Political & charitable contributions
Sustainability, &                 Stakeholder outreach, stewardship & corporate social
Public Responsibility             responsibility & sustainability matters
                                  Operation & performance of Board & Committees
                        Enter “so what” if necessary – Century Gothic, Bold, Size 18 or smaller

                                                                                                   57
                                                                                                  57
CEO Compensation . . .
      Compensation Mix for CEO                                      2021 Operational Goals
                                                                   • Customer Experience Index (CXi)
                                                                   • Generation Customer Value
                                                  12%
                                                tenure-            • Employee Safety

                                                          PEOPLE
                                                 based
                Annual
               Incentive
                                                                   • Eliminate Vintage Services

                22%          Long-term                             • Distribution Reliability
                             Incentive
                                                                   • Employee Empowerment Index
 Based on
               Base            48%
EPS (70%) &                (Based on relative                      • Gas Flow Deliverability
OCF (30%)     Salary          TSR & LTI EPS

              30%            performance)
                                                                   • Trash to Landfill

                                                          PLANET
                                                                   • Demand Response

                                                                                 PROFIT

                                                                   . . . is 70% performance-based.     58
Board Carefully Considers Risks . . .
           Risks                                 Mitigation Efforts
                              • Participation in legislative and regulatory policy
Regulatory Environment          development

Climate                       • Retired 7 coal plants with plans to retire remaining 5 plants in
 Carbon Emissions               fleet by 2025
 (Regulation)                 • Energy Efficiency, Demand Response, and Renewable
                                Energy Programs
Severe Weather                • Increased investment in infrastructure and smart electric
(Ice, Thunder, Snow)            systems

 Water Levels                 • Monitor lake levels at generation plants

 Natural Disasters            • Geographically located in low-risk area

Economic Conditions           • Targeted efforts via donations to reduce uncollectible
                                accounts
                              • Helped local businesses navigate federal and state assistance
                                programs throughout COVID-19 pandemic

                         . . . and takes proactive actions to mitigate those risks.                59
Political Giving . . .
           Political Giving Focus                                      Enhanced Disclosures
•   Meeting Michigan’s energy needs                         •   Publishing annually on the company’s website:
                                                                 • Expenditures made to influence the outcome
•   Helping the state’s communities thrive                         of ballot initiatives
•   Providing safe, reliable, affordable and increasingly        • Direct corporate contributions to an entity
    clean energy-related services                                  organized under Section 527 and Section
                                                                   501(c)(4) of the Internal Revenue Code, and
                                                                   non-deductible portion of trade association
                                                                   and other organization dues when annual
                                                                   contributions or mandatory membership dues
                                                                   are >$25K

                                                            •   All corporate political contributions come from
                                                                general funds and are not recovered in customer
                                                                rates

                                                            •   The Board of Directors oversees political
                                                                engagement policies, programs and practices

                                  . . . is focused on critical company and industry issues.                       60
Endnotes
           61
           61
Presentation Endnotes (pg 1 of 2)
       a                                  b                          c                                            d
Slide 3: Reflects continuing operations   Excludes seasonal workers Adjusted (non-GAAP), includes EnerBank         Adjusted (non-GAAP) CAGR, includes
EnerBank
       a
Slide 4: Methane emissions from our natural gas delivery system and carbon emissions company-wide
       a
Slide 7: New or expanding load since 2015
       a                                                                                                 b
Slide 9: Methane emissions from our natural gas delivery system and carbon emissions company-wide         UBS Research, 2021 state rankings and D.C.
           a                                                                                                          b
Slide 10: From 2005 baseline including utility-owned generation, PPAs and MISO purchases, post-coal retirement        2021 IRP vs. current plan savings
           a
Slide 11: $1.3K of distribution assets per customer, Source: FERC Form 1, Largest electric regulated utility by customers, includes above ground electric
distribution assets
           a
Slide 12: UBS Research, 2021 state rankings and D.C.
           a                                                                                                                          b
Slide 13: 2019 Consumers Energy bill as % of Michigan household income, in current dollars. Source: Fred.stlouisfed.org, Bls.gov       Excludes potential fuel
savings
           a                                     b                                                           c
Slide 15: Source: bea.gov, census.gov, bls.gov    Annualized numbers August 2010 through August 2021         July 2021 seasonally adjusted unemployment
           a                                                    b
Slide 16: 10-year stock performance as of December 31, 2020      Dividends reinvested as of December 31, 2020
           a
Slide 18: Methane emissions from our natural gas delivery system and carbon emissions company-wide
           a                                                                                                          b
Slide 19: From 2005 baseline including utility-owned generation, PPAs and MISO purchases, post coal retirements           2021 IRP vs. current plan savings
           a                                                                                                          b
Slide 20: From 2005 baseline including utility-owned generation, PPAs and MISO purchases, post coal retirements           Including Karn 1&2, Karn 3&4 and
Campbell 1-3, excluding potential fuel savings

                                                                                                                                                                 62
                                                                                                                                                                 62
Presentation Endnotes (pg 2 of 2)
        a                                                                                         b                       c
Slide 21: Coal rate base based on calendar year; total rate base based on a 13-month average Adjusted (non-GAAP) Includes wind, solar, hydro and
energy efficiency; 2008: (~$100 MM hydro rate base x 10.7% ROE x 42.1% equity ratio) ÷ 235 MM O/S ÷ $1.21 EPS = ~1½%; 2015: [(~$500 MM RPS renewables
rate base x 10.7% ROE x 41.1% equity ratio ) + (~$285 MM hydro rate base x 10.3% ROE x 42.3% equity ratio) + $13 MM tax-effected energy efficiency] ÷
276.5 MM O/S ÷ $1.89 EPS = ~9%; Today/2020: [(~$1 Bn RPS renewables rate base x 10.7% ROE x 40.2% equity ratio ) + (~$400 MM hydro rate base x 10.0%
ROE x 42.2% equity ratio) + $31 MM tax-effected energy efficiency] ÷ 286.5 MM O/S ÷ $2.67 EPS = ~12%; includes original guidance and discontinues
operations from EnerBank
        a
Slide 23: Utility-owned and PPAs
        a
Slide 24: Utility-owned, PPAs and MISO market purchases
        a                                                                     b
Slide 27: Methane emissions from our natural gas delivery system since 2012   Vintage service replacement
        a
Slide 28: Source: London metoffice.gov.uk Heathrow weather station, US NOAA.gov, average winter (Dec-Jan) monthly temperatures 1990-2020,
                            b
Census.gov, 2019 population 5-yr average weather-normalized residential, commercial and industrial sales
        a
Slide 30: Assumes roughly 880 MW saved (5,000 GWh ÷ (65% efficiency rate x 8,760 annual hours) = 880 MW)
        a
Slide 36: Employer contribution of 5% to 7% for employees not covered by Pension Plan plus up to 4% employer match on 401(k) savings plan for all
            b
employees Includes employee and employer contributions as of June 30, 2021
        a
Slide 41: 5-year program ending 2023
        a
Slide 48: Includes contributions made by Consumers Energy, Consumers Energy employees and Consumers Energy Foundation
        a
Slide 51: As of August 31, 2021
        a
Slide 55: Spencer Stuart - Institutional Investor Focus 2020: Board Composition; people of color (PoC) universe includes top 200 publicly traded companies

                                                                                                                                                             63
                                                                                                                                                             63
CMS Energy provides historical financial results on both a reported (GAAP) and adjusted (non-GAAP) basis and provides forward-looking modeling on an adjusted basis. During an
oral presentation, references to “earnings” are on an adjusted basis. All references to net income refer to net income available to common stockholders and references to earnings
per share are on a diluted basis. Adjustments could include items such as discontinued operations, asset sales, impairments, restructuring costs, changes in accounting principles,
changes in federal tax policy, regulatory items from prior years, unrealized gains or losses, recognized in net income, from mark-to-market adjustments related to CMS Enterprises’
interest expense, or other items. Management views adjusted earnings as a key measure of the company’s present operating financial performance and uses adjusted earnings for
external communications with analysts and investors. Internally, the company uses adjusted earnings to measure and assess performance. Because the company is not able to
estimate the impact of specific line items, which have the potential to significantly impact, favorably or unfavorably, the company's reported earnings in future periods, the company
is not providing reported earnings guidance nor is it providing a reconciliation for the comparable future period earnings. The adjusted earnings should be considered supplemental
information to assist in understanding our business results, rather than as a substitute for the reported earnings.

                           GAAP Reconciliation
                                                                                                                                                                                          64
                                                                                                                                                                                         64
CMS ENERGY CORPORATION
                                                                                                                                      Earnings Per Share By Year GAAP Reconciliation
                                                                                                                                                        (Unaudited)

                                                                                                                                                                                                                                                                                                    GAAP        GAAP
                                                                                                                                                                                                                                                                                                  2020 over   2020 over
                                                                                                                                                                                                                                                                                                    2003        2019
                                                                               2003          2004          2005          2006         2007      2008        2009       2010       2011      2012       2013       2014       2015       2016       2017       2018        2019       2020          CAGR        Growth
Reported earnings (loss) per share - GAAP                                     ($0.30)       $0.64        ($0.44)       ($0.41)       ($1.02)   $1.20       $0.91      $1.28      $1.58     $1.42      $1.66      $1.74      $1.89      $1.98      $1.64       $2.32      $2.39      $2.64           NM         10.5%
Pretax items:
           Electric and gas utility                                             0.32         (0.60)            -             -        (0.06)    0.08        0.55       0.05           -     0.27            -          -          -     0.04           -            -     0.02       0.08
                 Tax impact                                                    (0.11)         0.21             -             -        (0.01)    (0.03)      (0.22)     (0.02)         -     (0.10)          -          -          -     (0.01)     0.12 (b)    0.01           (*)    (0.02)
           Enterprises                                                          0.93          0.97          0.06         (0.12)       1.67      (0.02)      0.14       (0.05)         *     (0.01)          *     0.05            *          *         *       0.02            *          *
                 Tax impact                                                    (0.19)        (0.35)        (0.02)        0.10         (0.42)         *      (0.05)     0.02       (0.11)         *         (*)    (0.02)         (*)        (*)    0.20 (b)   (0.02)          (*)    (0.01) (b)
           EnerBank                                                                 -            -             -             -            -          -           -          -         -          -          -          -          -          -         -            -          -          -
                 Tax impact                                                         -            -             -             -            -          -           -          -         -          -          -          -          -          -     0.01 (b)         *          -          -
           Corporate interest and other                                         0.25         (0.06)         0.06         0.45         0.17      0.01        0.01            *         -          *          *          *          *     0.02       0.01             *     0.11           (*)
                 Tax impact                                                    (0.09)         0.03         (0.02)        (0.18)       (0.49)    (0.03)          (*)        (*)    (0.01)        (*)        (*)        (*)        (*)    (0.01)     0.19 (b)        (*)    (0.03)     (0.02) (b)   Adjusted    Adjusted
           Discontinued operations (income) loss, net                          (0.16)         0.02         (0.07)        (0.03)       0.40          (*)     (0.08)     0.08       (0.01)    (0.03)          *         (*)        (*)         *         *           (*)         *          *       2020 over   2020 over
           Asset impairment charges                                                 -            -          2.80         1.07         0.93           -           -          -         -          -          -          -          -          -         -            -          -          -         2003        2019
                 Tax impact                                                         -            -         (0.98)        (0.31)       (0.33)         -           -          -         -          -          -          -          -          -         -            -          -          -        CAGR        Growth
           Cumulative accounting changes                                        0.25          0.02             -             -            -          -           -          -         -          -          -          -          -          -         -            -          -          -         7.3%        7.2%
                 Tax impact                                                    (0.09)        (0.01)            -             -            -          -           -          -         -          -          -          -          -          -         -            -          -          -
Adjusted earnings per share, including MTM - non-GAAP                          $0.81        $0.87         $1.39         $0.57        $0.84     $1.21 (a)   $1.26      $1.36      $1.45     $1.55      $1.66      $1.77      $1.89      $2.02      $2.17       $2.33      $2.49      $2.67
           Mark-to-market                                                                     0.04         (0.65)        0.80
                 Tax impact                                                                  (0.01)         0.22         (0.29)
Adjusted earnings per share, excluding MTM - non-GAAP                        NA             $0.90         $0.96         $1.08        NA        NA          NA         NA         NA        NA         NA         NA         NA         NA         NA          NA         NA         NA

         * Less than $0.01 per share.
       (a) $1.25 excluding discontinued Exeter operations and accounting changes related to convertible debt and restricted stock.
       (b) Reflects the impact of tax reform.

                                                                                                                                                                                                                                                                                                                 65
CMS ENERGY CORPORATION
                              Reconciliation of GAAP Net Income to Non-GAAP Adjusted Net Income
                                                          (Unaudited)
                                                                                                                            In Millions, Except Per Share Amounts
                                                                                                              Three Months Ended           Twelve Months Ended
                                                                                                             12/31/20     12/31/19        12/31/20       12/31/19

Net Income Available to Common Stockholders                                                              $        158      $      167       $       755      $       680
Reconciling items:
 Other exclusions from adjusted earnings                                                                            2               36               13                37
    Tax impact                                                                                                     (1)              (9)              (3)               (9)
 Tax reform                                                                                                         -                -               (9)                -
 Voluntary separation program                                                                                       *                -               11                 -
    Tax impact                                                                                                     (*)               -               (3)                -

Adjusted net income – non-GAAP                                                                           $        159      $      194       $       764      $       708

Average Common Shares Outstanding
 Basic                                                                                                          285.7            283.0            285.0            283.0
 Diluted                                                                                                        286.9            284.8            286.3            284.3

Basic Earnings Per Average Common Share
Reported net income per share                                                                            $       0.55      $      0.59      $      2.65      $       2.40
Reconciling items:
 Other exclusions from adjusted earnings                                                                         0.01             0.13             0.04              0.13
   Tax impact                                                                                                      (*)           (0.03)           (0.01)            (0.03)
 Tax reform                                                                                                         -                -            (0.03)                -
 Voluntary separation program                                                                                       *                -             0.04                 -
   Tax impact                                                                                                      (*)               -            (0.01)                -

Adjusted net income per share – non-GAAP                                                                 $       0.56      $      0.69      $      2.68      $       2.50

Diluted Earnings Per Average Common Share
Reported net income per share                                                                            $       0.55      $      0.58      $      2.64      $       2.39
Reconciling items:
 Other exclusions from adjusted earnings                                                                         0.01             0.13             0.04              0.13
    Tax impact                                                                                                     (*)           (0.03)           (0.01)            (0.03)
 Tax reform                                                                                                         -                -            (0.03)                -
 Voluntary separation program                                                                                       *                -             0.04                 -
    Tax impact                                                                                                     (*)               -            (0.01)                -

Adjusted net income per share – non-GAAP                                                                 $       0.56      $      0.68      $      2.67      $       2.49

* Less than $0.5 million or $0.01 per share.

Management views adjusted (non-Generally Accepted Accounting Principles) earnings as a key measure of the Company's present operating financial performance and
uses adjusted earnings for external communications with analysts and investors. Internally, the Company uses adjusted earnings to measure and assess performance.
Adjustments could include items such as discontinued operations, asset sales, impairments, restructuring costs, regulatory items from prior years, or other items detailed
in these summary financial statements. Adjusted earnings should be considered supplemental information to assist in understanding our business results, rather than as
a substitute for reported earnings.                                                                                                                                          66
You can also read