Corporate Presentation - A Premier Pure-Play Pipestone Montney Company - Pipestone Energy Corp
←
→
Page content transcription
If your browser does not render page correctly, please read the page content below
Corporate
Presentation

A Premier Pure-Play
Pipestone Montney Company

AUGUST 2020

Pipestone Energy Corp. Overview
Over 140 net Montney sections in the heart of the condensate fairway
Large Contiguous Undeveloped
Acreage Position in the Condensate-
Rich Montney
AB Super Rich Montney Trend
Keyer a
Keyera Pipes ton e
Pipestone
Tid ew ater
Pipes ton e PIPESTONE
$70 million Convertible Preferred
financing facilitates a resumption of
development activity in Q4 2020 Sem Cam s
Wapiti CNRL
Gold Cr k .
Keyera
Tidewater Wapiti
Pipestone KARR
PIPESTONE BILBO
Expected cash flow per fully diluted
share growth by >250% from 2020
– 2022 with convertible financing
KAKWA
Ample go-forward liquidity under the
Company’s $225 million RBL with
no re-determination until May 2021 SemCams CNRL
Wapiti Gold
Keyera Creek
Wapiti
Expected to Generate Top Decile
Corporate Returns on Capital
Employed
2
Private Placement Key Terms
Pipestone has entered into agreements providing for $70 million of
structured equity financing to execute an accelerated growth program
Issue Type Convertible Preferred Shares (“CP Shares”)
Gross issuance of $70 million based on a $1,000 per CP Share face value issued at $970 per CP Share
Financing Proceeds Net proceeds of ~$67 million after all estimated costs including fees payable pursuant to a backstop
arrangement with the Investors
Purchasers are subject to a 4 month hold period, under Canadian securities laws
Liquidity and Hold Period
CP Shares will not be listed
Fund Pipestone’s expanded capital program
Use of Proceeds
Initially and temporarily repay amounts outstanding under the first lien senior secured credit facility
Convertible into common shares at a conversion price of $0.85 per share, subject to customary adjustments
After two years CP Shares automatically convert if Pipestone’s common stock is trading at $1.70 or greater,
subject to certain conditions
Conversion Attributes
After five years, if not previously converted, the CP Shares will be redeemed for common shares of the
company at the conversion price, or if the shares are trading below the conversion price, at 95% of the
current share price
Voting CP Shareholders vote alongside common shareholders on an “as-converted” basis
6.5% annual dividend rate
Dividend
Payable quarterly in-kind; after two years, payable in-kind or in cash, at Pipestone’s election
The private placement will close upon receipt of the following shareholder approvals:
Two thirds of all shareholders that vote; and
Closing and Shareholder
The majority of shareholders that vote, excluding votes of related parties and their joint actors
Approval
The shareholder vote will be held at the AGM on September 14, 2020 at 2:30 PM at the Calgary
Petroleum Club (McMurray Room)
3
Private Placement Strategic Rationale
The proposed financing provides structured equity capital to accelerate
development and maximize returns
Highly Economic Drilling Inventory at Current Commodity Prices
The Company has reduced drilling and completion costs by approximately 40% since early 2019
New wells are expected to generate an IRR of approximately 50% and deliver a payout of less than 2
years on a half-cycle basis at US$40 WTI
Optimized Development and Returns
Installed infrastructure capacity supports production growth from 17,000 boe/d currently to
approximately 34,000 - 38,000 boe/d average in 2022
• Minimal infrastructure capital required to further optimize and de-bottleneck to 40,000 boe/d of capacity
Significant capital investment by Pipestone Energy through a continuous drilling and completion
program should result in optimized corporate returns
Enhanced Scale and Competitive Positioning
Peer leading production and cash flow per share growth and leading net debt to cash flow
Execution of the growth plan through 2022 is expected to position Pipestone as one of the larger
condensate-rich Montney focused producers
Attractive Financing Terms for Pipestone and its Shareholders
Conversion price is an attractive premium to current common share trading price
Execution of the accelerated capital plan is expected generate higher per share metrics on a fully
diluted basis
Materially enhances the financial liquidity available to Pipestone to exploit commodity price volatility
4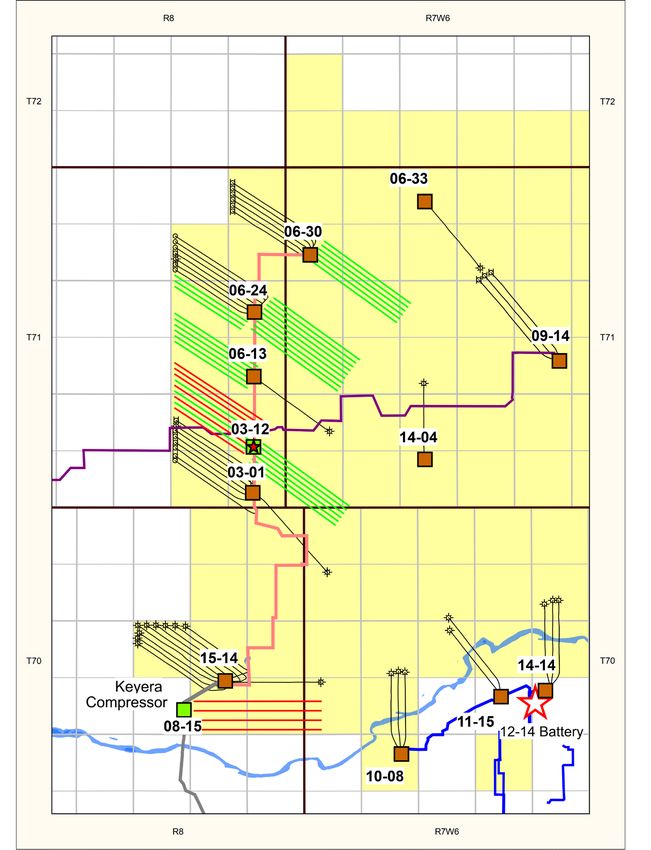
Capitalized for Accelerated Growth
     The $70 million financing provides the capital necessary to re-initiate
     development activities in H2 2020
     • Net proceeds from the financing initially utilized to repay amounts outstanding on the RBL
     • No borrowing base re-determinations scheduled until May 2021 and borrowing base maintained at $225 million
     • Pro forma liquidity available under the existing bank line as of June 30, 2020 (est.) is ~$109 million

                                                      Est. as at June 30, 2020
                                                                (Status Quo)(1)                                                     Adj.             Pro Forma

 Share Price ($/sh)                                                                  $0.50

 Basic Shares O/S (mm)                                                                   190

 Market Capitalization ($MM)                                                             $95                                                              $95

 CP Shares ($MM)                                                                              -                                   +$70                    $70

 Equity Capitalization                                                                   $95                                                             $165

 Working Capital (Deficit) ($MM)                                                      ($13)                                                              ($13)

 Bank Debt ($MM)                                                                      $183                                       ($67)                   $116

 Rem. Availability on Bank Line ($MM)                                                    $42                                      +$67                   $109

 Net Debt(2) ($MM)                                                                    $196                                       ($67)                   $129

 Enterprise Value ($MM)                                                            $291M                                                                $294M
1)    Financial position as at June 30, 2020 is an estimate and may differ from the finalized Q2 2020 MD&A and Financial Statements once released.
2)    See “non-GAAP Measures” in Advisories.                                                                                                                     5
Positioned to Achieve Scale
     Fully-funded three year development plan fills the in-place infrastructure,
     delivers scale and de-leverages the Company through YE 2022
                                                                              3 Year Corporate Growth Trajectory(1)
                 Annual Average Production (boe/d)
                 40,000                                                                                                                                                                   38,000
                                Approximate existing in-field infrastructure capacity
                 35,000
                                                                                                                                                                                          34,000
                 30,000
                                                                                                                          26,000
                 25,000
                                                                                                                          24,000
                 20,000                                   17,000                                                                                                               Est. Maintenance Capital
                                                                                                                                                                               Requirements post-2022
                 15,000                                                                                                                                                             is ~$130 million
                                                          16,000                                                                                                                 (45% decline rate & $6.0
                                                                                                                                                                                      MM DCE&T)
                 10,000

                   5,000

                          0
                                                            2020                                                            2021                                                            2022
Cash Flow ($MM)(2)(3)                                        $40                                                           $135                                                             $205

CAPEX ($MM)(4)                                              $110                                                           $210                                                             $215

YE Net Debt ($MM)(3)                                        $180                                                           $255                                                             $265

LTM Debt / CF (x)                                            4.5x                                                          1.8x                                                             1.3x
1.   3 year plan derived by utilizing, among other assumptions, historical Pipestone Energy production performance and current capital and operating cost assumptions held flat for illustration only. Budgets and forecast
     beyond 2020 have not been finalized and are subject to a variety of factors. Maximum total draw on the Company’s Credit Facility in the forecasts shown would be less than C$225M
2.   Price assumptions: Rem. 2020 = US$40 WTI; $1.90 AECO; $0.74 CAD | 2021 = US$42 WTI; $2.25 AECO; $0.74 CAD | 2022 = US$44 WTI; $2.25 AECO; $0.74 CAD.
3.   See “non-GAAP Measures” in Advisories. Forecast represents the mid-points of the anticipated production ranges. Excludes Convertible Preferred Shares as no cash liability. Net debt inclusive of working capital deficit.
4.   Capex includes all anticipated DCE&T, infrastructure and other capital expenditures, but excludes capitalized G&A. 2020 CAPEX increased from $60 million previously.                                                   6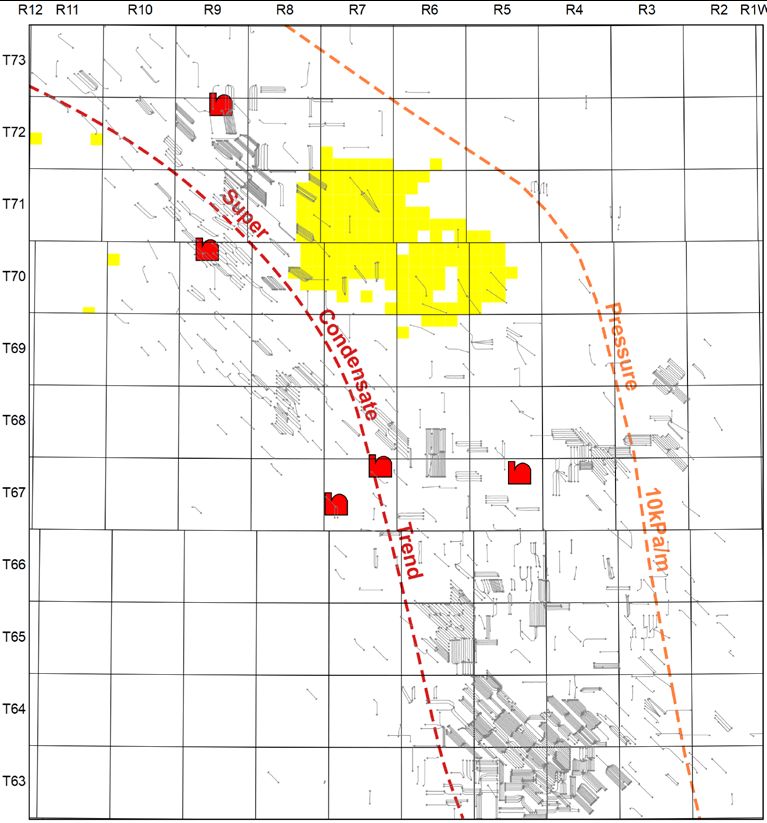
Differentiated from the Peer Group
     Pipestone Energy’s leverage profile and growth trajectory is differentiated
     from the other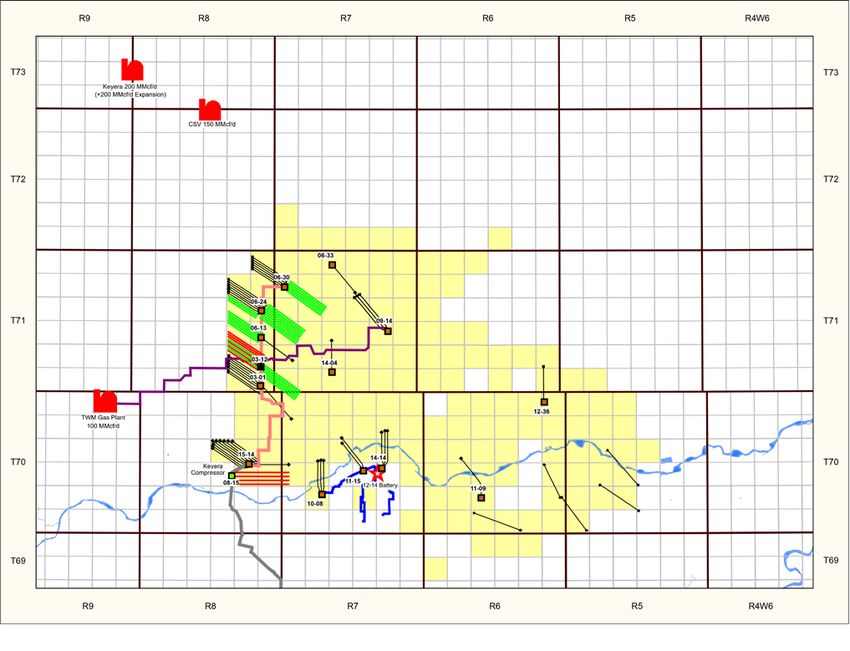
2020 Achievements & Future Game Plan
On-track to Return To Profitable Growth Trajectory

                                           Achieved Pad Average Pacesetter
     Achievements

                                                                                                                                  Took Decisive Action to Protect
                                            Results on Recent 6-30 Pad with
       2020 Key

                                                                                                                                     Balance Sheet, Manage
                                            DCET Costs of $5.3 MM (Single
                                                                                                                                     Production and Maintain
                                             Well Pacesetter at ~$4.9 MM)
                                                                                                                                             Liquidity
                                           ~40% Reduction in Past 18 Months
       H2 2020 Game Plan

                                                 Resume Development
                                               Program with 10 New Wells                                                          Position the Company to Ramp-
                                                   Drilled and 6 Wells                                                               Up Production into 2021
                                                        Completed
       2022+ Objectives

                                              Grow Production to 34-38
                                                                                                                                    Generate Free Cash Flow(1) of
                                             Mboe/d and Increase CFPS
                                                                                                                                     $75 MM at US$44 WTI and
                                             by >250% while Maintaining
                                                                                                                                      $115 MM at US$50 WTI
                                               a Strong Balance Sheet

1.       Calculated utilizing C$2.25 AECO with no inflation. Free cash flow referred to throughout this presentation is a non-IFRS measure defined as Funds from Operations (EBITDA –   8
         interest) less capital expenditures required to maintain flat production consistently through a 12-month forward period. See Advisories for further details.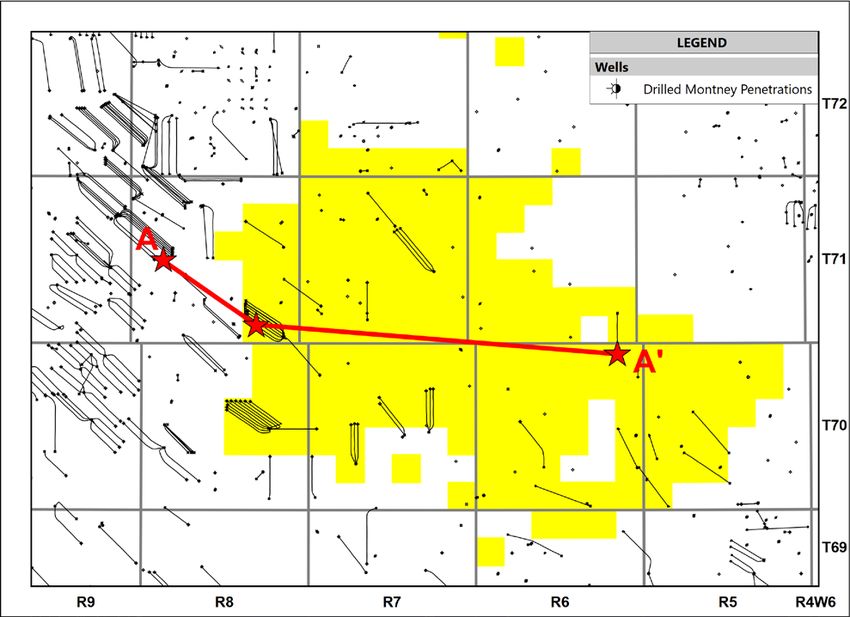
Pipestone Energy Development Focus
High return development inventory along the installed in-field
gathering system

2020 – 2021 Development Focus

                                                         Focused along the North-South
                                                                                             PIPE Acreage
                                                             infrastructure “spine”
                                                                                             PIPE Montney Wells

                                                                                             H2 2020E Development Wells

                                                                                             2021E Development Wells

                                                                                             Existing or Proposed Plants

                                                                                             PIPE Pipelines

                                                                                             TWM Pipeline

                                                                                             KEY Pipeline

                            Drill and Complete 6 well
                                                                                         H2 2020 Capital Program:
                            pad at 3-12. Available for
                                                                                         • 10 Wells Drilled
                             production by YE 2020
                                                                                         • 6 Completions

       Strong directly offsetting
       Montney ‘B’ results from
        the 15-14 pad and on-
        lease tie-in to the 8-15
           compressor site

                                                                                                                           9
Leader on Capital Costs
 Pipestone has significantly reduced its capital costs through improved
 efficiency in a flat service cost environment
                                                             Well Cost Performance Since 2019(1)(2)
     Well Cost ($MM)
     $10.0
                         $9.0                                                                                                              PIPE Forecast well cost
      $9.0                                                                                                                                  includes potential for
                                                                                                                                            additional completion
                         $1.6                                        (40)%
      $8.0                                             $7.8                                                                              scope (proppant / stages) +
                                                                                                                                             longer lateral length
                                                                                    $6.9
      $7.0                                             $1.5
                                                                                    $0.8                                                            $6.0
      $6.0
                                                                                                              $5.3                                  $0.5
                         $4.6                                                                                 $0.4            $4.9
      $5.0
                                                                                                                              $0.4
                                                       $3.8
      $4.0                                                                          $3.9
                                                                                                                                                    $3.3
                                                                                                              $2.8
      $3.0                                                                                                                    $2.8

      $2.0
                          $2.8                         $2.5
      $1.0                                                                          $2.2                      $2.1                                  $2.2
                                                                                                                              $1.7

      $0.0
                     15-14 Pad                      3-1 Pad                 6-24 Pad                        6-30 Pad        Pacesetter          PIPE Budget
                      (6 wells)                     (7 wells)               (6 wells)                       (6 wells)       (6-30 Pad)
                                                                   Drilling   Completions                  Equip & Tie-In
1.    Average lateral length by pad: 15-14 = 2,470m, 3-1 = 2,440m, 6-24 = 2,569m, 6-30 = 2,442m.
2.    Average proppant intensity by pad: 15-14 = 2.5 T/M, 3-1 = 2.9 T/M, 6-24 = 2.9 T/M, 6-30 = 2.3 T/M.                                                         10
Well Cost Improvement to Returns
Well cost achievements have materially improved development
economics and go-forward free cash flow generation capability
Improvement in Well Economics(1) Free Cash Flow Enhancement(2)
Payback (Months) IRR (%) Free Cash Flow Above Maintenance ($MM)
25 Relentless Internal Focus on Capital Cost; 110% $120
Utilizing 2022E Production Estimate of 36,000 boe/d
Pacesetter Well Payout = implies 4 months faster 104%
than Budget pad average capital cost ($6.0 MM)
@ US$44 WTI | C$2.25/GJ AECO | $0.74 CADUSD
$100
90% $100
20
PIPE Budget
77% $85
17
70% $80 $75
15 PIPE Pacesetter
15 62%
13
50% $60
10
30% $40
5
10%
$20
0 -10%
$0
$6.0 MM $5.5 MM $4.9 MM
$6.0 MM $5.5 MM $4.9 MM
Well Cost (DCE&T) Well Cost (DCE&T)
1. Payback calculated utilizing the average of the Montney ‘B’ and ‘C’ VRGC3 type curve. Includes all 3rd party gathering & processing fees. US$42 WTI | $2.25 AECO | $0.74 CADUSD.
2. Calculated as free cash flow above maintenance capital requirements assuming a 45% annual decline rate. 11Pipestone Energy Well Performance
Production from the initial three producing pads are demonstrating strong
deliverability and attractive condensate-gas-ratios
Pipestone Energy Well Results to Date(1)
Gas Rate (MMcf/d)(1)
Condensate Gas Ratio (CGR) by Pad:
7.0
6-24 Pad IP30 (7 wells) CGR = 256 bbl/MMcf
3-1 Pad IP90 (10 wells) CGR = 108 bbl/MMcf
15-14 Pad Mont ‘B’ IP90 (5 wells) CGR = 82 bbl/MMcf
6.0 15-14 Pad Mont ‘C’ IP90 (5 wells) CGR = 35 bbl/MMcf
5.0
4.0
3.0
2.0
15-14 pad curtailed and
1.0 managed as swing volumes to
date
0.0
0 30 60 90 120 150 180 210 240
Producing Days(1)
(2) (2) (2)
3-1 Pad 15-14 Pad 6-24 Pad VRGC1 VRGC2 VRGC3
1. Production days normalized for time each well has been on-stream due to initial facility intermittency during commissioning of the 3rd party compression and processing facilities. Gas rate includes
recombined condensate consistent with methodology used to display competitor results on Geoscout. 15-14 Pad includes 5 Montney ‘B’ and 5 Montney ‘C’ / ‘D’ wells. Average lateral length = 2,424m. 3-1
pad includes 10 wells (including the stand-alone 8-7 wells, 7 Montney ‘B’ wells and 3 Montney ‘C, with an average lateral length of 2,407m. 6-24 pad includes 7 wells, 4 Montney ‘B’ wells and 3 Montney
‘C’ wells with an average lateral length of 2,569m.
2. The McDaniel VRGC1, VRGC2 and VRGC3 type curves represents a Montney ‘B’ and ‘C’ average with 2,300 lateral length type curve scaled up on a 1:1 basis to a 2,500 metre lateral length. Gas rate
includes recombined condensate consistent with methodology used to display competitor results on Geoscout.
12Attractive Asset Economics
Pipestone Montney wells deliver highly competitive half-cycle economics,
which translates into strong full-cycle economics at >US$40 WTI
Pipestone VRGC3 (Montney B + C Average) Type Curve Economics(1)(2)(3)
Payback Period (Months)
Volume (Mboe) / CGR (bbl/MMcf)
600 30
Type Curve Inputs Achieved ~C$5.3 MM
per well costs on the 20
DCET Capital $6.0 MM recent 6-30 pad 20 15
12
500 Raw Gas EUR (Bcf) 3.4 10
Cond. EUR (Mbbls) 352
-
Hz Length (metres) 2,500 $40 | $2.25 $45 | $2.25 $50 | $2.25
400 Prop. Loading (t/m) 2.5 WTI (US$/bbl) | AECO ($/GJ)
IRR (%)
Representative of the 150%
6-24 and 6-30 pads Improved previous
105%
300 type curve DCET
77%
capital from $7.1M 100%
52%
50%
200 -
$40 | $2.25 $45 | $2.25 $50 | $2.25
WTI (US$/bbl) | AECO ($/GJ)
NPV10% ($MM)
100
$8.0 $6.2
$6.0 $4.8
$4.0 $3.3
-
0 4 8 12 16 20 24 $2.0
Months -
$40 | $2.25 $45 | $2.25 $50 | $2.25
Total Production Condensate CGR
WTI (US$/bbl) | AECO ($/GJ)
1. Type curve represents the McDaniel VRGC3 Montney B & C (average) 2,300 lateral length type curve scaled up on a 1:1 basis to a 2,500 metre lateral length.
2.
3.
Single well economics calculated using a flat price deck with no inflation. Utilizes a 0.74 CADUSD FX rate and Edmonton Condensate at 100% of C$ WTI. Operating costs include third party compression, gathering, and processing costs.
Capital costs reflect internal estimates of type curve DCET costs, based on actual cost performance.
13APPENDIX
Consistent Geology
    The well at 03-12 confirms the lateral continuity of Montney resource
    potential across our land base

    Pipestone Area Cross Section

         Ovintiv                    Pipestone Energy
A                                                             A’

                                    Future Upside Layer
                                                                    Montney B and C zones have been proven
                                                                    commercial on Pipestone Energy’s lands

                                                                    Montney A and Lower Montney zones
                                                                    have been proven by offset operators
          BELLOY

                                                                                                           15
Efficient Reserve Growth
Increased reserve volumes materially across all categories since YE 2018;
improved capital cost efficiencies reflected in significantly lower future
development costs
Y-o-Y Reserve Volume Increase(1) Improvement in Future Development Capital or “FDC” (1)
Reserve Volumes (Mboe) FDC ($MM) Undeveloped F&D Cost ($/boe)
200 $1,600 $12.00
184 16% improvement Y-o-Y
+12%
180 $10.59
$1,400 $1,335
164 $10.00
160 (16%)
$1,200 $8.95 $9.08
$1,104
140
(20%)
$8.00
$1,000 $7.28
120 112
+24% $819 20% improvement Y-o-Y
$780
$800 $6.00
100
91
80 $600
$4.00
60
$400
40 $2.00
$200
+585%
19
20
3 $0 $0.00
YE 2018 YE 2019 YE 2018 YE 2019
0 1P Undev. 1P Undev. 2P Undev. 2P Undev.
YE 2018 YE 2019 YE 2018 YE 2019 YE 2018 YE 2019
PDP PDP 1P 1P 2P 2P
Undeveloped FDC Undeveloped F&D
1. Sourced to McDaniel & Associates Consultants Ltd. (“McDaniel”) December 31, 2019 reserve report and McDaniel January 4, 2019 reserve report. Excludes PDNP FDC (~$40 million at YE 2018 and ~$10
million at YE 2019).
16Significant Reserves & Resource Recognition
Increased reserve volumes with decreased FDC driving a 57%
year-over-year increase to 2P NAVPS (strip pricing) to ~$5/share(2)
NPV 10%
Volume Condensate / Oil NGLs Total Liquids @ 3C Price Deck(1)
(MMboe) (%) (%) (%) ($MM)
Proved Developed
25 29% 13% 42% $360
Reserves*
Total Proved Reserves 112 34% 13% 47% $1,268
2P Reserves 184 35% 11% 47% $1,917
*Includes Proved Developed Producing Reserves of $19MM and Proved Developed Non-Producing Reserves of $6MM located at the 6-4 pad.
Growth in Reserves per Share 2P NAV per Share @ Strip Pricing (2)
Reserves per Share (boe/’000s shares) NAVPS ($/Sh)
1,200
$6.00
966 +57%
1,000 $5.01
863 $5.00
800
$4.00
592 $3.19
600 $3.00
478
400 $2.00
200 $1.00
98
14
$0.00
0
Jan 4, 2019 Dec 31, 2019
'18 PDP '19 PDP '18 1P '19 1P '18 2P '19 2P
(YE 2018)
1. Based on McDaniel reserves and resource evaluations effective December 31, 2019, utilizing an average of the three consultants (GLJ, McDaniel, & Sproule) January 1, 2020 price forecasts. NPV calculation is
before tax.
2. Calculated as the 2P NPV10% less abandonment obligations less mark-to-market of hedges as at the effective date less net debt plus proceeds of dilutive securities divided by fully diluted shares outstanding.
December 31, 2019 NAVPS utilizes the WTI, AECO and CADUSD futures as of February 6, 2020. WTI Pricing (US$ per barrel); 2020: $52.44, 2021: $50.90, 2022: $50.74, 2023+: $50.98 | AECO Pricing (C$
per Mcf); 2020: $1.77, 2021: $1.89, 2022: $1.98, 2023: $2.06. Jan 4, 2019 NAVPS utilizes futures pricing as of March 14, 2019. WTI Pricing (US$ per barrel); 2020: $58.77, 2021: $56.67, 2022: $55.11, 2023:
$54.41 | AECO Pricing (C$ per Mcf); 2020: $1.65, 2021: $1.70, 2022: $1.82, 2023: $2.05.
17Secured Processing Capacity
Infrastructure & committed third party facilities will support initial growth
to 36,000 boe/d; TOP escalation reduced in 2021 and staggered into Jan 2022
No take-or-pay commitment concerns post-financing
Processing Capacity (Raw Gas)
Raw Gas (Mcf/d)
Keyera Wapiti Gas Plant
CNRL Gold Greek Gas Plant - IT Tidewater Pipestone Gas Plant - Firm
175 • Firm priority service of 60 MMcf/d of
Keyera Wapiti Gas Plant Keyera Wapiti Gas Plant - Under Option
Total Take-or-Pay Commitment natural gas gathering, compression and
processing currently; increase to 90
150
MMcf/d in Q4 2020
~36,000 boe/d (1)
(Sales Processing Capacity) • Take-or-pay (TOP) currently at 48
125 MMcf/d with a gradual escalation to 60
Embedded MMcf/d on April 1, 2021 and to 72
flexibility on TOP
through 2021 MMcf/d on Jan 1, 2022
100 • Pipestone Energy retains an option to
increase the firm commitment at Keyera
by 30 MMcf/d to 120 MMcf/d at its
75 election until 2029
Tidewater Pipestone Gas Plant
50
• Firm access to 30 MMcf/d with
escalating take-or-pay commitments
25
over the first 18 months
CNRL Gold Creek
-
• Access to 6 MMcf/d
Q1 Q2 Q3 Q4 Q1 Q2 Q3 Q4 Q1 Q2 Q3 Q4
2020 2021 2022
1. CNRL, Tidewater, and Keyera processing volumes converted to sales gas assuming shrinkage of 12.5%, 16%, and 12%, respectively. Excludes additional option with Keyera. 18Committed Egress Capacity In Place
Firm access to natural gas egress solutions to match existing processing
commitments and support future production growth
PIPE will seek to further diversify natural gas
price exposure after first production (gas is
Committed Egress Capacity
expected to contributeEnvironment, Social, & Governance
Highlights
State of the Art Design & Facilities, Focused on Minimizing Emissions
Environment
• In-field fuel gas displacing diesel on drilling rigs and frac fleets
• Air powered instrumentation vs. fuel gas
• Pad-sites designed for zero flaring during normal operations
• State of the art facilities which are newly engineered and
commissioned
Putting People First
• Striving to be the most diligent and responsible operator in the
community in which we operate
Social
• Strong focus on public safety, worker safety, and doing what is
right to protect both
• Pipestone operates an inclusive and diverse work environment,
attracting the best talent possible
The Fundamentals
Governance
• Highly Experienced Management Team
• Independent and diverse Board of Directors
• Focused on protecting long term interest of all stakeholders
• Whistleblower line in place
20Experienced Management and Board
Pipestone Energy is led by a management team with significant
Montney experience
Management Team Board of Directors
Paul Wanklyn Gordon Ritchie, Chairman
President and CEO Previously Vice Chairman for RBC Capital Markets
Garth Braun
Former President, CEO, and Chairman at Blackbird
Dustin Hoffman
Chief Operating Officer
Bill Lancaster
President at GMT Exploration Company LLC
Craig Nieboer John Rossall
Chief Financial Officer Previously Executive Director for Repsol Oil & Gas Canada
Geeta Sankappanavar
Co-Founder & President at Grafton Asset Management
Darcy Erickson
Vice President Production
Robert Tichio
Partner at Riverstone Holdings
Dan van Kessel Paul Wanklyn
Vice President Corporate Development President and CEO at Pipestone Energy
21Advisories
This presentation has been prepared by Pipestone solely for information purposes. This presentation does not constitute an offer to sell or a solicitation of an offer to buy any securities in any jurisdiction to any person to
whom it is unlawful to make such an offer or solicitation in such jurisdiction. This presentation is not, and under no circumstances is to be construed as, a prospectus, an advertisement or a public offering of the CP
Shares in the United States, Canada or any other jurisdiction. No securities commission or similar authority in the United States or Canada has reviewed or in any way passed upon this document, or the merits of the
securities described herein, and any representation to the contrary is an offence. Any such offer to sell or solicitation of an offer to buy the securities described herein or during the Presentation will be made only pursuant
to subscription documentation between Pipestone and prospective purchase
Forward-Looking Statements
This presentation contains certain information and statements including financial outlook (“forward-looking statements”) that constitute forward-looking information within the meaning of applicable Canadian securities
laws. Forward-looking statements relate to future results or events, are based upon internal plans, intentions, expectations and beliefs, and are subject to risks and uncertainties that may cause actual results or events to
differ materially from those indicated or suggested therein. All statements other than statements of current or historical fact constitute forward-looking statements. Forward-looking statements are typically, but not always,
identified by words such as “anticipate”, “estimate”, “expect”, “intend”, “forecast”, “continue”, “propose”, “may”, “will”, “should”, “believe”, “plan”, “target”, “objective”, “project”, “potential” and similar or other expressions
indicating or suggesting future results or events.
Forward-looking statements are not promises of future outcomes. There is no assurance that the results or events indicated or suggested by the forward-looking statements, or the plans, intentions, expectations or
beliefs contained therein or upon which they are based, are correct or will in fact occur or be realized (or if they do, what benefits Pipestone Energy may derive therefrom).
In particular, but without limiting the foregoing, this presentation contains forward-looking statements pertaining to: Pipestone’s growth and strategic plans; use of proceeds from the offering; expectation to generate peer
leading returns on capital employed; expected IRRs and NPV; estimated production; plans to resume Pipestone’s internal development program; three year development plan, including production, cash flow, capex, net
debt and debt to cash flows; growth of production and cash flow per share; anticipated commencement of specified operations; reserves values and financial returns; anticipated DCE&T costs per well; future estimated
sales processing capacity and production; estimated capital expenditures and estimated free cash flow generation; Payback periods; and Pipestone’s proposed drilling plans.
With respect to the forward-looking statements contained in this presentation, Pipestone Energy has assessed material factors and made assumptions regarding, among other things: future commodity prices and
currency exchange rates, including consistency of future oil (WTI), natural gas liquids (NGLs) and natural gas (AECO) prices with current commodity price forecasts; the economic impacts of the COVID-19 pandemic and
volatility caused by OPEC; Pipestone Energy’s continued ability to obtain qualified staff and equipment in a timely and cost-efficient manner; the predictability of future results based on past and current experience; the
predictability and consistency of the legislative and regulatory regime governing royalties, taxes, environmental matters and oil and gas operations, both provincially and federally; Pipestone Energy’s ability to successfully
market its production of oil, NGLs and natural gas; the timing and success of drilling and completion activities (and the extent to which the results thereof meet expectations); Pipestone Energy’s future production levels
and amount of future capital investment, and their consistency with Pipestone Energy’s current development plans and budget; future capital expenditure requirements and the sufficiency thereof to achieve Pipestone
Energy’s objectives; the successful application of drilling and completion technology and processes; the applicability of new technologies for recovery and production of Pipestone Energy’s reserves and other resources,
and their ability to improve capital and operational efficiencies in the future; the recoverability of Pipestone Energy's reserves and other resources; Pipestone Energy’s ability to economically produce oil and gas from its
properties and the timing and cost to do so; the performance of both new and existing wells; future cash flows from production; future sources of funding for Pipestone Energy’s capital program, and its ability to obtain
external financing when required and on acceptable terms; future debt levels; geological and engineering estimates in respect of Pipestone Energy’s reserves and other resources; the accuracy of geological and
geophysical data and the interpretation thereof; the geography of the areas in which Pipestone Energy conducts exploration and development activities; the timely receipt of required regulatory approvals; the access,
economic, regulatory and physical limitations to which Pipestone Energy may be subject from time to time; and the impact of industry competition.
Information and statements regarding Pipestone Energy’s reserves are also forward-looking statements, as they involve the implied assessment, based on certain estimates and assumptions, that the reserves exist in
the quantities predicted or estimated and can be profitably produced in the future. In addition, with respect to the type curves and test rates, there is no certainty that future wells will generate results to match type curves
or test rates presented herein.
Certain information in this presentation is “financial outlook” within the meaning of applicable securities laws. The purpose of this financial outlook is to provide readers with disclosure of the company’s reasonable
expectations of our anticipate results. The financial outlook is provided as of the date of this Presentation. Readers are cautioned that this financial outlook may not be appropriate for other purposes.
The forward-looking statements contained herein reflect management's current views, but the assessments and assumptions upon which they are based may prove to be incorrect. Although Pipestone Energy believes
that its underlying assessments and assumptions are reasonable based on currently available information, undue reliance should not be placed on forward-looking statements, which are inherently uncertain, depend
upon the accuracy of such assessments and assumptions, and are subject to known and unknown risks, uncertainties and other factors, both general and specific, many of which are beyond Pipestone Energy’s control,
that may cause actual results or events to differ materially from those indicated or suggested in the forward-looking statements. Such risks and uncertainties include, but are not limited to, volatility in market prices and
demand for oil, NGLs and natural gas and hedging activities related thereto; general economic, business and industry conditions; variance of Pipestone Energy’s actual capital costs, operating costs and economic returns
from those anticipated; the ability to find, develop or acquire additional reserves and the availability of the capital or financing necessary to do so on satisfactory terms; imprecision of reserve estimates and related costs
including royalties, production costs and future development costs; success of drilling programs; geological, technical, drilling, completion and processing problems; results of enhanced recovery responses; unplanned
outages at third party natural gas processing facilities and pipelines; and physical and operational risks related to the exploration, development and production of oil and natural gas reserves and resources, including
environmental risks. Additional risks, uncertainties and other factors are discussed in Pipestone Energy Corp.’s (formerly Blackbird Energy Inc.) interim management’s discussion and analysis for the quarter ended March
31, 2020, dated May 13, 2020, Annual Information Form dated March 17, 2020, annual and interim management’s discussion and analysis, and other documents filed by it and Pipestone Energy from time to time with
securities regulatory authorities in Canada, copies of which are available electronically on Pipestone Energy’s SEDAR at www.sedar.com.
22Advisories (Continued)
The forward-looking statements contained in this presentation are made as of the date hereof and Pipestone Energy assumes no obligation to update or revise any forward-looking statements, whether as a result of new
information, future events or otherwise, unless required by applicable securities laws. All forward-looking statements herein are expressly qualified by this advisory.
Non-IFRS Measures
This presentation contains references to “free cash flow”, “IRR” or “internal rate of return” and “net debt”, which are terms commonly used in the oil and natural gas industry but without any standardized meaning or
method of calculation prescribed by International Financial Reporting Standards (“IFRS”) or applicable law. Accordingly, Pipestone Energy’s determination of these metrics may not be comparable to similar measures
presented by other issuers.
“Free cash flow” should not be considered an alternative to, or more meaningful than, cash flow – operating activities as determined in accordance with IFRS, as an indicator of financial performance. Free cash flow is
presented to assist management and investors in analyzing operating performance by the business in the stated period. Free cash flow equals Funds from Operations (EBITDA – interest) less capital expenditures
required to maintain flat production consistently through a 12-month forward period.
“IRR” or “internal rate of return” is a rate of return measure used to compare the profitability of an investment and represents the discount rate at which the net present value of costs equals the net present value of the
benefits. The higher a project’s IRR, the more desirable the project.
“Net debt” is a non-GAAP measure that is calculated as long-term debt plus adjusted working capital deficit. Adjusted working capital is comprised of current assets less current liabilities on the Company’s consolidated
statement of financial position and excludes the current portion of financial derivative instruments and the current portion of lease liabilities. Net debt is considered to be a useful measure in assisting management and
investors to evaluate Pipestone Energy’s financial strength.
Third Party Information
This presentation contains statistical data, market research and industry forecasts that were obtained from government or other industry publications and reports or are based on estimates derived therefrom and
management’s knowledge of, and experience in, the markets in which Pipestone Energy operates. Government and industry publications and reports generally indicate that they have obtained information from sources
believed to be reliable, but do not guarantee its accuracy or completeness. Often, such information is provided subject to specific terms and conditions limiting the liability of the provider, disclaiming any responsibility
therefor, and/or limiting a third party’s ability to rely thereon. No author of any such publication or report has consulted for or advised or counselled Pipestone Energy or is in any way associated with the companies.
Further, organizations that are proponents of the Canadian oil and gas industry may present information in a manner that is different from, and potentially more favourable to the industry than, information presented by an
entirely independent source. Actual outcomes may vary materially from those forecast in such reports or publications, and the prospect for material variation can be expected to increase as the length of the forecast
period increases. Market and industry data is subject to variation and cannot be verified due to limits on the availability and reliability of data inputs, the voluntary nature of the data gathering process, and other limitations
and uncertainties inherent in any survey. Pipestone Energy has not verified any data from third party sources referred to in this presentation or assessed any underlying assumptions relied upon by such sources.
Reserves Disclosure
General
Unless otherwise indicated, reserves estimates have been prepared by McDaniel’s, Pipestone Energy’s independent qualified reserves evaluators in accordance with the COGE Handbook and have an effective date of
December 31, 2019.
Information in this presentation regarding Pipestone Energy’s estimated reserves, net present value of related future net revenue, and production is expressed on a net Pipestone Energy (as applicable) interest basis,
being its respective working interest (operating and non-operating) share after deduction of royalty obligations plus any royalty interest. Estimates of future net revenue are after deduction of forecasted royalties,
operating costs, estimated well abandonment and reclamation costs and estimated future development costs, but without any provision for interest costs, debt service charges or general and administrative expenses.
Reserves volumes attributed to Pipestone Energy’s properties and related future net revenue are estimates only. There is no assurance that the estimated reserves can or will be recovered or that estimated future net
revenues will be realized. Actual reserves may be greater or less than those estimated, and the difference may be material. Similarly, estimated net present values of related future net revenue attributed to reserves and
resources do not represent fair market value of those reserves. There is no assurance that the forecast prices and cost assumptions applied in evaluating the reserves and estimating related future net revenue will be
attained, and variances between actual and forecast prices and costs may be material.
The determination of oil and gas reserves involves estimating subsurface accumulations of oil, NGLs (including condensate) and natural gas that cannot be exactly measured. The preparation of estimates is subject to an
inherent degree of associated risk and uncertainty, including factors that are beyond Pipestone Energy’s, as applicable, control. The estimation and classification of reserves is a complex process involving the application
of professional judgment combined with geological and engineering knowledge to assess whether specific classification criteria have been satisfied. It requires significant judgments based on available geological,
geophysical, engineering, and economic data as well as forecasts of commodity prices and anticipated costs. As circumstances change and additional data becomes available, whether through the results of drilling,
testing and production or from economic factors such as changes in product prices or development and production costs, reserves estimates also change. Revisions may be positive or negative.
23Advisories (Continued)
Type Curve Information and Estimated Ultimate Recovery
This presentation provides indicative information regarding Pipestone Energy’s type curve parameters and economics. Type curve information reflects current operating experience in relation to wells of the indicated type,
including with respect to costs, production and decline rates, and are based on the pricing assumptions as indicated. There is no assurance that actual well results will be in accordance with those suggested by the type
curve information. Actual results will differ, and the difference may be material. The type curve information includes estimated ultimate recovery (EUR), which is a measure commonly used in the oil and natural gas
industry but is not a resource category or defined term under NI 51-101 or the COGE Handbook. EUR refers to the quantity of petroleum estimated to be potentially recoverable from an accumulation, plus quantities
already produced therefrom. EUR does not, however, have a standardized meaning and may not be comparable to similar measures presented by other companies. Accordingly, EUR should not be used for
comparisons. EUR estimates in this presentation reflect type curve information based on internal empirical data and publicly available information sources believed to be independent. EUR volumes are not reserves.
There is no assurance that EUR volumes are recoverable or that it will be commercially viable to produce any portion thereof. Management uses EUR for internal corporate performance purposes and to provide a
measure to assess that performance over time; however, such measure is not a reliable indicator of future performance and therefore should not be unduly relied upon. EUR used in this presentation for Pipestone
Energy’s type curves was prepared by qualified reserves evaluator. In respect of EUR estimates for type curves that were not prepared by Pipestone, these estimates were prepared by an independent source and
Pipestone Energy cannot confirm whether they were prepared in accordance with the COGE Handbook or by a qualified reserves evaluator or auditor under NI 51-101.
Initial Production Rates and Short-Term Test Rates
This presentation includes disclosure on initial production (IP) rates for certain wells over a 30-day (IP30) and 90-day (IP90), measurement period. Test rates of production for certain wells over short periods of time are
preliminary and not determinative of the rates at which those or any other wells will commence production and thereafter decline. Initial production rates and short-term test rates are not necessarily indicative of long-term
well or reservoir performance or of ultimate recovery. Although such rates are useful in confirming the presence of hydrocarbons, they are preliminary in nature, are subject to a high degree of predictive uncertainty as a
result of limited data availability, and may not be representative of stabilized on-stream production rates.
Production over a longer period will also experience natural decline rates, which can be high in the Montney play and may not be consistent over the longer term with the decline experienced over an initial production
period. Initial production or test rates may also include recovered “load” fluids used in well completion stimulation operations. Actual results will differ from those realized during an initial production period or short-term test
period, and the difference may be material.
Oil and Gas Measures
Barrels of Oil Equivalent – This presentation discloses certain production information on a barrels of oil equivalent (“boe”) basis with natural gas converted to barrels of oil equivalent using a conversion factor of six
thousand cubic feet of gas (mcf) to one barrel (bbl) of oil (6 mcf:1 bbl). Condensate and other NGLs are converted to boe at a ratio of 1 bbl:1 bbl. Boe may be misleading, particularly if used in isolation. A boe conversion
ratio of 6 mcf:1 bbl is based roughly on an energy equivalency conversion method primarily applicable at the burner tip and does not represent a value equivalency at Pipestone Energy’s sales point. Although the 6:1
conversion ratio is an industry-accepted norm, it is not reflective of price or market value differentials between product types. Based on current commodity prices, the value ratio between crude oil, NGLs and natural gas
is significantly different from the 6:1 energy equivalency ratio. Accordingly, using a conversion ratio of 6 mcf:1 bbl may be misleading as an indication of value.
CGR - References herein to “CGR” mean condensate/gas ratio and is expressed as a volume of condensate and NGLs (expressed in barrels) per million cubic feet (mmcf) of natural gas.
This presentation contains certain other oil and gas metrics, including DCE&T (drilling, completion, equip and tie-in costs), F&D and net asset value (or NAVPS), which do not have standardized meanings or standard
methods of calculation and therefore such measures may not be comparable to similar measures used by other companies and should not be used to make comparisons. Such metrics have been included herein to
provide readers with additional measures to evaluate the Company's performance; however, such measures are not reliable indicators of the future performance and future performance may not compare to the
performance in previous periods and therefore such metrics should not be unduly relied upon. DCE&T includes all capital spent to drill, complete, equip and tie-in a well. The calculation of F&D costs includes all
exploration and development capital for the year plus the change in future development capital for the year. Net asset value has been calculated based on the estimated net present value of all future net revenue from
our reserves, before income taxes, as estimated by McDaniel effective December 31, 2019 (see slide 20 for further information on the calculation of NAVPS).
24Advisories (Continued)
Notice to United States Readers
The petroleum and natural gas reserves contained in this presentation have generally been prepared in accordance with Canadian disclosure standards, which are not comparable in all respects to United States or other
foreign disclosure standards. For example, the United States Securities and Exchange Commission (the "SEC") requires oil and gas issuers, in their filings with the SEC, to disclose only "proved reserves", but permits the
optional disclosure of "probable reserves" and "possible reserves" (each as defined in SEC rules). Canadian securities laws require oil and gas issuers disclose their reserves in accordance with NI 51-101, which requires
disclosure of not only "proved reserves" but also "probable reserves" and permits the optional disclosure of "possible reserves". Additionally, NI 51-101 defines "proved reserves", "probable reserves" and "possible
reserves" differently from the SEC rules. Accordingly, proved, probable and possible reserves disclosed in this presentation may not be comparable to United States standards. Probable reserves are higher risk and are
generally believed to be less likely to be accurately estimated or recovered than proved reserves. Possible reserves are higher risk than probable reserves and are generally believed to be less likely to be accurately
estimated or recovered than probable reserves.
In addition, under Canadian disclosure requirements and industry practice, reserves and production are reported using gross volumes, which are volumes prior to deduction of royalty and similar payments. The SEC rules
require reserves and production to be presented using net volumes, after deduction of applicable royalties and similar payments.
The disclosure regarding Pipestone Energy’s properties is materially different than disclosure provided by U.S. companies in their filings with the SEC. Investors are cautioned not to assume that any part or all of any
resource will ever be converted into a reserve.
All amounts in this presentation are stated in Canadian dollars unless otherwise specified.
Analogous Information
Certain information in this presentation may constitute “analogous information” within the meaning of NI 51-101, including information relating to areas, wells or operations that are in geographical proximity to or believed
to be on-trend with lands held by Pipestone Energy and production information in respect of wells that are believed to be on trend with Pipestone Energy’s properties. Such information has been obtained from
governmental or other public sources, regulatory agencies or other industry participants that are independent of Pipestone Energy. Pipestone Energy does not, though, know whether any such information contained
herein that constitutes “analogous information” was prepared in accordance with the COGE Handbook or by a qualified reserves evaluator or auditor under NI 51-101, as applicable, and cannot verify its accuracy. While
believed to be reliable, third party data relied upon by Pipestone Energy may be in error.
Management believes such information may be relevant to Pipestone Energy’s efforts to understand and predict reservoir characteristics of properties in which Pipestone Energy may hold or intend to acquire an interest,
and it is presented to help demonstrate the basis for Pipestone Energy's business plans and strategies. There is, however, no assurance that the qualities, characteristics or results suggested by or inferred from
analogous information are or will be similar to or otherwise representative of the qualities or characteristics of properties in which Pipestone Energy has or intends to acquire an interest or the results that Pipestone
Energy may achieve or realize from any operations thereon. Such information is not, and should not be construed or relied upon as, an estimate or predictor of resource potential or future production levels.
TSX Venture Exchange Disclaimer
Neither the TSX Venture Exchange nor its Regulation Services Provider (as that term is defined in policies of the TSX Venture Exchange) accepts responsibility for the adequacy or accuracy of the information contained
in this presentation.
25Statutory Rights of Action
STATUTORY RIGHTS OF ACTION (ONTARIO PURCHASERS)
Section 5.2 of OSC Rule 45-501 – Ontario Prospectus and Registration Exemptions provides that when an offering memorandum is delivered to an investor to whom securities are distributed in reliance upon the
“accredited investor” prospectus exemption, the right of action referred to in Section 130.1 of the Securities Act (Ontario) (“Section 130.1”) is applicable, unless the prospective purchaser is:
(a) a Canadian financial institution, meaning either:
(i) an association governed by the Cooperative Credit Associations Act (Canada) or a central cooperative credit society for which an order has been made under section
473(1) of that Act; or
(ii) a bank, loan corporation, trust company, trust corporation, insurance company, treasury branch, credit union, caisse populaire, financial services cooperative, or league
that, in each case, is authorized by an enactment of Canada or a jurisdiction of Canada to carry on business in Canada or a jurisdiction of Canada;
(b) a Schedule III bank, meaning an authorized foreign bank named in Schedule III of the Bank Act (Canada);
(c) The Business Development Bank of Canada incorporated under the Business Development Bank of Canada Act (Canada); or
(d) a subsidiary of any person referred to in paragraphs (a), (b) or (c), if the person owns all of the voting securities of the subsidiary, except the voting securities required by law to be owned by t
he directors of the subsidiary.
Section 130.1 provides such investors who purchase securities offered by an offering memorandum during the distribution period with a statutory right of action against the issuer of securities and any selling security
holder on whose behalf the distribution is made for rescission or damages in the event that the offering memorandum and any amendment to it contains a “misrepresentation”. “Misrepresentation” means an untrue
statement of a material fact or an omission to state a material fact that is required to be stated or that is necessary to make any statement not misleading or false in the light of the circumstances in which it was made.
Where this presentation is delivered to a prospective purchaser of CP Shares in connection with a trade made in reliance on Section 2.3 of NI 45-106, and this document contains a misrepresentation the purchaser will
have, without regard to whether the purchaser relied on the misrepresentation, a statutory right of action against the issuer for damages or, while still the owner of CP Shares, for rescission, in which case, if the
purchaser elects to exercise the right of rescission, the purchaser will have no right of action for damages, provided that no action shall be commenced more than, in the case of an action for rescission, 180 days after
the date of the transaction that gave rise to the cause of action; or, in the case of any action other than an action for rescission, the earlier of: (i) 180 days after the plaintiff first had knowledge of the facts giving rise to
the cause of action, or (ii) three years after the date of the transaction that gave rise to the cause of action.
The defendant shall not be liable for a misrepresentation if it proves that the purchaser purchased the CP Shares with knowledge of the misrepresentation.
In an action for damages, the defendant shall not be liable for all or any portion of the damages that the defendant proves do not represent the depreciation in value of the CP Shares as a result of the
misrepresentation relied upon.
In no case shall the amount recoverable for the misrepresentation exceed the price at which the CP Shares were offered.
The foregoing statutory right of action for rescission or damages conferred is in addition to and without derogation from any other right the purchaser may have at law.
This summary is subject to the express provisions of the Securities Act (Ontario) and the regulations and rules made under it, and prospective investors should refer to the complete text of those provisions.
July 2020 26Statutory Rights of Action (Continued)
STATUTORY RIGHTS OF ACTION (SASKATCHEWAN PURCHASERS)
Section 138 of The Securities Act, 1988 (Saskatchewan), as amended (the “Saskatchewan Act”) provides that where an offering memorandum or any amendment to it is sent or delivered to a purchaser and it contains
a misrepresentation (as defined in the Saskatchewan Act), a purchaser who purchases a security covered by the offering memorandum or any amendment to it has, without regard to whether the purchaser relied on the
misrepresentation, a right of action for rescission against the issuer or a selling security holder on whose behalf the distribution is made or a right of action for damages against:
(a) the issuer or a selling security holder on whose behalf the distribution is made;
(b) every promoter and director of the issuer or the selling security holder, as the case may be, at the time the offering memorandum or any amendment to it was sent or delivered;
(c) every person or company whose consent has been filed respecting the offering, but only with respect to reports, opinions or statements that have been made by them;
(d) every person who or company that, in addition to the persons or companies mentioned in (a) to (c) above, signed the offering memorandum or the amendment to the offering memorandum;
and
(e) every person who or company that sells securities on behalf of the issuer or selling security holder under the offering memorandum or amendment to the offering memorandum.
Such rights of rescission and damages are subject to certain limitations including the following:
(a) if the purchaser elects to exercise its right of rescission against the issuer or selling security holder, it shall have no right of action for damages against that party;
(b) in an action for damages, a defendant will not be liable for all or any portion of the damages that he, she or it proves do not represent the depreciation in value of the securities resulting from t
he misrepresentation relied on;
(c) no person or company, other than the issuer or a selling security holder, will be liable for any part of the offering memorandum or any amendment to it not purporting to be made on the
authority of an expert and not purporting to be a copy of, or an extract from, a report, opinion or statement of an expert, unless the person or company failed to conduct a reasonable investigation
sufficient to provide reasonable grounds for a belief that there had been no misrepresentation or believed that there had been a misrepresentation;
(d) in no case shall the amount recoverable exceed the price at which the securities were offered; and
(e) no person or company is liable in an action for rescission or damages if that person or company proves that the purchaser purchased the securities with knowledge of the misrepresentation.
In addition, no person or company, other than the issuer or selling security holder, will be liable if the person or company proves that:
(a) the offering memorandum or any amendment to it was sent or delivered without the person’s or company’s knowledge or consent and that, on becoming aware of it being sent or delivered, that
person or company gave reasonable general notice that it was so sent or delivered; or
(b) with respect to any part of the offering memorandum or any amendment to it purporting to be made on the authority of an expert, or purporting to be a copy of, or an extract from, a report, an
opinion or a statement of an expert, that person or company had no reasonable grounds to believe and did not believe that there had been a misrepresentation, the part of the offering
memorandum or any amendment to it did not fairly represent the report, opinion or statement of the expert, or was not a fair copy of, or an extract from, the report, opinion or statement of the
expert.
July 2020 27Statutory Rights of Action (Continued)
Not all defences upon which we or others may rely are described herein. Please refer to the full text of the Saskatchewan Act for a complete listing.
Similar rights of action for damages and rescission are provided in section 138.1 of the Saskatchewan Act in respect of a misrepresentation in advertising and sales literature disseminated in connection with an offering of
securities.
Section 138.2 of the Saskatchewan Act also provides that where an individual makes a verbal statement to a purchaser that contains a misrepresentation relating to the security purchased and the verbal statement is
made either before or contemporaneously with the purchase of the security, the purchaser has, without regard to whether the purchaser relied on the misrepresentation, a right of action for damages against the individual
who made the verbal statement.
Section 141(1) of the Saskatchewan Act provides a purchaser with the right to void the purchase agreement and to recover all money and other consideration paid by the purchaser for the securities if the securities are
sold in contravention of the Saskatchewan Act, the regulations to the Saskatchewan Act or a decision of the Financial and Consumer Affairs Authority of Saskatchewan.
Section 141(2) of the Saskatchewan Act also provides a right of action for rescission or damages to a purchaser of securities to whom an offering memorandum or any amendment to it was not sent or delivered prior to or
at the same time as the purchaser enters into an agreement to purchase the securities, as required by Section 80.1 of the Saskatchewan Act.
The rights of action for damages or rescission under the Saskatchewan Act are in addition to and do not derogate from any other right which a purchaser may have at law.
Section 147 of the Saskatchewan Act provides that no action shall be commenced to enforce any of the foregoing rights more than:
(a) in the case of an action for rescission, 180 days after the date of the transaction that gave rise to the cause of action; or
(b) in the case of any other action, other than an action for rescission, the earlier of:
(i) one year after the plaintiff first had knowledge of the facts giving rise to the cause of action; and
(ii) six years after the date of the transaction that gave rise to the cause of action.
The Saskatchewan Act also provides a purchaser who has received an amended offering memorandum delivered in accordance with subsection 80.1(3) of the Saskatchewan Act with a right to withdraw from the
agreement to purchase the securities by delivering a notice to the person who or company that is selling the securities, indicating the purchaser’s intention not to be bound by the purchase agreement, provided such
notice is delivered by the purchaser within two business days of receiving the amended offering memorandum.
July 2020 28You can also read